mc kinsey indian states & cities in 2025
TRANSCRIPT

India’s economic geography in 2025: states, clusters and cities
Submitted by:Neeraj sharma08980094342


2. Understanding economicgrowth in India’s states
This chapter provides a perspective on how states are likely to evolve and contribute to India’s GDP in the base case economic growth scenario
And where we are likely to see the most rapid growth in various consumer classes.
States were analyzed across three dimensions to understand their economic evolution and assess their future potential

How States Grouped
States are classified into four broad groups, based on their per capita GDP in 2012 Very high performing states - The
performance of four city-states- Chandigarh, Delhi, Goa and Pondicherry – was more than twice the national average in 2012
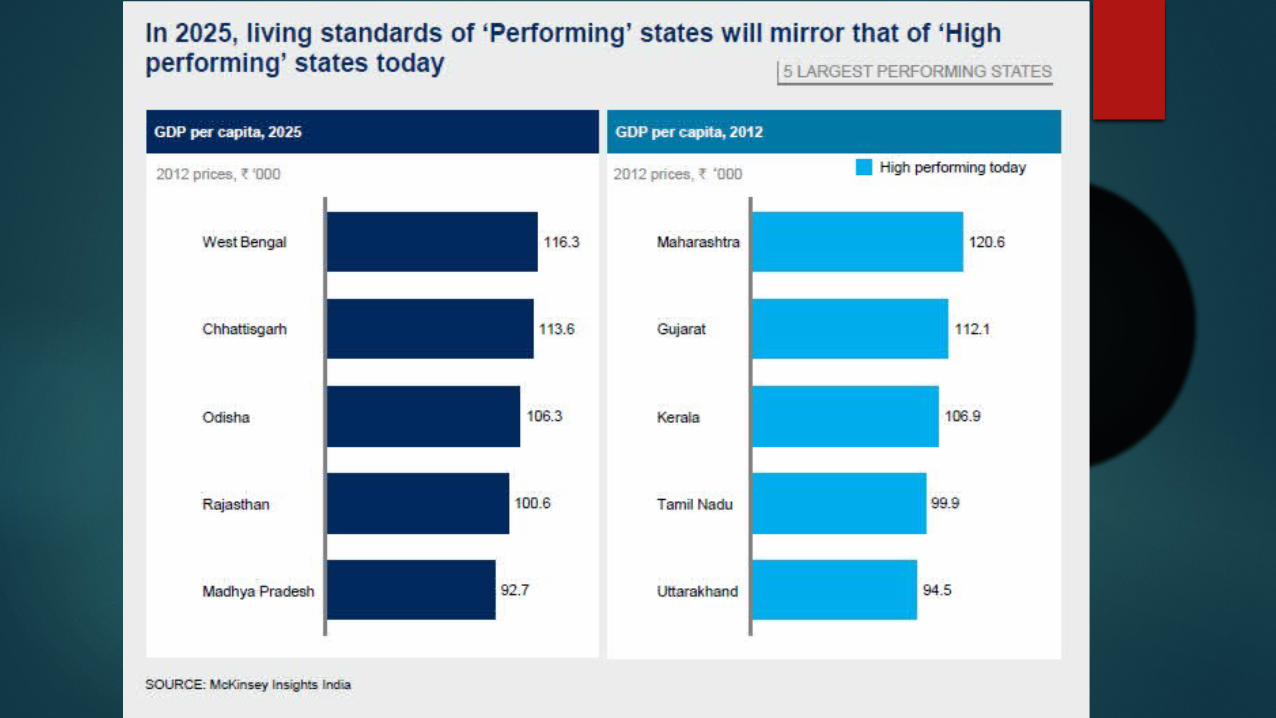
High performing states, the eight states-Gujarat, Haryana, Himachal Pradesh, Kerala, Maharashtra, Punjab, Tamil Nadu and Uttarakhand – was between 1.2 and 2 times that of India’s average.
Another twelve states are called ‘Performing’ states, with per capita GDP between0.7 and 1.2 times India’s average.
The rest, with GDP per capita less than 0.7 times that of India’s, are termed as ‘Low performing’ states
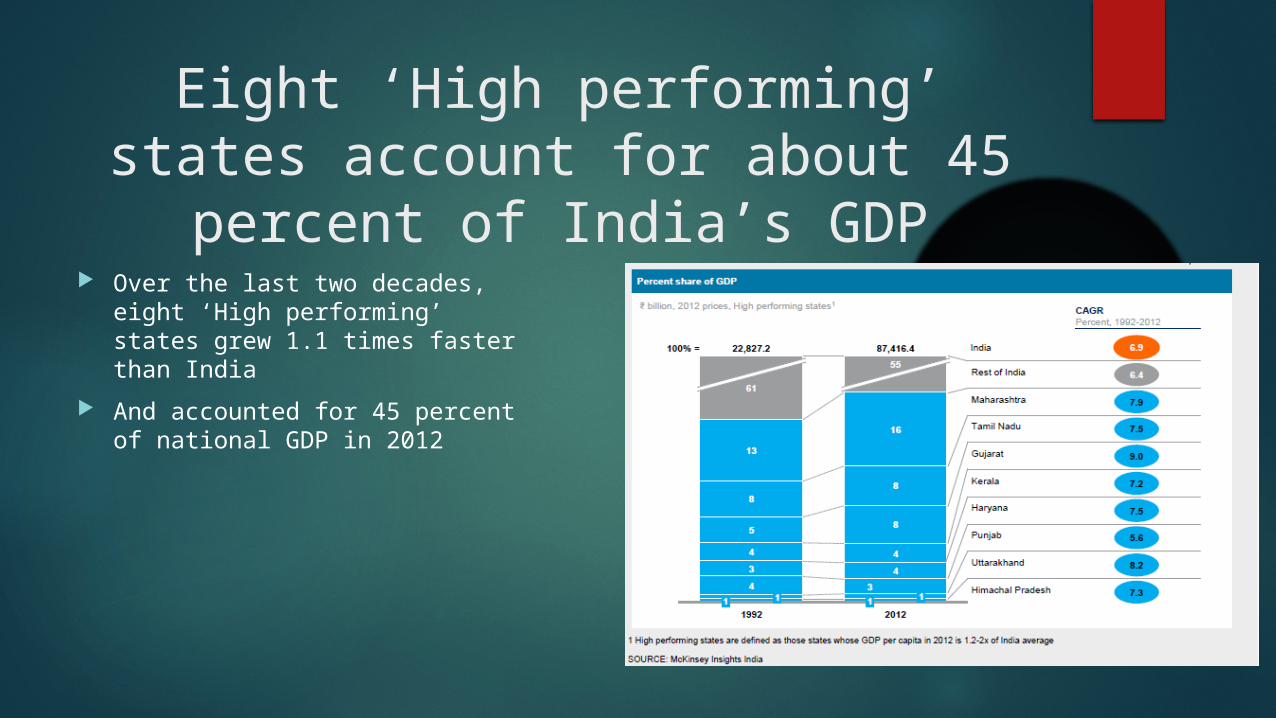
Eight ‘High performing’ states account for about 45 percent of
India’s GDP Over the last two decades, eight
‘High performing’ states grew 1.1 times faster than India
And accounted for 45 percent of national GDP in 2012

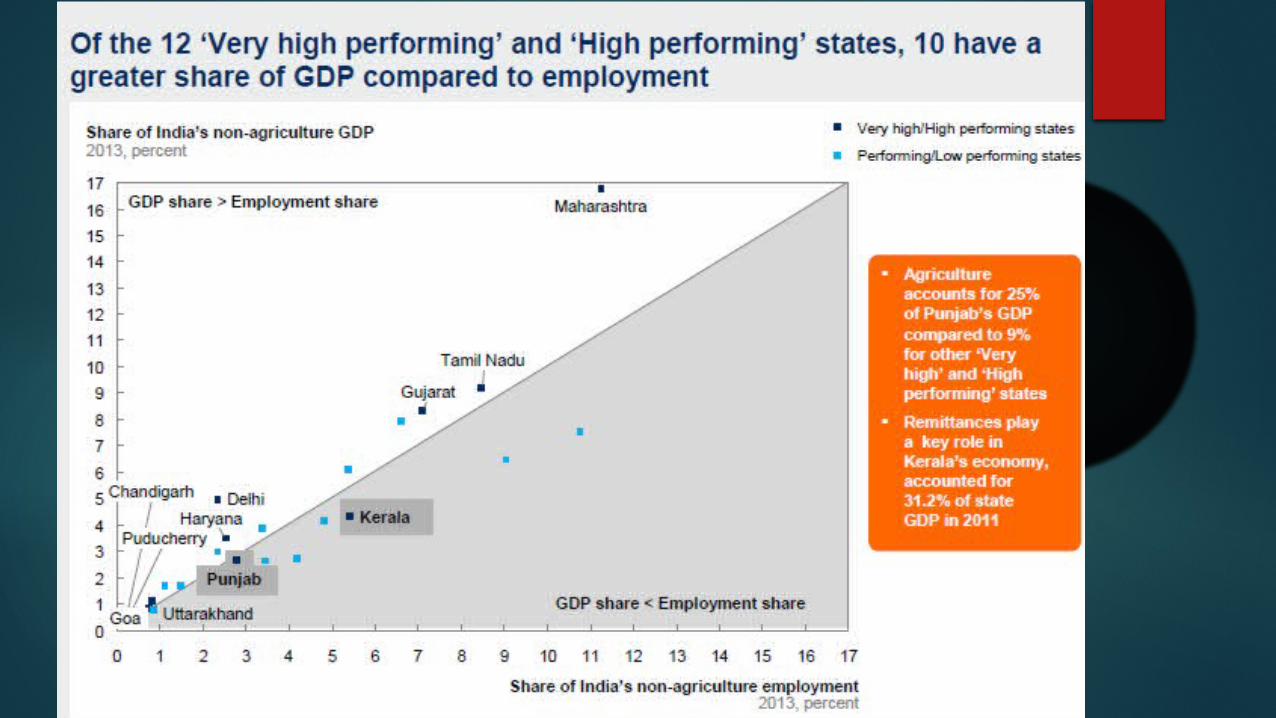
‘Very high performing’ and ‘High performing’ states are significantly advantaged on key parameters

High performing states: building on structural advantages
Gujarat – Multiple growth engines, led by manufacturing Gujarat’s GDP grew at 10.2 percent per year from 2002 to2012 while that of India grew at 7.7 percent during this time.
Gujarat’s manufacturing sector contributed 31 percent to the state’s GDP in 2010, comparable to that of China in 2000
The state’s agricultural GDP growth rate increased 2%/year in the 1980s and 1990s to 6%/year2000 to 2013. Tourist inflow has increased by 14 million, from 8 million in 2003
to 22 million in 2012
CONT…
Tamil Nadu – Strong services sector and knowledge-intensiveindustries
Tamil Nadu has consistently grown faster than India: its per capita GDP was 0.9 times that of India in 1980 and rose to 1.3 times by 2013
Chennai is India‘s biggest automotive cluster today accounting for about 30 percent of all automotive manufacturing in the country
Tamil Nadu’s banking business services and communications sectors as a group have grown at over 13 percent per year in the period from 2005 to 2014

Post 2008, Bihar and Madhya Pradesh have been on a path of convergence propelled by strong governance and focus on economic reforms
Bihar: Setting the house in order From 2005 to 2014 its GDP grew at
9.5% annually, compared to 7.5% for India as a whole
Bihar grew its highway network by some 25 percent between 2007 and 2010, these infrastructure initiatives enabled the construction sector to grow by more than 20 percent per year

Cont..
Madhya Pradesh: Broad-based reforms and investment Agricultural GDP growing by 10 percent each year between 2005
to 2014, much higher than its historical annualized growth rate of 2.3 percent from 1995 to 2004
The state invested in bringing more land under irrigation, which rose from 7 lakh hectares in 2004-05 to 21 lakh hectares in 2011-12.
Resulted in, power sector in MP grew at the rate of approximately 14 percent per year between 2008 and 2013, compared to about 5 percent for India as a whole
MP also implemented a concerted thrust on tourism


Thank You