mcb140 01-31-07 1 bridges muller morgan sturtevant the fly room, columbia university ca. 1919
Post on 18-Dec-2015
220 views
TRANSCRIPT
MCB140 01-31-07 1
BridgesMuller
Morgan
Sturtevant
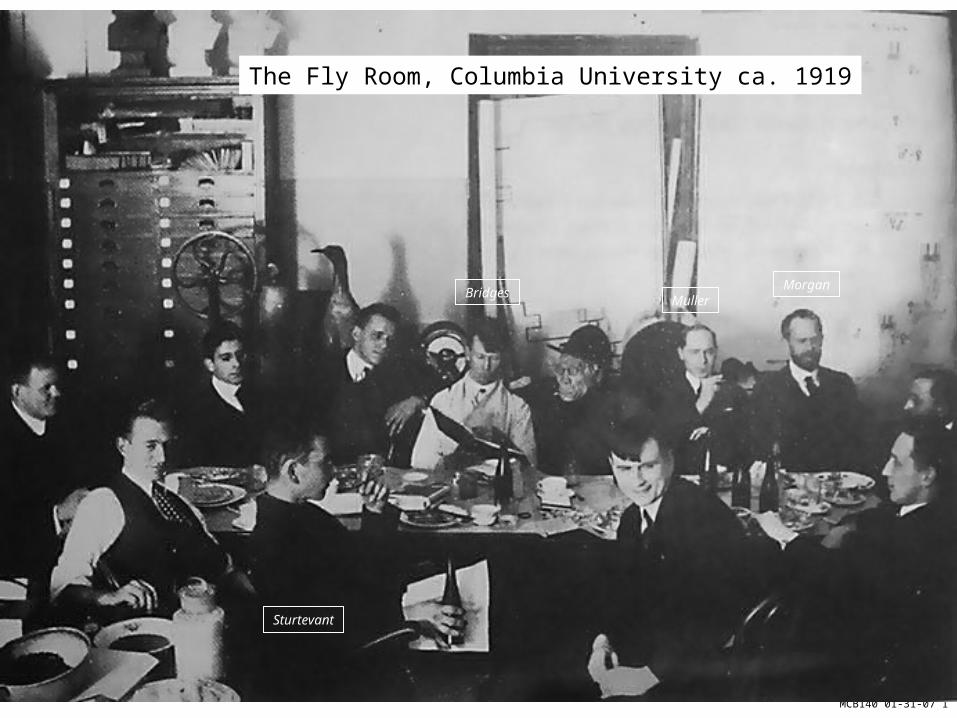
The Fly Room, Columbia University ca. 1919
MCB140 01-31-07 2
MCB140 01-31-07 3
Correlation between cytological and genetic phenomena as a discovery tool1. Boveri (1880) – nuclear transplantation in sea urchins;
early development in triploid sea urchins.2. Sutton (1900) – chromosome dynamics in
grasshoppers and Mendel’s laws (note: strictly speaking, Sutton should have looked at chromosome dynamics in the pea, Pisum sativum, but whatEVERRR).
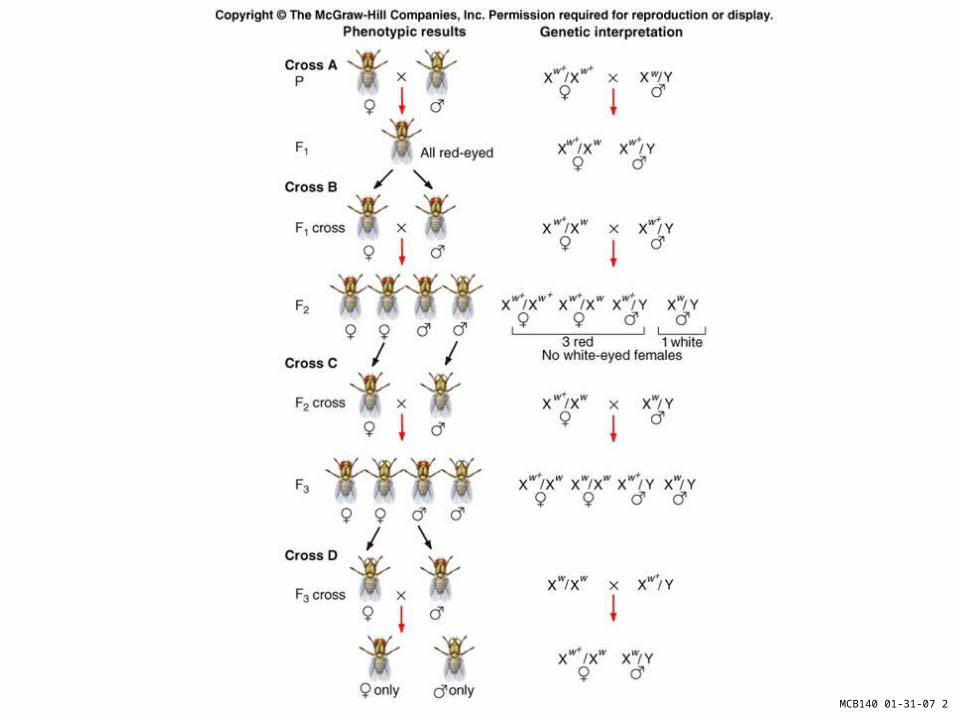
3. Morgan (1910) – correlation between the inheritance of white and the sex chromosomes.
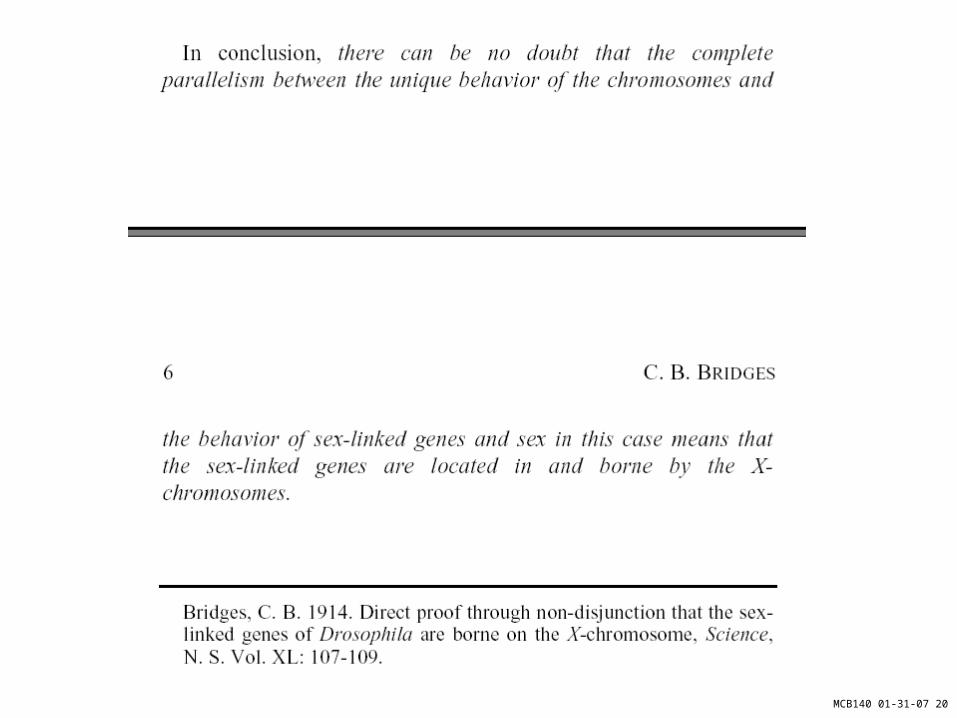
4. Bridges (1915) – “the exceptional female,” nondisjunction, and firm evidence for the chromosome “theory” of inheritance.
5. McClintock, Stern (1930) – creation of novel genotypes by meiosis via homologous recombination correlates with creation of novel karyotypes via crossingover between nonsister homologs.
MCB140 01-31-07 4
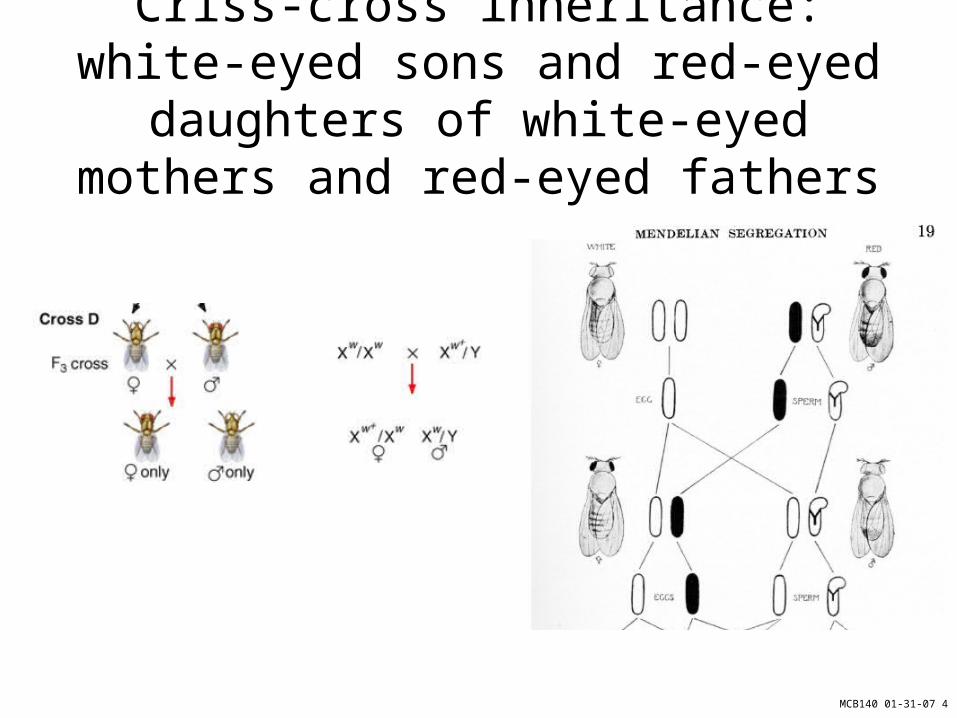
Criss-cross inheritance: white-eyed sons and red-eyed daughters of white-
eyed mothers and red-eyed fathers

MCB140 01-31-07 5
Calvin Bridges
… “raised by his grandparents in upstate New York, both of his parents dying young. He was a talented student buit his grandparents were poor and Bridges had to make do with clothing that was constantly mended. He was too ashamed to go to social activities in high school because of his ragged appearance. He received a scholarship to attend Columbia University, but he had to support himself with part-time work. Bridges took the same introductory biology course as Sturtevant, and Morgan, who learned of Bridges’ circumstances, asked him to be a part-time bottle-washer and food preparator for the fly work that was gaining momentum in Morgan’s laboratory.” Carlson Mendel’s Legacy
MCB140 01-31-07 6
vermilion
“… Bridges’ circumstances changed approximately a year after he began working for Morgan. He showed Morgan a bottle that contained a fly whose eye color seemed to be brighter than usual. Morgan isolated the fly, showed that it carried another X-linked trait, and called that trait vermilion. He also assigned Bridges to a desk and told him to look for more mutations.”
MCB140 01-31-07 7
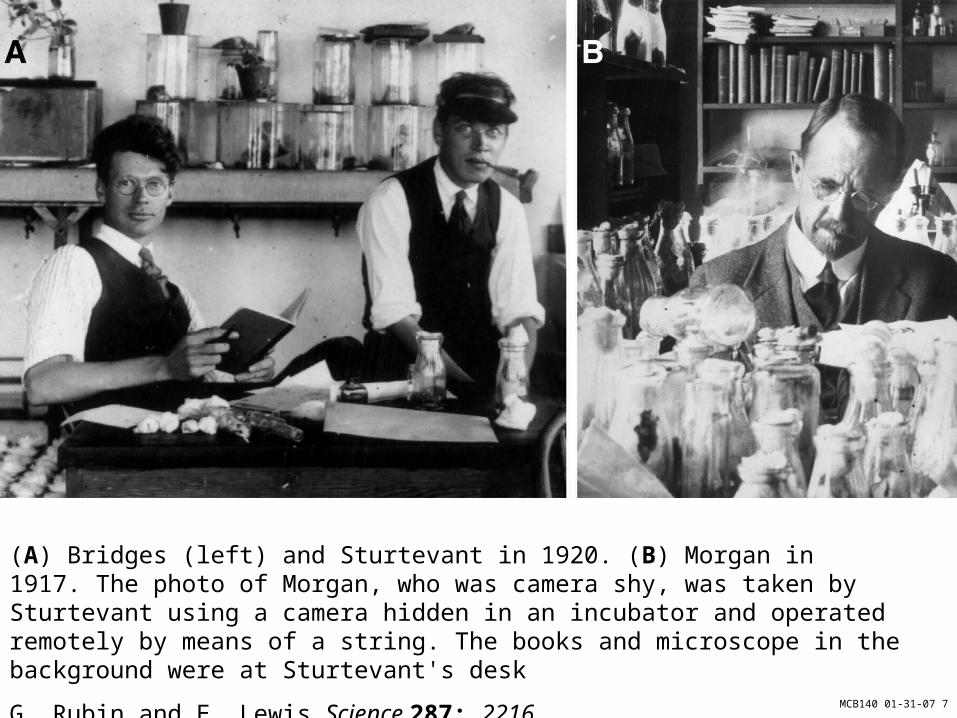
(A) Bridges (left) and Sturtevant in 1920. (B) Morgan in 1917. The photo of Morgan, who was camera shy, was taken by Sturtevant using a camera hidden in an incubator and operated remotely by means of a string. The books and microscope in the background were at Sturtevant's desk
G. Rubin and E. Lewis Science 287: 2216.
MCB140 01-31-07 8
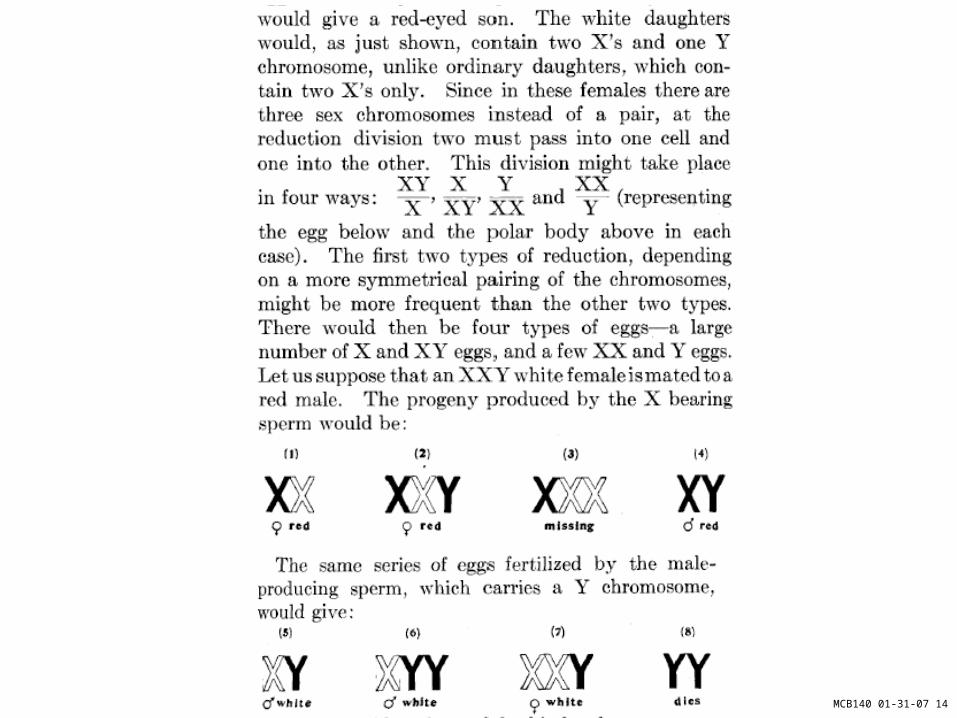
Required reading
Everything to do with Fig. 5.21.
Pp. 149-154 of Ch. VI in Morgan et al The Mechanism of Mendelian Heredity
Problems 4.32 and 4.34
Everything to do with Fig. 14.32.
MCB140 01-31-07 9
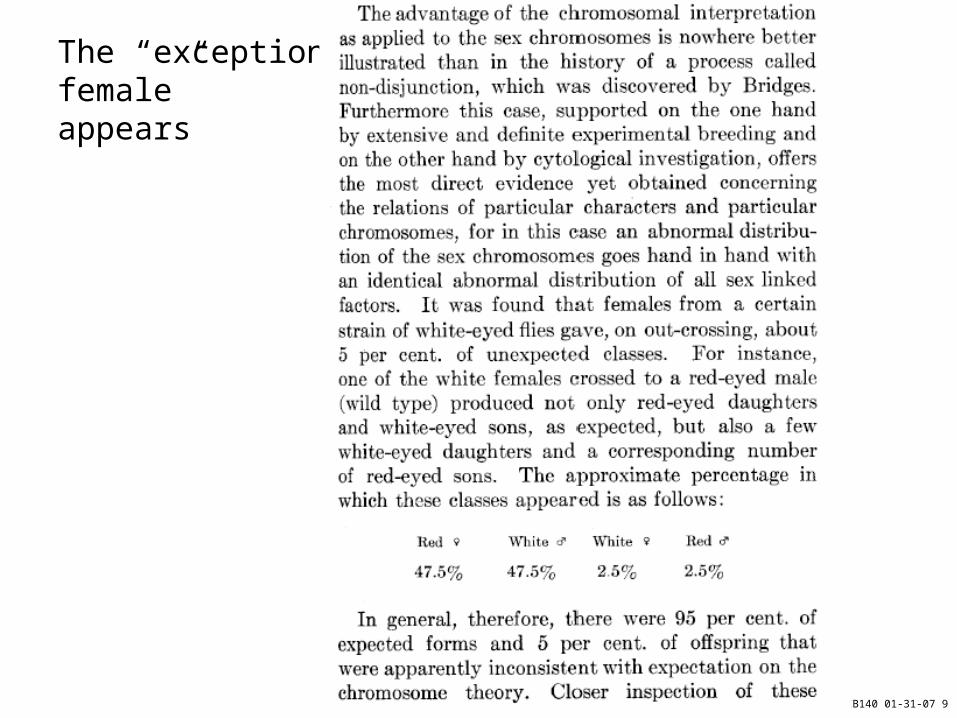
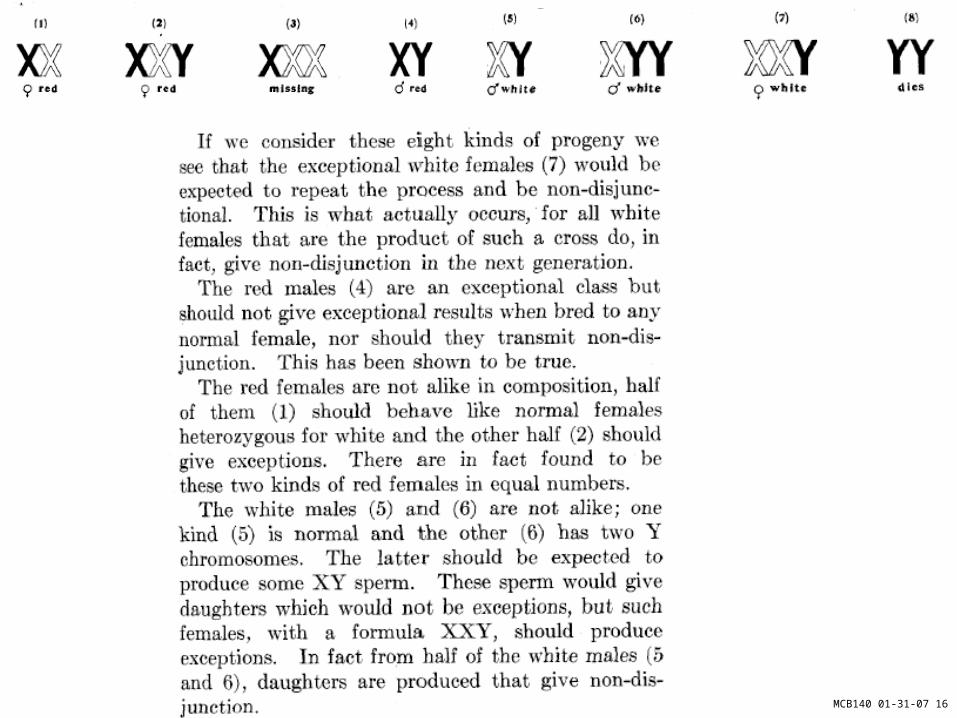
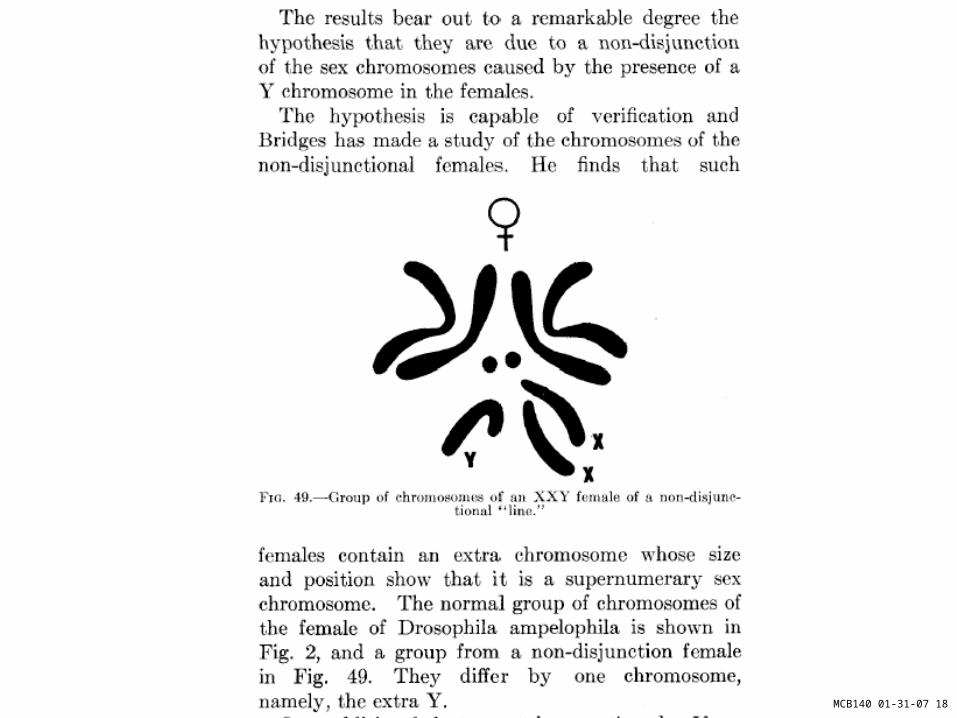
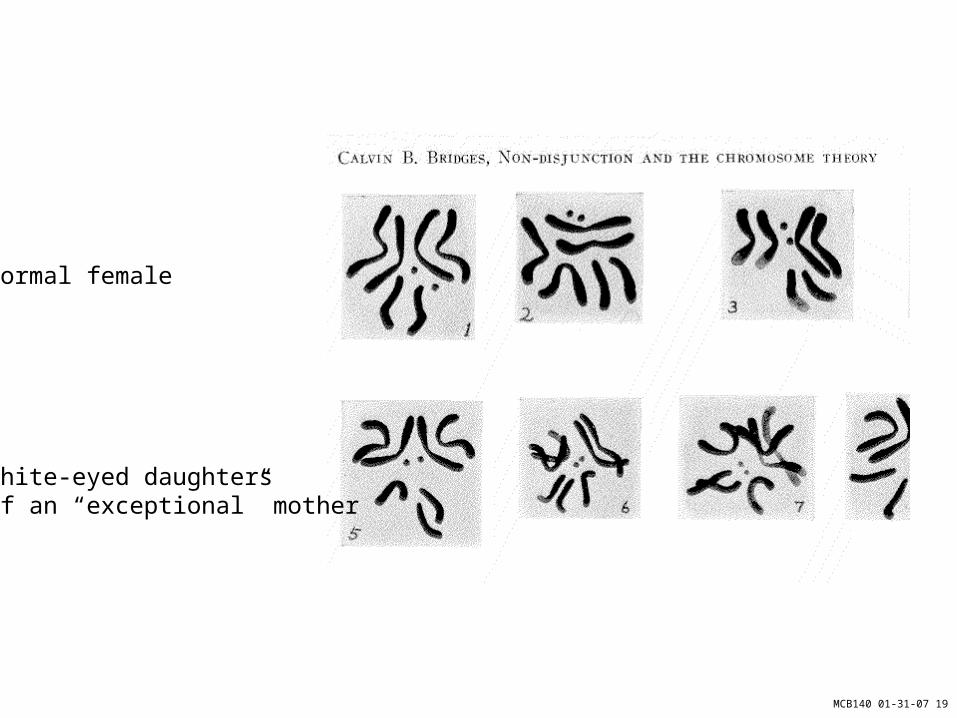
The “exceptional female” appears
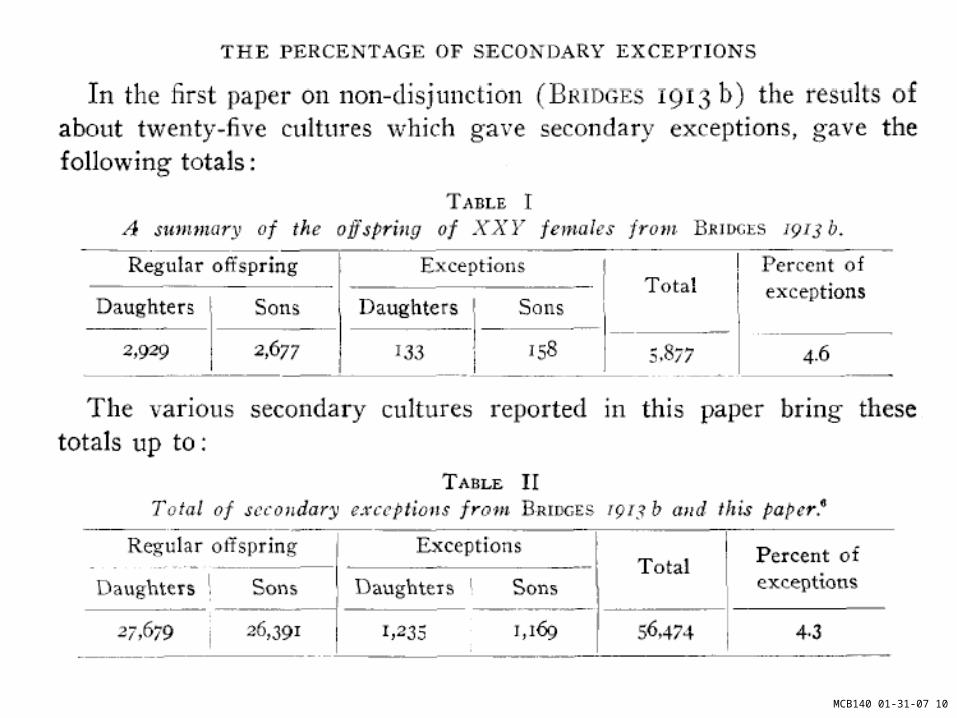
MCB140 01-31-07 10

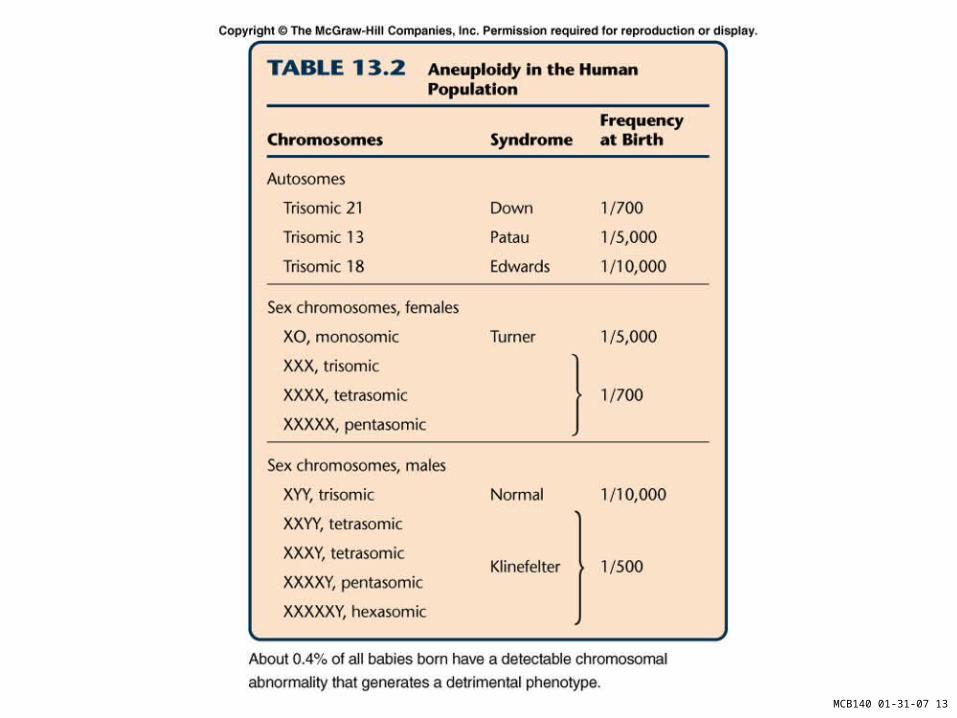
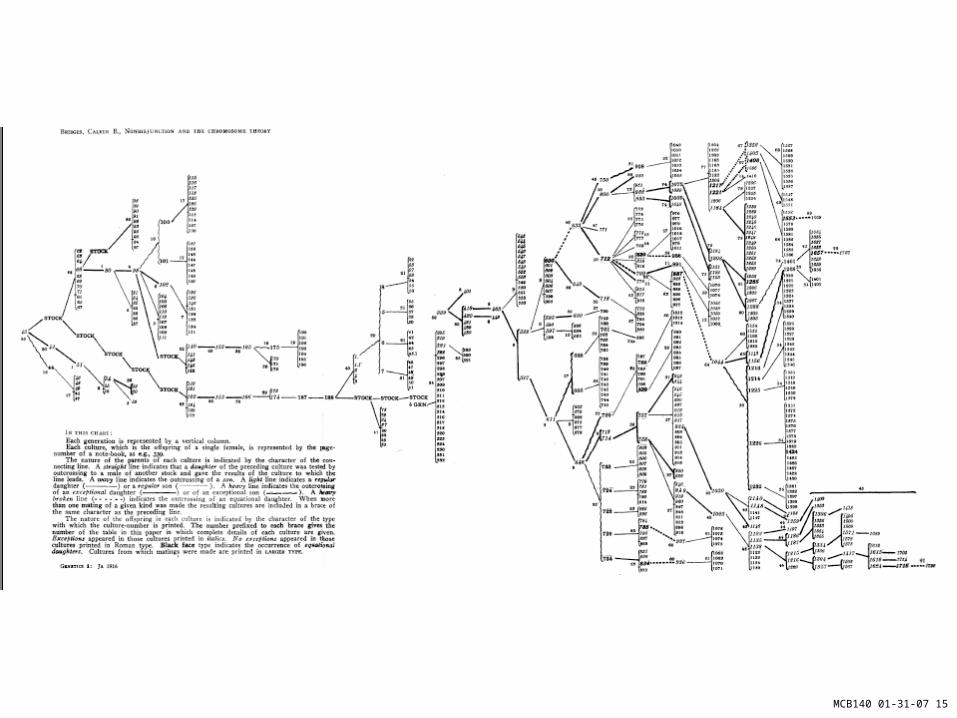
MCB140 01-31-07 11Fig. 13.28
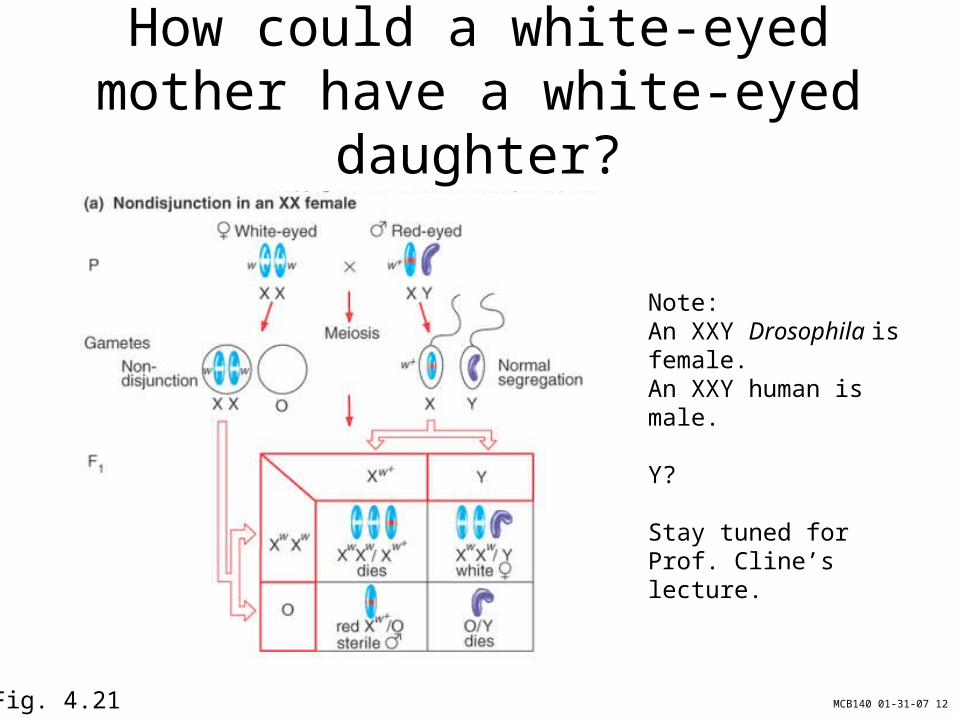
MCB140 01-31-07 12Fig. 4.21
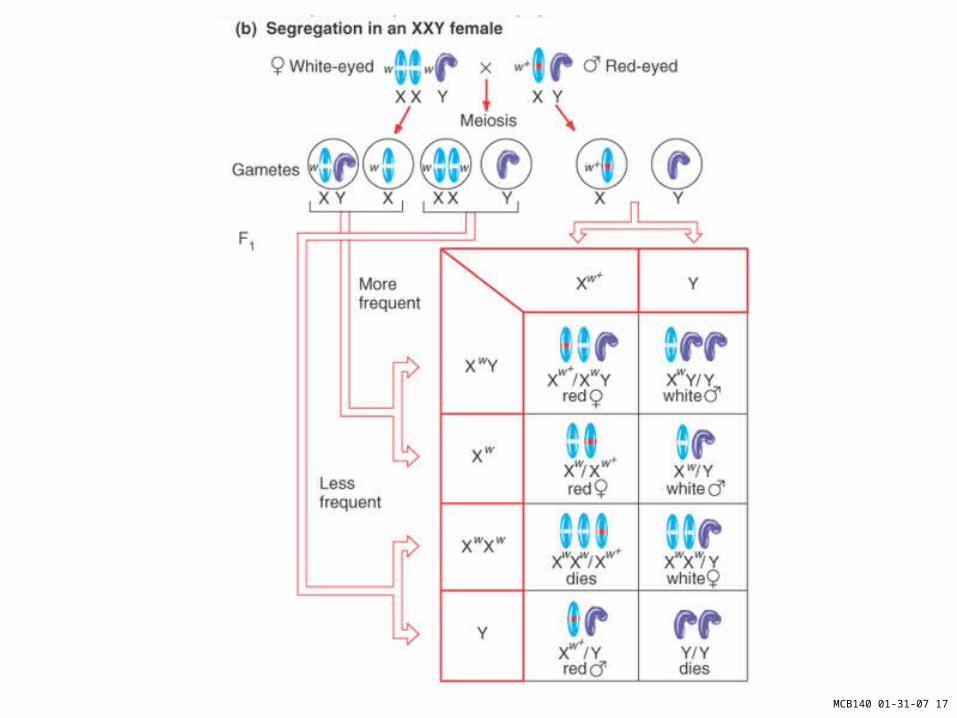
How could a white-eyed mother have a white-eyed daughter?
Note:An XXY Drosophila is female.An XXY human is male.
Y?
Stay tuned for Prof. Cline’s lecture.
MCB140 01-31-07 13
MCB140 01-31-07 14
MCB140 01-31-07 15
MCB140 01-31-07 16
MCB140 01-31-07 17
MCB140 01-31-07 18
MCB140 01-31-07 19
Normal female
White-eyed daughtersof an “exceptional” mother
MCB140 01-31-07 20
MCB140 01-31-07 21
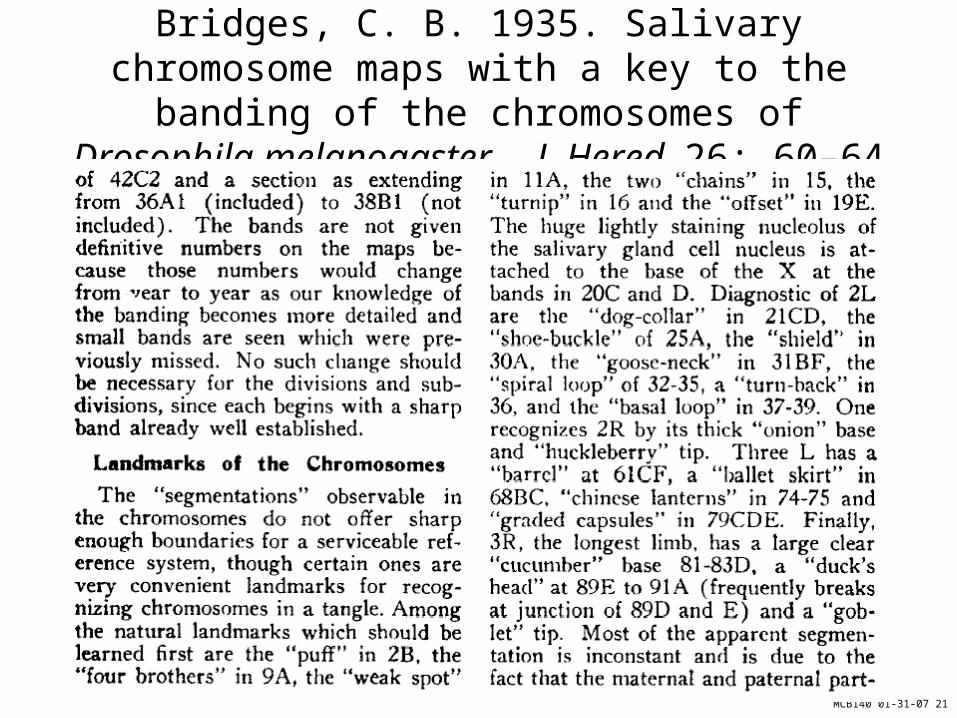
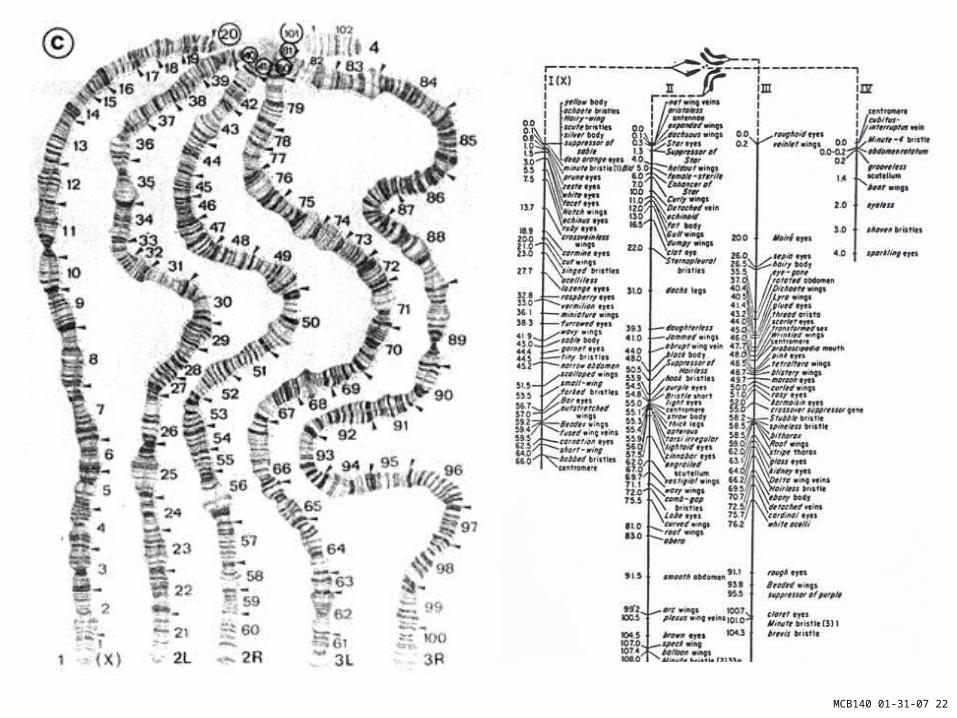
Bridges, C. B. 1935. Salivary chromosome maps with a key to the banding of the chromosomes of Drosophila melanogaster. J. Hered. 26: 60–64
MCB140 01-31-07 22
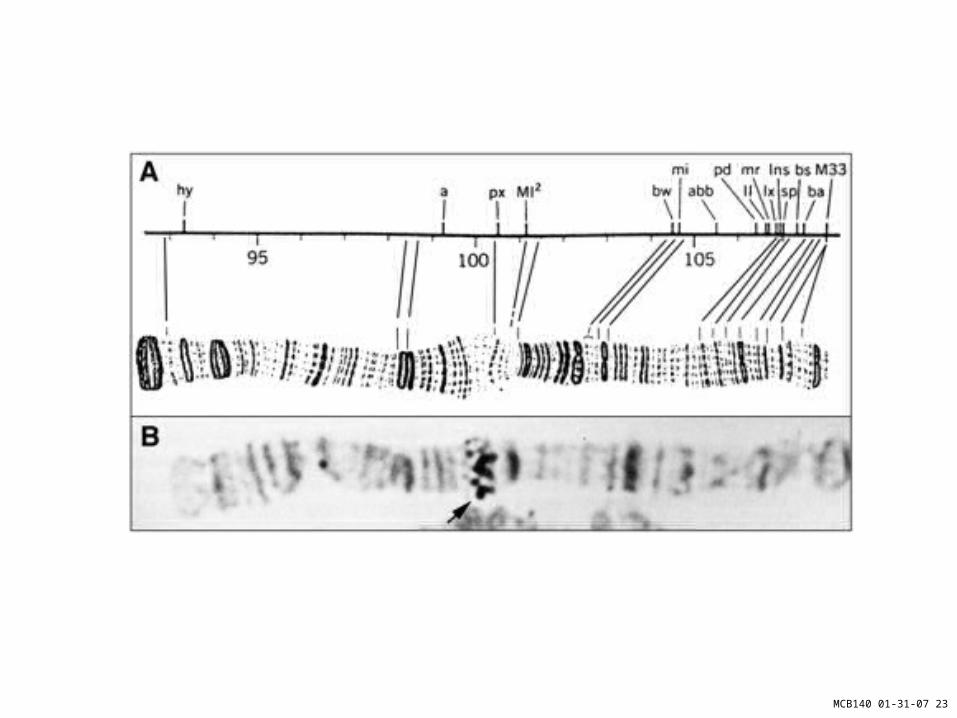
MCB140 01-31-07 23
MCB140 01-31-07 24
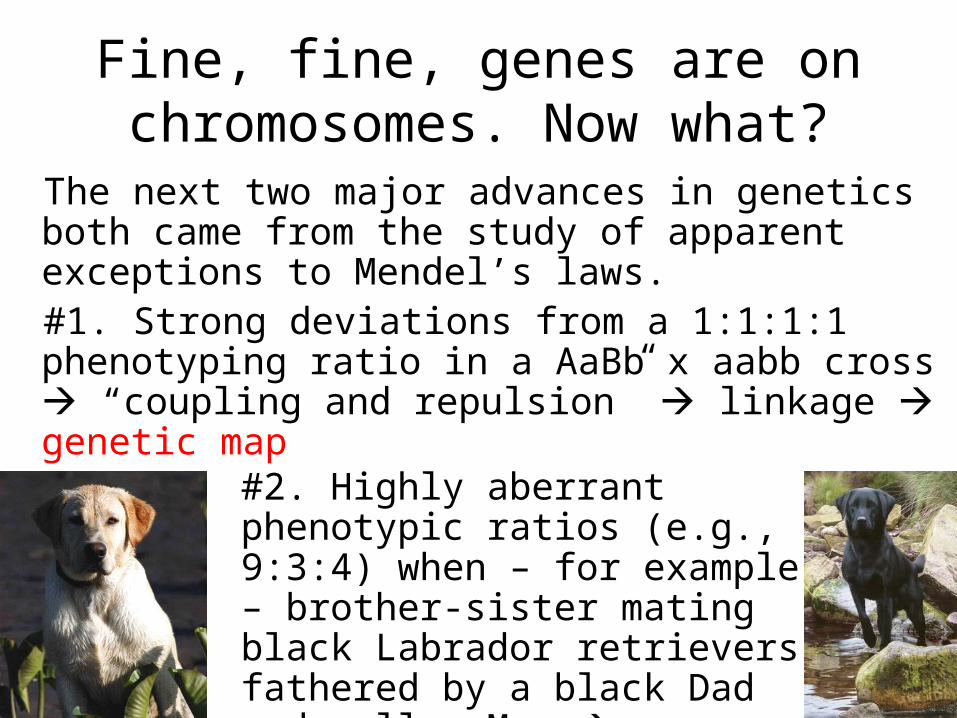
Fine, fine, genes are on chromosomes. Now what?
The next two major advances in genetics both came from the study of apparent exceptions to Mendel’s laws.#1. Strong deviations from a 1:1:1:1 phenotyping ratio in a AaBb x aabb cross “coupling and repulsion” linkage genetic map
#2. Highly aberrant phenotypic ratios (e.g., 9:3:4) when – for example – brother-sister mating black Labrador retrievers fathered by a black Dad and yellow Mom epistasis

MCB140 01-31-07 25
Hmmmmm
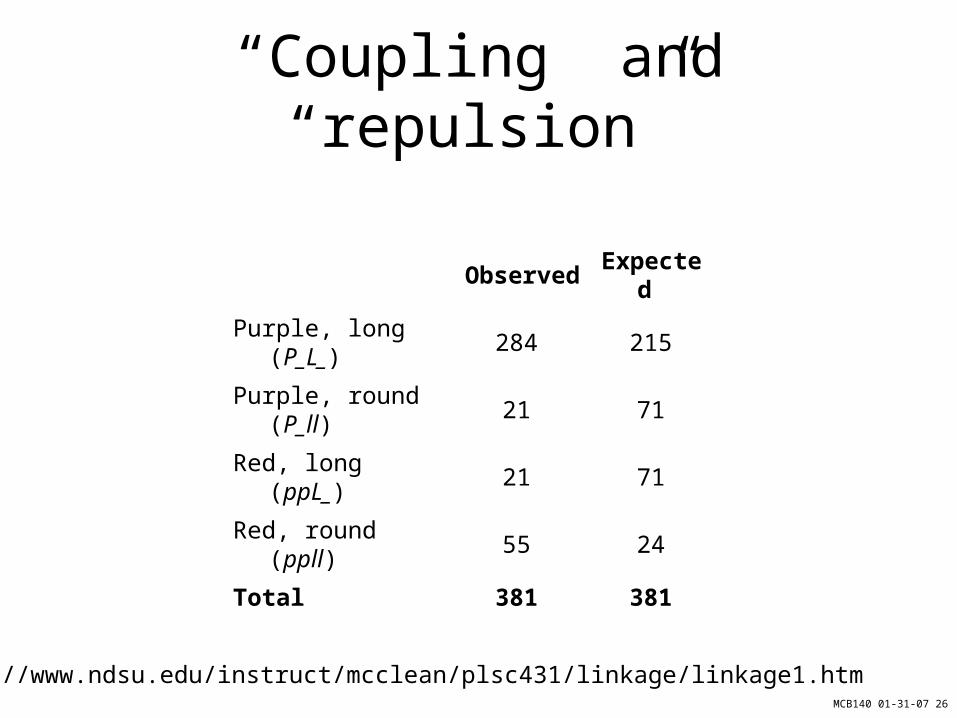
“It was not long from the time that Mendel's work was rediscovered that new anomalous ratio began appearing. One such experiment was performed by Bateson and Punnett with sweet peas. They performed a typical dihybrid cross between one pure line with purple flowers and long pollen grains and a second pure line with red flowers and round pollen grains. Because they knew that purple flowers and long pollen grains were both dominant, they expected a typical 9:3:3:1 ratio when the F1 plants were crossed. The table shows the ratios that they observed. Specifically, the two parental classes, purple, long and red, round, were overrepresented in the progeny.”
http://www.ndsu.edu/instruct/mcclean/plsc431/linkage/linkage1.htm
MCB140 01-31-07 26
Observed Expected
Purple, long (P_L_) 284 215
Purple, round (P_ll) 21 71
Red, long (ppL_) 21 71
Red, round (ppll) 55 24
Total 381 381
http://www.ndsu.edu/instruct/mcclean/plsc431/linkage/linkage1.htm
“Coupling” and “repulsion”
MCB140 01-31-07 27
MCB140 01-31-07 28
Two separate issues
1. How do we know there’s a problem? Is this really a deviation from 9:3:3:1, or should they look at more seeds?
2. If there really is a deviation, how can one explain it?
MCB140 01-31-07 29
GINA, aGAINNature Genetics - 39, 133 (2007)
Legislation to prevent genetic discrimination in employment and insurance decisions is essential so that individuals can make use of existing genetic tests to manage their own health decisions. This legislation is also imperative to protect those who volunteer for genetic research that will benefit others affected by common diseases.
MCB140 01-31-07 30
The Genetic Information Nondiscrimination Act (GINA), legislation to prevent the use of genetic information in employment and insurance decisions, has been introduced six times in various forms to the US Congress over the last 12 years and has been unanimously passed twice by the US Senate, but not by the House of Representatives. Proponents of the Act have a fresh opportunity with the newly elected 110th Congress. GINA.
The legislation is essential if human genetic research is to continue with full public support and deliver the anticipated health benefits that underpin much of its funding. Most crucially, the human genome belongs to the whole human race, leading to the essential "principle of genetic solidarity and altruism" so aptly described by the UK Human Genetics Commission in their 2002 report on the use of personal genetic data, entitled "Inside Information" (http://www.hgc.gov.uk). In essence, 'I get myself tested so that my results may help another affected by my disease or disease predispositions. Consequently, I will not get myself tested if it results in the loss of my (or even your) job, mortgage or health insurance. Under these circumstances, I will not be enthusiastic about blue-sky research.' These arguments, among many others, were persuasive in extending the existing UK moratorium, created in agreement with the Association of British Insurers, that prohibits the use of predictive genetic tests in insurance until at least November 1st, 2011.
MCB140 01-31-07 31
For the application of existing knowledge, the potential effects of genetic inequity are chilling.
According to GeneTests (http://www.genetests.org/), there are currently 1,054 clinical tests and 297 research tests for 1,351
diseases.
MCB140 01-31-07 32
Tests of significance
The χ2 test of
“goodness of fit”
(Karl Pearson)
MCB140 01-31-07 33
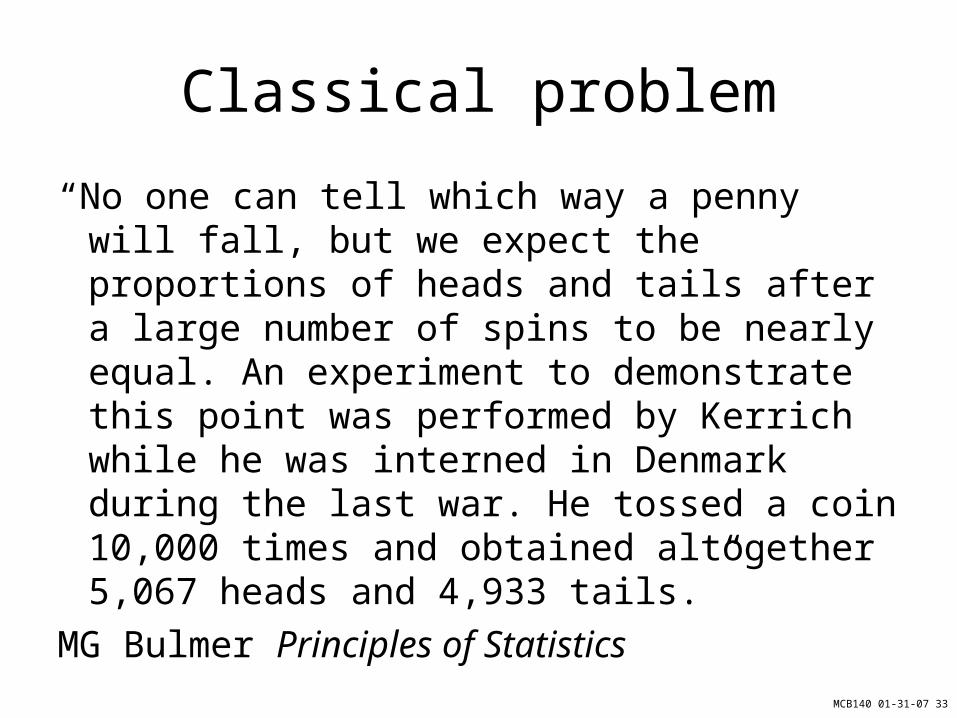
Classical problem
“No one can tell which way a penny will fall, but we expect the proportions of heads and tails after a large number of spins to be nearly equal. An experiment to demonstrate this point was performed by Kerrich while he was interned in Denmark during the last war. He tossed a coin 10,000 times and obtained altogether 5,067 heads and 4,933 tails.”
MG Bulmer Principles of Statistics
MCB140 01-31-07 34
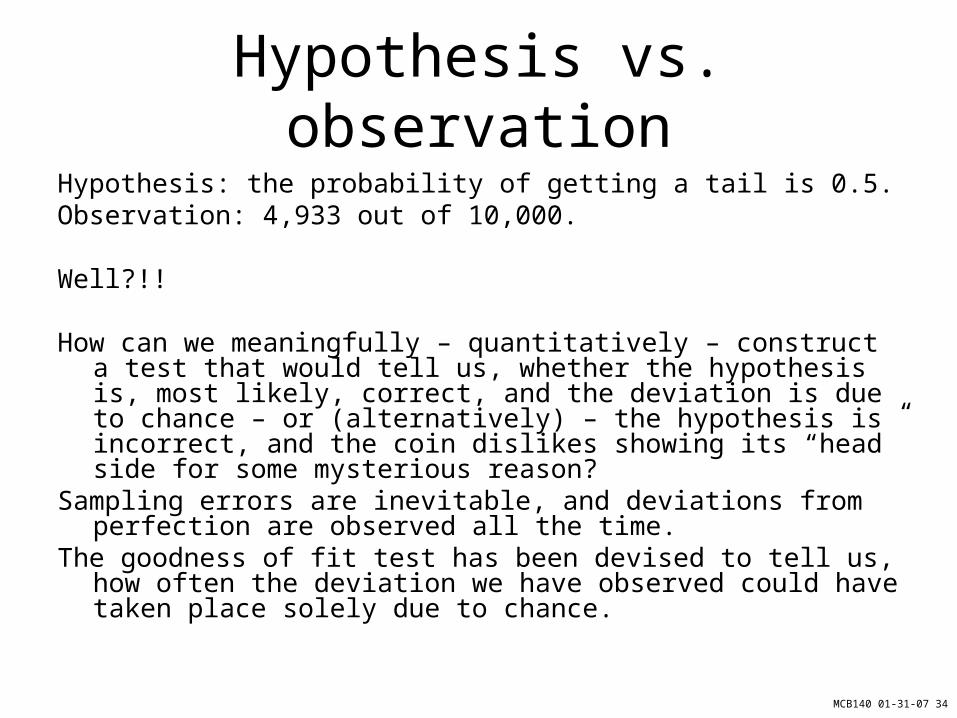
Hypothesis vs. observationHypothesis: the probability of getting a tail is 0.5.Observation: 4,933 out of 10,000.
Well?!!
How can we meaningfully – quantitatively – construct a test that would tell us, whether the hypothesis is, most likely, correct, and the deviation is due to chance – or (alternatively) – the hypothesis is incorrect, and the coin dislikes showing its “head” side for some mysterious reason?
Sampling errors are inevitable, and deviations from perfection are observed all the time.
The goodness of fit test has been devised to tell us, how often the deviation we have observed could have taken place solely due to chance.

MCB140 01-31-07 35
MCB140 01-31-07 36
22
( )O E
E
MCB140 01-31-07 37
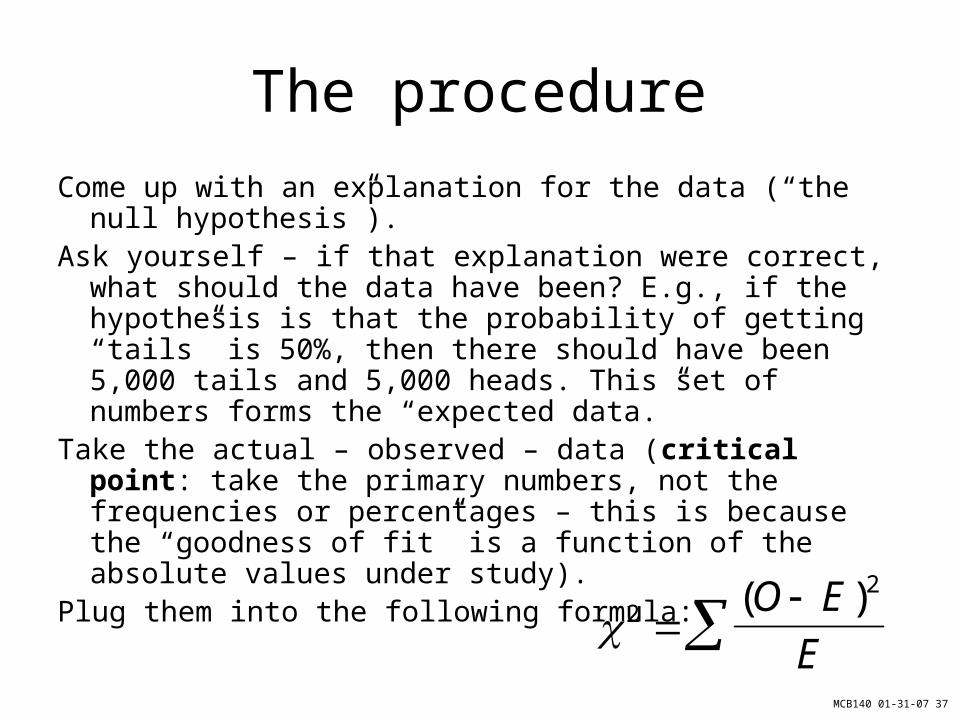
The procedure
Come up with an explanation for the data (“the null hypothesis”).
Ask yourself – if that explanation were correct, what should the data have been? E.g., if the hypothesis is that the probability of getting “tails” is 50%, then there should have been 5,000 tails and 5,000 heads. This set of numbers forms the “expected data.”
Take the actual – observed – data (critical point: take the primary numbers, not the frequencies or percentages – this is because the “goodness of fit” is a function of the absolute values under study).
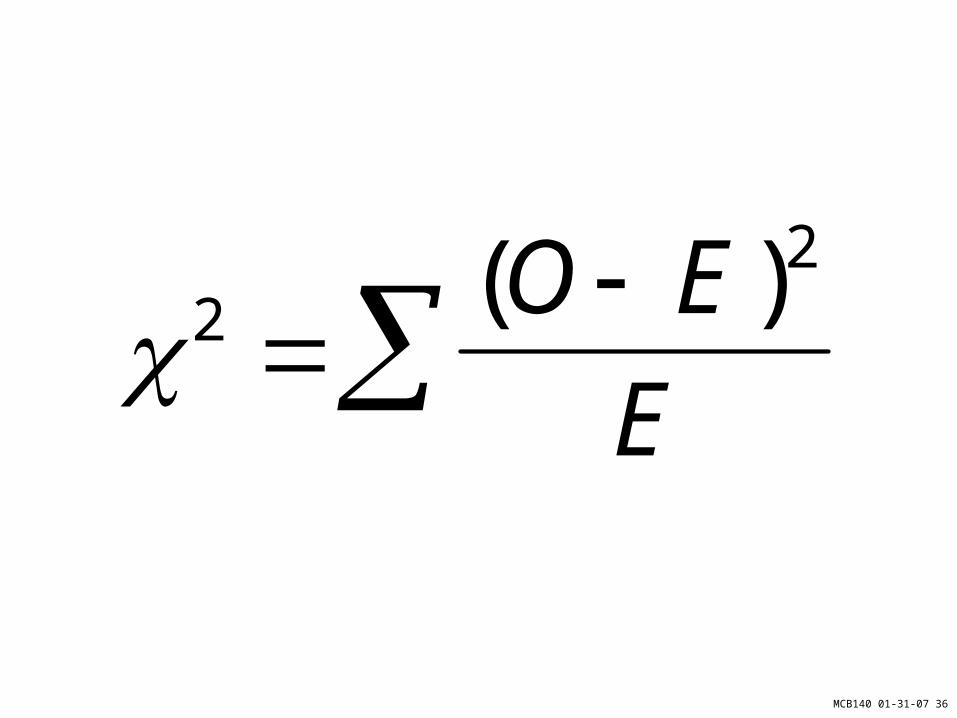
Plug them into the following formula: 2
2
( )O E
E
MCB140 01-31-07 38
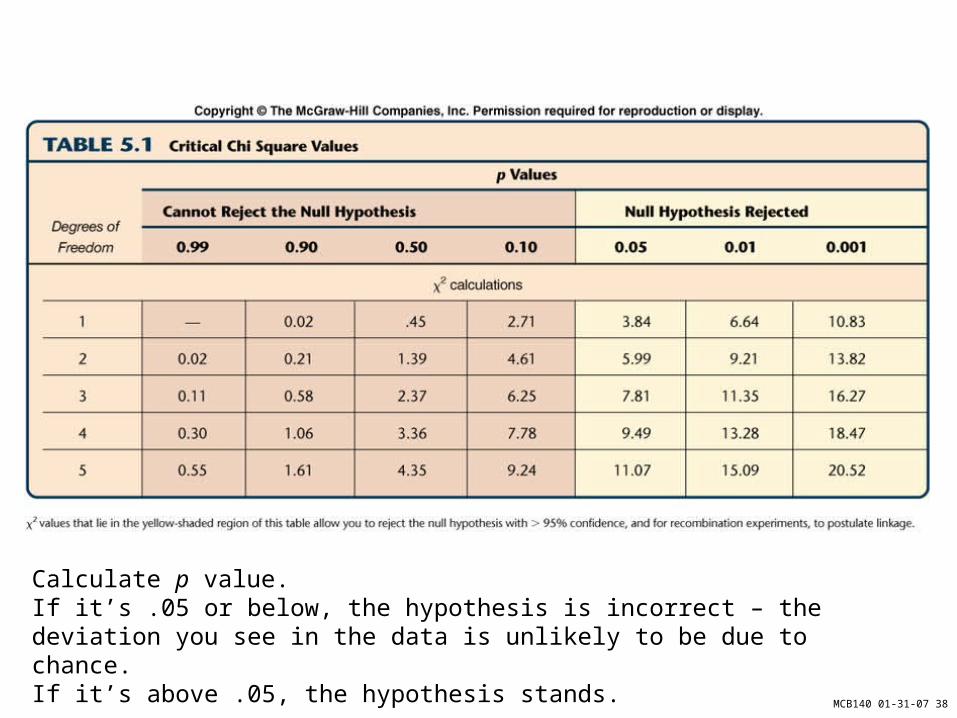
Calculate p value.If it’s .05 or below, the hypothesis is incorrect – the deviation you see in the data is unlikely to be due to chance.If it’s above .05, the hypothesis stands.
MCB140 01-31-07 39
SMI?
Take a pure-breeding agouti mouse and cross it to a pure-breeding white mouse. Get 16 children: all agouti (8 males, 8 females). Cross each male with one female (randomly).
Get 240 children in F2: 175 agouti and 65 white (ratio: 2.692).

MCB140 01-31-07 40
Calculating the chi square value
Let’s hypothesize that we are dealing with simple Mendelian inheritance (the null hypothesis). If this were true, then we would expect that the 240 children would have split: 180 agouti : 60 white.
For agouti mice:
(175-180)2/ 180=0.139 For white mice:
(65-60)2/ 60=0.417
sum ( ) of agouti and white = 0.139 + 0.417 = 0.556
MCB140 01-31-07 41
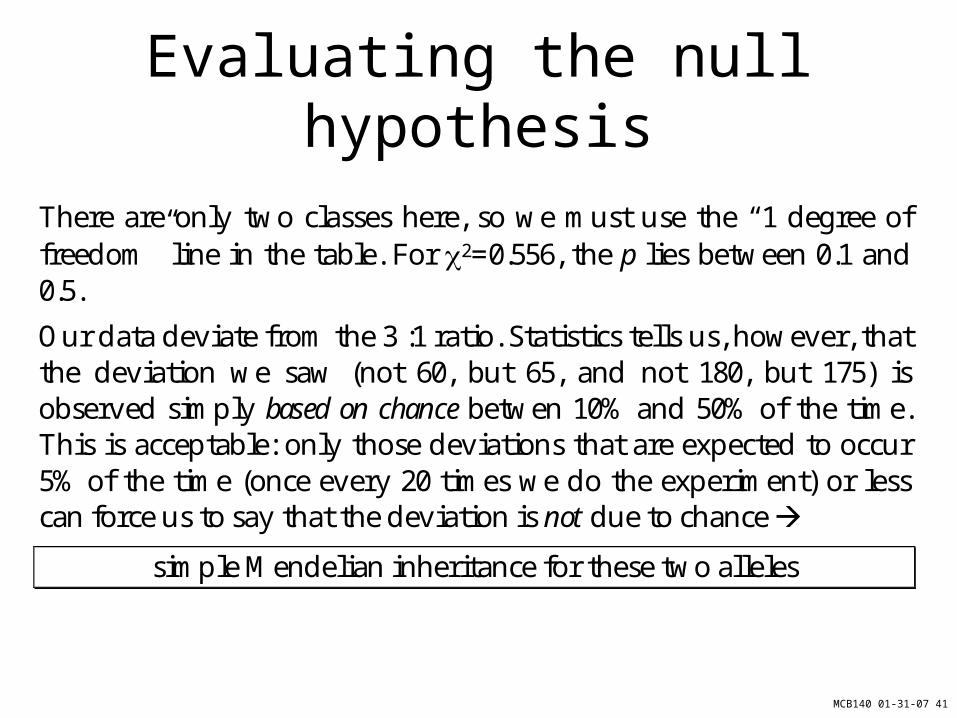
Evaluating the null hypothesis
There are only two classes here, so we must use the “1 degree of freedom” line in the table. For 2=0.556, the p lies between 0.1 and 0.5.
Our data deviate from the 3 :1 ratio. Statistics tells us, however, that the deviation we saw (not 60, but 65, and not 180, but 175) is observed simply based on chance betwen 10% and 50% of the time. This is acceptable: only those deviations that are expected to occur 5% of the time (once every 20 times we do the experiment) or less can force us to say that the deviation is not due to chance
simple Mendelian inheritance for these two alleles

MCB140 01-31-07 42
The complex story of hormone replacement therapy

MCB140 01-31-07 43
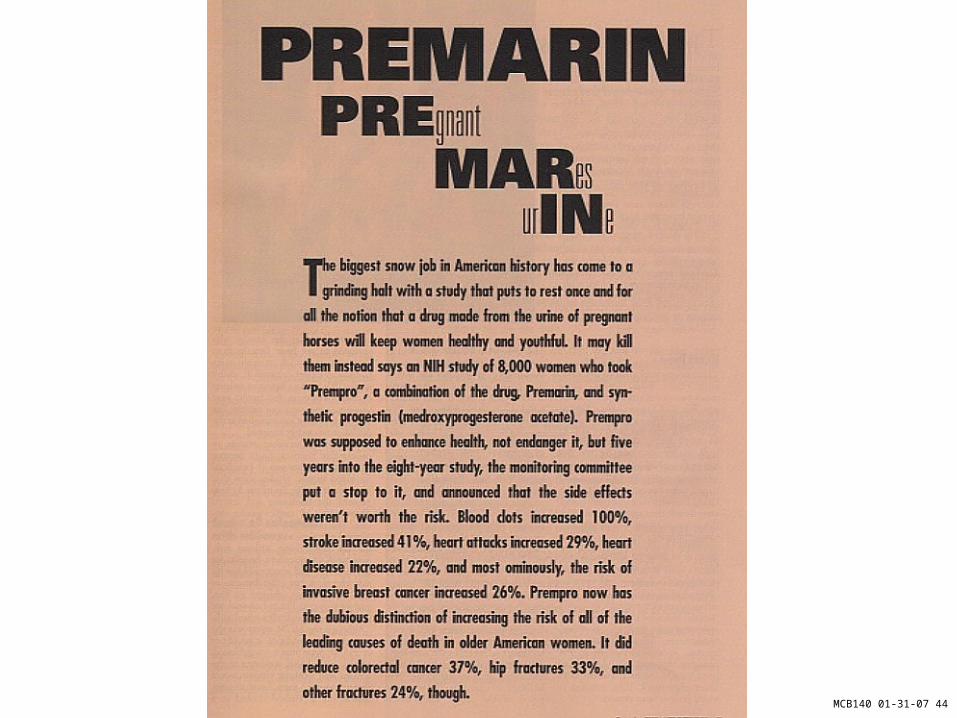
MCB140 01-31-07 44
MCB140 01-31-07 45
How to confuse relative risk with absolute risk
MCB140 01-31-07 46
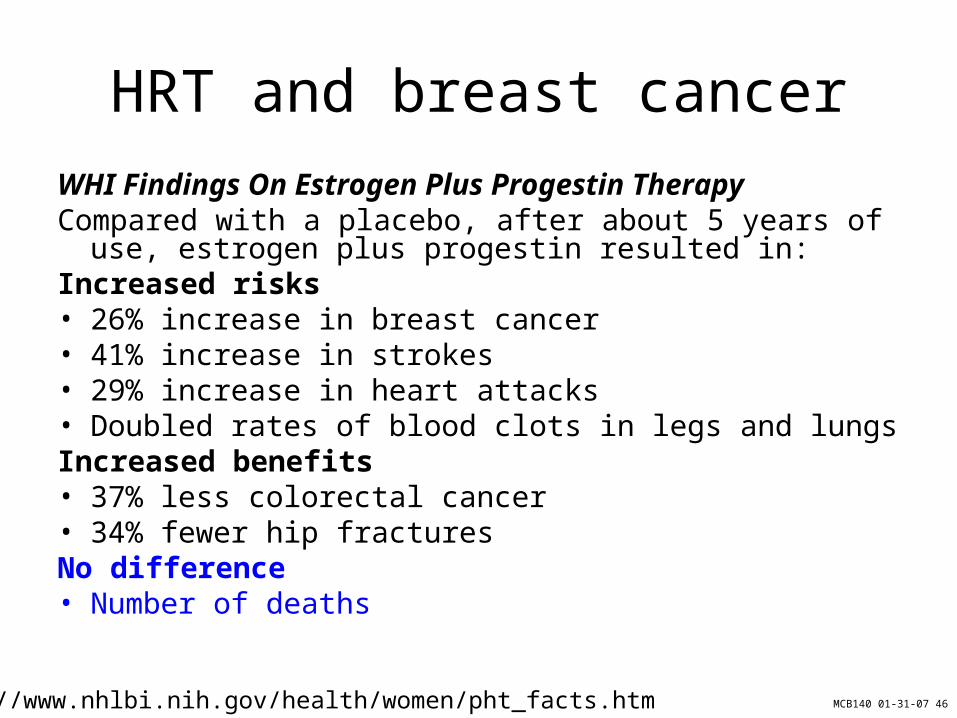
HRT and breast cancer
WHI Findings On Estrogen Plus Progestin TherapyCompared with a placebo, after about 5 years of use,
estrogen plus progestin resulted in: Increased risks • 26% increase in breast cancer • 41% increase in strokes • 29% increase in heart attacks • Doubled rates of blood clots in legs and lungs Increased benefits• 37% less colorectal cancer • 34% fewer hip fractures No difference • Number of deaths
http://www.nhlbi.nih.gov/health/women/pht_facts.htm
MCB140 01-31-07 47
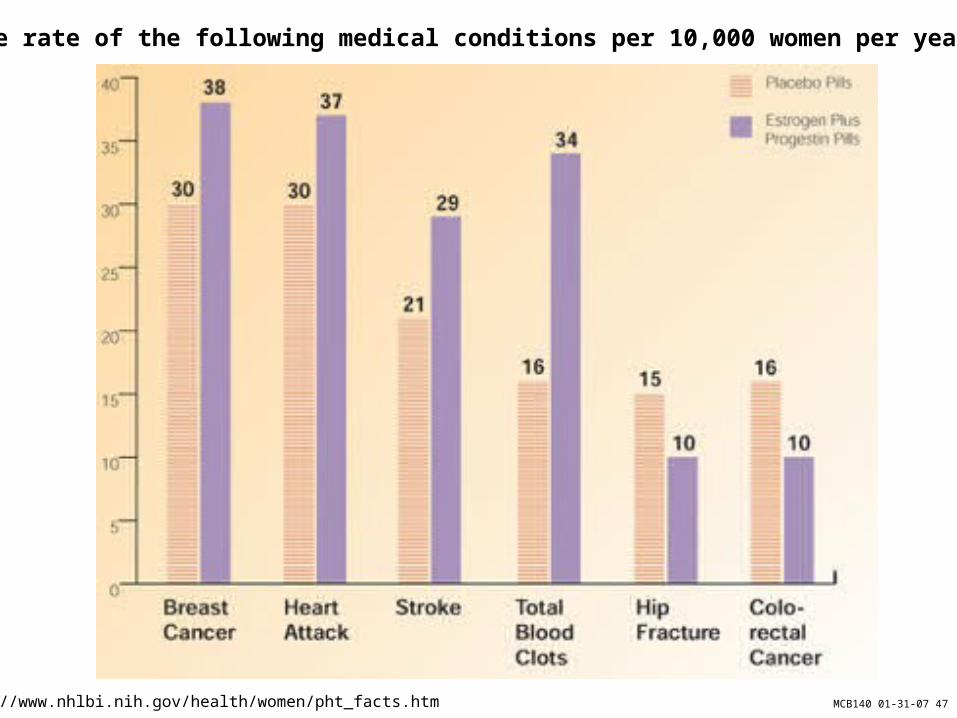
The rate of the following medical conditions per 10,000 women per year
http://www.nhlbi.nih.gov/health/women/pht_facts.htm
MCB140 01-31-07 48
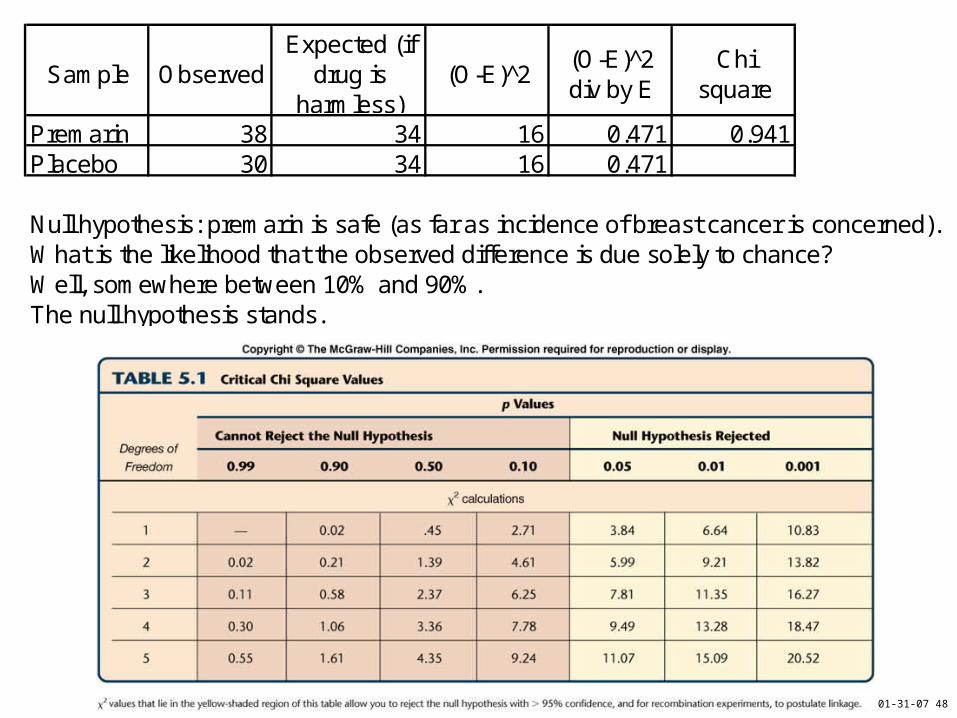
Sample ObservedExpected (if
drug is harmless)
(O-E)^2(O-E)^2 div by E
Chi square
Premarin 38 34 16 0.471 0.941Placebo 30 34 16 0.471
Null hypothesis: premarin is safe (as far as incidence of breast cancer is concerned).What is the likelihood that the observed difference is due solely to chance?Well, somewhere between 10% and 90%.The null hypothesis stands.
MCB140 01-31-07 49
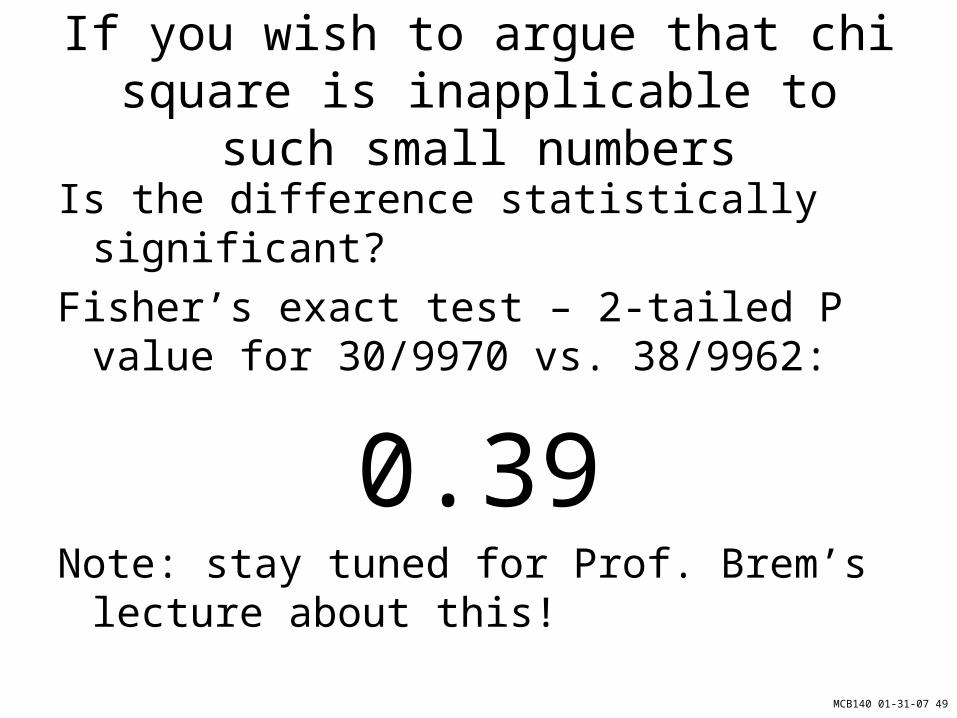
If you wish to argue that chi square is inapplicable to such small numbers
Is the difference statistically significant?
Fisher’s exact test – 2-tailed P value for 30/9970 vs. 38/9962:
0.39Note: stay tuned for Prof. Brem’s lecture
about this!
MCB140 01-31-07 50
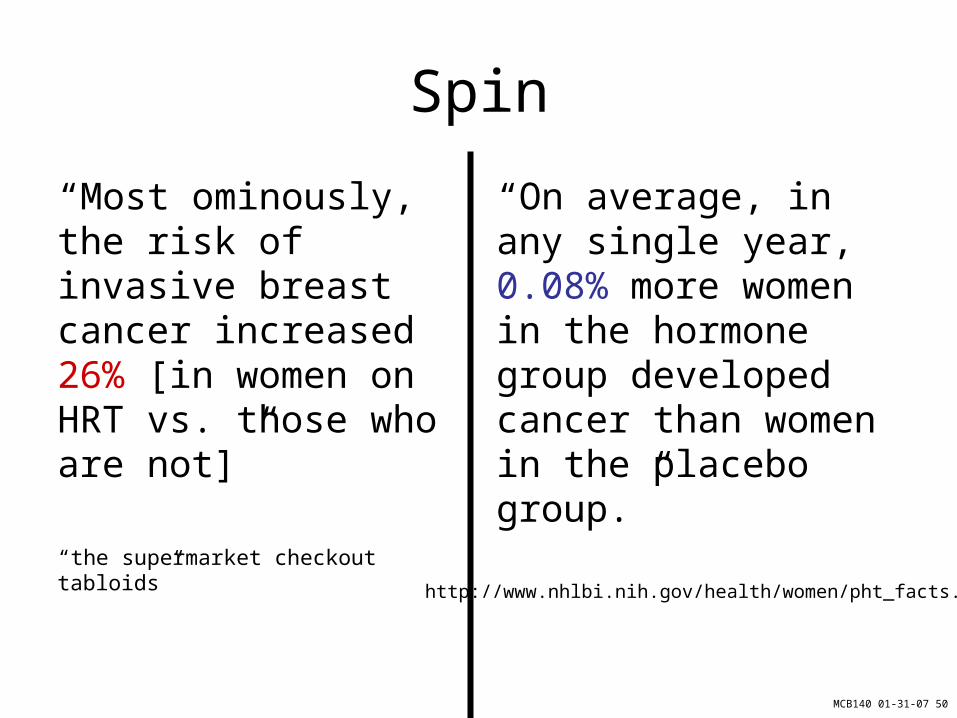
Spin
“Most ominously, the risk of invasive breast cancer increased 26% [in women on HRT vs. those who are not]”
“the supermarket checkout tabloids”
“On average, in any single year, 0.08% more women in the hormone group developed cancer than women in the placebo group.”
http://www.nhlbi.nih.gov/health/women/pht_facts.pdf
MCB140 01-31-07 51
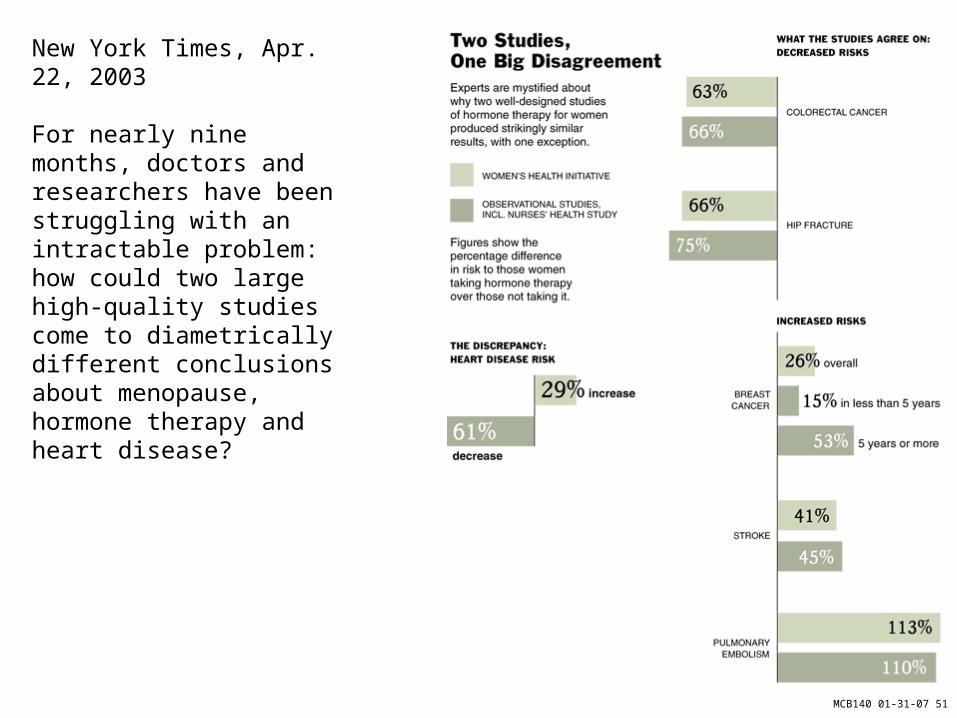
New York Times, Apr. 22, 2003
For nearly nine months, doctors and researchers have been struggling with an intractable problem: how could two large high-quality studies come to diametrically different conclusions about menopause, hormone therapy and heart disease?
MCB140 01-31-07 52
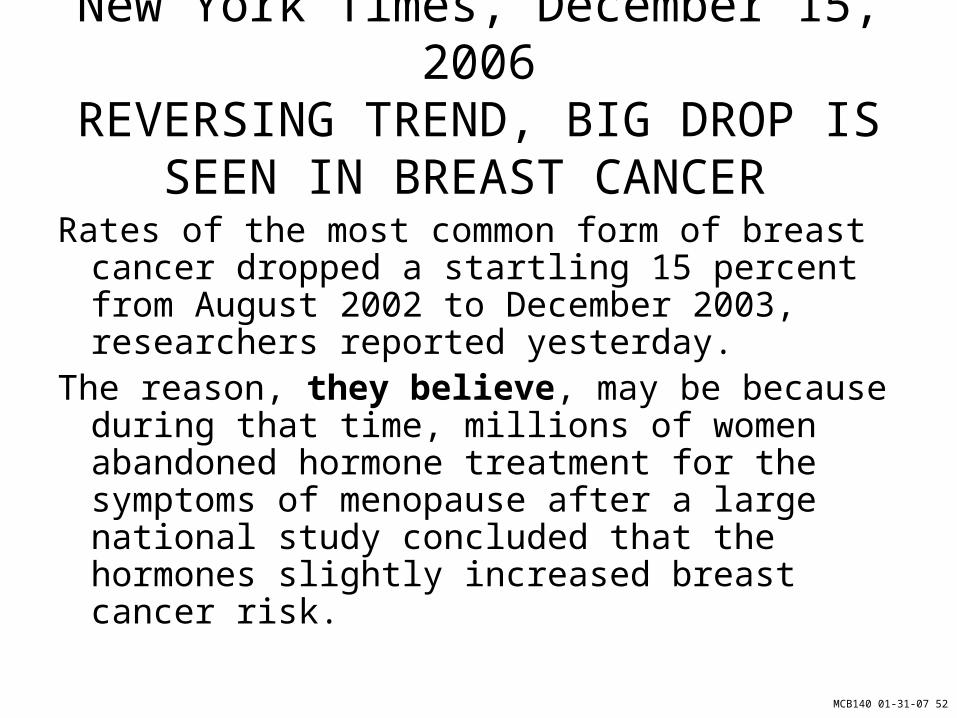
New York Times, December 15, 2006REVERSING TREND, BIG DROP IS
SEEN IN BREAST CANCER
Rates of the most common form of breast cancer dropped a startling 15 percent from August 2002 to December 2003, researchers reported yesterday.
The reason, they believe, may be because during that time, millions of women abandoned hormone treatment for the symptoms of menopause after a large national study concluded that the hormones slightly increased breast cancer risk.
MCB140 01-31-07 53
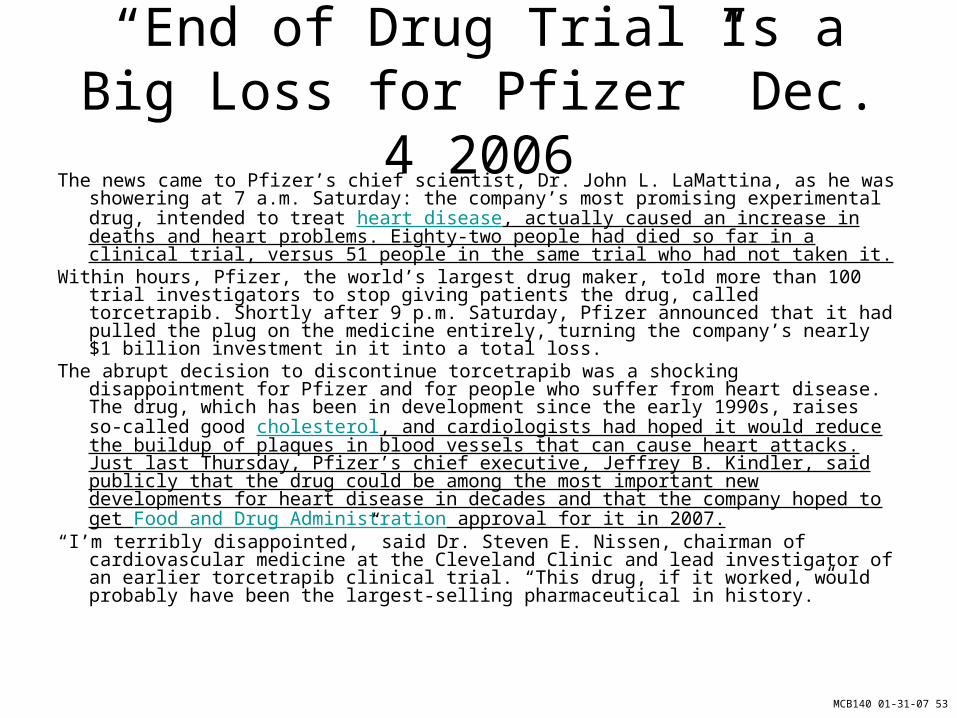
“End of Drug Trial Is a Big Loss for Pfizer” Dec. 4 2006
The news came to Pfizer’s chief scientist, Dr. John L. LaMattina, as he was showering at 7 a.m. Saturday: the company’s most promising experimental drug, intended to treat heart disease, actually caused an increase in deaths and heart problems. Eighty-two people had died so far in a clinical trial, versus 51 people in the same trial who had not taken it.
Within hours, Pfizer, the world’s largest drug maker, told more than 100 trial investigators to stop giving patients the drug, called torcetrapib. Shortly after 9 p.m. Saturday, Pfizer announced that it had pulled the plug on the medicine entirely, turning the company’s nearly $1 billion investment in it into a total loss.
The abrupt decision to discontinue torcetrapib was a shocking disappointment for Pfizer and for people who suffer from heart disease. The drug, which has been in development since the early 1990s, raises so-called good cholesterol, and cardiologists had hoped it would reduce the buildup of plaques in blood vessels that can cause heart attacks. Just last Thursday, Pfizer’s chief executive, Jeffrey B. Kindler, said publicly that the drug could be among the most important new developments for heart disease in decades and that the company hoped to get Food and Drug Administration approval for it in 2007.
“I’m terribly disappointed,” said Dr. Steven E. Nissen, chairman of cardiovascular medicine at the Cleveland Clinic and lead investigator of an earlier torcetrapib clinical trial. “This drug, if it worked, would probably have been the largest-selling pharmaceutical in history.”
MCB140 01-31-07 54
Sample ObservedExpected (if
drug is harmless)
(O-E)^2(O-E)^2 div by E
Chi square value
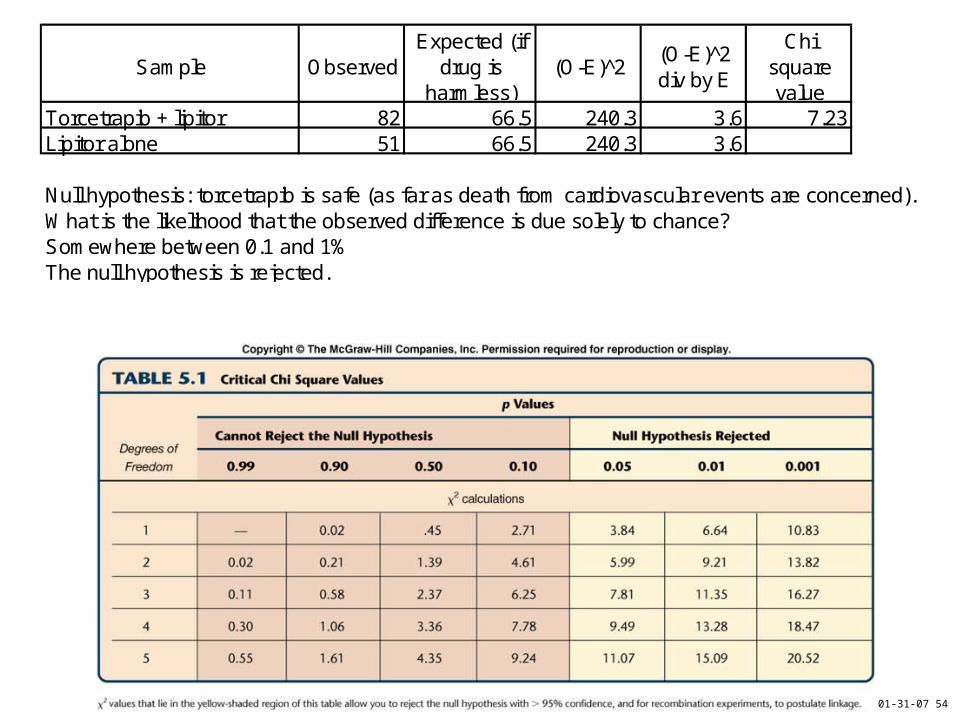
Torcetrapib + lipitor 82 66.5 240.3 3.6 7.23Lipitor alone 51 66.5 240.3 3.6
Null hypothesis: torcetrapib is safe (as far as death from cardiovascular events are concerned).What is the likelihood that the observed difference is due solely to chance?Somewhere between 0.1 and 1%The null hypothesis is rejected.
MCB140 01-31-07 55
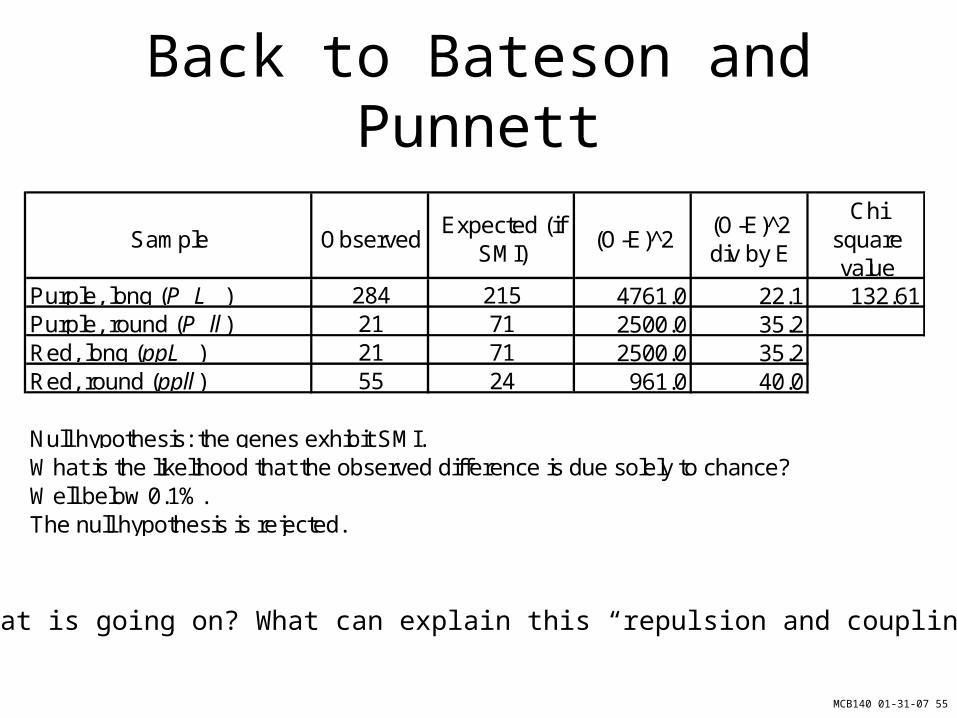
Back to Bateson and Punnett
Sample ObservedExpected (if
SMI)(O-E)^2
(O-E)^2 div by E
Chi square value
Purple, long (P_L_ ) 284 215 4761.0 22.1 132.61Purple, round (P_ll ) 21 71 2500.0 35.2Red, long (ppL_ ) 21 71 2500.0 35.2Red, round (ppll ) 55 24 961.0 40.0
Null hypothesis: the genes exhibit SMI.What is the likelihood that the observed difference is due solely to chance?Well below 0.1%.The null hypothesis is rejected.
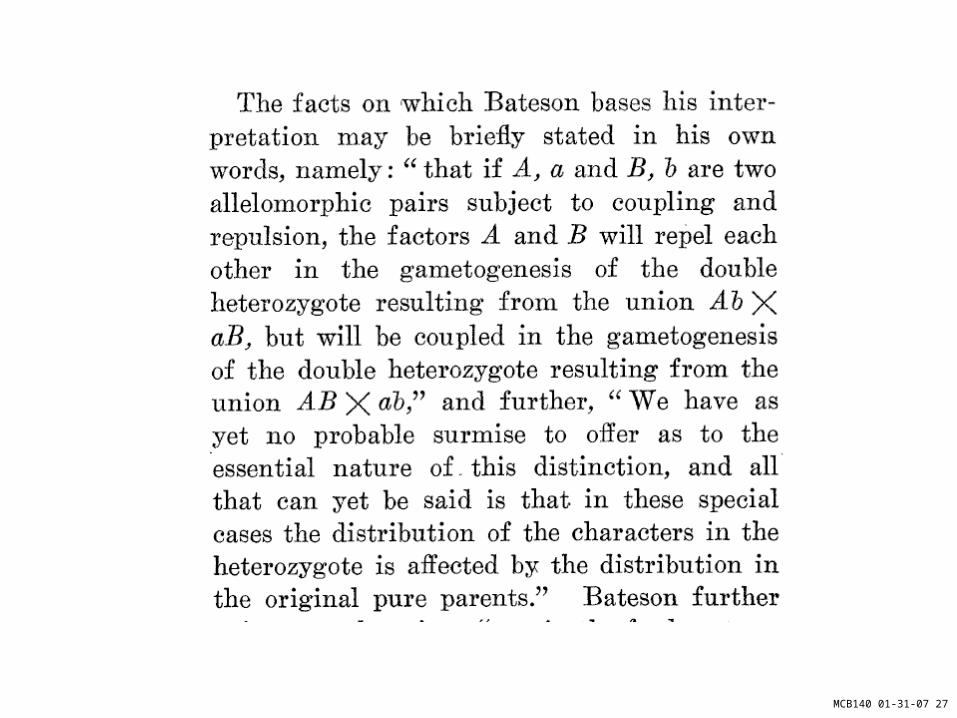
What is going on? What can explain this “repulsion and coupling”?