mcdonald's corp equity research
TRANSCRIPT

DISCLOSURE APPENDIX AT THE BACK OF THIS REPORT CONTAINS IMPORTANT DISCLOSURES, ANALYST CERTIFICATIONS, LEGAL ENTITY DISCLOSURE AND THE STATUS OF NON-US ANALYSTS. US Disclosure: Credit Suisse does and seeks to do business with companies covered in its research reports. As a result, investors should be aware that the Firm may have a conflict of interest that could affect the objectivity of this report. Investors should consider this report as only a single factor in making their investment decision.
19 December 2017Americas/United States
Equity ResearchRestaurants
McDonald's Corp (MCD)
INCREASE TARGET PRICE Rating OUTPERFORMPrice (18-Dec-17, US$) 174.20Target price (US$) (from 178.00) 185.0052-week price range (US$) 174.20 - 119.48Market cap(US$ m) 142,278Target price is for 12 months.
Research AnalystsJason West, CFA
Olya Voronetskaya212 325 2718
Assessing Impact of MCD's New Value Menu + Updated Franchisee Checks■ Assessing the industry impact from new value menu: In light of MCD's
upcoming new value menu (launching Jan. 4), we've reviewed: 1) MCD's relative size and market share vs. peers, 2) earnings sensitivity to US same store sales (SSS) and margin changes for major fast food and coffee companies, 3) historical correlations with MCD sales trends, and 4) review of sales trends around the original MCD "Dollar Menu" launch in 2002.
■ Key takeaways: WEN, JACK, and SONC appear most exposed to MCD's value push when factoring in earnings sensitivity to the US market and considering the product/customer overlap with MCD. Each 1% miss on US SSS = ~3% impact to earnings for these names. We also see some risk to DNKN and SBUX given that MCD has effectively made its beverage value strategy permanent as part of the new "1, 2, 3" value menu. QSR and YUM have the lowest sensitivity to US SSS trends, at ~0.3% of profits for QSR (for each 1% change in Burger King US SSS) and ~0.6% of profits for YUM (for each 1% change in Taco Bell and KFC SSS).
■ MCD franchisee checks point to continued momentum, raise PT: Our recent franchisee checks (across several US regions) point to continued SSS momentum so far in 4Q for MCD. We're raising our MCD 4Q US SSS est. to +5.0% from +3.7% (consensus = +4.3%). 2017 EPS moves up by 1c, to $6.50. Our model does not yet factor in any impact from tax reform. Raising PT to $185 (from $178) based on ~27x 2018E EPS given high visibility on SSS and improving ROIC. Risks: competitive discounting; refranchising dilution; food safety events.
Share price performance
M CD .N S& P 5 0 0 IN D EX
Jan - 1 7 A p r - 1 7 Ju l - 1 7 O ct - 1 71 1 0
1 3 5
1 6 0
1 8 5
On 18-Dec-2017 the S&P 500 INDEX closed at 2690.16Daily Dec16, 2016 - Dec18, 2017, 12/16/16 = US$123.24
Quarterly EPS Q1 Q2 Q3 Q42016A 1.23 1.45 1.62 1.442017E 1.47 1.70 1.76 1.562018E 1.56 1.77 1.88 1.71
Financial and valuation metricsYear 12/16A 12/17E 12/18EEPS (CS adj.) (US$) 5.72 6.50 6.92Prev. EPS (US$) - 6.49 -P/E (x) 30.4 26.8 25.2P/E rel. (%) 138.3 134.8 140.9Revenue (US$ m) 24,621.9 22,704.8 20,254.5EBITDA (US$ m) 9,619.0 10,125.6 10,304.4OCFPS (US$) 7.04 7.70 8.70P/OCF (x) 17.3 22.6 20.0EV/EBITDA (current) 17.4 16.5 16.2Net debt (US$ m) 24,732 27,156 28,894ROIC (%) 24.52 26.71 27.02
Number of shares (m) 816.75 IC (current, US$ m) 22,528.00BV/share (Next Qtr., US$) -2.4 EV/IC (x) 7.0Net debt (Next Qtr., US$ m) 25,968.4 Dividend (current, US$) 3.76Net debt/tot eq (Next Qtr.,%) -1,298.0 Dividend yield (%) 0.54Source: Company data, Thomson Reuters, Credit Suisse estimates

19 December 2017
McDonald's Corp (MCD) 2
McDonald's Corp (MCD)Price (18 Dec 2017): US$174.2; Rating: OUTPERFORM; Target Price: (from US$178.00) US$185.00; Analyst: Jason WestIncome Statement 12/16A 12/17E 12/18ERevenue (US$ m) 24,621.9 22,704.8 20,254.5EBITDA 9,619 10,126 10,304Depr. & amort. (1,517) (1,377) (1,294)EBIT (US$) 8,103 8,749 9,010Net interest exp (885) (926) (973)PBT (US$) 7,224 7,791 8,047Income taxes (2,299) (2,493) (2,575)Profit after tax 4,925 5,298 5,472Other NPAT adjustments 0 0 0Cash Flow 12/16A 12/17E 12/18ECash flow from operations 6,060 6,280 6,882CAPEX (1,821) (1,700) (2,000)Free cashflow to the firm 4,239 4,580 4,882Cash flow from investments (982) 779 (1,820)Net share issue(/repurchase) (10,872) (5,414) (3,550)Dividends paid (3,058) (3,098) (3,250)Cashflow from financing activities (13,270) (9,713) (6,800)Changes in Net Cash/Debt (8,296) (2,424) (1,738)Balance Sheet (US$) 12/16A 12/17E 12/18ECash & cash equivalents 1,223 1,462 725Account receivables 1,474 1,469 1,469Other current assets 2,092 496 496Total fixed assets 21,258 22,009 22,535Investment securities - - -Total assets 31,024 31,281 31,069Total current liabilities 3,468 3,840 3,840Shareholder equity (2,204) (4,886) (6,214)Total liabilities and equity 31,024 31,281 31,069Net debt 24,732 27,156 28,894Per share 12/16A 12/17E 12/18ENo. of shares (wtd avg) 861 815 791CS adj. EPS 5.72 6.50 6.92Prev. EPS (US$) - 6.49 -Dividend (US$) 3.61 3.83 4.11Free cash flow per share 4.92 5.62 6.17Earnings 12/16A 12/17E 12/18ESales growth (%) (3.1) (7.8) (10.8)EBIT growth (%) 11.4 8.0 3.0Net profit growth (%) 4.9 7.6 3.3EPS growth (%) 15.0 13.6 6.5EBITDA margin (%) 39.1 44.6 50.9EBIT margin (%) 32.9 38.5 44.5Pretax margin (%) 29.3 34.3 39.7Net margin (%) 20.0 23.3 27.0Valuation 12/16A 12/17E 12/18EEV/EBITDA (x) 17.4 16.5 16.2P/E (x) 30.4 26.8 25.2Returns 12/16A 12/17E 12/18EROIC (%) 24.5 26.7 27.0Gearing 12/16A 12/17E 12/18ENet debt/equity (%) (1122.0) (555.8) (465.0)Quarterly EPS Q1 Q2 Q3 Q42016A 1.23 1.45 1.62 1.442017E 1.47 1.70 1.76 1.562018E 1.56 1.77 1.88 1.71
Company BackgroundMcDonald’s Corporation (McDonald’s) franchises and operates McDonald’s restaurants in the global restaurant industry. These restaurants serve a menu at various price points in more than 100 countries around the world.
Blue/Grey Sky Scenario
Our Blue Sky Scenario (US$) (from 190.00) 195.00Our $195 blue sky target puts a ~18x EBITDA multiple on 2018 EBITDA of ~$10.5bn (~2% above our published EBITDA forecast). This scenario assumes 2H17 global SSS accelerate to ~+6% or higher (vs. ~5.0% on our current model), driving upside to restaurant and franchise margins, as well as investor sentiment.
Our Grey Sky Scenario (US$) (from 135.00) 145.00Our $145 grey sky target puts a ~14.5x EBITDA multiple on 2018 EBITDA of ~$10.1bn (~2% below our published EBITDA forecast). This scenario assumes global SSS slow to ~+2% or lower, driving downside to margins. We note that share repurchases provide some cushion were the stock to fall (MCD will buy back ~$14bn from 2017 to 2019 on our model).
Share price performance
M CD .N S& P 5 0 0 IN D EX
Jan - 1 7 A p r - 1 7 Ju l - 1 7 O ct - 1 71 1 0
1 3 5
1 6 0
1 8 5
On 18-Dec-2017 the S&P 500 INDEX closed at 2690.16Daily Dec16, 2016 - Dec18, 2017, 12/16/16 = US$123.24
Source: Company data, Thomson Reuters, Credit Suisse estimates
19 December 2017
McDonald's Corp (MCD) 3
Assessing the Implications of MCD's New Value StrategyMCD will be launching a new value menu on Jan. 4 in the US, featuring items at $1, $2 and $3 price points. The new "$1 $2 $3 Dollar Menu" is being pitched by the company as a "return to value" and will be supported by national advertising. (We note that franchisees have committed to an increase in the contribution to national advertising funding starting next year, resulting in an ~20% increase in MCD's already massive national ad budget, we estimate.) In recent years, value offers within the fast food industry have tended to focus on "bundled" messages, rather than single price points. MCD is breaking this trend to some extent. This is also the first time that MCD has ever offered Happy Meals on a national value menu.
Fast food competitors are gearing up to combat this new value effort from MCD, setting up 2018 as a potential year for intensive discounting in the fast food space, particularly in the first part of the year. For example, JACK has announced plans for new value messaging in Jan., focused on $1 to $5 price points. Taco Bell (owned by YUM) has announced that it is expanding its dollar menu this year, with plans to roll out 20 $1 limited-time offerings throughout 2018, in addition to the 20 $1 permanent menu items. Consensus is modeling SSS across the US fast food players at ~+2%, with relatively flat restaurant margins.
In this note, we review the relative size of MCD's US business versus key competitors. We also analyze the earnings sensitivity to SSS and margins for the peer group.
Overall, we do not know how impactful MCD's new value strategy will be in driving sales and traffic. Our feedback from MCD franchisees has been mixed on this front. Some franchisees expect a meaningful lift in sales and traffic (perhaps +2-3%). Others are not sure that the impact will be material right away, but will build over time (as was the case with the Dollar Menu). However, it is clear that MCD's business has positive momentum at the moment, with our checks pointing to +5% SSS in 4Q. Consensus forecasts call for a deceleration in MCD US SSS in 2018, to ~+3%. The launch of the new value menu, along with other initiatives such as fresh beef, delivery, and remodels, suggest this forecast could prove conservative.
Below we summarize the items on the new value menu. Our anecdotal pricing checks suggest an average price reduction of ~15% across the full menu. We note that the $1 soft drink and $2 McCafe prices are a continuation of discounted pricing seen throughout most of 2017.
MCD's new "$1 $2 $3 Dollar Menu":
$1 menu items
■ Sausage Burrito
■ McChicken (sandwich)
■ Cheeseburger
■ Any Size Soft Drink
$2 menu items
■ Sausage McGriddles
■ 2-piece Buttermilk Crispy Tenders
■ Bacon McDouble
■ Small McCafé Beverage
$3 menu items
■ Sausage McMuffin with Egg
19 December 2017
McDonald's Corp (MCD) 4
■ Classic Chicken Sandwich (new menu item)
■ Triple Cheeseburger
■ Happy Meal
Traffic in focus: Recall that MCD ended the original "Dollar Menu" in late 2012 (launched in Nov '02) and has struggled to find a consistent and effective value message in recent years. The "McPick 2" menu was launched in 1Q16, but we believe results here have been mixed. This menu offers a rotating assortment of menu items and price points (both regionally and nationally), perhaps making it difficult for the customer to assess the true "value" of this offer. The new 1,2,3 value menu is expected to offer a more stable and consistent value message.
Franchisees have signed on for a 3-year commitment to the new value menu (with some flexibility depending on how the menu performs). We also believe the vast majority of restaurants will feature the same menu items at the same price points in every market across the US. This consistency should result in more effective national advertising.
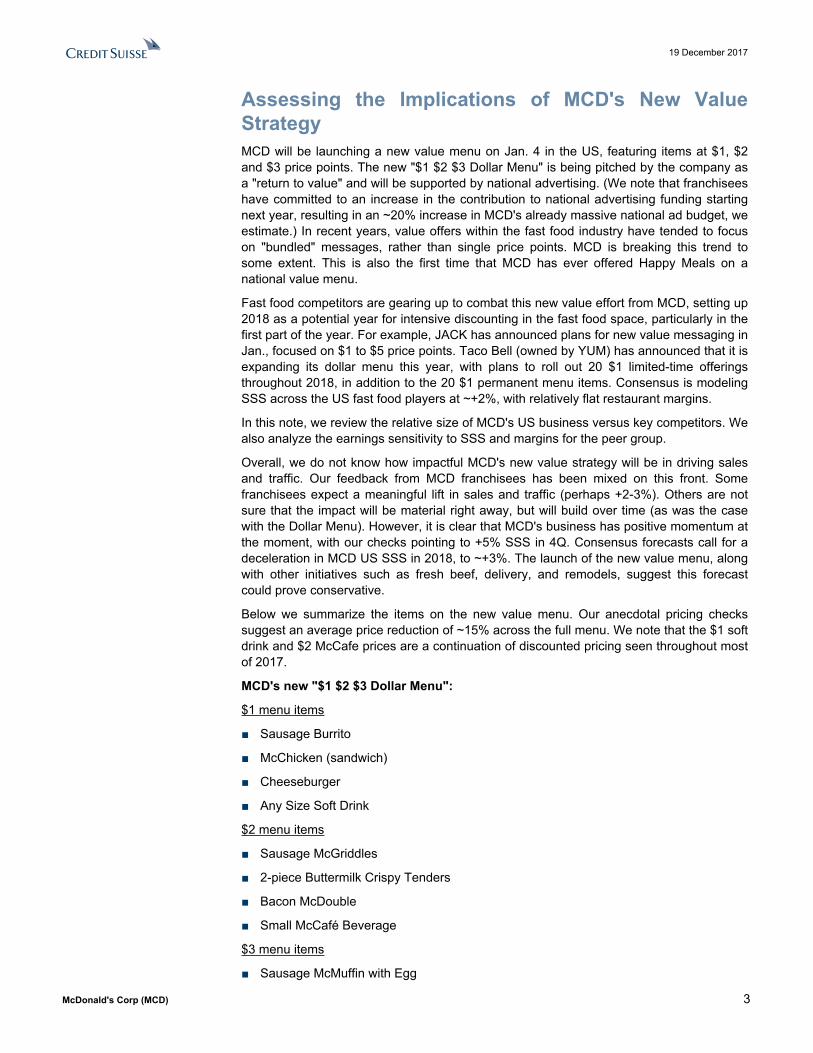
MCD's has seen a healthy recovery in US SSS since late 2015 (though with some ups and downs). The bulk of this recovery has been driven by average check, rather than traffic. By our calcs, MCD's US same store traffic fell ~11% from 2012-16 (cumulatively). Traffic was negative each of those years. Traffic improved to ~flat in 1Q17 (ex-Leap Day) and has been up ~2% in both 2Q and 3Q17, the first signs of meaningfully positive traffic since 2011. Clearly, there is still plenty of lost traffic to be recovered.
MCD's new 1,2,3 value menu appears geared towards recovering this traffic, which is likely to partly come at the expense of check. We estimate the average discount of items on the new menu to be ~15% (or ~20% including historical beverage prices). We note that some items were already being sold at similar prices, while others have seen a meaningful cut in price (e.g., Happy Meal prices appear to be ~20-25% lower).
Figure 1: MCD US same store sales* (quarterly)
-4.0%
-2.0%
0.0%
2.0%
4.0%
6.0%
8.0%
4Q12
1Q13
2Q13
3Q13
4Q13
1Q14
2Q14
3Q14
4Q14
1Q15
2Q15
3Q15
4Q15
1Q16
2Q16
3Q16
4Q16
1Q17
2Q17
3Q17
MCD US same store sales
Source: Company data, Credit Suisse estimates * Adjusted to exclude impact of Leap Day.

19 December 2017
McDonald's Corp (MCD) 5
Figure 2: MCD US same store TRAFFIC (1 and 2-year): MCD's US traffic has remained in negative territory in recent years, despite the launch of All-Day Breakfast in late 2015 and an overall improvement in sales trends. We estimate that US traffic fell ~11% cumulatively from 2012-16.
-12.0%
-10.0%
-8.0%
-6.0%
-4.0%
-2.0%
0.0%
2.0%
4.0%
6.0%
8.0%
4Q12
1Q13
2Q13
3Q13
4Q13
1Q14
2Q14
3Q14
4Q14
1Q15
2Q15
3Q15
4Q15
1Q16
2Q16
3Q16
4Q16
1Q17
2Q17
3Q17
MCD US same store traffic (1-yr)
MCD US same store traffic (2-yr)
Source: Company data, Credit Suisse estimates
Figure 3: MCD US same store TRAFFIC vs. CHECK: MCD's SSS improvement in recent years has primarily been driven by average check.
-8.0%
-6.0%
-4.0%
-2.0%
0.0%
2.0%
4.0%
6.0%
8.0%
4Q12
1Q13
2Q13
3Q13
4Q13
1Q14
2Q14
3Q14
4Q14
1Q15
2Q15
3Q15
4Q15
1Q16
2Q16
3Q16
4Q16
1Q17
2Q17
3Q17
MCD US traffic growth (same store)
MCD US avg. check growth (same store)
Source: Company data, Credit Suisse estimates
19 December 2017
McDonald's Corp (MCD) 6
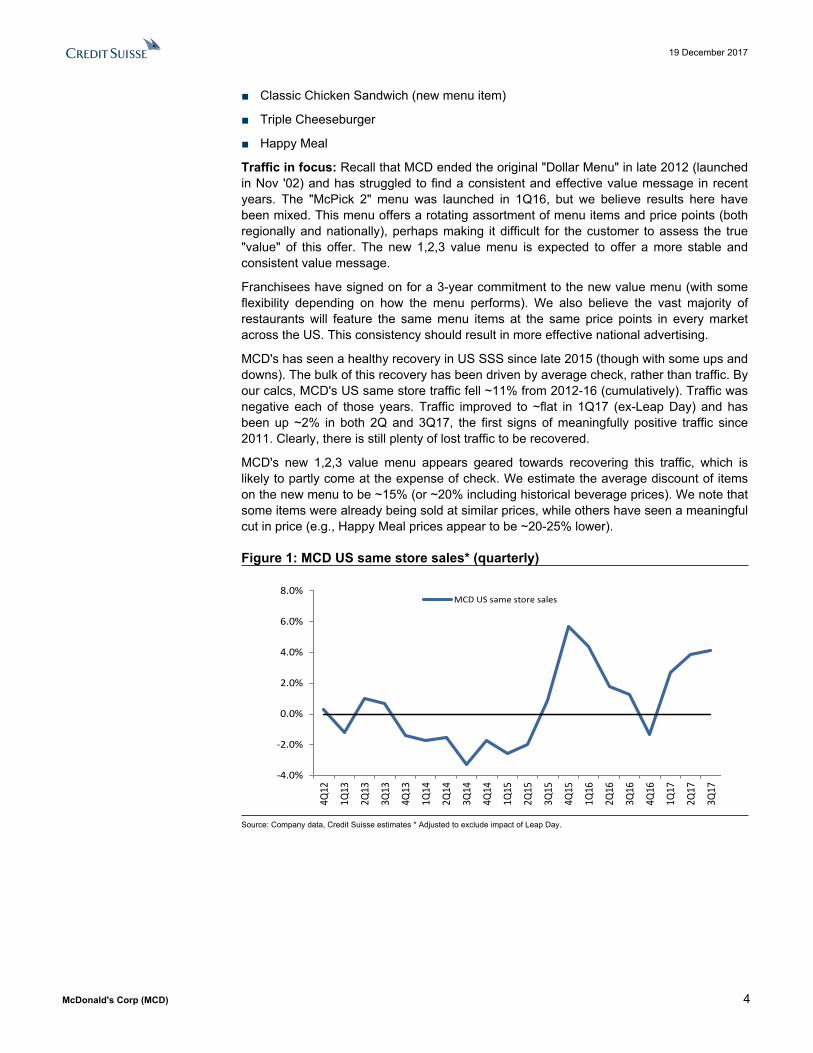
Figure 4: MCD US average check (per person)
$5.45 $5.47 $5.45 $5.47
$5.61$5.69
$5.58$5.53
$5.67
$5.78 $5.74$5.79
$5.96 $5.98 $6.01$6.06
$6.17 $6.15 $6.13$6.17
$5.00
$5.20
$5.40
$5.60
$5.80
$6.00
$6.20
$6.40
4Q12
1Q13
2Q13
3Q13
4Q13
1Q14
2Q14
3Q14
4Q14
1Q15
2Q15
3Q15
4Q15
1Q16
2Q16
3Q16
4Q16
1Q17
2Q17
3Q17
MCD US average check
Source: Company data, Credit Suisse estimates
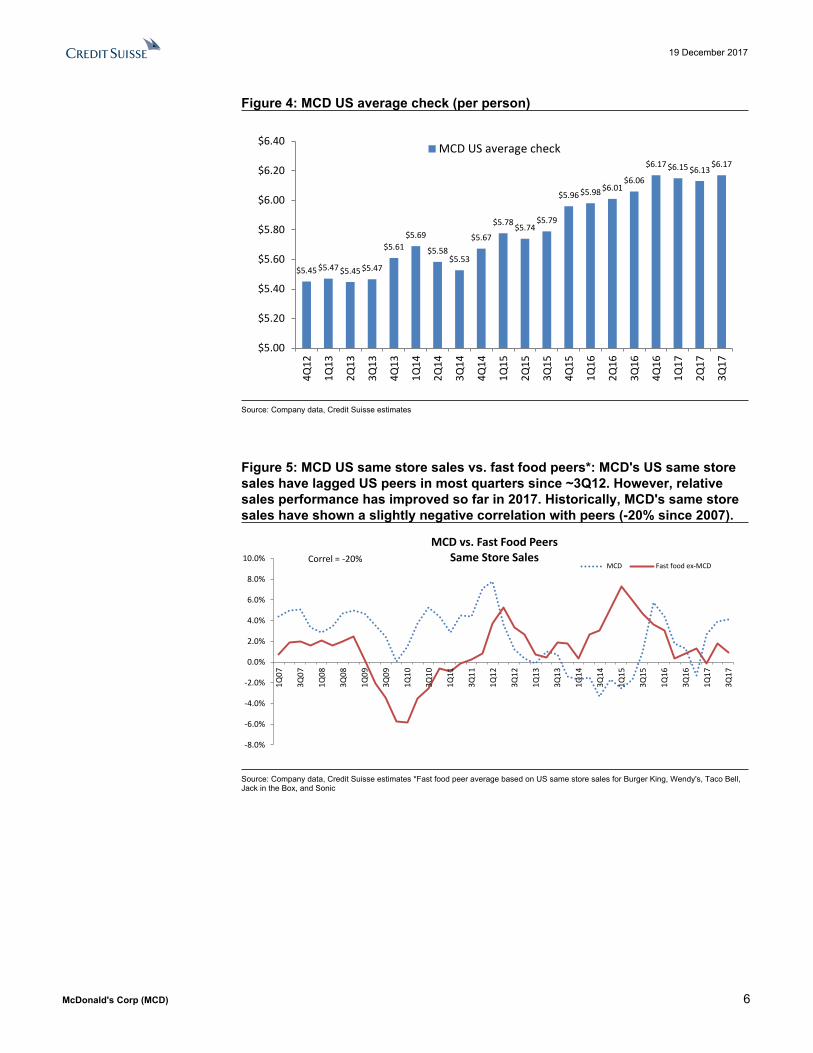
Figure 5: MCD US same store sales vs. fast food peers*: MCD's US same store sales have lagged US peers in most quarters since ~3Q12. However, relative sales performance has improved so far in 2017. Historically, MCD's same store sales have shown a slightly negative correlation with peers (-20% since 2007).
-8.0%
-6.0%
-4.0%
-2.0%
0.0%
2.0%
4.0%
6.0%
8.0%
10.0%
1Q07
3Q07
1Q08
3Q08
1Q09
3Q09
1Q10
3Q10
1Q11
3Q11
1Q12
3Q12
1Q13
3Q13
1Q14
3Q14
1Q15
3Q15
1Q16
3Q16
1Q17
3Q17
MCD vs. Fast Food PeersSame Store Sales
MCD Fast food ex-MCDCorrel = -20%
Source: Company data, Credit Suisse estimates *Fast food peer average based on US same store sales for Burger King, Wendy's, Taco Bell, Jack in the Box, and Sonic
19 December 2017
McDonald's Corp (MCD) 7
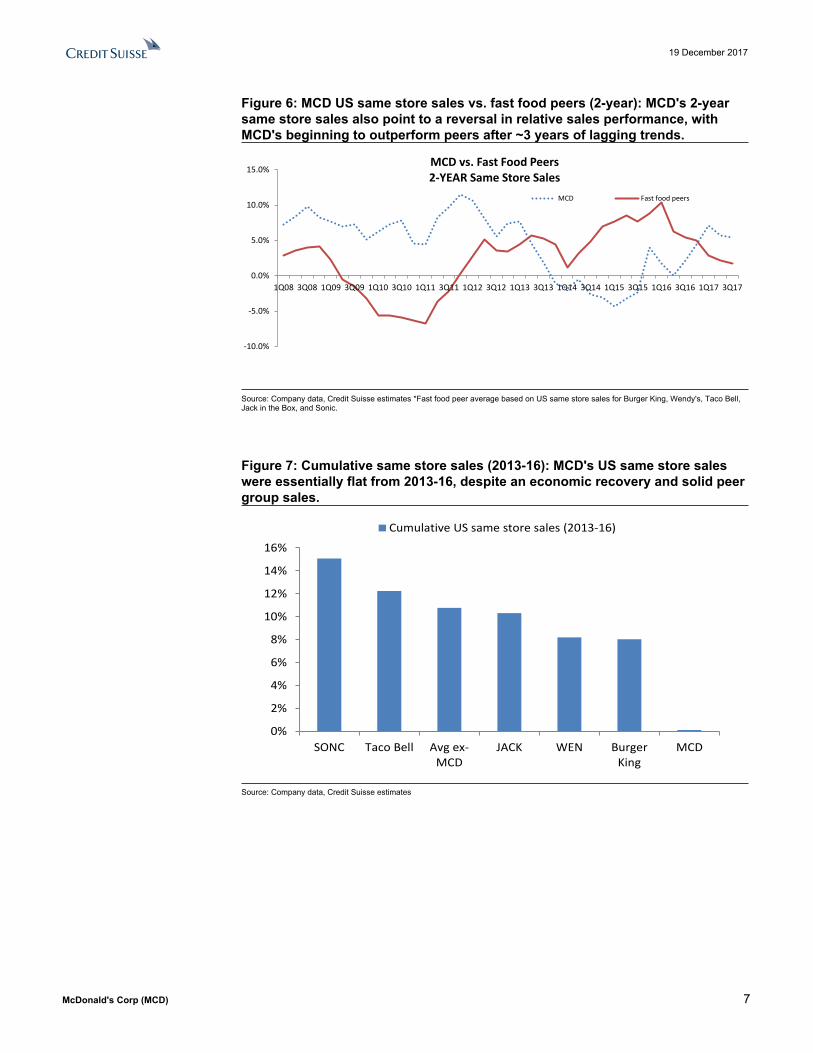
Figure 6: MCD US same store sales vs. fast food peers (2-year): MCD's 2-year same store sales also point to a reversal in relative sales performance, with MCD's beginning to outperform peers after ~3 years of lagging trends.
-10.0%
-5.0%
0.0%
5.0%
10.0%
15.0%
1Q08 3Q08 1Q09 3Q09 1Q10 3Q10 1Q11 3Q11 1Q12 3Q12 1Q13 3Q13 1Q14 3Q14 1Q15 3Q15 1Q16 3Q16 1Q17 3Q17
MCD vs. Fast Food Peers2-YEAR Same Store Sales
MCD Fast food peers
Source: Company data, Credit Suisse estimates *Fast food peer average based on US same store sales for Burger King, Wendy's, Taco Bell, Jack in the Box, and Sonic.
Figure 7: Cumulative same store sales (2013-16): MCD's US same store sales were essentially flat from 2013-16, despite an economic recovery and solid peer group sales.
0%
2%
4%
6%
8%
10%
12%
14%
16%
SONC Taco Bell Avg ex-MCD
JACK WEN BurgerKing
MCD
Cumulative US same store sales (2013-16)
Source: Company data, Credit Suisse estimates

19 December 2017
McDonald's Corp (MCD) 8
Figure 8: MCD US same store sales vs. "fast food sandwich" industry (per NPD): MCD is beginning to recover market share.
-8.0%
-6.0%
-4.0%
-2.0%
0.0%
2.0%
4.0%
6.0%
8.0%
10.0%
1Q12
2Q12
3Q12
4Q12
1Q13
2Q13
3Q13
4Q13
1Q14
2Q14
3Q14
4Q14
1Q15
2Q15
3Q15
4Q15
1Q16
2Q16
3Q16
4Q16
1Q17
2Q17
3Q17
SSS spread: MCD less QSR sandwich
QSR sandwich industry SSS (ex-MCD)
MCD US SSS
Source: Company data, Credit Suisse estimates
Assessing Impact to CompetitorsIn the figures below, we review MCD's relative size versus peers in the US and the earnings sensitivity to US sales for each company. We have focused this review on MCD's key fast food and coffee competitors: Burger King, Wendy's, Sonic, Jack in the Box, Yum Brands (KFC/Taco Bell), Dunkin' Donuts, and Starbucks.
Key takeaways:
■ MCD's generates ~$36bn in US system sales. This represents ~7% market share of the total restaurant industry and ~20% market share of the fast food industry (based on top 500 chains).
■ Each 1% change in MCD's sales would impact overall fast food industry sales by ~0.2%, assuming no growth in the industry sales base.
■ We believe MCD's new value menu could boost its sales by ~2% in coming periods, suggesting ~0.4% in sales risk to the average fast food competitor, assuming MCD's sales are evenly distributed.
■ Clearly, some of MCD's near-in competitors could be more impacted than the average fast food company. We'd estimate a sales risk in the ~1% range for more direct competitors, such as Wendy's, Burger King, Jack in the Box, and Sonic.
■ On average, each 1% change in US same store sales impacts pre-tax profits by ~1.5% for these companies. WEN and SONC have the highest sensitivity to US same store sales, with ~3% of profits impacted for each 1% change in SSS. QSR and YUM have the lowest sensitivity to US SSS trends, at ~0.3% of profits for QSR (for each 1% change in Burger King SSS) and ~0.6% of profits for YUM (for each 1% change in Taco Bell and KFC SSS).
■ We also analyzed the impact to profits from each 100bps change in US company-operated margin, as MCD's push into value is likely to result in a competitive response from peers. Given that most of these companies are predominantly franchised, the impact here is relatively low. Each 100bps change in company restaurant margin

19 December 2017
McDonald's Corp (MCD) 9
impacts pre-tax profits by ~1.2% for this peer group. SBUX has the highest sensitivity, at ~2.8% of profit for each ~100bps change in US company-operated margin.
■ We also show the combined impact of both sales loss and margin pressure, as these two could occur in tandem.
■ In terms of historical SSS correlations, we found Sonic to be the most inversely correlated with MCD same store sales over the past 10 years (-27%). However, correlations overall were relatively low, and there is not much evidence that a strong MCD means weak sales for the competitive set.
■ In sum, WEN, JACK and SONC appear most at risk from MCD's new value menu given a combination of product/customer overlap and higher sensitivity to US sales and margin changes.
■ While the overall earnings sensitivity to this issue is relatively low, the impact to investor sentiment from weakening sales trends is likely to have a more material impact on valuation multiples. Sales and margin pressures will also be felt by franchisees than the parent company.
Figure 9: US system sales by brand (as of 2016)
$36
$15
$9 $9 $9 $8
$5 $4 $3
$0
$5
$10
$15
$20
$25
$30
$35
$40
McDonald's Starbucks BurgerKing
Taco Bell Wendy's Dunkin'Donuts
Sonic KFC Jack in theBox
US system sales (billions)
Source: Company data, Credit Suisse estimates, Technomic

19 December 2017
McDonald's Corp (MCD) 10
Figure 10: 1% change in MCD system sales/brand system sales: Below we show the relative size of a 1% change in MCD's US system sales to competitor sales. For example, a 1% change in MCD system sales = ~$360mm in sales dollars. Dividing this by Jack in the Box system sales of ~$3.5bn = ~11%. We are not suggesting these companies face sales risk in these ranges. We are just providing a ranking of MCD's relative sales base versus peers.
11%
8% 8%
4% 4% 4% 4%
2%
0%
2%
4%
6%
8%
10%
12%
Jack in theBox
KFC Sonic Dunkin'Donuts
Wendy's Taco Bell Burger King Starbucks
1% change in MCD sales/brand system sales
Source: Company data, Credit Suisse estimates, Technomic
19 December 2017
McDonald's Corp (MCD) 11
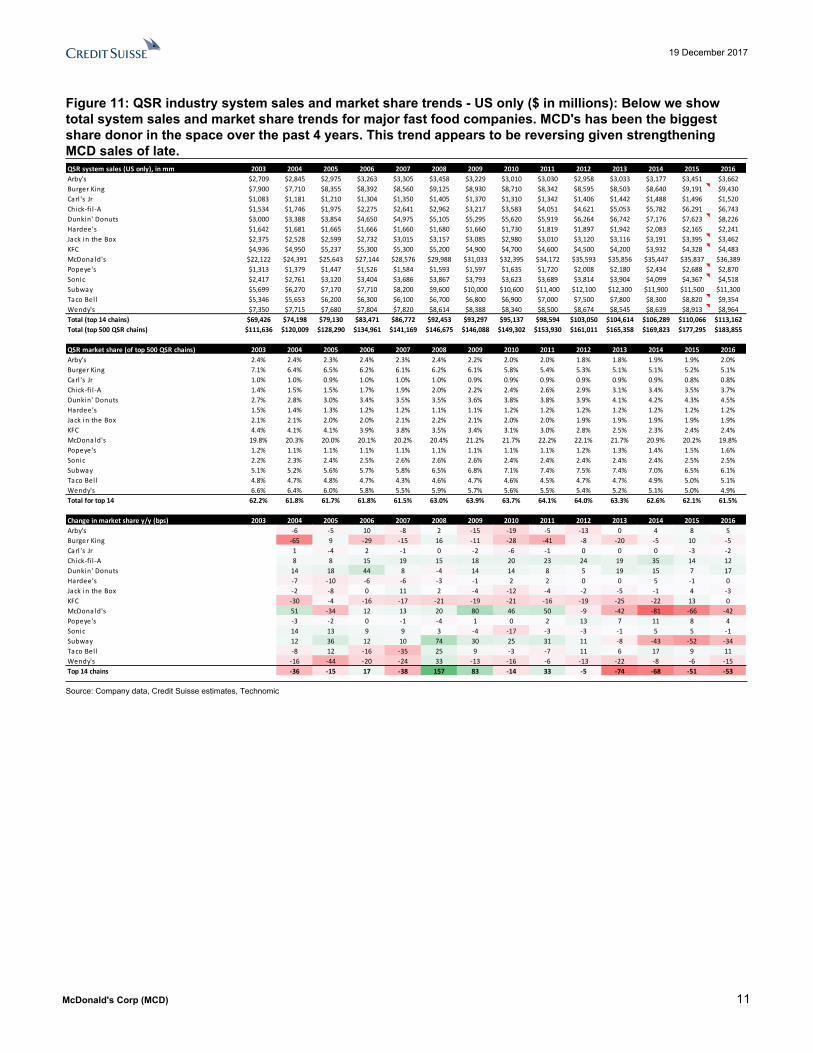
Figure 11: QSR industry system sales and market share trends - US only ($ in millions): Below we show total system sales and market share trends for major fast food companies. MCD's has been the biggest share donor in the space over the past 4 years. This trend appears to be reversing given strengthening MCD sales of late.QSR system sales (US only), in mm 2003 2004 2005 2006 2007 2008 2009 2010 2011 2012 2013 2014 2015 2016Arby's $2,709 $2,845 $2,975 $3,263 $3,305 $3,458 $3,229 $3,010 $3,030 $2,958 $3,033 $3,177 $3,451 $3,662Burger King $7,900 $7,710 $8,355 $8,392 $8,560 $9,125 $8,930 $8,710 $8,342 $8,595 $8,503 $8,640 $9,191 $9,430Carl 's Jr $1,083 $1,181 $1,210 $1,304 $1,350 $1,405 $1,370 $1,310 $1,342 $1,406 $1,442 $1,488 $1,496 $1,520Chick-fi l -A $1,534 $1,746 $1,975 $2,275 $2,641 $2,962 $3,217 $3,583 $4,051 $4,621 $5,053 $5,782 $6,291 $6,743Dunkin' Donuts $3,000 $3,388 $3,854 $4,650 $4,975 $5,105 $5,295 $5,620 $5,919 $6,264 $6,742 $7,176 $7,623 $8,226Hardee's $1,642 $1,681 $1,665 $1,666 $1,660 $1,680 $1,660 $1,730 $1,819 $1,897 $1,942 $2,083 $2,165 $2,241Jack in the Box $2,375 $2,528 $2,599 $2,732 $3,015 $3,157 $3,085 $2,980 $3,010 $3,120 $3,116 $3,191 $3,395 $3,462KFC $4,936 $4,950 $5,237 $5,300 $5,300 $5,200 $4,900 $4,700 $4,600 $4,500 $4,200 $3,932 $4,328 $4,483McDonald's $22,122 $24,391 $25,643 $27,144 $28,576 $29,988 $31,033 $32,395 $34,172 $35,593 $35,856 $35,447 $35,837 $36,389Popeye's $1,313 $1,379 $1,447 $1,526 $1,584 $1,593 $1,597 $1,635 $1,720 $2,008 $2,180 $2,434 $2,688 $2,870Sonic $2,417 $2,761 $3,120 $3,404 $3,686 $3,867 $3,793 $3,623 $3,689 $3,814 $3,904 $4,099 $4,367 $4,518Subway $5,699 $6,270 $7,170 $7,710 $8,200 $9,600 $10,000 $10,600 $11,400 $12,100 $12,300 $11,900 $11,500 $11,300Taco Bel l $5,346 $5,653 $6,200 $6,300 $6,100 $6,700 $6,800 $6,900 $7,000 $7,500 $7,800 $8,300 $8,820 $9,354Wendy's $7,350 $7,715 $7,680 $7,804 $7,820 $8,614 $8,388 $8,340 $8,500 $8,674 $8,545 $8,639 $8,913 $8,964Total (top 14 chains) $69,426 $74,198 $79,130 $83,471 $86,772 $92,453 $93,297 $95,137 $98,594 $103,050 $104,614 $106,289 $110,066 $113,162Total (top 500 QSR chains) $111,636 $120,009 $128,290 $134,961 $141,169 $146,675 $146,088 $149,302 $153,930 $161,011 $165,358 $169,823 $177,295 $183,855
QSR market share (of top 500 QSR chains) 2003 2004 2005 2006 2007 2008 2009 2010 2011 2012 2013 2014 2015 2016Arby's 2.4% 2.4% 2.3% 2.4% 2.3% 2.4% 2.2% 2.0% 2.0% 1.8% 1.8% 1.9% 1.9% 2.0%Burger King 7.1% 6.4% 6.5% 6.2% 6.1% 6.2% 6.1% 5.8% 5.4% 5.3% 5.1% 5.1% 5.2% 5.1%Carl 's Jr 1.0% 1.0% 0.9% 1.0% 1.0% 1.0% 0.9% 0.9% 0.9% 0.9% 0.9% 0.9% 0.8% 0.8%Chick-fi l -A 1.4% 1.5% 1.5% 1.7% 1.9% 2.0% 2.2% 2.4% 2.6% 2.9% 3.1% 3.4% 3.5% 3.7%Dunkin' Donuts 2.7% 2.8% 3.0% 3.4% 3.5% 3.5% 3.6% 3.8% 3.8% 3.9% 4.1% 4.2% 4.3% 4.5%Hardee's 1.5% 1.4% 1.3% 1.2% 1.2% 1.1% 1.1% 1.2% 1.2% 1.2% 1.2% 1.2% 1.2% 1.2%Jack in the Box 2.1% 2.1% 2.0% 2.0% 2.1% 2.2% 2.1% 2.0% 2.0% 1.9% 1.9% 1.9% 1.9% 1.9%KFC 4.4% 4.1% 4.1% 3.9% 3.8% 3.5% 3.4% 3.1% 3.0% 2.8% 2.5% 2.3% 2.4% 2.4%McDonald's 19.8% 20.3% 20.0% 20.1% 20.2% 20.4% 21.2% 21.7% 22.2% 22.1% 21.7% 20.9% 20.2% 19.8%Popeye's 1.2% 1.1% 1.1% 1.1% 1.1% 1.1% 1.1% 1.1% 1.1% 1.2% 1.3% 1.4% 1.5% 1.6%Sonic 2.2% 2.3% 2.4% 2.5% 2.6% 2.6% 2.6% 2.4% 2.4% 2.4% 2.4% 2.4% 2.5% 2.5%Subway 5.1% 5.2% 5.6% 5.7% 5.8% 6.5% 6.8% 7.1% 7.4% 7.5% 7.4% 7.0% 6.5% 6.1%Taco Bel l 4.8% 4.7% 4.8% 4.7% 4.3% 4.6% 4.7% 4.6% 4.5% 4.7% 4.7% 4.9% 5.0% 5.1%Wendy's 6.6% 6.4% 6.0% 5.8% 5.5% 5.9% 5.7% 5.6% 5.5% 5.4% 5.2% 5.1% 5.0% 4.9%Total for top 14 62.2% 61.8% 61.7% 61.8% 61.5% 63.0% 63.9% 63.7% 64.1% 64.0% 63.3% 62.6% 62.1% 61.5%
Change in market share y/y (bps) 2003 2004 2005 2006 2007 2008 2009 2010 2011 2012 2013 2014 2015 2016Arby's -6 -5 10 -8 2 -15 -19 -5 -13 0 4 8 5Burger King -65 9 -29 -15 16 -11 -28 -41 -8 -20 -5 10 -5Carl 's Jr 1 -4 2 -1 0 -2 -6 -1 0 0 0 -3 -2Chick-fi l -A 8 8 15 19 15 18 20 23 24 19 35 14 12Dunkin' Donuts 14 18 44 8 -4 14 14 8 5 19 15 7 17Hardee's -7 -10 -6 -6 -3 -1 2 2 0 0 5 -1 0Jack in the Box -2 -8 0 11 2 -4 -12 -4 -2 -5 -1 4 -3KFC -30 -4 -16 -17 -21 -19 -21 -16 -19 -25 -22 13 0McDonald's 51 -34 12 13 20 80 46 50 -9 -42 -81 -66 -42Popeye's -3 -2 0 -1 -4 1 0 2 13 7 11 8 4Sonic 14 13 9 9 3 -4 -17 -3 -3 -1 5 5 -1Subway 12 36 12 10 74 30 25 31 11 -8 -43 -52 -34Taco Bel l -8 12 -16 -35 25 9 -3 -7 11 6 17 9 11Wendy's -16 -44 -20 -24 33 -13 -16 -6 -13 -22 -8 -6 -15Top 14 chains -36 -15 17 -38 157 83 -14 33 -5 -74 -68 -51 -53
Source: Company data, Credit Suisse estimates, Technomic

19 December 2017
McDonald's Corp (MCD) 12
Figure 12: EBIT impact from 1% change in US same store sales and 100bps change in US company-operated margins: Here we show our calculations for earnings sensitivity to US sales and margins for key MCD competitors. Based on 2018E MCD WEN Burger King Jack in the Box Taco Bell KFC SONC Dunkin' Donuts Starbucks
Change in US system SSS 1.0% 1.0% 1.0% 1.0% 1.0% 1.0% 1.0% 1.0% 1.0%US company-operated revenues $2,644 $633 $97 $427 $825 $120 $264 $0 $13,500
Change in company revenue $26 $6 $1 $4 $8 $1 $3 $0 $135
Company flow-thru 50% 50% 50% 50% 50% 50% 50% 50% 55%
Change in company-operated profits $13 $3 $0 $2 $4 $1 $1 $0 $74
US franchise & license revenues $4,923 $597 $606 $421 $563 $233 $186 $631 $1,550
Change in franchise revenues $49 $6 $6 $4 $6 $2 $2 $6 $16
Franchise flow-thru 83% 84% 88% 52% 95% 92% 100% 92% 100%
Change in franchise profits $41 $5 $5 $2 $5 $2 $2 $6 $16
Total change in profits (pre-tax) $54 $8 $6 $4 $9 $3 $3 $6 $90
PARENT COMPANY TICKER MCD WEN QSR JACK YUM YUM SONC DNKN SBUXConsolidated EBIT (2018E) $8,994 $308 $2,081 $258 $1,864 $1,864 $113 $464 $4,904
% change in consol. EBIT 0.6% 2.7% 0.3% 1.7% 0.5% 0.1% 2.8% 1.3% 1.8%
Change in US company-op margin (bps) 100 100 100 100 100 100 100 100 100US company-operated revenues $2,644 $633 $97 $427 $825 $120 $264 $0 $13,500
Change in company-op profits $26 $6 $1 $4 $8 $1 $3 $0 $135
% change in consol. EBIT 0.3% 2.1% 0.0% 1.7% 0.4% 0.1% 2.3% 0.0% 2.8%
Combined 1% SSS + 100bps margin impact to EBIT 0.9% 4.7% 0.3% 3.3% 1.0% 0.2% 5.2% 1.3% 4.6%
Source: Company data, Credit Suisse estimates
Figure 13: EBIT impact from 1% change in US same store sales: Below we rank the EBIT impact from each 1% change in US same store sales as calculated above.
2.8%2.7%
1.8%1.7%
1.3%
0.7% 0.6%
0.3%
0.0%
1.0%
2.0%
3.0%
SONC WEN SBUX JACK DNKN YUM MCD QSR
% change in consol. EBIT from 1% US system SSS
Source: Company data, Credit Suisse estimates

19 December 2017
McDonald's Corp (MCD) 13
Figure 14: EBIT impact from 100bps change in company-operated restaurant margin
2.8%
2.3%
2.1%
1.7%
0.5%0.3%
0.0% 0.0%0.0%
1.0%
2.0%
3.0%
SBUX SONC WEN JACK YUM MCD QSR DNKN
% change in consol. EBIT from 100bps US co-op margins
Source: Company data, Credit Suisse estimates
Figure 15: Combined EBIT impact from 1% change in US SSS + 100bps change in restaurant margin
5.2%
4.7% 4.6%
3.3%
1.3% 1.2%0.9%
0.3%
0.0%
1.0%
2.0%
3.0%
4.0%
5.0%
6.0%
SONC WEN SBUX JACK DNKN YUM MCD QSR
% change in consol. EBIT from 1% US sames store sales + 100bps US co-op margins
Source: Company data, Credit Suisse estimates
19 December 2017
McDonald's Corp (MCD) 14
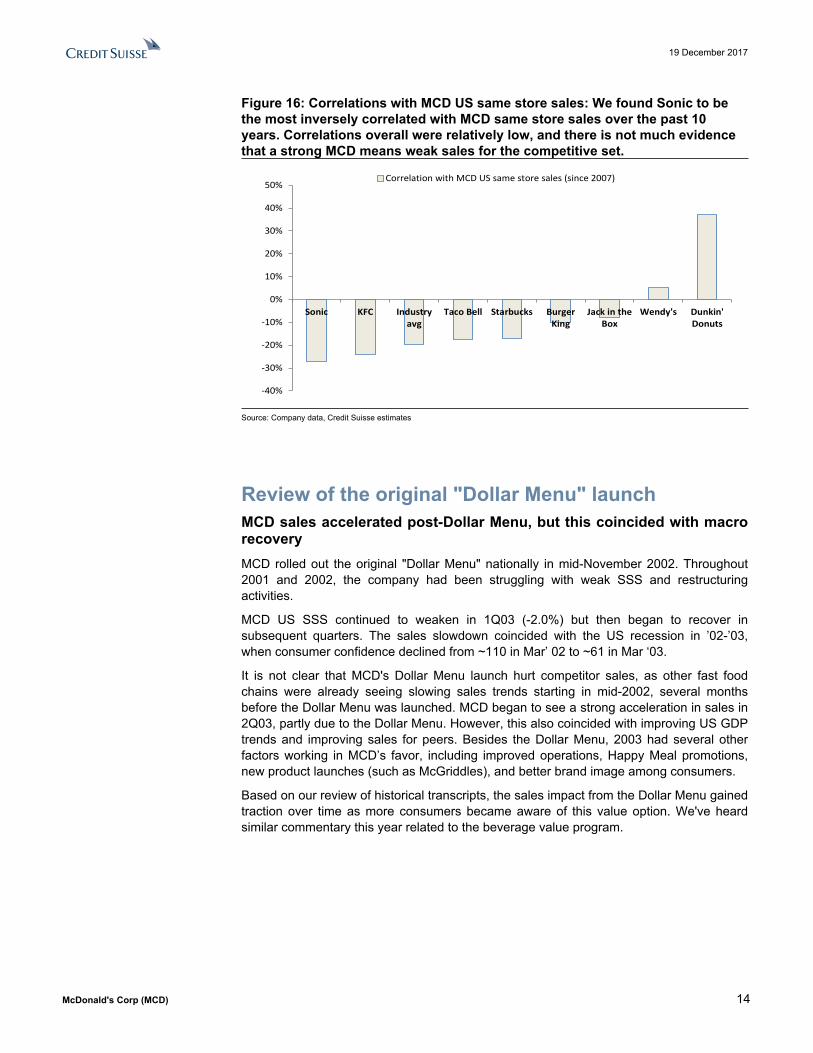
Figure 16: Correlations with MCD US same store sales: We found Sonic to be the most inversely correlated with MCD same store sales over the past 10 years. Correlations overall were relatively low, and there is not much evidence that a strong MCD means weak sales for the competitive set.
-40%
-30%
-20%
-10%
0%
10%
20%
30%
40%
50%
Sonic KFC Industryavg
Taco Bell Starbucks BurgerKing
Jack in theBox
Wendy's Dunkin'Donuts
Correlation with MCD US same store sales (since 2007)
Source: Company data, Credit Suisse estimates
Review of the original "Dollar Menu" launchMCD sales accelerated post-Dollar Menu, but this coincided with macro recoveryMCD rolled out the original "Dollar Menu" nationally in mid-November 2002. Throughout 2001 and 2002, the company had been struggling with weak SSS and restructuring activities.
MCD US SSS continued to weaken in 1Q03 (-2.0%) but then began to recover in subsequent quarters. The sales slowdown coincided with the US recession in ’02-’03, when consumer confidence declined from ~110 in Mar’ 02 to ~61 in Mar ‘03.
It is not clear that MCD's Dollar Menu launch hurt competitor sales, as other fast food chains were already seeing slowing sales trends starting in mid-2002, several months before the Dollar Menu was launched. MCD began to see a strong acceleration in sales in 2Q03, partly due to the Dollar Menu. However, this also coincided with improving US GDP trends and improving sales for peers. Besides the Dollar Menu, 2003 had several other factors working in MCD’s favor, including improved operations, Happy Meal promotions, new product launches (such as McGriddles), and better brand image among consumers.
Based on our review of historical transcripts, the sales impact from the Dollar Menu gained traction over time as more consumers became aware of this value option. We've heard similar commentary this year related to the beverage value program.

19 December 2017
McDonald's Corp (MCD) 15
Figure 17: MCD launched the Dollar Menu nationally in Nov 2002. Sales continued to weaken in 1Q03 (to -2.0%) then began to recovery sharply in subsequent quarters (along with the economy overall).
-10%
-5%
0%
5%
10%
15%
1Q01 2Q01 3Q01 4Q01 1Q02 2Q02 3Q02 4Q02 1Q03 2Q03 3Q03 4Q03 1Q04 2Q04 3Q04 4Q04
MCD Wendy's Taco Bell Arby's
MCD introduces $1 value menu nationally in mid-Nov '02
Source: Company data, Credit Suisse estimates
Positive franchisee checks in 4QRaising 4Q17 US same store sales to +5.0% (from +3.7%)Our recent franchisee checks (across several US regions) point to continued same store sales (SSS) momentum so far in 4Q. We're raising our 4Q US SSS estimate to +5.0% from +3.7% (consensus = +4.3%). We note that this implies a slowdown in the 2-yr. trend to +3.7% in 4Q17 from ~+5-6% in 2Q-3Q17. However, this trend is somewhat skewed by the lap of All-Day Breakfast in 4Q16. Looking at the 3-yr. trend, we are now modeling 4Q17E at +9.4%, up from +6.3% in 3Q17 and +3.7% in 2Q17.
In explaining the strong sales, franchisees cited new product launches (e.g., chicken tenders, Signature sandwiches), continued support from beverage value ($1 sodas/$2 premium coffee), improved operations, and overall brand momentum. However, franchisees noted that SSS are largely being driven by higher check, rather than traffic.
Most franchisees believe the new 1, 2, 3 value menu will help drive traffic, but are somewhat concerned around potential impact to check and margins.
In light of recent sales momentum and the upcoming value menu launch, we've raised our 1Q18 US SSS estimate to +3.5% from +3.0%. SSS should also begin to see some benefit from the rollout of delivery, which is expected to be available in 5,000 US restaurants by yearend 2017, up from essentially zero going into 1Q17.
Our 2017 EPS moves up by 1c, to $6.50. Our model does not yet factor in any impact from tax reform.

19 December 2017
McDonald's Corp (MCD) 16
Valuation SummaryFigure 18: MCD NTM P/E is at its 5-yr. high of 25.0x (vs. its 5-yr. avg. of 19.1x).
12.0x
14.0x
16.0x
18.0x
20.0x
22.0x
24.0x
26.0x
Dec
-12
Mar
-13
Jun-
13
Sep-
13
Dec
-13
Mar
-14
Jun-
14
Sep-
14
Dec
-14
Mar
-15
Jun-
15
Sep-
15
Dec
-15
Mar
-16
Jun-
16
Sep-
16
Dec
-16
Mar
-17
Jun-
17
Sep-
17
Dec
-17
MCD NTM P/E 5-yr. avg. = 19.1x
Source: Company data, Credit Suisse estimates, Thomson Reuters
Figure 19: MCD NTM P/E rel. to S&P500 is currently ~133% (vs. its 118% 5-yr. avg.)
80%
100%
120%
140%
160%
Dec
-12
Mar
-13
Jun-
13
Sep-
13
Dec
-13
Mar
-14
Jun-
14
Sep-
14
Dec
-14
Mar
-15
Jun-
15
Sep-
15
Dec
-15
Mar
-16
Jun-
16
Sep-
16
Dec
-16
Mar
-17
Jun-
17
Sep-
17
Dec
-17
MCD NTM P/E rel. to S&P 500 5-yr. avg. = 118%
Source: Company data, Credit Suisse estimates, Thomson Reuters
19 December 2017
McDonald's Corp (MCD) 17
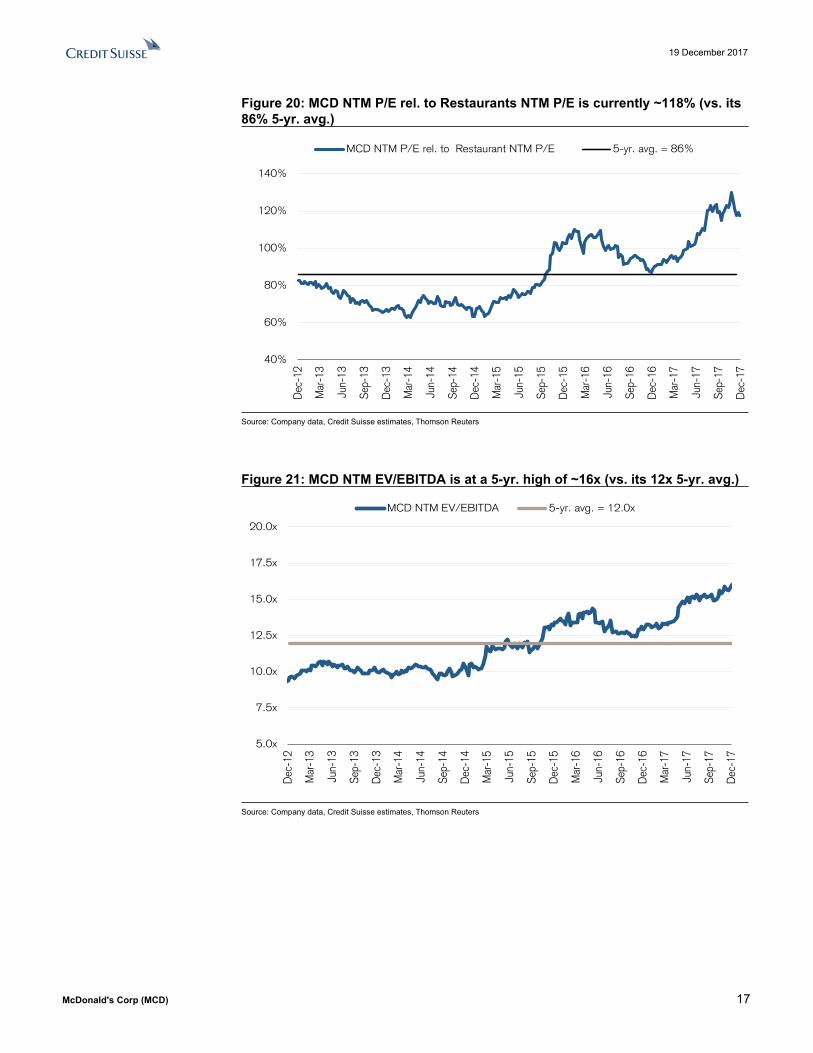
Figure 20: MCD NTM P/E rel. to Restaurants NTM P/E is currently ~118% (vs. its 86% 5-yr. avg.)
40%
60%
80%
100%
120%
140%
Dec
-12
Mar
-13
Jun-
13
Sep-
13
Dec
-13
Mar
-14
Jun-
14
Sep-
14
Dec
-14
Mar
-15
Jun-
15
Sep-
15
Dec
-15
Mar
-16
Jun-
16
Sep-
16
Dec
-16
Mar
-17
Jun-
17
Sep-
17
Dec
-17
MCD NTM P/E rel. to Restaurant NTM P/E 5-yr. avg. = 86%
Source: Company data, Credit Suisse estimates, Thomson Reuters
Figure 21: MCD NTM EV/EBITDA is at a 5-yr. high of ~16x (vs. its 12x 5-yr. avg.)
5.0x
7.5x
10.0x
12.5x
15.0x
17.5x
20.0x
Dec
-12
Mar
-13
Jun-
13
Sep-
13
Dec
-13
Mar
-14
Jun-
14
Sep-
14
Dec
-14
Mar
-15
Jun-
15
Sep-
15
Dec
-15
Mar
-16
Jun-
16
Sep-
16
Dec
-16
Mar
-17
Jun-
17
Sep-
17
Dec
-17
MCD NTM EV/EBITDA 5-yr. avg. = 12.0x
Source: Company data, Credit Suisse estimates, Thomson Reuters

19 December 2017
McDonald's Corp (MCD) 18
Figure 22: MCD NTM EV/EBITDA relative to Restaurant NTM EV/EBITDA has dipped slightly from its 5-yr. high of ~160% (vs. its 5-yr. avg. if ~110%).
50%
75%
100%
125%
150%
175%
Dec-
12
Mar
-13
Jun-
13
Sep-
13
Dec-
13
Mar
-14
Jun-
14
Sep-
14
Dec-
14
Mar
-15
Jun-
15
Sep-
15
Dec-
15
Mar
-16
Jun-
16
Sep-
16
Dec-
16
Mar
-17
Jun-
17
Sep-
17
Dec-
17
MCD NTM EV/EBITDA rel. to Restaurants NTM EV/EBITDA 5-yr. avg. = 110%
Source: Company data, Credit Suisse estimates, Thomson Reuters
Figure 23: CS MCD Model: Income StatementFiscal year ending December (in millions) 2013 2014 2015 1Q16 2Q16 3Q16 4Q16 2016 1Q17 2Q17 3Q17 4Q17E 2017E 2018E
Company-operated revenue $18,874 $18,169 $16,488 $3,754 $3,917 $3,972 $3,653 $15,295 $3,412 $3,570 $3,064 $2,569 $12,615 $9,277Franchised and affi l iated restaurants $9,232 $9,272 $8,925 $2,150 $2,348 $2,452 $2,376 $9,327 $2,264 $2,480 $2,690 $2,655 $10,089 $10,978
Total Net Revenues $28,106 $27,441 $25,413 $5,904 $6,265 $6,424 $6,029 $24,622 $5,676 $6,050 $5,755 $5,225 $22,705 $20,254
Food & paper $6,360 $6,131 $5,553 $1,224 $1,245 $1,263 $1,165 $4,897 $1,088 $1,139 $962 $807 $3,996 $2,936Payroll & employee benefits $4,823 $4,754 $4,401 $1,040 $1,061 $1,037 $997 $4,135 $949 $964 $846 $753 $3,511 $2,646Occupancy & other operating expenses $4,391 $4,402 $4,021 $912 $940 $941 $873 $3,666 $778 $800 $671 $554 $2,802 $1,982Other $4 $1 $2 $0 $1 -$2 $0 $0 $2 $1 $1 $0 $4 $2
Company-operated restaurant expenses $15,579 $15,288 $13,977 $3,175 $3,248 $3,240 $3,036 $12,699 $2,816 $2,903 $2,480 $2,114 $10,313 $7,567Restaurant profit $3,296 $2,881 $2,511 $578 $669 $733 $617 $2,596 $596 $666 $585 $456 $2,302 $1,710
Franchised occupancy expenses $1,624 $1,697 $1,647 $415 $431 $438 $435 $1,718 $430 $438 $457 $462 $1,787 $1,892SG&A $2,386 $2,488 $2,434 $578 $596 $583 $628 $2,385 $521 $525 $567 $620 $2,233 $2,090Other operating expenses, net -$247 $19 $34 -$45 -$98 -$101 -$38 -$282 -$126 -$112 -$90 -$50 -$378 -$305Total operating expenses $19,341 $19,492 $18,093 $4,124 $4,177 $4,159 $4,060 $16,519 $3,642 $3,755 $3,414 $3,145 $13,956 $11,244Operating Income, ex-items $8,764 $7,949 $7,275 $1,780 $2,088 $2,265 $1,969 $8,103 $2,034 $2,295 $2,340 $2,079 $8,749 $9,010EBITDA, ex-items $10,349 $9,594 $8,830 $2,164 $2,471 $2,636 $2,348 $9,619 $2,359 $2,635 $2,696 $2,436 $10,126 $10,304
Interest expense $522 $571 $638 $218 $224 $221 $221 $885 $219 $231 $237 $240 $926 $973Non operating expense $38 $7 -$49 -$14 -$16 $11 $13 -$6 $8 $3 $23 -$2 $32 -$10Pretax Income, ex-items $8,205 $7,372 $6,685 $1,576 $1,880 $2,033 $1,735 $7,224 $1,808 $2,061 $2,081 $1,842 $7,791 $8,047
Taxes $2,619 $2,614 $2,034 $478 $617 $662 $542 $2,299 $593 $666 $645 $589 $2,493 $2,575Net Income, ex-items $5,586 $4,758 $4,697 $1,099 $1,263 $1,370 $1,193 $4,925 $1,215 $1,395 $1,436 $1,252 $5,298 $5,472
Average Shares Outstanding - Diluted 1,006 987 944 895 871 848 830 861 825 819 814 803 815 791Diluted EPS ex-items $5.55 $4.82 $4.97 $1.23 $1.45 $1.62 $1.44 $5.72 $1.47 $1.70 $1.76 $1.56 $6.50 $6.92
Margins 2013 2014 2015 1Q16 2Q16 3Q16 4Q16 2016 1Q17 2Q17 3Q17 4Q17E 2017E 2018EFood & paper 33.7% 33.7% 33.7% 32.6% 31.8% 31.8% 31.9% 32.0% 31.9% 31.9% 31.4% 31.4% 31.7% 31.7%Payroll & employee benefits 25.6% 26.2% 26.7% 27.7% 27.1% 26.1% 27.3% 27.0% 27.8% 27.0% 27.6% 29.3% 27.8% 28.5%Occupancy & other operating expenses 23.3% 24.2% 24.4% 24.3% 24.0% 23.7% 23.9% 24.0% 22.8% 22.4% 21.9% 21.6% 22.2% 21.4%
Restaurant margin 17.5% 15.9% 15.2% 15.4% 17.1% 18.4% 16.9% 17.0% 17.5% 18.7% 19.1% 17.7% 18.2% 18.4%Franchised margin 82.4% 81.7% 81.5% 80.7% 81.7% 82.2% 81.7% 81.6% 81.0% 82.3% 83.0% 82.6% 82.3% 82.8%SG&A 8.5% 9.1% 9.6% 9.8% 9.5% 9.1% 10.4% 9.7% 9.2% 8.7% 9.9% 11.9% 9.8% 10.3%Operating margin, ex-items 31.2% 29.0% 28.6% 30.2% 33.3% 35.3% 32.7% 32.9% 35.8% 37.9% 40.7% 39.8% 38.5% 44.5%EBITDA margin, ex-items 36.8% 35.0% 34.7% 36.7% 39.4% 41.0% 38.9% 39.1% 41.6% 43.5% 46.9% 46.6% 44.6% 50.9%Tax Rate 31.9% 35.5% 30.4% 30.3% 32.8% 32.6% 31.2% 31.8% 32.8% 32.3% 31.0% 32.0% 32.0% 32.0%Net margin, ex-items 19.9% 17.3% 18.5% 18.6% 20.2% 21.3% 19.8% 20.0% 21.4% 23.1% 24.9% 24.0% 23.3% 27.0%
Key growth rates (y/y % change) 2013 2014 2015 1Q16 2Q16 3Q16 4Q16 2016 1Q17 2Q17 3Q17 4Q17E 2017E 2018ECompany-operated revenue 1.5% -3.7% -9.3% -4.1% -8.1% -7.3% -9.4% -7.2% -9.1% -8.9% -22.9% -29.7% -17.5% -26.5%Franchised and affi l iated revenue 3.0% 0.4% -3.7% 5.2% 5.0% 5.1% 2.8% 4.5% 5.3% 5.6% 9.7% 11.7% 8.2% 8.8%Total revenue 2.0% -2.4% -7.4% -0.9% -3.6% -2.9% -4.9% -3.1% -3.9% -3.4% -10.4% -13.3% -7.8% -10.8%Company-operated restaurant expenses 2.3% -1.9% -8.6% -5.3% -9.7% -10.2% -11.2% -9.1% -11.3% -10.6% -23.5% -30.4% -18.8% -26.6%Franchised occupancy expense 6.4% 4.5% -3.0% 2.8% 4.8% 5.2% 4.5% 4.3% 3.6% 1.6% 4.5% 6.2% 4.0% 5.9%SG&A -2.8% 4.3% -2.2% -0.8% 0.6% -0.2% -7.1% -2.0% -9.8% -11.9% -2.7% -1.3% -6.3% -6.4%Operating income, ex-items 1.9% -9.3% -8.5% 12.6% 10.2% 11.6% 8.5% 11.4% 14.3% 9.9% 3.3% 5.6% 8.0% 3.0%EBITDA, ex-items 2.5% -7.3% -8.0% 10.0% 8.1% 9.0% 6.5% 8.9% 9.0% 6.6% 2.3% 3.7% 5.3% 1.8%Net income, ex-items 2.2% -14.8% -1.3% 12.6% 2.4% 4.7% 1.3% 4.9% 10.6% 10.5% 4.8% 4.9% 7.6% 3.3%Diluted share count -1.4% -1.9% -4.3% -7.3% -9.0% -9.3% -9.8% -8.8% -7.8% -6.0% -4.0% -3.3% -5.3% -3.0%Diluted EPS, ex-items 3.7% -13.2% 3.1% 21.5% 12.5% 15.4% 12.3% 15.0% 19.9% 17.5% 9.2% 8.5% 13.6% 6.5%
Source: Company data, Credit Suisse estimates

19 December 2017
McDonald's Corp (MCD) 19
Figure 24: MCD Restaurant Counts, Same Store Sales and Cash Flow SummaryRestaurant counts (systemwide) 2013 2014 2015 1Q16 2Q16 3Q16 4Q16 2016 1Q17 2Q17 3Q17 4Q17E 2017E 2018EUS 14,278 14,350 14,259 14,219 14,186 14,177 14,155 14,155 14,094 14,079 14,063 14,068 14,068 14,018y/y 0.9% 0.5% -0.6% -0.8% -0.9% -0.9% -0.7% -0.7% -0.9% -0.8% -0.8% -0.6% -0.6% -0.4%International Lead 6,604 6,717 6,802 6,800 6,795 6,808 6,851 6,851 6,850 6,871 6,883 6,983 6,983 7,108y/y 1.8% 1.7% 1.3% 1.3% 1.0% 1.2% 0.7% 0.7% 0.7% 1.1% 1.1% 1.9% 1.9% 1.8%High Growth 4,639 5,031 5,266 5,266 5,301 5,370 5,552 5,552 5,589 5,653 5,740 5,765 5,765 6,045y/y 10.4% 8.5% 4.7% 3.8% 3.4% 4.3% 5.4% 5.4% 6.1% 6.6% 6.9% 3.8% 3.8% 4.9%Foundational 9,908 10,160 10,198 10,182 10,222 10,260 10,341 10,341 10,372 10,408 10,290 10,365 10,365 10,465y/y 2.8% 2.5% 0.4% 0.2% 0.3% 0.5% 1.4% 1.4% 1.9% 1.8% 0.3% 0.2% 0.2% 1.0%Global 35,429 36,258 36,525 36,467 36,504 36,615 36,899 36,899 36,905 37,011 36,976 37,181 37,181 37,636y/y 2.8% 2.3% 0.7% 0.5% 0.4% 0.6% 1.0% 1.0% 1.2% 1.4% 1.0% 0.8% 0.8% 1.2%
Same store sales (systemwide) 2013 2014 2015 1Q16 2Q16 3Q16 4Q16 2016 1Q17 2Q17 3Q17 4Q17E 2017E 2018EUS -0.2% -2.1% 0.5% 5.4% 1.8% 1.3% -1.3% 1.7% 1.7% 3.9% 4.1% 4.5% 3.6% 2.8%International Lead 0.2% 0.8% 3.4% 5.2% 2.6% 3.3% 2.8% 3.4% 2.8% 6.3% 5.7% 4.5% 4.8% 3.0%High Growth -0.6% -2.8% 1.8% 3.6% 1.6% 1.5% 4.7% 2.8% 3.8% 7.0% 6.2% 3.5% 5.1% 3.5%Foundational 1.5% -0.1% 0.8% 11.0% 7.7% 10.1% 11.1% 10.0% 10.7% 13.0% 10.2% 6.0% 10.0% 3.5%Global 0.2% -1.0% 1.5% 6.2% 3.1% 3.5% 2.7% 3.8% 4.0% 6.6% 6.0% 4.7% 5.3% 3.1%
Cash flow metrics 2013 2014 2015 1Q16 2Q16 3Q16 4Q16 2016 1Q17 2Q17 3Q17 4Q17E 2017E 2018EOperating cash flow $7,121 $6,730 $6,539 $1,719 $1,248 $2,251 $1,539 $6,060 $1,544 $1,213 $1,685 $1,838 $6,280 $6,882Capex -$2,825 -$2,583 -$1,814 -$392 -$353 -$405 -$672 -$1,821 -$428 -$369 -$417 -$487 -$1,700 -$2,000Share buybacks -$1,778 -$3,199 -$6,099 -$4,312 -$3,381 -$1,970 -$1,509 -$11,171 -$748 -$1,108 -$2,082 -$2,000 -$5,937 -$4,150Dividends -$3,115 -$3,216 -$3,230 -$781 -$759 -$745 -$773 -$3,058 -$771 -$762 -$755 -$811 -$3,098 -$3,250Free cash flow (OCF - capex) $4,296 $4,147 $4,725 $1,327 $896 $1,846 $867 $4,239 $1,116 $845 $1,268 $1,352 $4,580 $4,882
Source: Company data, Credit Suisse estimates
Figure 25: CS MCD Model: Segment ForecastsOperating income 2013 2014 2015 1Q16 2Q16 3Q16 4Q16 2016 1Q17 2Q17 3Q17 4Q17E 2017E 2018ECompany operated
US $830 $756 $632 $137 $164 $154 $163 $618 $128 $140 $124 $133 $526 $419International Lead $1,078 $1,080 $961 $208 $228 $238 $213 $886 $189 $219 $236 $209 $852 $748High-Growth $1,019 $780 $659 $169 $209 $245 $173 $796 $230 $264 $196 $92 $781 $456Foundational $368 $264 $259 $64 $68 $96 $68 $296 $48 $44 $29 $22 $143 $86
Total Company operated $3,296 $2,881 $2,511 $578 $669 $733 $617 $2,596 $596 $666 $585 $456 $2,302 $1,709Franchised and affiliated
US $3,626 $3,572 $3,606 $865 $953 $961 $946 $3,726 $892 $992 $1,015 $1,000 $3,899 $4,083International Lead $2,430 $2,486 $2,254 $535 $595 $635 $597 $2,363 $558 $640 $730 $697 $2,625 $2,945High-Growth $531 $555 $520 $121 $135 $150 $144 $550 $133 $158 $203 $200 $694 $910Foundational $1,021 $962 $898 $214 $235 $268 $255 $970 $251 $252 $286 $296 $1,084 $1,156
Total Franchised and affiliated $7,607 $7,575 $7,278 $1,735 $1,918 $2,014 $1,941 $7,609 $1,834 $2,042 $2,233 $2,193 $8,302 $9,094
Operating income growth (y/y) 2013 2014 2015 1Q16 2Q16 3Q16 4Q16 2016 1Q17 2Q17 3Q17 4Q17E 2017E 2018ECompany operated
US -5.9% -8.9% -16.4% -9.5% -7.6% 16.4% -4.8% -2.3% -6.4% -14.5% -19.3% -18.3% -14.9% -20.3%International Lead -1.8% 0.2% -11.0% -4.5% -7.3% -7.4% -11.7% -7.8% -9.0% -4.0% -1.0% -2.1% -3.9% -12.2%High-Growth 0.1% -23.4% -15.6% 21.5% 16.2% 18.2% 30.9% 20.9% 36.0% 26.3% -20.3% -47.0% -1.9% -41.6%Foundational -3.2% -28.2% -1.9% 24.1% 9.8% 21.5% 1.7% 14.1% -25.3% -35.9% -69.4% -67.4% -51.6% -40.3%
Total Company operated -2.5% -12.6% -12.8% 3.3% 0.6% 8.5% 0.9% 3.4% 3.0% -0.3% -20.2% -26.1% -11.3% -25.8%
Franchised and affiliatedUS 0.9% -1.5% 0.9% 7.7% 4.5% 2.6% -0.8% 3.3% 3.1% 4.1% 5.6% 5.7% 4.6% 4.7%International Lead 3.2% 2.3% -9.3% 4.6% 5.4% 6.5% 2.7% 4.8% 4.2% 7.5% 14.8% 16.8% 11.1% 12.2%High-Growth 8.2% 4.4% -6.3% 3.8% 4.7% 6.9% 7.6% 5.8% 10.1% 17.2% 35.3% 39.0% 26.3% 31.0%Foundational 2.2% -5.7% -6.7% 2.1% 6.3% 10.5% 12.6% 8.1% 17.4% 7.4% 6.7% 16.2% 11.7% 6.6%
Total Franchised and affiliated 2.3% -0.4% -3.9% 5.7% 5.0% 5.1% 2.4% 4.5% 5.7% 6.5% 10.9% 13.0% 9.1% 9.5%
Segment margins 2013 2014 2015 1Q16 2Q16 3Q16 4Q16 2016 1Q17 2Q17 3Q17 4Q17E 2017E 2018ECo.-operated restaurant margins
US 18.4% 17.4% 15.1% 14.2% 16.8% 16.9% 18.3% 16.5% 15.3% 16.5% 15.6% 17.3% 16.2% 15.8%International Lead 19.6% 19.8% 20.0% 19.7% 20.7% 21.7% 20.7% 20.7% 20.1% 21.4% 21.9% 21.0% 21.1% 21.3%High-Growth 16.1% 12.9% 12.1% 13.4% 15.4% 17.0% 13.1% 14.8% 17.1% 18.1% 18.5% 13.3% 17.2% 17.1%Foundational 14.6% 11.5% 12.7% 13.7% 14.1% 18.3% 16.1% 15.6% 16.6% 18.3% 21.8% 18.1% 18.2% 19.4%
Total Company operated 17.5% 15.9% 15.2% 15.4% 17.1% 18.4% 16.9% 17.0% 17.5% 18.7% 19.1% 17.7% 18.2% 18.4%
Franchised and affiliated marginsUS 83.6% 83.1% 82.7% 82.1% 83.1% 82.7% 82.5% 82.6% 81.6% 82.8% 82.9% 82.7% 82.5% 82.7%International Lead 80.4% 80.1% 80.0% 79.1% 80.1% 81.2% 80.3% 80.2% 79.5% 80.8% 82.7% 80.7% 80.7% 81.4%High-Growth 73.6% 71.7% 71.1% 68.2% 69.8% 71.5% 71.2% 70.2% 69.4% 71.9% 76.0% 76.2% 73.7% 76.7%Foundational 88.9% 87.7% 88.4% 88.1% 88.5% 89.9% 89.7% 89.1% 90.7% 93.5% 93.8% 92.7% 92.7% 93.5%
Total Franchised and affiliated 82.4% 81.7% 81.5% 80.7% 81.7% 82.2% 81.7% 81.6% 81.0% 82.3% 83.0% 82.6% 82.3% 82.8%
Operating income mix (by region) 2013 2014 2015 1Q16 2Q16 3Q16 4Q16 2016 1Q17 2Q17 3Q17 4Q17E 2017E 2018EUS 40.9% 41.4% 43.3% 43.3% 43.2% 40.6% 43.4% 42.6% 42.0% 41.8% 40.4% 42.8% 41.7% 41.7%International Lead 32.2% 34.1% 32.9% 32.1% 31.8% 31.8% 31.7% 31.8% 30.8% 31.7% 34.3% 34.2% 32.8% 34.2%High-Growth 14.2% 12.8% 12.0% 12.5% 13.3% 14.4% 12.4% 13.2% 15.0% 15.6% 14.1% 11.0% 13.9% 12.6%Foundational 12.7% 11.7% 11.8% 12.0% 11.7% 13.2% 12.6% 12.4% 12.3% 10.9% 11.2% 12.0% 11.6% 11.5%
Source: Company data, Credit Suisse estimates
19 December 2017
McDonald's Corp (MCD) 20
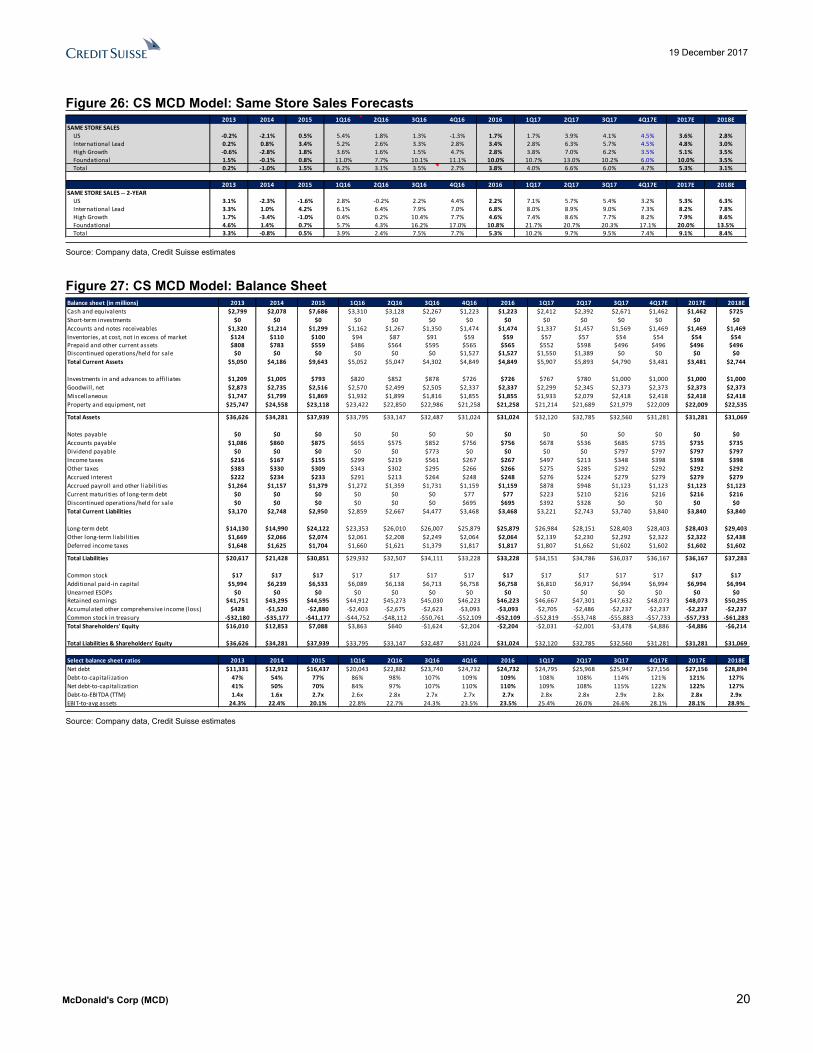
Figure 26: CS MCD Model: Same Store Sales Forecasts2013 2014 2015 1Q16 2Q16 3Q16 4Q16 2016 1Q17 2Q17 3Q17 4Q17E 2017E 2018E
SAME STORE SALESUS -0.2% -2.1% 0.5% 5.4% 1.8% 1.3% -1.3% 1.7% 1.7% 3.9% 4.1% 4.5% 3.6% 2.8%International Lead 0.2% 0.8% 3.4% 5.2% 2.6% 3.3% 2.8% 3.4% 2.8% 6.3% 5.7% 4.5% 4.8% 3.0%High Growth -0.6% -2.8% 1.8% 3.6% 1.6% 1.5% 4.7% 2.8% 3.8% 7.0% 6.2% 3.5% 5.1% 3.5%Foundational 1.5% -0.1% 0.8% 11.0% 7.7% 10.1% 11.1% 10.0% 10.7% 13.0% 10.2% 6.0% 10.0% 3.5%Total 0.2% -1.0% 1.5% 6.2% 3.1% 3.5% 2.7% 3.8% 4.0% 6.6% 6.0% 4.7% 5.3% 3.1%
2013 2014 2015 1Q16 2Q16 3Q16 4Q16 2016 1Q17 2Q17 3Q17 4Q17E 2017E 2018ESAME STORE SALES -- 2-YEAR
US 3.1% -2.3% -1.6% 2.8% -0.2% 2.2% 4.4% 2.2% 7.1% 5.7% 5.4% 3.2% 5.3% 6.3%International Lead 3.3% 1.0% 4.2% 6.1% 6.4% 7.9% 7.0% 6.8% 8.0% 8.9% 9.0% 7.3% 8.2% 7.8%High Growth 1.7% -3.4% -1.0% 0.4% 0.2% 10.4% 7.7% 4.6% 7.4% 8.6% 7.7% 8.2% 7.9% 8.6%Foundational 4.6% 1.4% 0.7% 5.7% 4.3% 16.2% 17.0% 10.8% 21.7% 20.7% 20.3% 17.1% 20.0% 13.5%Total 3.3% -0.8% 0.5% 3.9% 2.4% 7.5% 7.7% 5.3% 10.2% 9.7% 9.5% 7.4% 9.1% 8.4%
Source: Company data, Credit Suisse estimates
Figure 27: CS MCD Model: Balance SheetBalance sheet (in millions) 2013 2014 2015 1Q16 2Q16 3Q16 4Q16 2016 1Q17 2Q17 3Q17 4Q17E 2017E 2018ECash and equivalents $2,799 $2,078 $7,686 $3,310 $3,128 $2,267 $1,223 $1,223 $2,412 $2,392 $2,671 $1,462 $1,462 $725Short-term investments $0 $0 $0 $0 $0 $0 $0 $0 $0 $0 $0 $0 $0 $0Accounts and notes receiveables $1,320 $1,214 $1,299 $1,162 $1,267 $1,350 $1,474 $1,474 $1,337 $1,457 $1,569 $1,469 $1,469 $1,469Inventories, at cost, not in excess of market $124 $110 $100 $94 $87 $91 $59 $59 $57 $57 $54 $54 $54 $54Prepaid and other current assets $808 $783 $559 $486 $564 $595 $565 $565 $552 $598 $496 $496 $496 $496Discontinued operations/held for sale $0 $0 $0 $0 $0 $0 $1,527 $1,527 $1,550 $1,389 $0 $0 $0 $0Total Current Assets $5,050 $4,186 $9,643 $5,052 $5,047 $4,302 $4,849 $4,849 $5,907 $5,893 $4,790 $3,481 $3,481 $2,744
Investments in and advances to affi l iates $1,209 $1,005 $793 $820 $852 $878 $726 $726 $767 $780 $1,000 $1,000 $1,000 $1,000Goodwill, net $2,873 $2,735 $2,516 $2,570 $2,499 $2,505 $2,337 $2,337 $2,299 $2,345 $2,373 $2,373 $2,373 $2,373Miscellaneous $1,747 $1,799 $1,869 $1,932 $1,899 $1,816 $1,855 $1,855 $1,933 $2,079 $2,418 $2,418 $2,418 $2,418Property and equipment, net $25,747 $24,558 $23,118 $23,422 $22,850 $22,986 $21,258 $21,258 $21,214 $21,689 $21,979 $22,009 $22,009 $22,535
Total Assets $36,626 $34,281 $37,939 $33,795 $33,147 $32,487 $31,024 $31,024 $32,120 $32,785 $32,560 $31,281 $31,281 $31,069
Notes payable $0 $0 $0 $0 $0 $0 $0 $0 $0 $0 $0 $0 $0 $0Accounts payable $1,086 $860 $875 $655 $575 $852 $756 $756 $678 $536 $685 $735 $735 $735Dividend payable $0 $0 $0 $0 $0 $773 $0 $0 $0 $0 $797 $797 $797 $797Income taxes $216 $167 $155 $299 $219 $561 $267 $267 $497 $213 $348 $398 $398 $398Other taxes $383 $330 $309 $343 $302 $295 $266 $266 $275 $285 $292 $292 $292 $292Accrued interest $222 $234 $233 $291 $213 $264 $248 $248 $276 $224 $279 $279 $279 $279Accrued payroll and other l iabil ities $1,264 $1,157 $1,379 $1,272 $1,359 $1,731 $1,159 $1,159 $878 $948 $1,123 $1,123 $1,123 $1,123Current maturities of long-term debt $0 $0 $0 $0 $0 $0 $77 $77 $223 $210 $216 $216 $216 $216Discontinued operations/held for sale $0 $0 $0 $0 $0 $0 $695 $695 $392 $328 $0 $0 $0 $0Total Current Liabilities $3,170 $2,748 $2,950 $2,859 $2,667 $4,477 $3,468 $3,468 $3,221 $2,743 $3,740 $3,840 $3,840 $3,840
Long-term debt $14,130 $14,990 $24,122 $23,353 $26,010 $26,007 $25,879 $25,879 $26,984 $28,151 $28,403 $28,403 $28,403 $29,403Other long-term liabil ities $1,669 $2,066 $2,074 $2,061 $2,208 $2,249 $2,064 $2,064 $2,139 $2,230 $2,292 $2,322 $2,322 $2,438Deferred income taxes $1,648 $1,625 $1,704 $1,660 $1,621 $1,379 $1,817 $1,817 $1,807 $1,662 $1,602 $1,602 $1,602 $1,602
Total Liabilities $20,617 $21,428 $30,851 $29,932 $32,507 $34,111 $33,228 $33,228 $34,151 $34,786 $36,037 $36,167 $36,167 $37,283
Common stock $17 $17 $17 $17 $17 $17 $17 $17 $17 $17 $17 $17 $17 $17Additional paid-in capital $5,994 $6,239 $6,533 $6,089 $6,138 $6,713 $6,758 $6,758 $6,810 $6,917 $6,994 $6,994 $6,994 $6,994Unearned ESOPs $0 $0 $0 $0 $0 $0 $0 $0 $0 $0 $0 $0 $0 $0Retained earnings $41,751 $43,295 $44,595 $44,912 $45,273 $45,030 $46,223 $46,223 $46,667 $47,301 $47,632 $48,073 $48,073 $50,295Accumulated other comprehensive income (loss) $428 -$1,520 -$2,880 -$2,403 -$2,675 -$2,623 -$3,093 -$3,093 -$2,705 -$2,486 -$2,237 -$2,237 -$2,237 -$2,237Common stock in treasury -$32,180 -$35,177 -$41,177 -$44,752 -$48,112 -$50,761 -$52,109 -$52,109 -$52,819 -$53,748 -$55,883 -$57,733 -$57,733 -$61,283Total Shareholders' Equity $16,010 $12,853 $7,088 $3,863 $640 -$1,624 -$2,204 -$2,204 -$2,031 -$2,001 -$3,478 -$4,886 -$4,886 -$6,214
Total Liabilities & Shareholders' Equity $36,626 $34,281 $37,939 $33,795 $33,147 $32,487 $31,024 $31,024 $32,120 $32,785 $32,560 $31,281 $31,281 $31,069
Select balance sheet ratios 2013 2014 2015 1Q16 2Q16 3Q16 4Q16 2016 1Q17 2Q17 3Q17 4Q17E 2017E 2018ENet debt $11,331 $12,912 $16,437 $20,043 $22,882 $23,740 $24,732 $24,732 $24,795 $25,968 $25,947 $27,156 $27,156 $28,894Debt-to-capitalization 47% 54% 77% 86% 98% 107% 109% 109% 108% 108% 114% 121% 121% 127%Net debt-to-capitalization 41% 50% 70% 84% 97% 107% 110% 110% 109% 108% 115% 122% 122% 127%Debt-to-EBITDA (TTM) 1.4x 1.6x 2.7x 2.6x 2.8x 2.7x 2.7x 2.7x 2.8x 2.8x 2.9x 2.8x 2.8x 2.9xEBIT-to-avg assets 24.3% 22.4% 20.1% 22.8% 22.7% 24.3% 23.5% 23.5% 25.4% 26.0% 26.6% 28.1% 28.1% 28.9%
Source: Company data, Credit Suisse estimates
19 December 2017
McDonald's Corp (MCD) 21
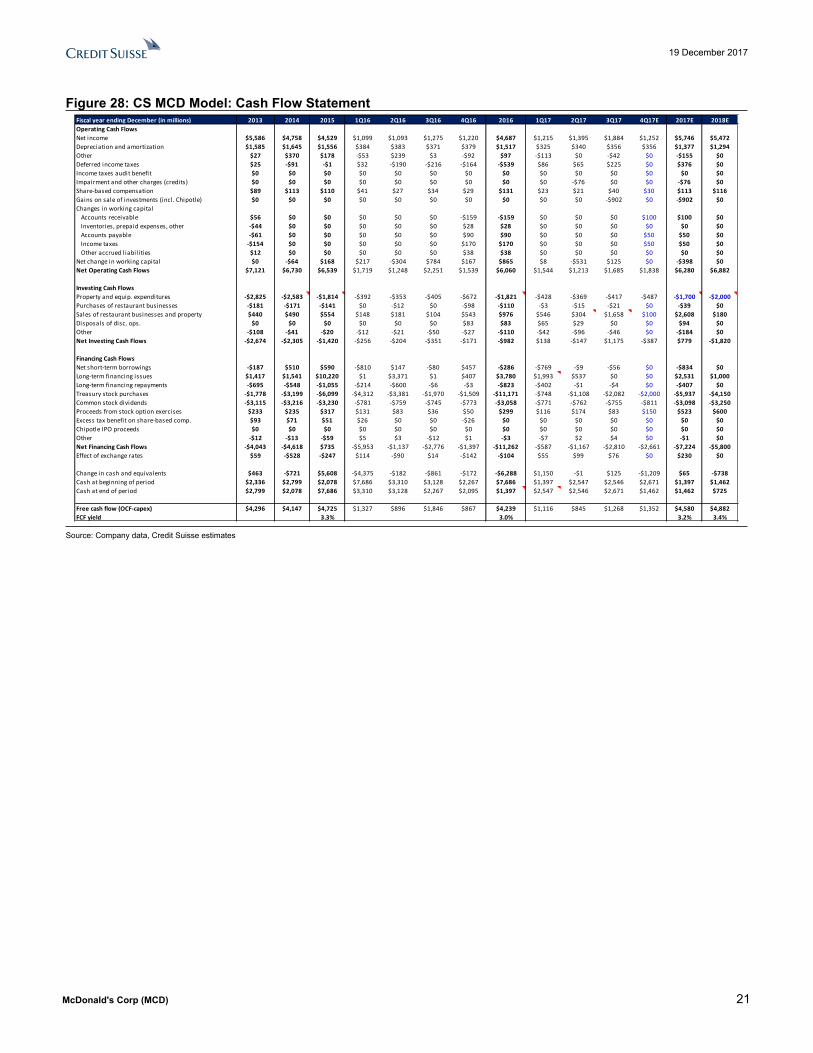
Figure 28: CS MCD Model: Cash Flow StatementFiscal year ending December (in millions) 2013 2014 2015 1Q16 2Q16 3Q16 4Q16 2016 1Q17 2Q17 3Q17 4Q17E 2017E 2018EOperating Cash FlowsNet income $5,586 $4,758 $4,529 $1,099 $1,093 $1,275 $1,220 $4,687 $1,215 $1,395 $1,884 $1,252 $5,746 $5,472Depreciation and amortization $1,585 $1,645 $1,556 $384 $383 $371 $379 $1,517 $325 $340 $356 $356 $1,377 $1,294Other $27 $370 $178 -$53 $239 $3 -$92 $97 -$113 $0 -$42 $0 -$155 $0Deferred income taxes $25 -$91 -$1 $32 -$190 -$216 -$164 -$539 $86 $65 $225 $0 $376 $0Income taxes audit benefit $0 $0 $0 $0 $0 $0 $0 $0 $0 $0 $0 $0 $0 $0Impairment and other charges (credits) $0 $0 $0 $0 $0 $0 $0 $0 $0 -$76 $0 $0 -$76 $0Share-based compensation $89 $113 $110 $41 $27 $34 $29 $131 $23 $21 $40 $30 $113 $116Gains on sale of investments (incl. Chipotle) $0 $0 $0 $0 $0 $0 $0 $0 $0 $0 -$902 $0 -$902 $0Changes in working capital Accounts receivable $56 $0 $0 $0 $0 $0 -$159 -$159 $0 $0 $0 $100 $100 $0 Inventories, prepaid expenses, other -$44 $0 $0 $0 $0 $0 $28 $28 $0 $0 $0 $0 $0 $0 Accounts payable -$61 $0 $0 $0 $0 $0 $90 $90 $0 $0 $0 $50 $50 $0 Income taxes -$154 $0 $0 $0 $0 $0 $170 $170 $0 $0 $0 $50 $50 $0 Other accrued liabil ities $12 $0 $0 $0 $0 $0 $38 $38 $0 $0 $0 $0 $0 $0Net change in working capital $0 -$64 $168 $217 -$304 $784 $167 $865 $8 -$531 $125 $0 -$398 $0Net Operating Cash Flows $7,121 $6,730 $6,539 $1,719 $1,248 $2,251 $1,539 $6,060 $1,544 $1,213 $1,685 $1,838 $6,280 $6,882
Investing Cash FlowsProperty and equip. expenditures -$2,825 -$2,583 -$1,814 -$392 -$353 -$405 -$672 -$1,821 -$428 -$369 -$417 -$487 -$1,700 -$2,000Purchases of restaurant businesses -$181 -$171 -$141 $0 -$12 $0 -$98 -$110 -$3 -$15 -$21 $0 -$39 $0Sales of restaurant businesses and property $440 $490 $554 $148 $181 $104 $543 $976 $546 $304 $1,658 $100 $2,608 $180Disposals of disc. ops. $0 $0 $0 $0 $0 $0 $83 $83 $65 $29 $0 $0 $94 $0Other -$108 -$41 -$20 -$12 -$21 -$50 -$27 -$110 -$42 -$96 -$46 $0 -$184 $0Net Investing Cash Flows -$2,674 -$2,305 -$1,420 -$256 -$204 -$351 -$171 -$982 $138 -$147 $1,175 -$387 $779 -$1,820
Financing Cash FlowsNet short-term borrowings -$187 $510 $590 -$810 $147 -$80 $457 -$286 -$769 -$9 -$56 $0 -$834 $0Long-term financing issues $1,417 $1,541 $10,220 $1 $3,371 $1 $407 $3,780 $1,993 $537 $0 $0 $2,531 $1,000Long-term financing repayments -$695 -$548 -$1,055 -$214 -$600 -$6 -$3 -$823 -$402 -$1 -$4 $0 -$407 $0Treasury stock purchases -$1,778 -$3,199 -$6,099 -$4,312 -$3,381 -$1,970 -$1,509 -$11,171 -$748 -$1,108 -$2,082 -$2,000 -$5,937 -$4,150Common stock dividends -$3,115 -$3,216 -$3,230 -$781 -$759 -$745 -$773 -$3,058 -$771 -$762 -$755 -$811 -$3,098 -$3,250Proceeds from stock option exercises $233 $235 $317 $131 $83 $36 $50 $299 $116 $174 $83 $150 $523 $600Excess tax benefit on share-based comp. $93 $71 $51 $26 $0 $0 -$26 $0 $0 $0 $0 $0 $0 $0Chipotle IPO proceeds $0 $0 $0 $0 $0 $0 $0 $0 $0 $0 $0 $0 $0 $0Other -$12 -$13 -$59 $5 $3 -$12 $1 -$3 -$7 $2 $4 $0 -$1 $0Net Financing Cash Flows -$4,043 -$4,618 $735 -$5,953 -$1,137 -$2,776 -$1,397 -$11,262 -$587 -$1,167 -$2,810 -$2,661 -$7,224 -$5,800Effect of exchange rates $59 -$528 -$247 $114 -$90 $14 -$142 -$104 $55 $99 $76 $0 $230 $0
Change in cash and equivalents $463 -$721 $5,608 -$4,375 -$182 -$861 -$172 -$6,288 $1,150 -$1 $125 -$1,209 $65 -$738Cash at beginning of period $2,336 $2,799 $2,078 $7,686 $3,310 $3,128 $2,267 $7,686 $1,397 $2,547 $2,546 $2,671 $1,397 $1,462Cash at end of period $2,799 $2,078 $7,686 $3,310 $3,128 $2,267 $2,095 $1,397 $2,547 $2,546 $2,671 $1,462 $1,462 $725
Free cash flow (OCF-capex) $4,296 $4,147 $4,725 $1,327 $896 $1,846 $867 $4,239 $1,116 $845 $1,268 $1,352 $4,580 $4,882FCF yield 3.3% 3.0% 3.2% 3.4%
Source: Company data, Credit Suisse estimates
19 December 2017
McDonald's Corp (MCD) 22
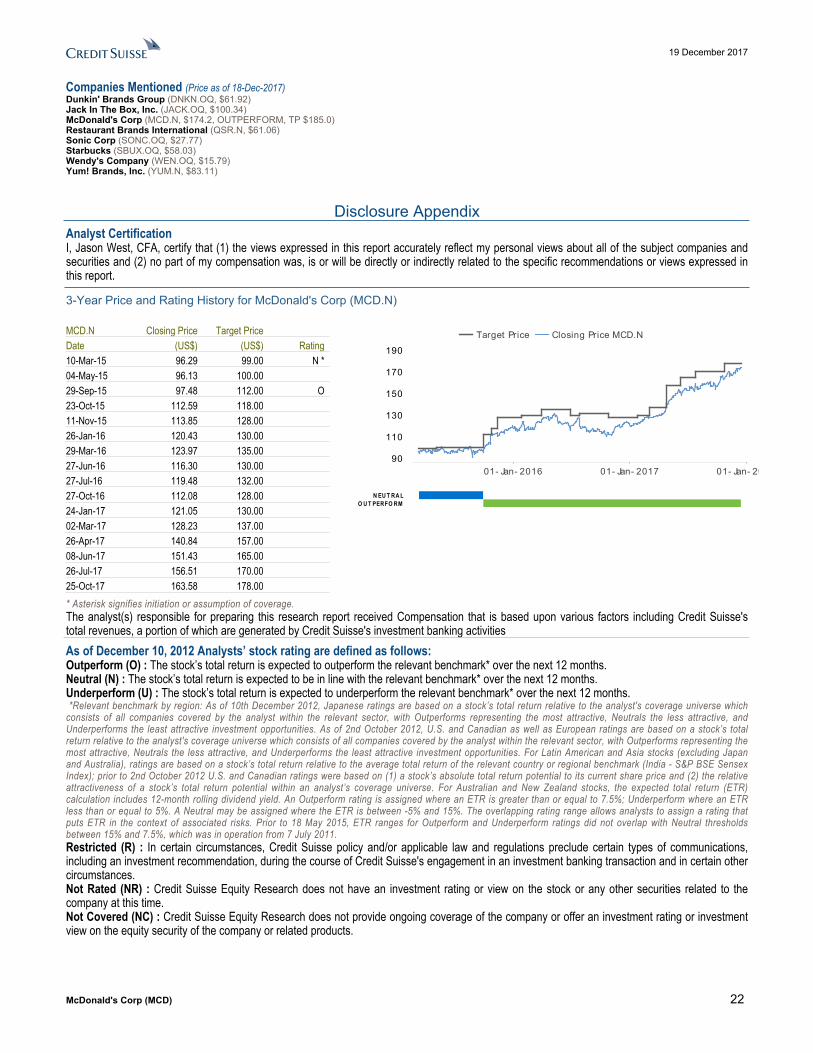
Companies Mentioned (Price as of 18-Dec-2017)Dunkin' Brands Group (DNKN.OQ, $61.92)Jack In The Box, Inc. (JACK.OQ, $100.34)McDonald's Corp (MCD.N, $174.2, OUTPERFORM, TP $185.0)Restaurant Brands International (QSR.N, $61.06)Sonic Corp (SONC.OQ, $27.77)Starbucks (SBUX.OQ, $58.03)Wendy's Company (WEN.OQ, $15.79)Yum! Brands, Inc. (YUM.N, $83.11)
Disclosure AppendixAnalyst Certification I, Jason West, CFA, certify that (1) the views expressed in this report accurately reflect my personal views about all of the subject companies and securities and (2) no part of my compensation was, is or will be directly or indirectly related to the specific recommendations or views expressed in this report.
3-Year Price and Rating History for McDonald's Corp (MCD.N)
MCD.N Closing Price Target Price Date (US$) (US$) Rating 10-Mar-15 96.29 99.00 N * 04-May-15 96.13 100.00 29-Sep-15 97.48 112.00 O 23-Oct-15 112.59 118.00 11-Nov-15 113.85 128.00 26-Jan-16 120.43 130.00 29-Mar-16 123.97 135.00 27-Jun-16 116.30 130.00 27-Jul-16 119.48 132.00 27-Oct-16 112.08 128.00 24-Jan-17 121.05 130.00 02-Mar-17 128.23 137.00 26-Apr-17 140.84 157.00 08-Jun-17 151.43 165.00 26-Jul-17 156.51 170.00 25-Oct-17 163.58 178.00 * Asterisk signifies initiation or assumption of coverage.
Target Price Closing Price MCD.N
01- Jan- 2016 01- Jan- 2017 01- Jan- 201890
110
130
150
170
190
N EU T RA LO U T PERFO RM
The analyst(s) responsible for preparing this research report received Compensation that is based upon various factors including Credit Suisse's total revenues, a portion of which are generated by Credit Suisse's investment banking activitiesAs of December 10, 2012 Analysts’ stock rating are defined as follows:Outperform (O) : The stock’s total return is expected to outperform the relevant benchmark* over the next 12 months.Neutral (N) : The stock’s total return is expected to be in line with the relevant benchmark* over the next 12 months.Underperform (U) : The stock’s total return is expected to underperform the relevant benchmark* over the next 12 months. *Relevant benchmark by region: As of 10th December 2012, Japanese ratings are based on a stock’s total return relative to the analyst's coverage universe which consists of all companies covered by the analyst within the relevant sector, with Outperforms representing the most attractive, Neutrals the less attractive, and Underperforms the least attractive investment opportunities. As of 2nd October 2012, U.S. and Canadian as well as European ratings are based on a stock’s total return relative to the analyst's coverage universe which consists of all companies covered by the analyst within the relevant sector, with Outperforms representing the most attractive, Neutrals the less attractive, and Underperforms the least attractive investment opportunities. For Latin American and Asia stocks (excluding Japan and Australia), ratings are based on a stock’s total return relative to the average total return of the relevant country or regional benchmark (India - S&P BSE Sensex Index); prior to 2nd October 2012 U.S. and Canadian ratings were based on (1) a stock’s absolute total return potential to its current share price and (2) the relative attractiveness of a stock’s total return potential within an analyst’s coverage universe. For Australian and New Zealand stocks, the expected total return (ETR) calculation includes 12-month rolling dividend yield. An Outperform rating is assigned where an ETR is greater than or equal to 7.5%; Underperform where an ETR less than or equal to 5%. A Neutral may be assigned where the ETR is between -5% and 15%. The overlapping rating range allows analysts to assign a rating that puts ETR in the context of associated risks. Prior to 18 May 2015, ETR ranges for Outperform and Underperform ratings did not overlap with Neutral thresholds between 15% and 7.5%, which was in operation from 7 July 2011.Restricted (R) : In certain circumstances, Credit Suisse policy and/or applicable law and regulations preclude certain types of communications, including an investment recommendation, during the course of Credit Suisse's engagement in an investment banking transaction and in certain other circumstances.Not Rated (NR) : Credit Suisse Equity Research does not have an investment rating or view on the stock or any other securities related to the company at this time.Not Covered (NC) : Credit Suisse Equity Research does not provide ongoing coverage of the company or offer an investment rating or investment view on the equity security of the company or related products.

19 December 2017
McDonald's Corp (MCD) 23
Volatility Indicator [V] : A stock is defined as volatile if the stock price has moved up or down by 20% or more in a month in at least 8 of the past 24 months or the analyst expects significant volatility going forward.Analysts’ sector weightings are distinct from analysts’ stock ratings and are based on the analyst’s expectations for the fundamentals and/or valuation of the sector* relative to the group’s historic fundamentals and/or valuation:Overweight : The analyst’s expectation for the sector’s fundamentals and/or valuation is favorable over the next 12 months.Market Weight : The analyst’s expectation for the sector’s fundamentals and/or valuation is neutral over the next 12 months.Underweight : The analyst’s expectation for the sector’s fundamentals and/or valuation is cautious over the next 12 months. *An analyst’s coverage sector consists of all companies covered by the analyst within the relevant sector. An analyst may cover multiple sectors.
Credit Suisse's distribution of stock ratings (and banking clients) is:
Global Ratings DistributionRating Versus universe (%) Of which banking clients (%)Outperform/Buy* 45% (65% banking clients)Neutral/Hold* 40% (61% banking clients)Underperform/Sell* 13% (54% banking clients)Restricted 3%*For purposes of the NYSE and FINRA ratings distribution disclosure requirements, our stock ratings of Outperform, Neutral, and Underperform most closely correspond to Buy, Hold, and Sell, respectively; however, the meanings are not the same, as our stock ratings are determined on a relative basis. (Please refer to definitions above.) An investor's decision to buy or sell a security should be based on investment objectives, current holdings, and other individual factors.
Important Global Disclosures Credit Suisse’s research reports are made available to clients through our proprietary research portal on CS PLUS. Credit Suisse research products may also be made available through third-party vendors or alternate electronic means as a convenience. Certain research products are only made available through CS PLUS. The services provided by Credit Suisse’s analysts to clients may depend on a specific client’s preferences regarding the frequency and manner of receiving communications, the client’s risk profile and investment, the size and scope of the overall client relationship with the Firm, as well as legal and regulatory constraints. To access all of Credit Suisse’s research that you are entitled to receive in the most timely manner, please contact your sales representative or go to https://plus.credit-suisse.com . Credit Suisse’s policy is to update research reports as it deems appropriate, based on developments with the subject company, the sector or the market that may have a material impact on the research views or opinions stated herein.Credit Suisse's policy is only to publish investment research that is impartial, independent, clear, fair and not misleading. For more detail please refer to Credit Suisse's Policies for Managing Conflicts of Interest in connection with Investment Research: https://www.credit-suisse.com/sites/disclaimers-ib/en/managing-conflicts.html . Credit Suisse does not provide any tax advice. Any statement herein regarding any US federal tax is not intended or written to be used, and cannot be used, by any taxpayer for the purposes of avoiding any penalties.Credit Suisse has decided not to enter into business relationships with companies that Credit Suisse has determined to be involved in the development, manufacture, or acquisition of anti-personnel mines and cluster munitions. For Credit Suisse's position on the issue, please see https://www.credit-suisse.com/media/assets/corporate/docs/about-us/responsibility/banking/policy-summaries-en.pdf .
Target Price and RatingValuation Methodology and Risks: (12 months) for McDonald's Corp (MCD.N)
Method: Our $185 target price and Outperform rating for MCD reflects a multiple of ~17.5x 2018E EBITDA. We see low risk to this EBITDA forecast because of a low sensitivity to SSS.
Risk: Risks to our $185 target price and Outperform rating for MCD include (1) sales momentum waning due to weaker macro trends, operational/product misfires, or competition, (2) the US dollar continuing to strengthen against key currencies causing further EPS erosion and (3) rising labor costs pressuring margins.
Please refer to the firm's disclosure website at https://rave.credit-suisse.com/disclosures/view/selectArchive for the definitions of abbreviations typically used in the target price method and risk sections. See the Companies Mentioned section for full company names Credit Suisse currently has, or had within the past 12 months, the following as investment banking client(s): MCD.N, WEN.OQ, QSR.N, DNKN.OQCredit Suisse provided investment banking services to the subject company (MCD.N, QSR.N) within the past 12 months.Within the past 12 months, Credit Suisse has received compensation for investment banking services from the following issuer(s): MCD.N, QSR.NCredit Suisse expects to receive or intends to seek investment banking related compensation from the subject company (MCD.N, WEN.OQ, QSR.N, SBUX.OQ, DNKN.OQ, YUM.N) within the next 3 months.Credit Suisse or a member of the Credit Suisse Group is a market maker or liquidity provider in the securities of the following subject issuer(s): DNKN.OQ, MCD.N, QSR.N, SBUX.OQ, WEN.OQ, YUM.NA member of the Credit Suisse Group is party to an agreement with, or may have provided services set out in sections A and B of Annex I of Directive 2014/65/EU of the European Parliament and Council ("MiFID Services") to, the subject issuer (MCD.N, WEN.OQ, QSR.N, SBUX.OQ, DNKN.OQ, YUM.N) within the past 12 months.

19 December 2017
McDonald's Corp (MCD) 24
For date and time of production, dissemination and history of recommendation for the subject company(ies) featured in this report, disseminated within the past 12 months, please refer to the link: https://rave.credit-suisse.com/disclosures/view/report?i=338047&v=-4o18r822jq2dl5clkpgeow2p9 . Important Regional Disclosures Singapore recipients should contact Credit Suisse AG, Singapore Branch for any matters arising from this research report.The analyst(s) involved in the preparation of this report may participate in events hosted by the subject company, including site visits. Credit Suisse does not accept or permit analysts to accept payment or reimbursement for travel expenses associated with these events.Restrictions on certain Canadian securities are indicated by the following abbreviations: NVS--Non-Voting shares; RVS--Restricted Voting Shares; SVS--Subordinate Voting Shares.Individuals receiving this report from a Canadian investment dealer that is not affiliated with Credit Suisse should be advised that this report may not contain regulatory disclosures the non-affiliated Canadian investment dealer would be required to make if this were its own report.For Credit Suisse Securities (Canada), Inc.'s policies and procedures regarding the dissemination of equity research, please visit https://www.credit-suisse.com/sites/disclaimers-ib/en/canada-research-policy.html.Principal is not guaranteed in the case of equities because equity prices are variable.Commission is the commission rate or the amount agreed with a customer when setting up an account or at any time after that.This research report is authored by:Credit Suisse Securities (USA) LLC .............................................................................................................Jason West, CFA ; Olya VoronetskayaImportant disclosures regarding companies that are the subject of this report are available by calling +1 (877) 291-2683. The same important disclosures, with the exception of valuation methodology and risk discussions, are also available on Credit Suisse’s disclosure website at https://rave.credit-suisse.com/disclosures . For valuation methodology and risks associated with any recommendation, price target, or rating referenced in this report, please refer to the disclosures section of the most recent report regarding the subject company.

19 December 2017
McDonald's Corp (MCD) 25
This report is produced by subsidiaries and affiliates of Credit Suisse operating under its Global Markets Division. For more information on our structure, please use the following link: https://www.credit-suisse.com/who-we-are This report may contain material that is not directed to, or intended for distribution to or use by, any person or entity who is a citizen or resident of or located in any locality, state, country or other jurisdiction where such distribution, publication, availability or use would be contrary to law or regulation or which would subject Credit Suisse or its affiliates ("CS") to any registration or licensing requirement within such jurisdiction. All material presented in this report, unless specifically indicated otherwise, is under copyright to CS. None of the material, nor its content, nor any copy of it, may be altered in any way, transmitted to, copied or distributed to any other party, without the prior express written permission of CS. All trademarks, service marks and logos used in this report are trademarks or service marks or registered trademarks or service marks of CS or its affiliates.The information, tools and material presented in this report are provided to you for information purposes only and are not to be used or considered as an offer or the solicitation of an offer to sell or to buy or subscribe for securities or other financial instruments. CS may not have taken any steps to ensure that the securities referred to in this report are suitable for any particular investor. CS will not treat recipients of this report as its customers by virtue of their receiving this report. The investments and services contained or referred to in this report may not be suitable for you and it is recommended that you consult an independent investment advisor if you are in doubt about such investments or investment services. Nothing in this report constitutes investment, legal, accounting or tax advice, or a representation that any investment or strategy is suitable or appropriate to your individual circumstances, or otherwise constitutes a personal recommendation to you. CS does not advise on the tax consequences of investments and you are advised to contact an independent tax adviser. Please note in particular that the bases and levels of taxation may change. Information and opinions presented in this report have been obtained or derived from sources believed by CS to be reliable, but CS makes no representation as to their accuracy or completeness. CS accepts no liability for loss arising from the use of the material presented in this report, except that this exclusion of liability does not apply to the extent that such liability arises under specific statutes or regulations applicable to CS. This report is not to be relied upon in substitution for the exercise of independent judgment. CS may have issued, and may in the future issue, other communications that are inconsistent with, and reach different conclusions from, the information presented in this report. Those communications reflect the different assumptions, views and analytical methods of the analysts who prepared them and CS is under no obligation to ensure that such other communications are brought to the attention of any recipient of this report. Some investments referred to in this report will be offered solely by a single entity and in the case of some investments solely by CS, or an associate of CS or CS may be the only market maker in such investments. Past performance should not be taken as an indication or guarantee of future performance, and no representation or warranty, express or implied, is made regarding future performance. Information, opinions and estimates contained in this report reflect a judgment at its original date of publication by CS and are subject to change without notice. The price, value of and income from any of the securities or financial instruments mentioned in this report can fall as well as rise. The value of securities and financial instruments is subject to exchange rate fluctuation that may have a positive or adverse effect on the price or income of such securities or financial instruments. Investors in securities such as ADR's, the values of which are influenced by currency volatility, effectively assume this risk. Structured securities are complex instruments, typically involve a high degree of risk and are intended for sale only to sophisticated investors who are capable of understanding and assuming the risks involved. The market value of any structured security may be affected by changes in economic, financial and political factors (including, but not limited to, spot and forward interest and exchange rates), time to maturity, market conditions and volatility, and the credit quality of any issuer or reference issuer. Any investor interested in purchasing a structured product should conduct their own investigation and analysis of the product and consult with their own professional advisers as to the risks involved in making such a purchase. Some investments discussed in this report may have a high level of volatility. High volatility investments may experience sudden and large falls in their value causing losses when that investment is realised. Those losses may equal your original investment. Indeed, in the case of some investments the potential losses may exceed the amount of initial investment and, in such circumstances, you may be required to pay more money to support those losses. Income yields from investments may fluctuate and, in consequence, initial capital paid to make the investment may be used as part of that income yield. Some investments may not be readily realisable and it may be difficult to sell or realise those investments, similarly it may prove difficult for you to obtain reliable information about the value, or risks, to which such an investment is exposed. This report may provide the addresses of, or contain hyperlinks to, websites. Except to the extent to which the report refers to website material of CS, CS has not reviewed any such site and takes no responsibility for the content contained therein. Such address or hyperlink (including addresses or hyperlinks to CS's own website material) is provided solely for your convenience and information and the content of any such website does not in any way form part of this document. Accessing such website or following such link through this report or CS's website shall be at your own risk.
This report is issued and distributed in European Union (except Switzerland): by Credit Suisse Securities (Europe) Limited, One Cabot Square, London E14 4QJ, England, which is authorised by the Prudential Regulation Authority and regulated by the Financial Conduct Authority and the Prudential Regulation Authority. Germany: Credit Suisse Securities (Europe) Limited Niederlassung Frankfurt am Main regulated by the Bundesanstalt fuer Finanzdienstleistungsaufsicht ("BaFin"). United States and Canada: Credit Suisse Securities (USA) LLC; Switzerland: Credit Suisse AG; Brazil: Banco de Investimentos Credit Suisse (Brasil) S.A or its affiliates; Mexico: Banco Credit Suisse (México), S.A. (transactions related to the securities mentioned in this report will only be effected in compliance with applicable regulation); Japan: by Credit Suisse Securities (Japan) Limited, Financial Instruments Firm, Director-General of Kanto Local Finance Bureau ( Kinsho) No. 66, a member of Japan Securities Dealers Association, The Financial Futures Association of Japan, Japan Investment Advisers Association, Type II Financial Instruments Firms Association; Hong Kong: Credit Suisse (Hong Kong) Limited; Australia: Credit Suisse Equities (Australia) Limited; Thailand: Credit Suisse Securities (Thailand) Limited, regulated by the Office of the Securities and Exchange Commission, Thailand, having registered address at 990 Abdulrahim Place, 27th Floor, Unit 2701, Rama IV Road, Silom, Bangrak, Bangkok10500, Thailand, Tel. +66 2614 6000; Malaysia: Credit Suisse Securities (Malaysia) Sdn Bhd; Singapore: Credit Suisse AG, Singapore Branch; India: Credit Suisse Securities (India) Private Limited (CIN no.U67120MH1996PTC104392) regulated by the Securities and Exchange Board of India as Research Analyst (registration no. INH 000001030) and as Stock Broker (registration no. INB230970637; INF230970637; INB010970631; INF010970631), having registered address at 9th Floor, Ceejay House, Dr.A.B. Road, Worli, Mumbai - 18, India, T- +91-22 6777 3777; South Korea: Credit Suisse Securities (Europe) Limited, Seoul Branch; Taiwan: Credit Suisse AG Taipei Securities Branch; Indonesia: PT Credit Suisse Sekuritas Indonesia; Philippines:Credit Suisse Securities (Philippines ) Inc., and elsewhere in the world by the relevant authorised affiliate of the above.Additional Regional DisclaimersHong Kong: Credit Suisse (Hong Kong) Limited ("CSHK") is licensed and regulated by the Securities and Futures Commission of Hong Kong under the laws of Hong Kong, which differ from Australian laws. CSHKL does not hold an Australian financial services licence (AFSL) and is exempt from the requirement to hold an AFSL under the Corporations Act 2001 (the Act) under Class Order 03/1103 published by the ASIC in respect of financial services provided to Australian wholesale clients (within the meaning of section 761G of the Act). Research on Taiwanese securities produced by Credit Suisse AG, Taipei Securities Branch has been prepared by a registered Senior Business Person. Australia (to the extent services are offered in Australia): Credit Suisse Securities (Europe) Limited (“CSSEL”) and Credit Suisse International (“CSI”) are authorised by the Prudential Regulation Authority and regulated by the Financial Conduct Authority (“FCA”) and the Prudential Regulation Authority under UK laws, which differ from Australian Laws. CSSEL and CSI do not hold an Australian Financial Services Licence (“AFSL”) and are exempt from the requirement to hold an AFSL under the Corporations Act (Cth) 2001 (“Corporations Act”) under Class Order 03/1099 published by the Australian Securities and Investments Commission (“ASIC”), in respect of the financial services provided to Australian wholesale clients (within the meaning of section 761G of the Corporations Act). This material is not for distribution to retail clients and is directed exclusively at Credit Suisse's professional clients and eligible counterparties as defined by the FCA, and wholesale clients as defined under section 761G of the Corporations Act. Credit Suisse (Hong Kong) Limited (“CSHK”) is licensed and regulated by the Securities and Futures Commission of Hong Kong under the laws of Hong Kong, which differ from Australian laws. CSHKL does not hold an AFSL and is exempt from the requirement to hold an AFSL under the Corporations Act under Class Order 03/1103 published by the ASIC in respect of financial services provided to Australian wholesale clients (within the meaning of section 761G of the Corporations Act). Credit Suisse Securities (USA) LLC (CSSU) and Credit Suisse Asset Management LLC (CSAM LLC) are licensed and regulated by the Securities Exchange Commission of the United States under the laws of the United States, which differ from Australian laws. CSSU and CSAM LLC do not hold an AFSL and is exempt from the requirement to hold an AFSL under the Corporations Act under Class Order 03/1100 published by the ASIC in respect of financial services provided to Australian wholesale clients (within the meaning of section 761G of the Corporations Act). Malaysia: Research provided to residents of Malaysia is authorised by the Head of Research for Credit Suisse Securities (Malaysia) Sdn Bhd, to whom they should direct any queries on +603 2723 2020. Singapore: This report has been prepared and issued for distribution in Singapore to institutional investors, accredited investors and expert investors (each as defined under the Financial Advisers Regulations) only, and is also distributed by Credit Suisse AG, Singapore Branch to overseas investors (as defined under the Financial Advisers Regulations). Credit Suisse AG, Singapore Branch may distribute reports produced by its foreign entities or affiliates pursuant to an arrangement under Regulation 32C of the Financial Advisers Regulations. Singapore recipients should contact Credit Suisse AG, Singapore Branch at +65-6212-2000 for matters arising from, or in connection with, this report. By virtue of your status as an institutional investor, accredited investor, expert investor or overseas investor, Credit Suisse AG, Singapore Branch is exempted from complying with certain compliance requirements under the Financial Advisers Act, Chapter 110 of Singapore (the “FAA”), the Financial Advisers Regulations and the relevant Notices and Guidelines issued thereunder, in respect of any financial advisory service which Credit Suisse AG, Singapore Branch may provide to you. UAE: This information is being distributed by Credit Suisse AG (DIFC Branch), duly licensed and regulated by the Dubai Financial Services Authority (“DFSA”). Related financial services or products are only made available to Professional Clients or Market Counterparties, as defined by the DFSA, and are not intended for any other persons. Credit Suisse AG (DIFC Branch) is located on Level 9 East, The Gate Building, DIFC, Dubai, United Arab Emirates. EU: This report has been produced by subsidiaries and affiliates of Credit Suisse operating under its Global Markets Division In jurisdictions where CS is not already registered or licensed to trade in securities, transactions will only be effected in accordance with applicable securities legislation, which will vary from jurisdiction to jurisdiction and may require that the trade be made in accordance with applicable exemptions from registration or licensing requirements. Non-US customers wishing to effect a transaction should contact a CS entity in their local jurisdiction unless governing law permits otherwise. US customers wishing to effect a transaction should do so only by contacting a representative at Credit Suisse Securities (USA) LLC in the US. Please note that this research was originally prepared and issued by CS for distribution to their market professional and institutional investor customers. Recipients who are not market professional or institutional investor customers of CS should seek the advice of their independent financial advisor prior to taking any investment decision based on this report or for any necessary explanation of its contents. This research may relate to investments or services of a person outside of the UK or to other matters which are not authorised by the Prudential Regulation Authority and regulated by the Financial Conduct Authority and the Prudential Regulation Authority or in respect of which the protections of the Prudential Regulation Authority and Financial Conduct Authority for private customers and/or the UK compensation scheme may not be available, and further details as to where this may be the case are available upon request in respect of this report. CS may provide various services to US municipal entities or obligated persons ("municipalities"), including suggesting individual transactions or trades and entering into such transactions. Any services CS provides to municipalities are not viewed as "advice" within the meaning of Section 975 of the Dodd-Frank Wall Street Reform and Consumer Protection Act. CS is providing any such services and related information solely on an arm's length basis and not as an advisor or fiduciary to the municipality. In connection with the provision of the any such services, there is no agreement, direct or indirect, between any municipality (including the officials,management, employees or agents thereof) and CS for CS to provide advice to the municipality. Municipalities should consult with their financial, accounting and legal advisors regarding any such services provided by CS. In addition, CS is not acting for direct or indirect compensation to solicit the municipality on behalf of an unaffiliated broker, dealer, municipal securities dealer, municipal advisor, or investment adviser for the purpose of obtaining or retaining an engagement by the municipality for or in connection with Municipal Financial Products, the issuance of municipal securities, or of an investment adviser to provide investment advisory services to or on behalf of the municipality. If this report is being distributed by a financial institution other than Credit Suisse AG, or its affiliates, that financial institution is solely responsible for distribution. Clients of that institution should contact that institution to effect a transaction in the securities mentioned in this report or require further information. This report does not constitute investment advice by Credit Suisse to the clients of the distributing financial institution, and neither Credit Suisse AG, its affiliates, and their respective officers, directors and employees accept any liability whatsoever for any direct or consequential loss arising from their use of this report or its content. Principal is not guaranteed. Commission is the commission rate or the amount agreed with a customer when setting up an account or at any time after that. No information or communication provided herein or otherwise is intended to be, or should be construed as, a recommendation within the meaning of the US Department of Labor’s final regulation defining "investment advice" for purposes of the Employee Retirement Income Security Act of 1974, as amended and Section 4975 of the Internal Revenue Code of 1986, as amended, and the information provided herein is intended to be general information, and should not be construed as, providing investment advice (impartial or otherwise). Copyright © 2017 CREDIT SUISSE AG and/or its affiliates. All rights reserved. Investment principal on bonds can be eroded depending on sale price or market price. In addition, there are bonds on which investment principal can be eroded due to changes in redemption amounts. Care is required when investing in such instruments. When you purchase non-listed Japanese fixed income securities (Japanese government bonds, Japanese municipal bonds, Japanese government guaranteed bonds, Japanese corporate bonds) from CS as a seller, you will be requested to pay the purchase price only.