mcdonald’s corporationd18rn0p25nwr6d.cloudfront.net/cik-0000063908/d3ba02b9-28ee-4ff8-b... · a...
TRANSCRIPT
UNITED STATESSECURITIES AND EXCHANGE COMMISSION
WASHINGTON, DC 20549
FORM 8-KCURRENT REPORT PURSUANT TO
SECTION 13 OR 15(d) OF THESECURITIES EXCHANGE ACT OF 1934
Date of report (Date of earliest event reported): January 23, 2017
McDONALD’S CORPORATION(Exact Name of Registrant as Specified in Charter)
Delaware 1-5231 36-2361282(State or Other Jurisdiction
of Incorporation) (CommissionFile Number)
(IRS EmployerIdentification No.)
One McDonald’s PlazaOak Brook, Illinois
(Address of Principal Executive Offices)
60523(Zip Code)
(630) 623-3000(Registrant’s telephone number, including area code)
Not Applicable(Former Name or Former Address, if Changed Since Last Report)
Check the appropriate box below if the Form 8-K filing is intended to simultaneously satisfy the filing obligation of the registrant under any of the followingprovisions ( see General Instruction A.2. below):
o Written communications pursuant to Rule 425 under the Securities Act (17 CFR 230.425)
o Soliciting material pursuant to Rule 14a-12 under the Exchange Act (17 CFR 240.14a-12)
o Pre-commencement communications pursuant to Rule 14d-2(b) under the Exchange Act (17 CFR 240.14d-2(b))
o Pre-commencement communications pursuant to Rule 13e-4(c) under the Exchange Act (17 CFR 240.13e-4(c))
Item 2.02. Results of Operations and Financial Condition.On January 23, 2017 , McDonald’s Corporation (the “Company”) issued an investor release reporting the Company’s results for the fourth quarter and year
ended December 31, 2016 . A copy of the related investor release is being filed as Exhibit 99.1 to this Form 8-K and is incorporated by reference in its entirety.Also filed herewith and incorporated by reference as Exhibit 99.2 is supplemental information for the quarter and year ended December 31, 2016 . The informationunder this Item 2.02, including such Exhibits, shall be deemed to be “filed” for purposes of the Securities Exchange Act of 1934, as amended.
Item 9.01. Financial Statements and Exhibits.
(d) Exhibits .
99.1 Investor Release of McDonald's Corporation issued January 23, 2017 :McDonald's Delivers Fourth Quarter and Full Year 2016 Results
99.2 McDonald's Corporation: Supplemental Information, Quarter and Year Ended December 31, 2016

SIGNATURES
Pursuant to the requirements of the Securities Exchange Act of 1934, the registrant has duly caused this report to be signed on its behalf by the undersignedhereunto duly authorized.
McDONALD’S CORPORATION (Registrant)Date: January 23, 2017 By: /s/ Catherine Hoovel Catherine Hoovel Corporate Vice President - Chief Accounting Officer

Exhibit Index Exhibit No. 99.1 Investor Release of McDonald's Corporation issued January 23, 2017 :
McDonald's Delivers Fourth Quarter and Full Year 2016 Results
Exhibit No. 99.2 McDonald's Corporation: Supplemental Information, Quarter and Year Ended December 31, 2016
Exhibit 99.1
FOR IMMEDIATE RELEASE FOR MORE INFORMATION CONTACT:1/23/2017 Investors: Chris Stent, 630-623-3801
Media: Terri Hickey, 630-623-5593
McDONALD'S DELIVERS FOURTH QUARTER AND FULL YEAR 2016 RESULTS
OAK BROOK, IL - McDonald's Corporation today announced results for the fourth quarter and year ended December 31, 2016 .“Throughout 2016, we worked diligently to lay the groundwork for our long-term future. We focused on driving changes in our menu, restaurants and
technology to deliver an enhanced McDonald’s experience for our customers around the world,” said McDonald’s President and Chief Executive Officer SteveEasterbrook. “We applied the necessary rigour and discipline to strengthen the Company and our financial performance. Our efforts yielded a more streamlinedand focused organisation that generated solid fourth quarter and full year results, including our strongest annual global comparable sales growth since 2011 alongwith record franchisee cash flows in many of our major markets. I am confident that we’re on the right path as we pursue our goal of being recognised by ourcustomers as the modern, progressive burger company.”Fourth quarter highlights:
• Global comparable sales increased 2.7% , including positive comparable sales in the International Lead, High Growth and Foundational segments• Consolidated revenues decreased 5% ( 3% in constant currencies), due to the impact of refranchising• Consolidated operating income increased 5% ( 7% in constant currencies)• Diluted earnings per share of $1.44 increased 10% ( 12% in constant currencies)
Full year highlights:• Global comparable sales increased 3.8% , including positive comparable sales across all segments• Consolidated revenues decreased 3% (flat in constant currencies), due to the impact of refranchising• Consolidated operating income increased 8% ( 11% in constant currencies)• Diluted earnings per share of $5.44 increased 13% ( 16% in constant currencies)• Returned $2.2 billion to shareholders through share repurchases and dividends in the fourth quarter and $14.2 billion for the full year, marking the
successful achievement of the Company’s targeted return of $30 billion for the three-year period ending 2016. In addition, the Company announced a6% increase in its dividend beginning in the fourth quarter.
Fourth quarter comparable sales declined 1.3% in the U.S., reflecting the challenging comparison against the prior year launch of the very successful All-DayBreakfast. Operating income for the quarter decreased 11%, as the U.S. lapped a prior year gain on the strategic sale of a unique restaurant property. Entering 2017,McDonald’s U.S. will continue to focus on growing guest traffic.
Comparable sales for the International Lead segment increased 2.8% for the quarter, reflecting strong comparable sales growth across most of the segment,led by the U.K. Fourth quarter operating income for the segment increased 1% (6% in constant currencies), fueled by sales-driven improvements in franchisedmargin dollars across most markets.
Fourth quarter comparable sales increased 4.7% in the High Growth segment led by strong performance in China and positive results across the entiresegment. The segment’s operating income rose 16% (18% in constant currencies), driven primarily by improved restaurant profitability in China, which benefitedfrom recent VAT reform.
Fourth quarter comparable sales rose 11.1% in the Foundational markets led by very strong performance in Japan and certain markets in Latin America, aswell as solid results across the segment’s remaining geographic regions. For the segment, which includes Corporate SG&A and other costs, operating incomeincreased for the quarter. These results primarily reflect a gain from the sale of McDonald's Singapore in connection with the Company's refranchising initiatives,as well as improved performance in Japan.
1
Steve Easterbrook concluded, “For McDonald’s, 2016 was a year of purposeful change as we focused on the key elements of our turnaround plan -strengthening our business to drive long-term sustainable growth by sharpening our focus on our customers, right-sizing our structure and putting the right talent inplace to lead the Company into the future. I’m confident that we are well-positioned to transition to a longer-term focus in 2017. Our refranchising efforts andfinancial discipline will enable us to direct our capital and G&A resources towards new strategic opportunities to deliver on our long-term strategy. We lookforward to providing further details on our strategy and financial targets later this quarter. As we begin the first quarter of 2017, we are mindful of the comparisonwe face against first quarter 2016 results, which benefited from leap year, favourable weather and continued momentum from All-Day Breakfast in the U.S.”
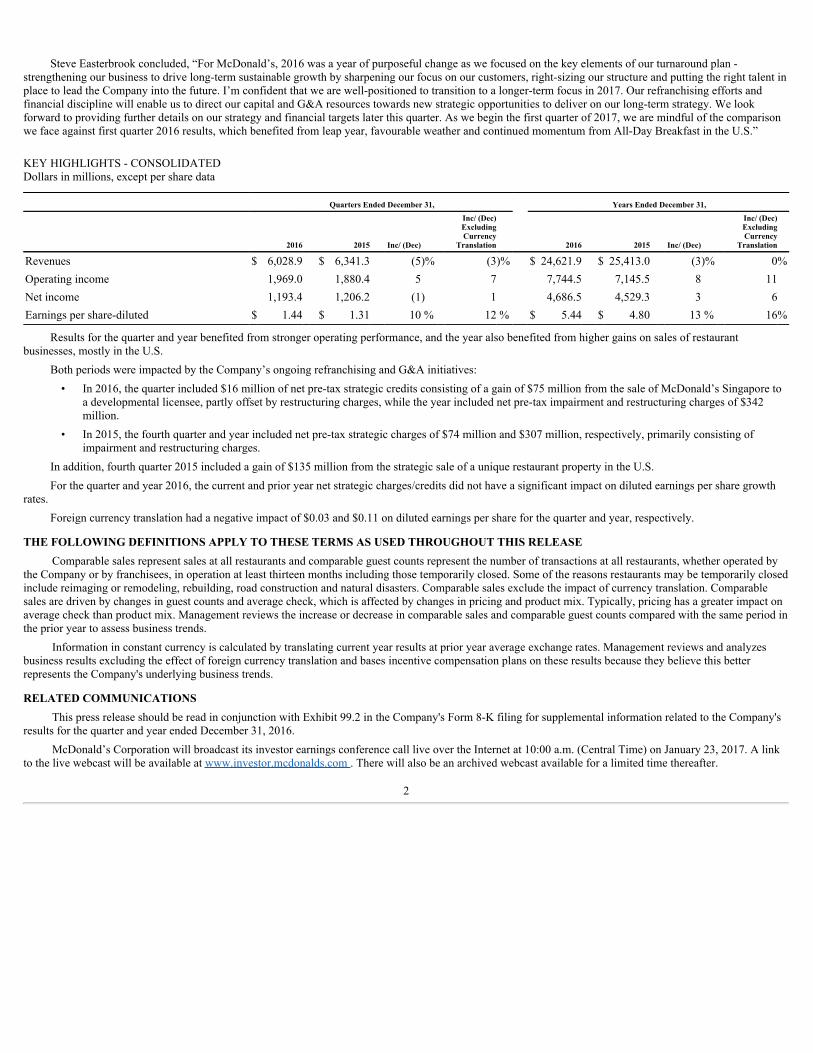
KEY HIGHLIGHTS - CONSOLIDATEDDollars in millions, except per share data
Quarters Ended December 31, Years Ended December 31,
2016 2015 Inc/ (Dec)
Inc/ (Dec)ExcludingCurrency
Translation 2016 2015 Inc/ (Dec)
Inc/ (Dec)ExcludingCurrency
Translation
Revenues $ 6,028.9 $ 6,341.3 (5)% (3)% $ 24,621.9 $ 25,413.0 (3)% 0%Operating income 1,969.0 1,880.4 5 7 7,744.5 7,145.5 8 11Net income 1,193.4 1,206.2 (1) 1 4,686.5 4,529.3 3 6Earnings per share-diluted $ 1.44 $ 1.31 10 % 12 % $ 5.44 $ 4.80 13 % 16%
Results for the quarter and year benefited from stronger operating performance, and the year also benefited from higher gains on sales of restaurantbusinesses, mostly in the U.S.
Both periods were impacted by the Company’s ongoing refranchising and G&A initiatives:• In 2016, the quarter included $16 million of net pre-tax strategic credits consisting of a gain of $75 million from the sale of McDonald’s Singapore to
a developmental licensee, partly offset by restructuring charges, while the year included net pre-tax impairment and restructuring charges of $342million.
• In 2015, the fourth quarter and year included net pre-tax strategic charges of $74 million and $307 million, respectively, primarily consisting ofimpairment and restructuring charges.
In addition, fourth quarter 2015 included a gain of $135 million from the strategic sale of a unique restaurant property in the U.S.For the quarter and year 2016, the current and prior year net strategic charges/credits did not have a significant impact on diluted earnings per share growth
rates.Foreign currency translation had a negative impact of $0.03 and $0.11 on diluted earnings per share for the quarter and year, respectively.
THE FOLLOWING DEFINITIONS APPLY TO THESE TERMS AS USED THROUGHOUT THIS RELEASEComparable sales represent sales at all restaurants and comparable guest counts represent the number of transactions at all restaurants, whether operated by
the Company or by franchisees, in operation at least thirteen months including those temporarily closed. Some of the reasons restaurants may be temporarily closedinclude reimaging or remodeling, rebuilding, road construction and natural disasters. Comparable sales exclude the impact of currency translation. Comparablesales are driven by changes in guest counts and average check, which is affected by changes in pricing and product mix. Typically, pricing has a greater impact onaverage check than product mix. Management reviews the increase or decrease in comparable sales and comparable guest counts compared with the same period inthe prior year to assess business trends.
Information in constant currency is calculated by translating current year results at prior year average exchange rates. Management reviews and analyzesbusiness results excluding the effect of foreign currency translation and bases incentive compensation plans on these results because they believe this betterrepresents the Company's underlying business trends.
RELATED COMMUNICATIONSThis press release should be read in conjunction with Exhibit 99.2 in the Company's Form 8-K filing for supplemental information related to the Company's
results for the quarter and year ended December 31, 2016.McDonald’s Corporation will broadcast its investor earnings conference call live over the Internet at 10:00 a.m. (Central Time) on January 23, 2017. A link
to the live webcast will be available at www.investor.mcdonalds.com . There will also be an archived webcast available for a limited time thereafter.
2
McDonald’s Corporation will broadcast its upcoming investor meeting live over the Internet on March 1, 2017. Information on presentation times and thelive webcast will be available at www.investor.mcdonalds.com . There will also be an archived webcast available for a limited time thereafter.
McDonald’s plans to release first quarter results before the market opens on April 25, 2017 and will host an investor webcast. This webcast will be broadcastlive and available for replay for a limited time thereafter at www.investor.mcdonalds.com .
ABOUT McDONALD’SMcDonald’s is the world’s leading global foodservice retailer with over 36,000 locations in over 100 countries. Approximately 85% of McDonald’s
restaurants worldwide are owned and operated by independent local business men and women.
FORWARD-LOOKING STATEMENTSThis release contains certain forward-looking statements, which reflect management's expectations regarding future events and operating performance and
speak only as of the date hereof. These forward-looking statements involve a number of risks and uncertainties. The factors that could cause actual results to differmaterially from our expectations are detailed in the Company’s filings with the Securities and Exchange Commission, including the risk factors discussed inExhibit 99.2 in the Company’s Form 8-K filing on January 23, 2017. The Company undertakes no obligation to update such forward-looking statements, except asmay otherwise be required by law.
3
McDONALD'S CORPORATIONCONDENSED CONSOLIDATED STATEMENT OF INCOME
Dollars and shares in millions, except per share data
Quarters Ended December 31, 2016 2015 Inc/ (Dec)
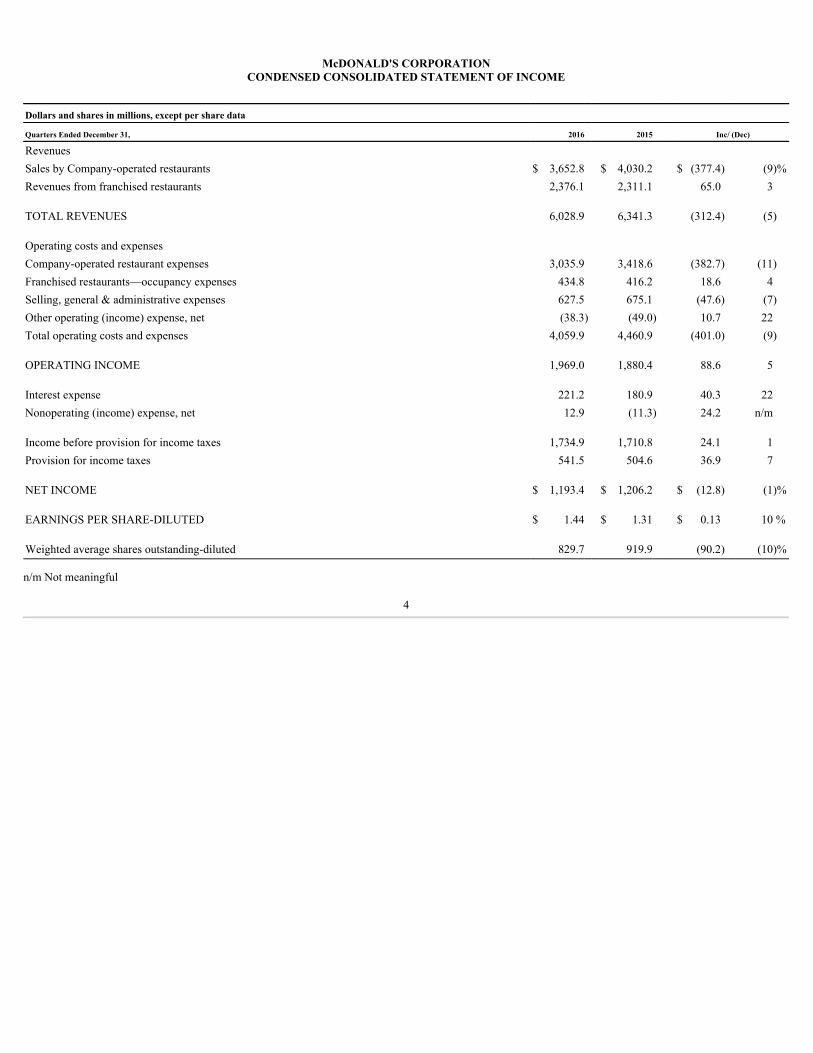
Revenues Sales by Company-operated restaurants $ 3,652.8 $ 4,030.2 $ (377.4) (9)%Revenues from franchised restaurants 2,376.1 2,311.1 65.0 3 TOTAL REVENUES 6,028.9 6,341.3 (312.4) (5) Operating costs and expenses Company-operated restaurant expenses 3,035.9 3,418.6 (382.7) (11)Franchised restaurants—occupancy expenses 434.8 416.2 18.6 4Selling, general & administrative expenses 627.5 675.1 (47.6) (7)Other operating (income) expense, net (38.3) (49.0) 10.7 22Total operating costs and expenses 4,059.9 4,460.9 (401.0) (9) OPERATING INCOME 1,969.0 1,880.4 88.6 5 Interest expense 221.2 180.9 40.3 22Nonoperating (income) expense, net 12.9 (11.3) 24.2 n/m Income before provision for income taxes 1,734.9 1,710.8 24.1 1Provision for income taxes 541.5 504.6 36.9 7 NET INCOME $ 1,193.4 $ 1,206.2 $ (12.8) (1)% EARNINGS PER SHARE-DILUTED $ 1.44 $ 1.31 $ 0.13 10 % Weighted average shares outstanding-diluted 829.7 919.9 (90.2) (10)%
n/m Not meaningful
4

McDONALD'S CORPORATIONCONDENSED CONSOLIDATED STATEMENT OF INCOME
Dollars and shares in millions, except per share data
Years Ended December 31, 2016 2015 Inc/ (Dec)
Revenues Sales by Company-operated restaurants $ 15,295.0 $ 16,488.3 $ (1,193.3) (7)%Revenues from franchised restaurants 9,326.9 8,924.7 402.2 5 TOTAL REVENUES 24,621.9 25,413.0 (791.1) (3) Operating costs and expenses Company-operated restaurant expenses 12,698.8 13,976.9 (1,278.1) (9)Franchised restaurants—occupancy expenses 1,718.4 1,646.9 71.5 4Selling, general & administrative expenses 2,384.5 2,434.3 (49.8) (2)Other operating (income) expense, net 75.7 209.4 (133.7) (64)Total operating costs and expenses 16,877.4 18,267.5 (1,390.1) (8) OPERATING INCOME 7,744.5 7,145.5 599.0 8 Interest expense 884.8 638.3 246.5 39Nonoperating (income) expense, net (6.3) (48.5) 42.2 87 Income before provision for income taxes 6,866.0 6,555.7 310.3 5Provision for income taxes 2,179.5 2,026.4 153.1 8 NET INCOME $ 4,686.5 $ 4,529.3 $ 157.2 3 % EARNINGS PER SHARE-DILUTED $ 5.44 $ 4.80 $ 0.64 13 % Weighted average shares outstanding-diluted 861.2 944.6 (83.4) (9)%
5
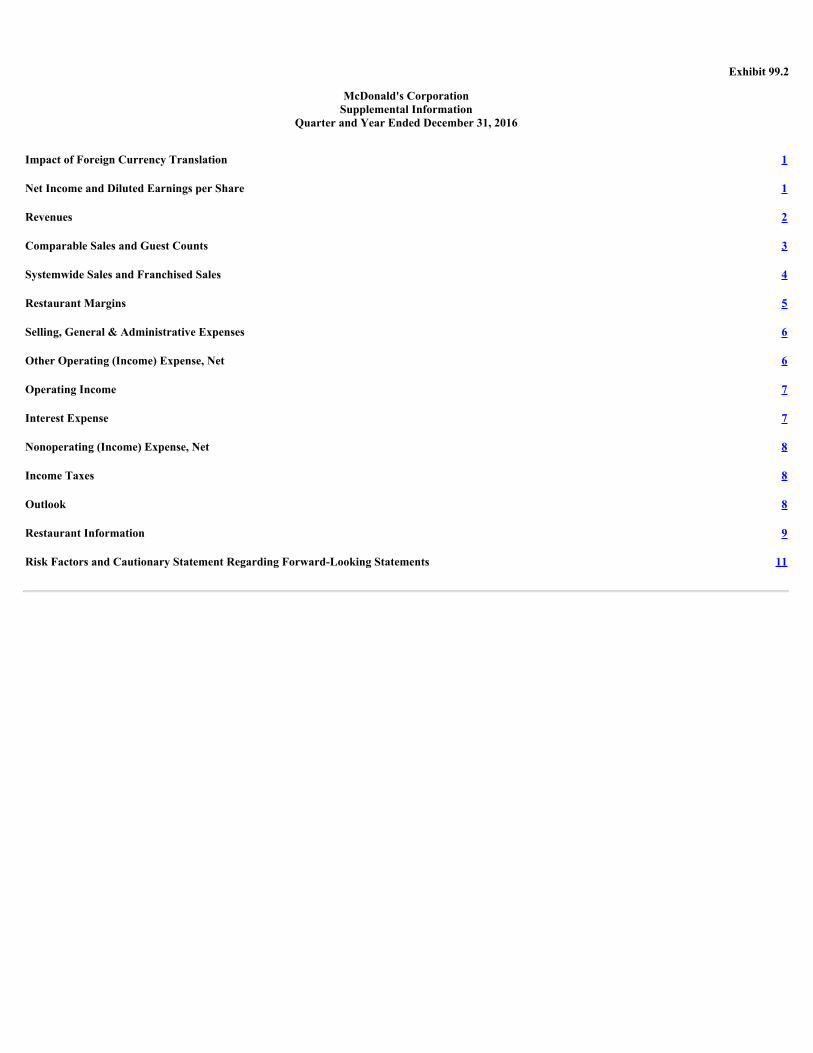
Exhibit 99.2
McDonald's CorporationSupplemental Information
Quarter and Year Ended December 31, 2016
Impact of Foreign Currency Translation 1 Net Income and Diluted Earnings per Share 1 Revenues 2 Comparable Sales and Guest Counts 3 Systemwide Sales and Franchised Sales 4 Restaurant Margins 5 Selling, General & Administrative Expenses 6 Other Operating (Income) Expense, Net 6 Operating Income 7 Interest Expense 7 Nonoperating (Income) Expense, Net 8 Income Taxes 8 Outlook 8 Restaurant Information 9 Risk Factors and Cautionary Statement Regarding Forward-Looking Statements 11
SUPPLEMENTAL INFORMATIONThe purpose of this exhibit is to provide additional information related to the results of McDonald's Corporation (the “Company”) for the quarter and year
ended December 31, 2016 . This exhibit should be read in conjunction with Exhibit 99.1.
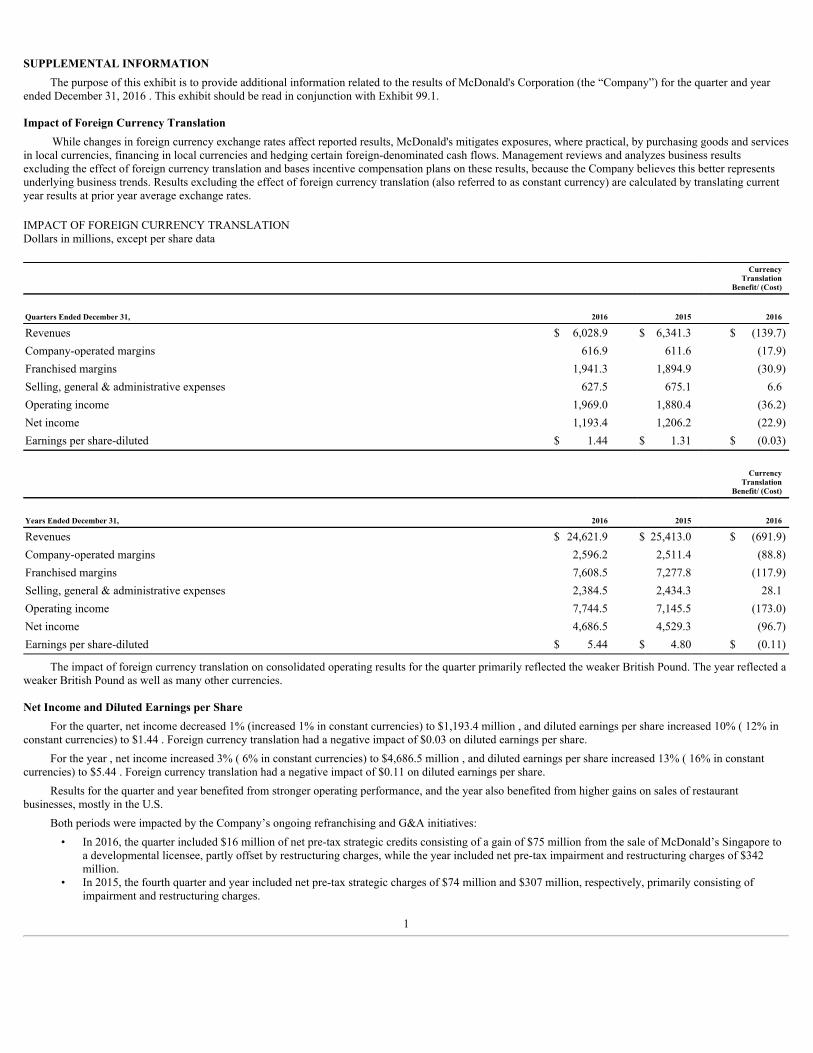
Impact of Foreign Currency TranslationWhile changes in foreign currency exchange rates affect reported results, McDonald's mitigates exposures, where practical, by purchasing goods and services
in local currencies, financing in local currencies and hedging certain foreign-denominated cash flows. Management reviews and analyzes business resultsexcluding the effect of foreign currency translation and bases incentive compensation plans on these results, because the Company believes this better representsunderlying business trends. Results excluding the effect of foreign currency translation (also referred to as constant currency) are calculated by translating currentyear results at prior year average exchange rates.
IMPACT OF FOREIGN CURRENCY TRANSLATIONDollars in millions, except per share data
Currency
TranslationBenefit/ (Cost)
Quarters Ended December 31, 2016 2015 2016 Revenues $ 6,028.9 $ 6,341.3 $ (139.7)Company-operated margins 616.9 611.6 (17.9)Franchised margins 1,941.3 1,894.9 (30.9)Selling, general & administrative expenses 627.5 675.1 6.6Operating income 1,969.0 1,880.4 (36.2)Net income 1,193.4 1,206.2 (22.9)Earnings per share-diluted $ 1.44 $ 1.31 $ (0.03)
Currency
TranslationBenefit/ (Cost)
Years Ended December 31, 2016 2015 2016 Revenues $ 24,621.9 $ 25,413.0 $ (691.9)Company-operated margins 2,596.2 2,511.4 (88.8)Franchised margins 7,608.5 7,277.8 (117.9)Selling, general & administrative expenses 2,384.5 2,434.3 28.1Operating income 7,744.5 7,145.5 (173.0)Net income 4,686.5 4,529.3 (96.7)Earnings per share-diluted $ 5.44 $ 4.80 $ (0.11)
The impact of foreign currency translation on consolidated operating results for the quarter primarily reflected the weaker British Pound. The year reflected aweaker British Pound as well as many other currencies.
Net Income and Diluted Earnings per ShareFor the quarter, net income decreased 1% (increased 1% in constant currencies) to $1,193.4 million , and diluted earnings per share increased 10% ( 12% in
constant currencies) to $1.44 . Foreign currency translation had a negative impact of $0.03 on diluted earnings per share.For the year , net income increased 3% ( 6% in constant currencies) to $4,686.5 million , and diluted earnings per share increased 13% ( 16% in constant
currencies) to $5.44 . Foreign currency translation had a negative impact of $0.11 on diluted earnings per share.Results for the quarter and year benefited from stronger operating performance, and the year also benefited from higher gains on sales of restaurant
businesses, mostly in the U.S.Both periods were impacted by the Company’s ongoing refranchising and G&A initiatives:
• In 2016, the quarter included $16 million of net pre-tax strategic credits consisting of a gain of $75 million from the sale of McDonald’s Singapore toa developmental licensee, partly offset by restructuring charges, while the year included net pre-tax impairment and restructuring charges of $342million.
• In 2015, the fourth quarter and year included net pre-tax strategic charges of $74 million and $307 million, respectively, primarily consisting ofimpairment and restructuring charges.
1
In addition, fourth quarter 2015 included a gain of $135 million from the strategic sale of a unique restaurant property in the U.S.For the quarter and year 2016, the current and prior year net strategic charges/credits did not have a significant impact on diluted earnings per share growth
rates.Diluted earnings per share for both periods benefited from a decrease in diluted weighted average shares outstanding due to share repurchases. During the
quarter, the Company repurchased 11.9 million shares of stock for $1.4 billion , bringing total purchases for the year to 92.3 million shares or $11.1 billion . Inaddition, the Company paid a quarterly dividend of $0.94 per share, or $773.1 million , bringing the total dividends paid for the year to $3.1 billion .
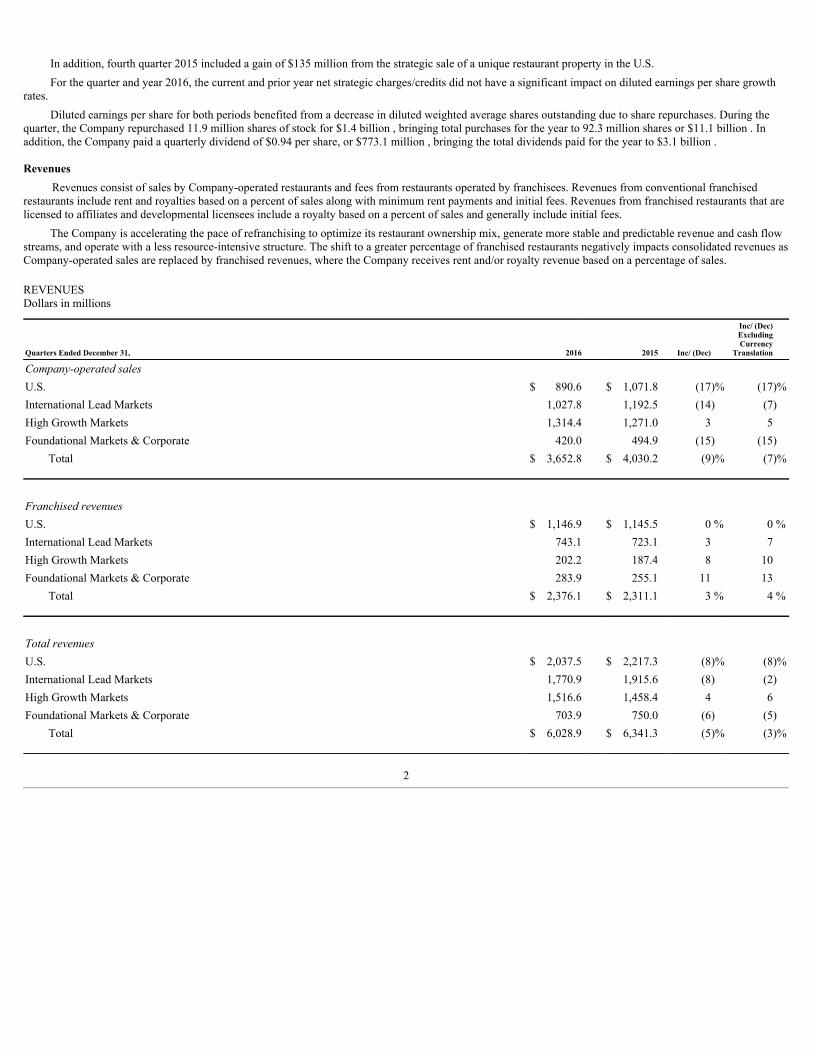
RevenuesRevenues consist of sales by Company-operated restaurants and fees from restaurants operated by franchisees. Revenues from conventional franchised
restaurants include rent and royalties based on a percent of sales along with minimum rent payments and initial fees. Revenues from franchised restaurants that arelicensed to affiliates and developmental licensees include a royalty based on a percent of sales and generally include initial fees.
The Company is accelerating the pace of refranchising to optimize its restaurant ownership mix, generate more stable and predictable revenue and cash flowstreams, and operate with a less resource-intensive structure. The shift to a greater percentage of franchised restaurants negatively impacts consolidated revenues asCompany-operated sales are replaced by franchised revenues, where the Company receives rent and/or royalty revenue based on a percentage of sales.
REVENUESDollars in millions
Quarters Ended December 31, 2016 2015 Inc/ (Dec)
Inc/ (Dec)ExcludingCurrency
Translation
Company-operated sales
U.S. $ 890.6 $ 1,071.8 (17)% (17)%International Lead Markets 1,027.8 1,192.5 (14) (7)High Growth Markets 1,314.4 1,271.0 3 5Foundational Markets & Corporate 420.0 494.9 (15) (15)
Total $ 3,652.8 $ 4,030.2 (9)% (7)%
Franchised revenues
U.S. $ 1,146.9 $ 1,145.5 0 % 0 %International Lead Markets 743.1 723.1 3 7High Growth Markets 202.2 187.4 8 10Foundational Markets & Corporate 283.9 255.1 11 13
Total $ 2,376.1 $ 2,311.1 3 % 4 %
Total revenues
U.S. $ 2,037.5 $ 2,217.3 (8)% (8)%International Lead Markets 1,770.9 1,915.6 (8) (2)High Growth Markets 1,516.6 1,458.4 4 6Foundational Markets & Corporate 703.9 750.0 (6) (5)
Total $ 6,028.9 $ 6,341.3 (5)% (3)%
2
Years Ended December 31, 2016 2015 Inc/ (Dec)
Inc/ (Dec)ExcludingCurrency
Translation
Company-operated sales
U.S. $ 3,742.6 $ 4,198.4 (11)% (11)%International Lead Markets 4,278.5 4,798.4 (11) (6)High Growth Markets 5,377.9 5,441.5 (1) 4Foundational Markets & Corporate 1,896.0 2,050.0 (8) (5)
Total $ 15,295.0 $ 16,488.3 (7)% (4)%
Franchised revenues
U.S. $ 4,510.1 $ 4,360.5 3 % 3 %International Lead Markets 2,944.9 2,816.5 5 8High Growth Markets 782.8 731.3 7 9Foundational Markets & Corporate 1,089.1 1,016.4 7 11
Total $ 9,326.9 $ 8,924.7 5 % 6 %
Total revenues
U.S. $ 8,252.7 $ 8,558.9 (4)% (4)%International Lead Markets 7,223.4 7,614.9 (5) (1)High Growth Markets 6,160.7 6,172.8 0 4Foundational Markets & Corporate 2,985.1 3,066.4 (3) 1
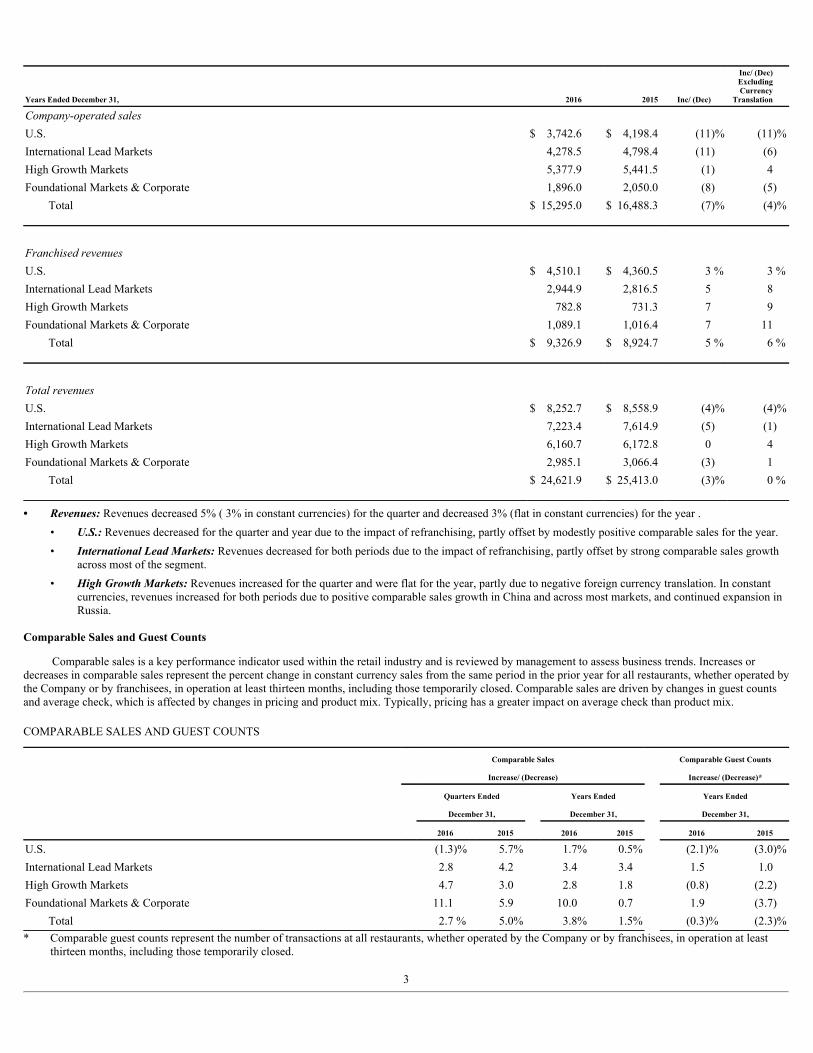
Total $ 24,621.9 $ 25,413.0 (3)% 0 % • Revenues:Revenues decreased 5% ( 3% in constant currencies) for the quarter and decreased 3% (flat in constant currencies) for the year .
• U.S.:Revenues decreased for the quarter and year due to the impact of refranchising, partly offset by modestly positive comparable sales for the year.• InternationalLeadMarkets:Revenues decreased for both periods due to the impact of refranchising, partly offset by strong comparable sales growth
across most of the segment.• HighGrowthMarkets:Revenues increased for the quarter and were flat for the year, partly due to negative foreign currency translation. In constant
currencies, revenues increased for both periods due to positive comparable sales growth in China and across most markets, and continued expansion inRussia.
Comparable Sales and Guest Counts
Comparable sales is a key performance indicator used within the retail industry and is reviewed by management to assess business trends. Increases ordecreases in comparable sales represent the percent change in constant currency sales from the same period in the prior year for all restaurants, whether operated bythe Company or by franchisees, in operation at least thirteen months, including those temporarily closed. Comparable sales are driven by changes in guest countsand average check, which is affected by changes in pricing and product mix. Typically, pricing has a greater impact on average check than product mix.
COMPARABLE SALES AND GUEST COUNTS
Comparable Sales Comparable Guest Counts
Increase/ (Decrease) Increase/ (Decrease)*
Quarters Ended Years Ended Years Ended
December 31, December 31, December 31,
2016 2015 2016 2015 2016 2015
U.S. (1.3)% 5.7% 1.7% 0.5% (2.1)% (3.0)%International Lead Markets 2.8 4.2 3.4 3.4 1.5 1.0High Growth Markets 4.7 3.0 2.8 1.8 (0.8) (2.2)Foundational Markets & Corporate 11.1 5.9 10.0 0.7 1.9 (3.7)
Total 2.7 % 5.0% 3.8% 1.5% (0.3)% (2.3)%* Comparable guest counts represent the number of transactions at all restaurants, whether operated by the Company or by franchisees, in operation at least
thirteen months, including those temporarily closed.
3

Systemwide Sales and Franchised Sales
The following tables present Systemwide sales growth rates and franchised sales. Systemwide sales include sales at all restaurants, whether operated by theCompany or by franchisees. While franchised sales are not recorded as revenues by the Company, management believes the information is important inunderstanding the Company's financial performance, because these sales are the basis on which the Company calculates and records franchised revenues and areindicative of the financial health of the franchisee base.
SYSTEMWIDE SALES
Quarter Ended Year Ended
December 31, 2016 December 31, 2016
Inc/ (Dec)
Inc/ (Dec) Excluding Currency
Translation Inc/ (Dec)
Inc/ (Dec) Excluding Currency
Translation
U.S. (2)% (2)% 2% 2%International Lead Markets (1) 4 1 5High Growth Markets 6 8 3 6Foundational Markets & Corporate 11 12 8 11
Total 2 % 4 % 3% 5%
FRANCHISED SALESDollars in millions
Quarters Ended December 31, 2016 2015 Inc/ (Dec)
Inc/ (Dec)ExcludingCurrency
Translation
U.S. $ 8,289.8 $ 8,249.1 0% 0%International Lead Markets 4,288.1 4,154.8 3 7High Growth Markets 1,221.9 1,117.1 9 12Foundational Markets & Corporate 4,035.9 3,501.8 15 16
Total* $ 17,835.7 $ 17,022.8 5% 6%
Years Ended December 31, 2016 2015 Inc/ (Dec)
Inc/ (Dec)ExcludingCurrency
Translation
U.S. $ 32,646.2 $ 31,638.8 3% 3%International Lead Markets 17,048.9 16,313.4 5 8High Growth Markets 4,857.9 4,525.0 7 10Foundational Markets & Corporate 15,153.7 13,749.1 10 14
Total* $ 69,706.7 $ 66,226.3 5% 7%
* Sales from developmental licensed restaurants and foreign affiliated markets where the Company earns a royalty based on a percent of sales totaled $3,685.3million and $3,071.3 million for the quarters 2016 and 2015 , respectively, and $13,671.9 million and $12,181.4 million for the years 2016 and 2015 ,respectively. Results reflected improved performance in Japan, partly due to the stronger Yen, and improved performance across most markets. These resultswere partly offset by weaker currencies in Latin America. The remaining balance of franchised sales is derived from conventional franchised restaurantswhere the Company earns rent and royalties based primarily on a percent of sales.
4
Restaurant MarginsFRANCHISED AND COMPANY-OPERATED RESTAURANT MARGINSDollars in millions
Percent Amount Inc/ (Dec)ExcludingCurrency
TranslationQuarters Ended December 31, 2016 2015 2016 2015 Inc/ (Dec)
Franchised
U.S. 82.5% 83.3% $ 945.8 $ 953.7 (1)% (1)%International Lead Markets 80.3 80.4 597.0 581.4 3 7High Growth Markets 71.1 71.4 143.9 133.7 8 10Foundational Markets & Corporate 89.7 88.6 254.6 226.1 13 15
Total 81.7% 82.0% $ 1,941.3 $ 1,894.9 2 % 4 %Company-operated
U.S. 18.3% 16.0% $ 163.3 $ 171.6 (5)% (5)%International Lead Markets 20.7 20.3 213.2 241.5 (12) (5)High Growth Markets 13.1 10.4 172.7 131.9 31 33Foundational Markets & Corporate 16.1 13.5 67.7 66.6 1 2
Total 16.9% 15.2% $ 616.9 $ 611.6 1 % 4 % Percent Amount
Inc/ (Dec)ExcludingCurrency
TranslationYears Ended December 31, 2016 2015 2016 2015 Inc/ (Dec)
Franchised
U.S. 82.6% 82.7% $ 3,725.5 $ 3,605.8 3 % 3 %International Lead Markets 80.2 80.0 2,362.8 2,254.4 5 8High Growth Markets 70.2 71.1 549.9 519.6 6 8Foundational Markets & Corporate 89.1 88.3 970.3 898.0 8 12
Total 81.6% 81.5% $ 7,608.5 $ 7,277.8 5 % 6 %Company-operated
U.S. 16.5% 15.1% $ 617.7 $ 632.1 (2)% (2)%International Lead Markets 20.7 20.0 886.4 961.4 (8) (3)High Growth Markets 14.8 12.1 796.1 658.5 21 26Foundational Markets & Corporate 15.6 12.7 296.0 259.4 14 17
Total 17.0% 15.2% $ 2,596.2 $ 2,511.4 3 % 7 %
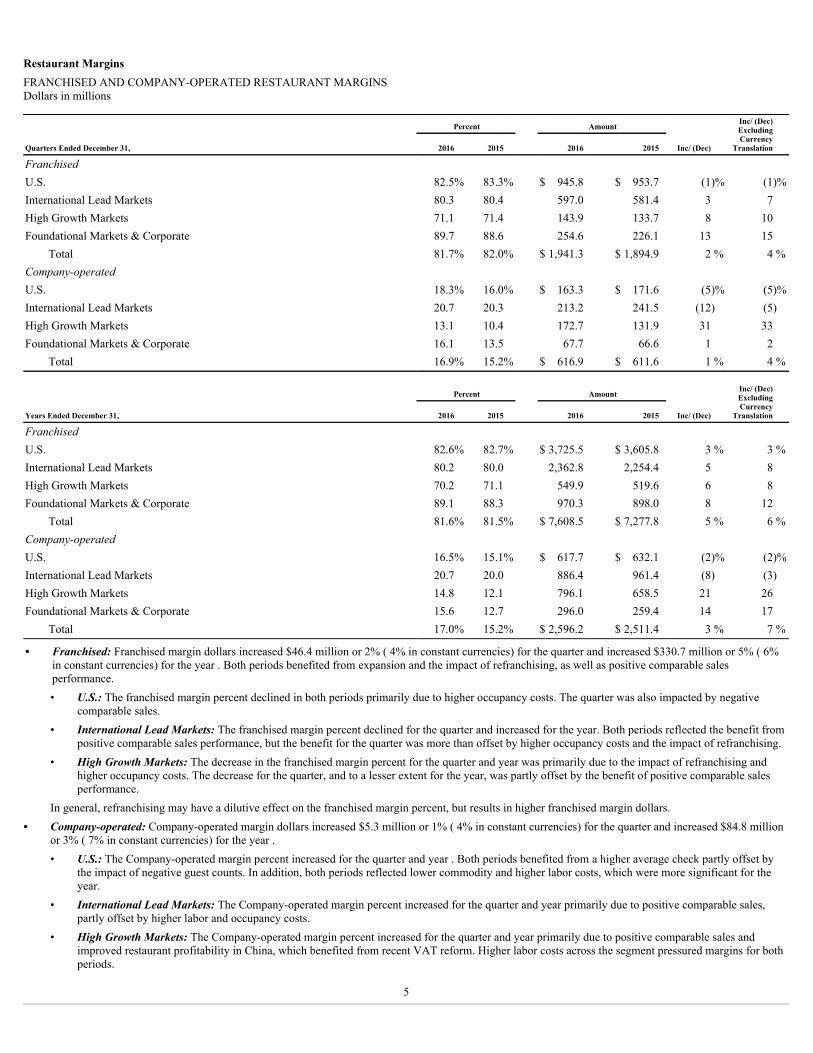
• Franchised:Franchised margin dollars increased $46.4 million or 2% ( 4% in constant currencies) for the quarter and increased $330.7 million or 5% ( 6%in constant currencies) for the year . Both periods benefited from expansion and the impact of refranchising, as well as positive comparable salesperformance.• U.S.:The franchised margin percent declined in both periods primarily due to higher occupancy costs. The quarter was also impacted by negative
comparable sales.• InternationalLeadMarkets:The franchised margin percent declined for the quarter and increased for the year. Both periods reflected the benefit from
positive comparable sales performance, but the benefit for the quarter was more than offset by higher occupancy costs and the impact of refranchising.• HighGrowthMarkets:The decrease in the franchised margin percent for the quarter and year was primarily due to the impact of refranchising and
higher occupancy costs. The decrease for the quarter, and to a lesser extent for the year, was partly offset by the benefit of positive comparable salesperformance.
In general, refranchising may have a dilutive effect on the franchised margin percent, but results in higher franchised margin dollars.• Company-operated:Company-operated margin dollars increased $5.3 million or 1% ( 4% in constant currencies) for the quarter and increased $84.8 million
or 3% ( 7% in constant currencies) for the year .• U.S.:The Company-operated margin percent increased for the quarter and year . Both periods benefited from a higher average check partly offset by
the impact of negative guest counts. In addition, both periods reflected lower commodity and higher labor costs, which were more significant for theyear.
• InternationalLeadMarkets:The Company-operated margin percent increased for the quarter and year primarily due to positive comparable sales,partly offset by higher labor and occupancy costs.
• HighGrowthMarkets:The Company-operated margin percent increased for the quarter and year primarily due to positive comparable sales andimproved restaurant profitability in China, which benefited from recent VAT reform. Higher labor costs across the segment pressured margins for bothperiods.
5
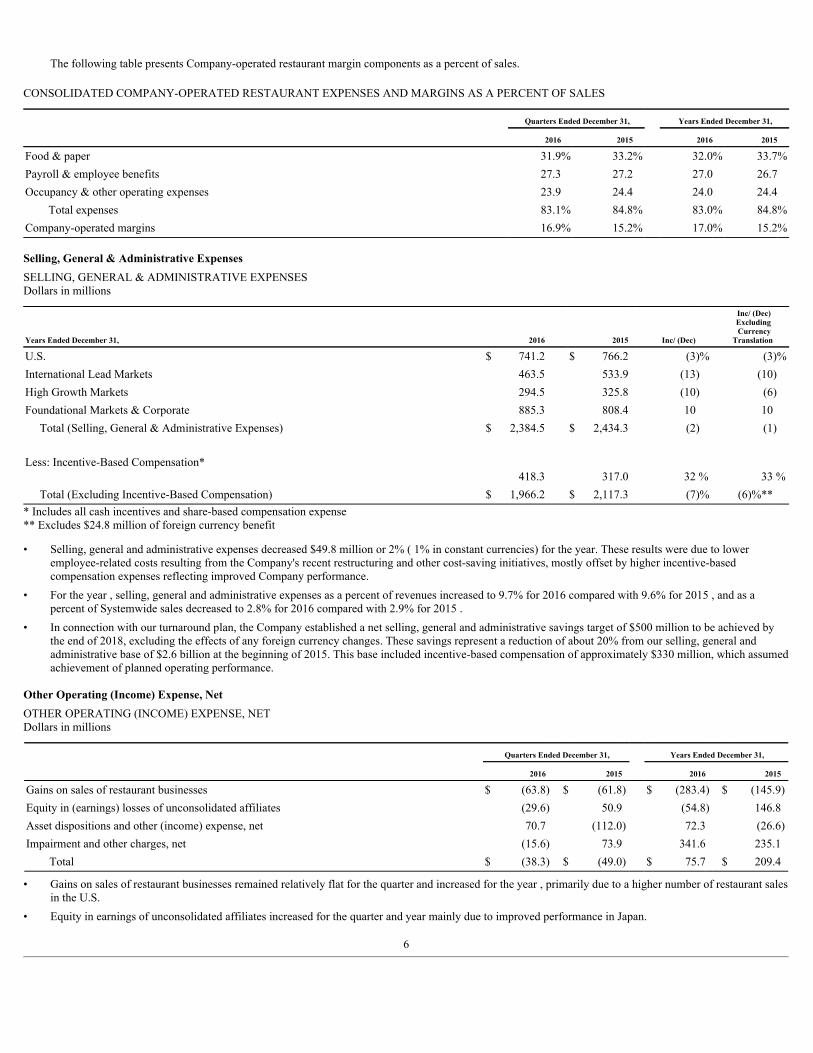
The following table presents Company-operated restaurant margin components as a percent of sales.
CONSOLIDATED COMPANY-OPERATED RESTAURANT EXPENSES AND MARGINS AS A PERCENT OF SALES
Quarters Ended December 31, Years Ended December 31,
2016 2015 2016 2015
Food & paper 31.9% 33.2% 32.0% 33.7%Payroll & employee benefits 27.3 27.2 27.0 26.7Occupancy & other operating expenses 23.9 24.4 24.0 24.4
Total expenses 83.1% 84.8% 83.0% 84.8%Company-operated margins 16.9% 15.2% 17.0% 15.2%
Selling, General & Administrative ExpensesSELLING, GENERAL & ADMINISTRATIVE EXPENSESDollars in millions
Years Ended December 31, 2016 2015 Inc/ (Dec)
Inc/ (Dec) Excluding Currency
Translation
U.S. $ 741.2 $ 766.2 (3)% (3)%International Lead Markets 463.5 533.9 (13) (10)High Growth Markets 294.5 325.8 (10) (6)Foundational Markets & Corporate 885.3 808.4 10 10 Total (Selling, General & Administrative Expenses) $ 2,384.5 $ 2,434.3 (2) (1) Less: Incentive-Based Compensation*
418.3 317.0 32 % 33 % Total (Excluding Incentive-Based Compensation) $ 1,966.2 $ 2,117.3 (7)% (6)%*** Includes all cash incentives and share-based compensation expense** Excludes $24.8 million of foreign currency benefit
• Selling, general and administrative expenses decreased $49.8 million or 2% ( 1% in constant currencies) for the year. These results were due to loweremployee-related costs resulting from the Company's recent restructuring and other cost-saving initiatives, mostly offset by higher incentive-basedcompensation expenses reflecting improved Company performance.
• For the year , selling, general and administrative expenses as a percent of revenues increased to 9.7% for 2016 compared with 9.6% for 2015 , and as apercent of Systemwide sales decreased to 2.8% for 2016 compared with 2.9% for 2015 .
• In connection with our turnaround plan, the Company established a net selling, general and administrative savings target of $500 million to be achieved bythe end of 2018, excluding the effects of any foreign currency changes. These savings represent a reduction of about 20% from our selling, general andadministrative base of $2.6 billion at the beginning of 2015. This base included incentive-based compensation of approximately $330 million, which assumedachievement of planned operating performance.
Other Operating (Income) Expense, NetOTHER OPERATING (INCOME) EXPENSE, NETDollars in millions
Quarters Ended December 31, Years Ended December 31,
2016 2015 2016 2015
Gains on sales of restaurant businesses $ (63.8) $ (61.8) $ (283.4) $ (145.9)Equity in (earnings) losses of unconsolidated affiliates (29.6) 50.9 (54.8) 146.8Asset dispositions and other (income) expense, net 70.7 (112.0) 72.3 (26.6)Impairment and other charges, net (15.6) 73.9 341.6 235.1
Total $ (38.3) $ (49.0) $ 75.7 $ 209.4
• Gains on sales of restaurant businesses remained relatively flat for the quarter and increased for the year , primarily due to a higher number of restaurant salesin the U.S.
• Equity in earnings of unconsolidated affiliates increased for the quarter and year mainly due to improved performance in Japan.
6
• The increase in asset dispositions and other expense for the quarter and year reflected the negative impact from lapping the fourth quarter 2015 gain of $135million on the strategic sale of a unique restaurant property in the U.S. For the year, results benefited from comparison to asset write-offs of $72 millionresulting from the decision to close under-performing restaurants, mostly in the U.S. and China, in first quarter 2015.
• Impairment and other charges, net decreased for the quarter and increased for the year. In 2016, the quarter included $16 million of net pre-tax strategiccredits consisting of a gain of $75 million from the sale of McDonald’s Singapore to a developmental licensee, partly offset by restructuring charges, whilethe year included net pre-tax impairment and restructuring charges of $342 million. In 2015, the fourth quarter and year included net pre-tax strategic chargesof $74 million and $235 million, respectively, primarily consisting of impairment and restructuring charges.
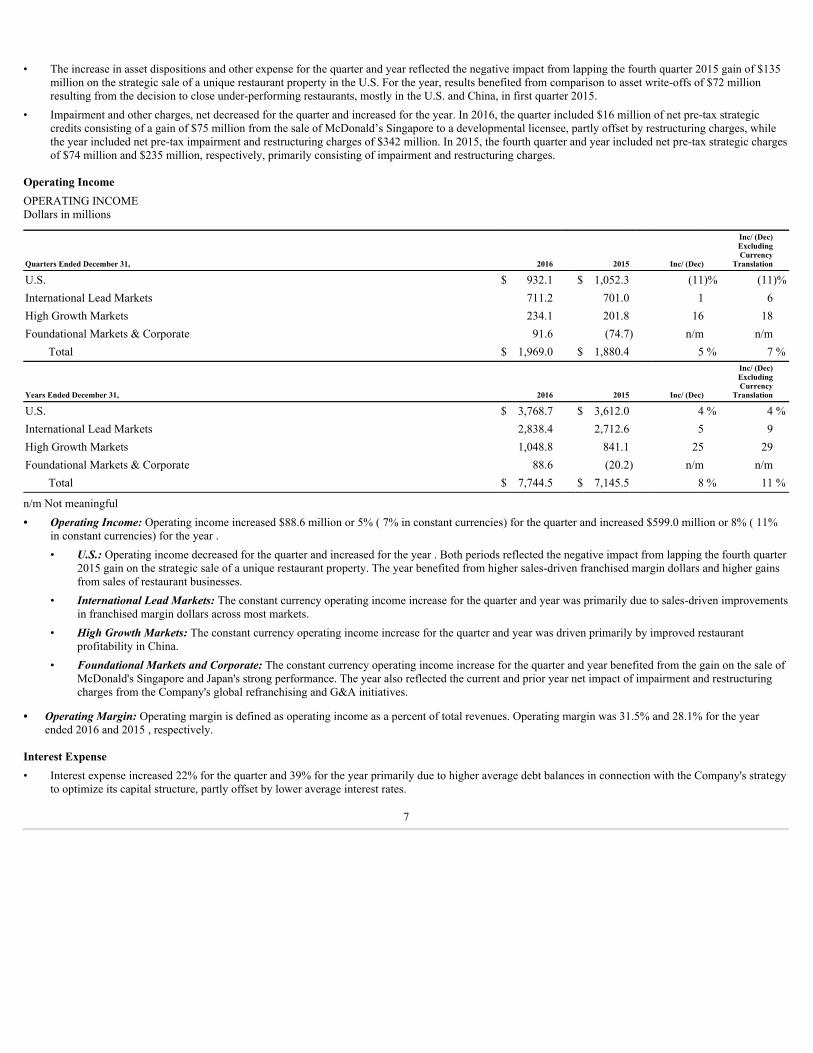
Operating IncomeOPERATING INCOMEDollars in millions
Quarters Ended December 31, 2016 2015 Inc/ (Dec)
Inc/ (Dec)ExcludingCurrency
Translation
U.S. $ 932.1 $ 1,052.3 (11)% (11)%International Lead Markets 711.2 701.0 1 6High Growth Markets 234.1 201.8 16 18Foundational Markets & Corporate 91.6 (74.7) n/m n/m
Total $ 1,969.0 $ 1,880.4 5 % 7 %
Years Ended December 31, 2016 2015 Inc/ (Dec)
Inc/ (Dec)ExcludingCurrency
Translation
U.S. $ 3,768.7 $ 3,612.0 4 % 4 %International Lead Markets 2,838.4 2,712.6 5 9High Growth Markets 1,048.8 841.1 25 29Foundational Markets & Corporate 88.6 (20.2) n/m n/m
Total $ 7,744.5 $ 7,145.5 8 % 11 %
n/m Not meaningful• OperatingIncome:Operating income increased $88.6 million or 5% ( 7% in constant currencies) for the quarter and increased $599.0 million or 8% ( 11%
in constant currencies) for the year .• U.S.:Operating income decreased for the quarter and increased for the year . Both periods reflected the negative impact from lapping the fourth quarter
2015 gain on the strategic sale of a unique restaurant property. The year benefited from higher sales-driven franchised margin dollars and higher gainsfrom sales of restaurant businesses.
• InternationalLeadMarkets:The constant currency operating income increase for the quarter and year was primarily due to sales-driven improvementsin franchised margin dollars across most markets.
• HighGrowthMarkets:The constant currency operating income increase for the quarter and year was driven primarily by improved restaurantprofitability in China.
• FoundationalMarketsandCorporate:The constant currency operating income increase for the quarter and year benefited from the gain on the sale ofMcDonald's Singapore and Japan's strong performance. The year also reflected the current and prior year net impact of impairment and restructuringcharges from the Company's global refranchising and G&A initiatives.
• OperatingMargin:Operating margin is defined as operating income as a percent of total revenues. Operating margin was 31.5% and 28.1% for the yearended 2016 and 2015 , respectively.
Interest Expense• Interest expense increased 22% for the quarter and 39% for the year primarily due to higher average debt balances in connection with the Company's strategy
to optimize its capital structure, partly offset by lower average interest rates.
7
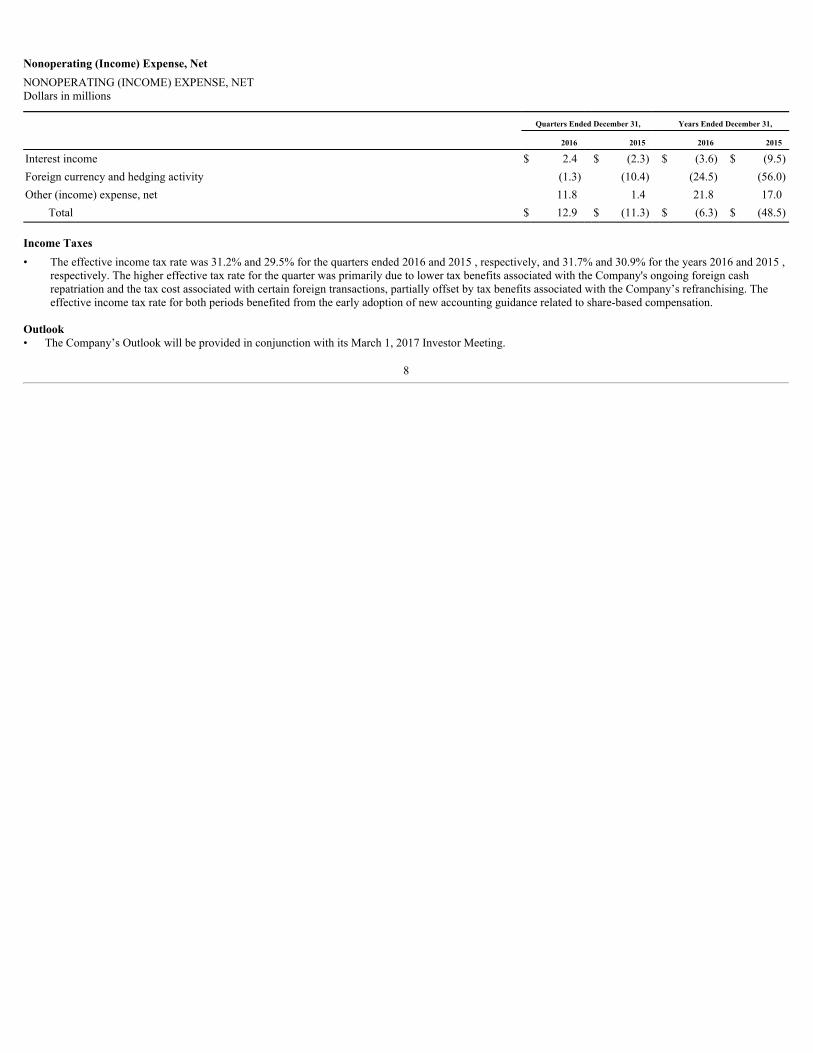
Nonoperating (Income) Expense, NetNONOPERATING (INCOME) EXPENSE, NETDollars in millions
Quarters Ended December 31, Years Ended December 31,
2016 2015 2016 2015
Interest income $ 2.4 $ (2.3) $ (3.6) $ (9.5)Foreign currency and hedging activity (1.3) (10.4) (24.5) (56.0)Other (income) expense, net 11.8 1.4 21.8 17.0
Total $ 12.9 $ (11.3) $ (6.3) $ (48.5)
Income Taxes• The effective income tax rate was 31.2% and 29.5% for the quarters ended 2016 and 2015 , respectively, and 31.7% and 30.9% for the years 2016 and 2015 ,
respectively. The higher effective tax rate for the quarter was primarily due to lower tax benefits associated with the Company's ongoing foreign cashrepatriation and the tax cost associated with certain foreign transactions, partially offset by tax benefits associated with the Company’s refranchising. Theeffective income tax rate for both periods benefited from the early adoption of new accounting guidance related to share-based compensation.
Outlook• The Company’s Outlook will be provided in conjunction with its March 1, 2017 Investor Meeting.
8

Restaurant InformationSYSTEMWIDE RESTAURANTS
At December 31, 2016 2015 Inc/ (Dec)
U.S. 14,155 14,259 (104) International Lead Markets
Germany 1,470 1,478 (8)Canada 1,450 1,443 7France 1,419 1,384 35United Kingdom 1,274 1,261 13Australia 956 955 1Other 282 281 1
Total International Lead Markets 6,851 6,802 49 High Growth Markets
China 2,391 2,223 168Russia 608 541 67Italy 554 531 23Spain 501 497 4Korea 435 434 1Other 1,063 1,040 23
Total High Growth Markets 5,552 5,266 286 Foundational Markets & Corporate
Japan 2,911 2,956 (45)Brazil 902 883 19Philippines 520 481 39Taiwan 397 405 (8)Other 5,611 5,473 138
Total Foundational Markets & Corporate 10,341 10,198 143 Systemwide restaurants 36,899 36,525 374 Countries 120 119 1
9

SYSTEMWIDE RESTAURANTS BY TYPE
At December 31, 2016 2015 Inc/ (Dec)
U.S.
Conventional franchised 13,046 12,899 147Company-operated 1,109 1,360 (251)
Total U.S. 14,155 14,259 (104) International Lead Markets
Conventional franchised 5,765 5,556 209Developmental licensed 19 17 2
Total Franchised 5,784 5,573 211Company-operated 1,067 1,229 (162)
Total International Lead Markets 6,851 6,802 49 High Growth Markets
Conventional franchised 1,774 1,668 106Developmental licensed 582 477 105Foreign affiliated 292 282 10
Total Franchised 2,648 2,427 221Company-operated 2,904 2,839 65
Total High Growth Markets 5,552 5,266 286 Foundational Markets & Corporate
Conventional franchised 974 1,024 (50)Developmental licensed 5,699 5,035 664Foreign affiliated 3,079 3,123 (44)
Total Franchised 9,752 9,182 570Company-operated 589 1,016 (427)
Total Foundational Markets & Corporate 10,341 10,198 143 Systemwide
Conventional franchised 21,559 21,147 412Developmental licensed 6,300 5,529 771Foreign affiliated 3,371 3,405 (34)
Total Franchised 31,230 30,081 1,149Company-operated 5,669 6,444 (775)
Total Systemwide 36,899 36,525 374
10
Risk Factors and Cautionary Statement Regarding Forward-Looking StatementsThe information in this report includes forward-looking statements about future events and circumstances and their effects upon revenues, expenses and
business opportunities. Generally speaking, any statement in this report not based upon historical fact is a forward-looking statement. Forward-looking statementscan also be identified by the use of forward-looking words, such as “may,” “will,” “expect,” “believe” and “plan” or similar expressions. In particular, statementsregarding our plans, strategies, prospects and expectations regarding our business and industry are forward-looking statements. They reflect our expectations, arenot guarantees of performance and speak only as of the date of this report. Except as required by law, we do not undertake to update them. Our expectations (or theunderlying assumptions) may change or not be realized, and you should not rely unduly on forward-looking statements. Our business results are subject to a varietyof risks, including those that are reflected in the following considerations and factors, as well as elsewhere in our filings with the SEC. If any of theseconsiderations or risks materialize, our expectations may change and our performance may be adversely affected.If we do not successfully design and execute our business strategies, we may not be able to increase operating income or market share.
To drive future results, we must design business strategies that are effective in delivering operating income growth. Whether these strategies are successfuldepends mainly on our System’s ability to:
• Continue to innovate and differentiate the McDonald’s experience in a way that balances value to our customers with profitability;• Reinvest in our restaurants and identify and develop restaurant sites consistent with our plans for net growth of Systemwide restaurants;• Provide clean and friendly environments that deliver a consistent McDonald's experience and demonstrate high service levels;• Drive restaurant improvements that achieve optimal capacity, particularly during peak mealtime hours; and• Manage the complexity of our restaurant operations.
If we are delayed or unsuccessful in executing our strategies, or if our strategies do not yield the desired results, our business, financial condition and resultsof operations may suffer.
The implementation of our turnaround plan may intensify the risks we face and may not be successful in achieving improved performance.Our turnaround plan includes an accelerated pace of refranchising, cost savings initiatives and global restructuring. As we continue to implement our plans,
the existing risks we face in our business may be intensified. Our efforts to reduce costs and capital expenditures depend, in part, upon our refranchising efforts,which, in turn, depend upon our ability to select qualified and capable franchisees and licensees. Our cost savings initiatives also depend upon our ability toachieve efficiencies through the consolidation of global, back-office functions. Therefore, if our turnaround-related initiatives are not successful, take longer tocomplete than initially projected, or are not well executed, or if our cost reduction efforts adversely impact our effectiveness, our business operations, financialresults and results of operations could be adversely affected.We face intense competition in our markets, which could hurt our business.
We compete primarily in the “informal eating out” (IEO) segment, which is highly competitive. We are facing sluggish restaurant industry trends in severalkey markets, including the U.S. We also face sustained, intense competition from traditional, fast casual and other competitors, which may include many non-traditional market participants such as convenience stores, grocery stores and coffee shops. We expect our environment to continue to be highly competitive, andour results in any particular reporting period may be impacted by new or continuing actions of our competitors, which may have a short- or long-term impact onour results.
We compete on the basis of product choice, quality, affordability, service and location. In particular, we believe our ability to compete successfully in thecurrent market environment depends on our ability to improve existing products, develop new products, price our products appropriately, deliver a relevantcustomer experience, manage the complexity of our restaurant operations and respond effectively to our competitors’ actions. Recognizing these dependencies, wehave intensified our focus in recent periods on strategies to achieve these goals, including the turnaround plan described above, and we will likely continue tomodify our strategies and implement new strategies in the future. There can be no assurance these strategies will be effective, and some strategies may be effectiveat improving some metrics while adversely affecting other metrics.If we do not anticipate and address evolving consumer preferences, our business could suffer.
Our continued success depends on our System’s ability to anticipate and respond effectively to continuously shifting consumer demographics, and trends infood sourcing, food preparation and consumer preferences in the IEO segment. In order to deliver a relevant experience for our customers amidst a highlycompetitive, value-driven operating environment, we must implement initiatives to adapt at an aggressive pace. There is no assurance that these initiatives will besuccessful and, if they are not, our financial results could be adversely impacted.
11
If pricing, promotional and marketing plans are not effective, our results may be negatively impacted.Our results depend on the impact of pricing, promotional and marketing plans across the System, and the ability to adjust these plans to respond quickly and
effectively to evolving customer preferences, as well as shifting economic and competitive conditions. Existing or future pricing strategies, and the valueproposition they represent, are expected to continue to be important components of our business strategy; however, they may not be successful and couldnegatively impact sales and margins. Further, the promotion of menu offerings may yield results below the desired levels. We may also not fully realize thebenefits of the significant investments we are making to enhance the customer experience through digital engagement and social media.
Additionally, we operate in a complex and costly advertising environment. Our marketing and advertising programs may not be successful, and we may failto attract and retain customers. We have expanded engagement with our customers through digital media and loyalty initiatives. Our success depends in part onwhether the allocation of our advertising and marketing resources across different channels allows us to reach our customers effectively. If the advertising andmarketing programs are not successful, or are not as successful as those of our competitors, our sales, guest counts and market share could decrease.Failure to preserve the value and relevance of our brand could have a negative impact on our financial results.
To be successful in the future, we believe we must preserve, enhance and leverage the value of our brand. Brand value is based in part on consumerperceptions. Those perceptions are affected by a variety of factors, including the nutritional content and preparation of our food, the ingredients we use, ourbusiness practices and the manner in which we source the commodities we use. Consumer acceptance of our offerings is subject to change for a variety of reasons,and some changes can occur rapidly. For example, nutritional, health and other scientific studies and conclusions, which constantly evolve and may havecontradictory implications, drive popular opinion, litigation and regulation (including initiatives intended to drive consumer behavior) in ways that affect the IEOsegment or perceptions of our brand generally or relative to available alternatives. Consumer perceptions may also be affected by third parties presenting orpromoting adverse commentary or portrayals of the quick-service category of the IEO segment, our brand and/or our operations, our suppliers or our franchisees. Ifwe are unsuccessful in addressing such adverse commentary or portrayals, our brand and our financial results may suffer.
Additionally, the ongoing relevance of our brand may depend on the success of our sustainability initiatives, which require System-wide coordination andalignment. If we are not effective in addressing social responsibility matters or achieving relevant sustainability goals, consumer trust in our brand may suffer. Inparticular, business incidents that erode consumer trust or confidence, particularly if such incidents receive considerable publicity or result in litigation, cansignificantly reduce brand value and have a negative impact on our financial results.Unfavorable general economic conditions could adversely affect our business and financial results.
Our results of operations are substantially affected by economic conditions, which can vary significantly by market and can impact consumer disposableincome levels and spending habits. Economic conditions can also be impacted by a variety of factors including hostilities, epidemics and actions taken bygovernments to manage national and international economic matters, whether through austerity or stimulus measures or trade measures, and initiatives intended tocontrol wages, unemployment, credit availability, inflation, taxation and other economic drivers. Continued adverse economic conditions or adverse changes ineconomic conditions in our markets could pressure our operating performance, and our business and financial results may suffer.
Our results of operations are also affected by fluctuations in currency exchange rates, which may adversely affect reported earnings.Supply chain interruptions may increase costs or reduce revenues.
We depend on the effectiveness of our supply chain management to assure reliable and sufficient product supply, including on favorable terms. Althoughmany of the products we sell are sourced from a wide variety of suppliers in countries around the world, certain products have limited suppliers, which mayincrease our reliance on those suppliers. Supply chain interruptions, including shortages and transportation issues, and price increases can adversely affect us aswell as our suppliers and franchisees whose performance may have a significant impact on our results. Such shortages or disruptions could be caused by factorsbeyond the control of our suppliers, franchisees or us. If we experience interruptions in our System’s supply chain, our costs could increase and it could limit theavailability of products critical to our System’s operations.Food safety concerns may have an adverse effect on our business.
Our ability to increase sales and profits depends on our System’s ability to meet expectations for safe food and on our ability to manage the potential impacton McDonald’s of food-borne illnesses and food or product safety issues that may arise in the future. Food safety is a top priority, and we dedicate substantialresources to ensure that our customers enjoy safe food products, including as our menu evolves. However, food safety events, including instances of food-borneillness, have occurred in the food industry in the past, and could occur in the future. Instances of food tampering, food contamination or food-borne illness, whetheractual or perceived, could adversely affect our brand and reputation as well as our revenues and profits.
12
Our franchise business model presents a number of risks.Our success increasingly relies on the financial success and cooperation of our franchisees, yet we have limited influence over their operations. Our
restaurant margins arise from two sources: fees from franchised restaurants (e.g., rent and royalties based on a percentage of sales) and, to a lesser degree, salesfrom Company-operated restaurants. Our franchisees manage their businesses independently, and therefore are responsible for the day-to-day operation of theirrestaurants. The revenues we realize from franchised restaurants are largely dependent on the ability of our franchisees to grow their sales. If our franchisees do notexperience sales growth, our revenues and margins could be negatively affected as a result. Also, if sales trends worsen for franchisees, their financial results maydeteriorate, which could result in, among other things, restaurant closures or delayed or reduced payments to us. Our refranchising effort will increase thatdependence and the effect of those factors.
Our success also increasingly depends on the willingness and ability of our independent franchisees to implement major initiatives, which may includefinancial investment, and to remain aligned with us on operating, promotional and capital-intensive reinvestment plans. Franchisees’ ability to contribute to theachievement of our plans is dependent in large part on the availability to them of funding at reasonable interest rates and may be negatively impacted by thefinancial markets in general or by the creditworthiness of our franchisees or the Company. Our operating performance could also be negatively affected if ourfranchisees experience food safety or other operational problems or project an image inconsistent with our brand and values, particularly if our contractual andother rights and remedies are limited, costly to exercise or subjected to litigation. If franchisees do not successfully operate restaurants in a manner consistent withour required standards, the brand’s image and reputation could be harmed, which in turn could hurt our business and operating results.
Our ownership mix also affects our results and financial condition. The decision to own restaurants or to operate under franchise or license agreements isdriven by many factors whose interrelationship is complex and changing. Our ability to achieve the benefits of our refranchising strategy, which involves a shift toa greater percentage of franchised restaurants, in a timely manner or at all, will depend on various factors, including our ability to timely and effectively selectfranchisees and/or licensees that meet our rigorous standards and/or to complete transactions on favorable terms and to manage associated risks. It will also dependon the performance of our franchisees, and whether the resulting ownership mix supports our financial objectives.Changes in commodity and other operating costs could adversely affect our results of operations.
The profitability of our Company-operated restaurants depends in part on our ability to anticipate and react to changes in commodity costs, including food,paper, supply, fuel, utilities, distribution and other operating costs. Any volatility in certain commodity prices could adversely affect our operating results byimpacting restaurant profitability. The commodity markets for some of the ingredients we use, such as beef and chicken, are particularly volatile due to factorssuch as seasonal shifts, climate conditions, industry demand, international commodity markets, food safety concerns, product recalls and government regulation, allof which are beyond our control and, in many instances, unpredictable. We can only partially address future price risk through hedging and other activities, andtherefore increases in commodity costs could have an adverse impact on our profitability.The global scope of our business subjects us to risks that could negatively affect our business.
We encounter differing cultural, regulatory and economic environments within and among the more than 100 countries where McDonald’s restaurantsoperate, and our ability to achieve our business objectives depends on the System's success in these environments. Meeting customer expectations is complicatedby the risks inherent in our global operating environment, and our global success is partially dependent on our System’s ability to leverage operating successesacross markets. Planned initiatives may not have appeal across multiple markets with McDonald's customers and could drive unanticipated changes in customerperceptions and guest counts.
Disruptions in operations or price volatility in a market can also result from governmental actions, such as price, foreign exchange or changes in trade-related tariffs or controls, government-mandated closure of our, our franchisees' or our suppliers’ operations, and asset seizures. The cost and disruption ofresponding to governmental investigations or inquiries, whether or not they have merit, may impact our results and could cause reputational or other harm. Ourinternational success depends in part on the effectiveness of our strategies and brand-building initiatives to reduce our exposure to such governmentalinvestigations or inquiries.
Additionally, challenges and uncertainties are associated with operating in developing markets, which may entail a relatively higher risk of politicalinstability, economic volatility, crime, corruption and social and ethnic unrest. Such challenges may be exacerbated in many cases by a lack of an independent andexperienced judiciary and uncertainties in how local law is applied and enforced, including in areas most relevant to commercial transactions and foreigninvestment. An inability to manage effectively the risks associated with our international operations could have a material adverse effect on our business andfinancial condition.
We may also face challenges and uncertainties in developed markets. For example, as a result of the U.K.'s decision to leave the European Union through anegotiated exit over a period of time, it is possible that there will be increased regulatory complexities, as well as potential referenda in the U.K. and/or otherEuropean countries, that could cause uncertainty in European or worldwide economic conditions. In the short term, the decision created volatility in certain foreigncurrency exchange rates, and the resulting depression in those exchange rates may continue. Any of these effects, and others we cannot anticipate, could adverselyaffect our business, results of operations, financial condition and cash flows.
13
Challenges with respect to talent management could harm our business.Effective succession planning is important to our long-term success. Failure effectively to identify, develop and retain key personnel, recruit high-quality
candidates and ensure smooth management and personnel transitions could disrupt our business and adversely affect our results.Our success depends in part on our System’s ability to recruit, motivate and retain a qualified workforce to work in our restaurants in an intensely
competitive environment. Increased costs associated with recruiting, motivating and retaining qualified employees to work in our Company-operated restaurantscould have a negative impact on our Company-operated margins. Similar concerns apply to our franchisees.
We are also impacted by the costs and other effects of compliance with U.S. and international regulations affecting our workforce, which includes our staffand employees working in our Company-operated restaurants. These regulations are increasingly focused on employment issues, including wage and hour,healthcare, immigration, retirement and other employee benefits and workplace practices. Our potential exposure to reputational and other harm regarding ourworkplace practices or conditions or those of our independent franchisees or suppliers (or perceptions thereof) could have a negative impact on consumerperceptions of us and our business. Additionally, economic action, such as boycotts, protests, work stoppages or campaigns by labor organizations, could adverselyaffect us (including our ability to recruit and retain talent) or the franchisees and suppliers that are also part of the McDonald's System and whose performance mayhave a material impact on our results.Information technology system failures or interruptions or breaches of network security may interrupt our operations.
We are increasingly reliant on technological systems, such as point-of-sale and other in-store systems or platforms, as well as technologies that facilitatecommunication and collaboration internally, with affiliated entities, or with independent third parties to conduct our business, including technology-enabledsolutions provided to us by third parties. Any failure of these systems could significantly impact our operations and customer perceptions.
Despite the implementation of security measures, those technology systems and solutions could become vulnerable to damage, disability or failures due totheft, fire, power loss, telecommunications failure or other catastrophic events. The third party solutions also present the risks faced by the third party’s business. Ifthose systems or solutions were to fail or otherwise be unavailable, and we were unable to recover in a timely way, we could experience an interruption in ouroperations.
Furthermore, security breaches involving our systems, the systems of the parties we communicate or collaborate with, or those of third party providers mayoccur, such as unauthorized access, denial of service, computer viruses and other disruptive problems caused by hackers. Our information technology systemscontain personal, financial and other information that is entrusted to us by our customers and employees as well as financial, proprietary and other confidentialinformation related to our business. An actual or alleged security breach could result in system disruptions, shutdowns, theft or unauthorized disclosure ofconfidential information. The occurrence of any of these incidents could result in adverse publicity, loss of consumer confidence, reduced sales and profits, andcriminal penalties or civil liabilities.Increasing regulatory complexity may adversely affect restaurant operations and our financial results.
Our regulatory environment worldwide exposes us to complex compliance and similar risks that could affect our operations and results in material ways. Inmany of our markets, we are subject to increasing regulation, which has increased our cost of doing business. We are affected by the cost, compliance and otherrisks associated with the often conflicting and highly prescriptive regulations we face, including where inconsistent standards imposed by multiple governmentalauthorities can adversely affect our business and increase our exposure to litigation or governmental investigations or proceedings.
Our success depends in part on our ability to manage the impact of new, potential or changing regulations that can affect our business plans and operations.These regulations include product packaging, marketing, the nutritional content and safety of our food and other products, labeling and other disclosure practices;and compliance efforts may be affected by ordinary variations in food preparation among our own restaurants and the need to rely on the accuracy andcompleteness of information from third-party suppliers (particularly given varying requirements and practices for testing and disclosure).
Additionally, we are working to manage the risks and costs to us, our franchisees and our supply chain of the effects of climate change, greenhouse gases,and diminishing energy and water resources. These risks include the increased public focus, including by governmental and nongovernmental organizations, onthese and other environmental sustainability matters, such as packaging and waste, animal health and welfare, deforestation and land use. These risks also includethe increased pressure to make commitments, set targets or establish additional goals and take actions to meet them. These risks could expose us to market,operational and execution costs or risks. If we are unable to effectively manage the risks associated with our complex regulatory environment, it could have amaterial adverse effect on our business and financial condition.We are subject to increasing legal complexity and could be party to litigation that could adversely affect us.
Increasing legal complexity will continue to affect our operations and results in material ways. We could be subject to legal proceedings that may adverselyaffect our business, including class actions, administrative proceedings, government investigations,
14
employment and personal injury claims, landlord/tenant disputes, disputes with current or former suppliers, claims by current or former franchisees and intellectualproperty claims (including claims that we infringed another party’s trademarks, copyrights or patents).
Inconsistent standards imposed by governmental authorities can adversely affect our business and increase our exposure to regulatory proceedings orlitigation.
Litigation involving our relationship with franchisees and the legal distinction between our franchisees and us for employment law purposes, if determinedadversely, could increase costs, negatively impact the business prospects of our franchisees and subject us to incremental liability for their actions. Similarly,although our commercial relationships with our suppliers remain independent, there may be attempts to challenge that independence, which, if determinedadversely, could also increase costs, negatively impact the business prospects of our suppliers, and subject us to incremental liability for their actions. We are alsosubject to legal and compliance risks and associated liability, such as in the areas of privacy and data collection, protection and management, as it relates toinformation we collect and share when we provide optional technology-related services and platforms to third parties.
Our operating results could also be affected by the following:• The relative level of our defense costs, which vary from period to period depending on the number, nature and procedural status of pending proceedings;• The cost and other effects of settlements, judgments or consent decrees, which may require us to make disclosures or take other actions that may affect
perceptions of our brand and products;• Adverse results of pending or future litigation, including litigation challenging the composition and preparation of our products, or the appropriateness or
accuracy of our marketing or other communication practices; and• The scope and terms of insurance or indemnification protections that we may have.
A judgment significantly in excess of any applicable insurance coverage or third party indemnity could materially adversely affect our financial condition orresults of operations. Further, adverse publicity resulting from these claims may hurt our business.We may not be able to adequately protect our intellectual property or adequately ensure that we are not infringing the intellectual property of others,which could harm the value of the McDonald’s brand and our business.
The success of our business depends on our continued ability to use our existing trademarks and service marks in order to increase brand awareness andfurther develop our branded products in both domestic and international markets. We rely on a combination of trademarks, copyrights, service marks, trade secrets,patents and other intellectual property rights to protect our brand and branded products.
We have registered certain trademarks and have other trademark registrations pending in the United States and certain foreign jurisdictions. The trademarksthat we currently use have not been registered in all of the countries outside of the United States in which we do business or may do business in the future and maynever be registered in all of these countries. The steps we have taken to protect our intellectual property in the United States and foreign countries may not beadequate. In addition, the steps we have taken may not adequately ensure that we do not infringe the intellectual property of others, and third parties may claiminfringement by us in the future. In particular, we may be involved in intellectual property claims, including often aggressive or opportunistic attempts to enforcepatents used in information technology systems, which might affect our operations and results. Any claim of infringement, whether or not it has merit, could betime-consuming, result in costly litigation and harm our business.
We cannot ensure that franchisees and other third parties who hold licenses to our intellectual property will not take actions that hurt the value of ourintellectual property.Changes in tax laws and unanticipated tax liabilities could adversely affect the taxes we pay and our profitability.
We are subject to income and other taxes in the United States and foreign jurisdictions, and our operations, plans and results are affected by tax and otherinitiatives around the world. In particular, we are affected by the impact of changes to tax laws or related authoritative interpretations, including to the extent thatcorporate tax reform becomes a key component of budgetary initiatives in the United States or elsewhere. We are also impacted by settlements of pending or anyfuture adjustments proposed by the IRS or other taxing authorities in connection with our tax audits, all of which will depend on their timing, nature and scope.Any increases in income tax rates, changes in income tax laws or unfavorable resolution of tax matters could have a material adverse impact on our financialresults.Changes in accounting standards or the recognition of impairment or other charges may adversely affect our future operations and results.
New accounting standards or changes in financial reporting requirements, accounting principles or practices, including with respect to our criticalaccounting estimates, could adversely affect our future results. We may also be affected by the nature and timing of decisions about underperforming markets orassets, including decisions that result in impairment or other charges that reduce our earnings. In assessing the recoverability of our long-lived assets, we considerchanges in economic conditions and make assumptions regarding estimated future cash flows and other factors. These estimates are highly subjective and can besignificantly impacted by many factors such as global and local business and economic conditions, operating costs, inflation, competition, consumer anddemographic
15

trends, and our restructuring activities. If our estimates or underlying assumptions change in the future, we may be required to record impairment charges. If weexperience any such changes, they could have a significant adverse effect on our reported results for the affected periods.A decrease in our credit ratings or an increase in our funding costs could adversely affect our profitability.
Our credit ratings may be negatively affected by our results of operations or changes in our debt levels. As a result, our interest expense, the availability ofacceptable counterparties, our ability to obtain funding on favorable terms, collateral requirements and our operating or financial flexibility could all be negativelyaffected, especially if lenders impose new operating or financial covenants.
Our operations may also be impacted by regulations affecting capital flows, financial markets or financial institutions, which can limit our ability to manageand deploy our liquidity or increase our funding costs. If any of these events were to occur, they could have a material adverse effect on our business and financialcondition.Trading volatility and price of our common stock may be adversely affected by many factors.
Many factors affect the volatility and price of our common stock in addition to our operating results and prospects. The most important of these factors,some of which are outside our control, are the following:
• The continuing unpredictable global economic and market conditions;• Governmental action or inaction in light of key indicators of economic activity or events that can significantly influence financial markets, particularly in
the United States, which is the principal trading market for our common stock, and media reports and commentary about economic or other matters, evenwhen the matter in question does not directly relate to our business;
• Trading activity in our common stock or trading activity in derivative instruments with respect to our common stock or debt securities, which can beaffected by market commentary (including commentary that may be unreliable or incomplete); unauthorized disclosures about our performance, plans orexpectations about our business; our actual performance and creditworthiness; investor confidence generally; actions by shareholders and others seeking toinfluence our business strategies; portfolio transactions in our stock by significant shareholders; or trading activity that results from the ordinary courserebalancing of stock indices in which McDonald’s may be included, such as the S&P 500 Index and the Dow Jones Industrial Average;
• The impact of our stock repurchase program or dividend rate; and• The impact on our results of corporate actions and market and third-party perceptions and assessments of such actions, such as those we may take from time
to time as we implement our strategies in light of changing business, legal and tax considerations and evolve our corporate structure.Our results and prospects can be adversely affected by events such as severe weather conditions, natural disasters, hostilities and social unrest, amongothers.
Severe weather conditions, natural disasters, hostilities and social unrest, terrorist activities, health epidemics or pandemics (or expectations about them) canadversely affect consumer spending and confidence levels and supply availability and costs, as well as the local operations in impacted markets, all of which canaffect our results and prospects. Our receipt of proceeds under any insurance we maintain with respect to some of these risks may be delayed or the proceeds maybe insufficient to cover our losses fully.
16