mcgrath limited (asx: mea) - open briefing - home mcgrath limited (asx: mea) ... mkt share up to ......
TRANSCRIPT
Cass O’Connor, Chairperson
DRAFT_1 for discussion purposes onlyMcGRATH LIMITED 2016 ANNUAL GENERAL MEETING
WEDNESDAY 23 NOVEMBER 2016
191 NEW SOUTH HEAD ROAD, EDGECLIFF, NEW SOUTH WALES
McGrath Limited (ASX: MEA)Results for the 6 months ended 31 December 2016
23 February 2017
Cameron Judson, CEO Paul Hauenschild, CFO

1H17 – A SNAPSHOT
1
Note: Financial performance above compares 1H17 pro forma vs 1H16 pro forma results 1. Comparison between 30 June 2016 and 31 December
2016 2. McGrath Management estimates based on published sales data where an agent was recorded in that data. Total market size by value
derived from CoreLogic data, 12 months to 31 Dec 2016. 3. Includes impairment of software costs of $2.2m ($1.5m after tax)
AGENT NUMBERS
UP 6 TO
648¹
EBITDA DOWN
37% TO
$9.3M
OFFICES UP
9 TO
96¹
NPAT DOWN
72% TO
$2.4M³
REVENUE DOWN
8% TO
$67M
COMPANY OWNED
LISTINGS
DOWN 20%
MKT SHARE
UP TO
3.6%²
FULLY FRANKED
INTERIM DIVIDEND
1.0cps
CASH AT BANK
$5.3M

2
Sales
FranchiseServices
Property ManagementOther³
Note: 1 Data as at 31 December 2016 unless otherwise stated; 2 Churn rate is defined as the total number of properties lost as a percentage of total properties managed each year and does not account for
the addition of new properties 3 Incorporates the mortgage broking and training businesses
71 property managers
7,498 properties under
management (leased)
Churn rate of ~20.3%2
Generates revenue
through management
and leasing fees
28 offices
243 agents
2,544 property sales
$3.5 billion value of
property sales
Generates revenue by
charging the vendors of
residential property a
commission for
successfully selling a
property
68 offices
405 agents
4,222 property sales
$3.8 billion value of
property sales
23,102 properties under
management
Partners with 41 franchise
groups
Franchise fees are largely
consistent across the
network
32 brokers settled 748
mortgages for a value of $443
million
~$2.6 billon of loans under
management
Mortgage broking generates
up front and trailing revenue
from each loan
McGrath Training organises
and operates a number of
industry leading residential real
estate conferences in Australia
45 exclusive auctioneers
FY17 H1 EBITDA
Contribution / Margin
65% 21% 21% -7%
Overview1
Company Owned
23% margin 33% margin 60% margin -16% margin
BUSINESS OVERVIEW BY SEGMENT
3
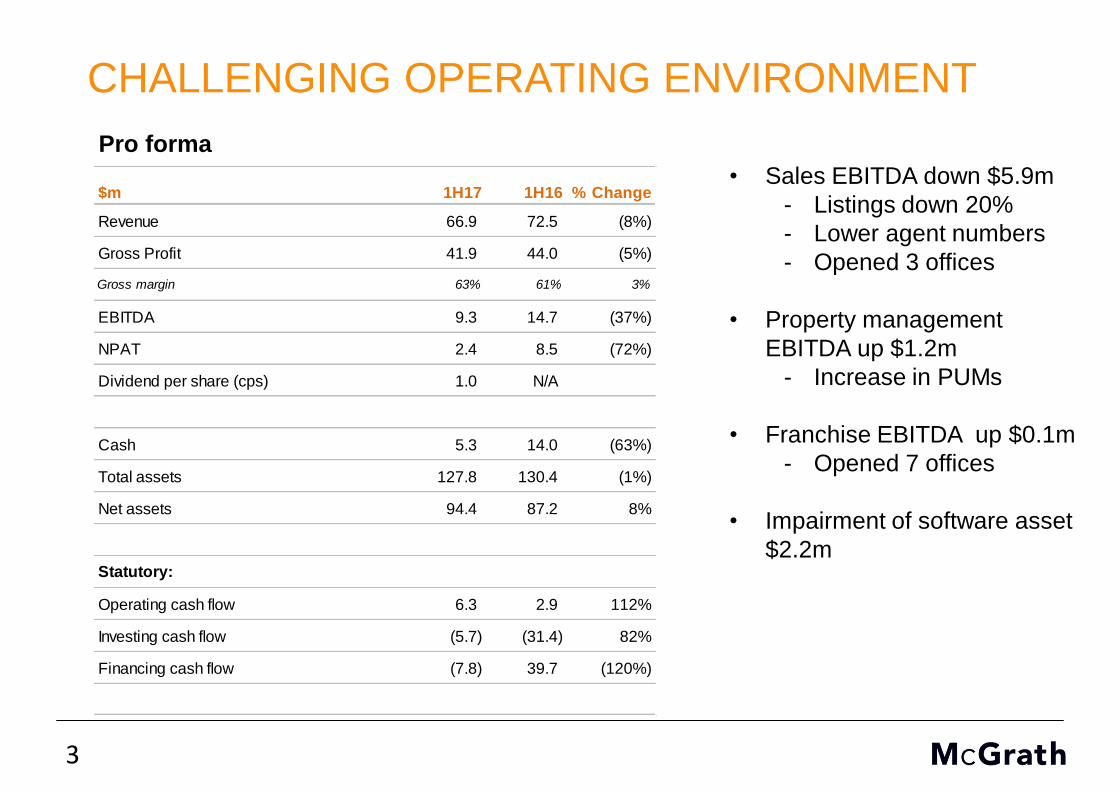
CHALLENGING OPERATING ENVIRONMENT
• Sales EBITDA down $5.9m
- Listings down 20%
- Lower agent numbers
- Opened 3 offices
• Property management
EBITDA up $1.2m
- Increase in PUMs
• Franchise EBITDA up $0.1m
- Opened 7 offices
• Impairment of software asset
$2.2m
Pro forma
$m 1H17 1H16 % Change
Revenue 66.9 72.5 (8%)
Gross Profit 41.9 44.0 (5%)
Gross margin 63% 61% 3%
EBITDA 9.3 14.7 (37%)
NPAT 2.4 8.5 (72%)
Dividend per share (cps) 1.0 N/A
Cash 5.3 14.0 (63%)
Total assets 127.8 130.4 (1%)
Net assets 94.4 87.2 8%
Statutory:
Operating cash flow 6.3 2.9 112%
Investing cash flow (5.7) (31.4) 82%
Financing cash flow (7.8) 39.7 (120%)

4
REVENUE BY SEGMENT• Sales
- Listings down 20%
- Lower agent
numbers
• Property Management
- Increase in PUMs
• Franchise
- Franchise fees up
14%
- Grant fees down
59%
- 4 grant fee signings
vs 8 PCP
70%15%
9%6%
GM
63%73%
13%
8%6%
Sales
Propertymanagement
Franchise
Other
1H16 1H16 1H16 1H161H17 1H17 1H17 1H17
Sales Property management Franchise Other
$m
53.1
46.9
9.2 10.0
5.5 5.8 4.7 4.2
GM
61%
1H16 1H17

5
EBITDA BY SEGMENT• Sales
- 3 new offices in half
- 5 new offices year on
year
- Higher opex
• Property Management
- Focus on productivity
and efficiencies
• Franchise
- Growing network of
offices
• Corporate
- IT infrastructure costs
16.6
2.2 3.3
(1.2) (6.2)
10.7
3.4 3.4
(1.2) (7.0)
Sales Property
management
Franchise Other Corporate
$m
1H16 1H17 1H16 1H17 1H16 1H17
1H16 1H17
1H16 1H17EBITDA
Margins
31% 23% 24% 33% 61% 60% (17% (16%)

6
CASH FLOW WATERFALL
• Dividend payment
• Deferred consideration
payment made to
Smollen Group
• Capital expenditure on
new offices,
relocations and
refurbishment
• IT software spend
- MAP
- Website
• IT program spend
- Infrastructure
refresh
5.3
65.1
1.3 3.21.9
4.8
3.10.2 0.3
72.7
12.5
Openingcash
balance
Receiptsfrom
customers
Paymentsto suppliers
Tax paid Capex (PPE) Capex(Intangible)
Dividends Netfinancing
Acquisitions Other Closing cashbalance
$m
30 June 2016 to 31 December 2016

7
1. McGrath management estimates based on published sales data where an agent was recorded in that data. Total market size derived from CoreLogic data, 12 months to 31 December 2016. 2. Geelong, Victoria
opened 20th February 2017
MCGRATH IS GROWING MARKET SHARE IN
ALL MARKETS
Addressable
Markets
12 mths to
Dec16
12 mths to
Jun16
NSW 7.40% 7.36%
QLD 2.19% 1.79%
ACT 5.02% 4.86%
VIC 0.44% 0.10%
Market share by sales value¹
• Market share increased
nationally to 3.6%¹
• Increases in every state
• 9 offices now in Victoria²
3.6%
1.5% 1.6%2.1%
3.0%
4.8%
8.7%
0%
2%
4%
6%
8%
10%
McGrath Belle Century 21 Raine &Horne
Harcourts LJ Hooker Ray White
Market share by sales value¹
2.2%
0.8%1.7% 2.1%
3.7%
5.2%
9.6%
0%
2%
4%
6%
8%
10%
12%
McGrath Belle Century 21 Raine &Horne
Harcourts LJ Hooker Ray White
Market share by sales volume¹
8
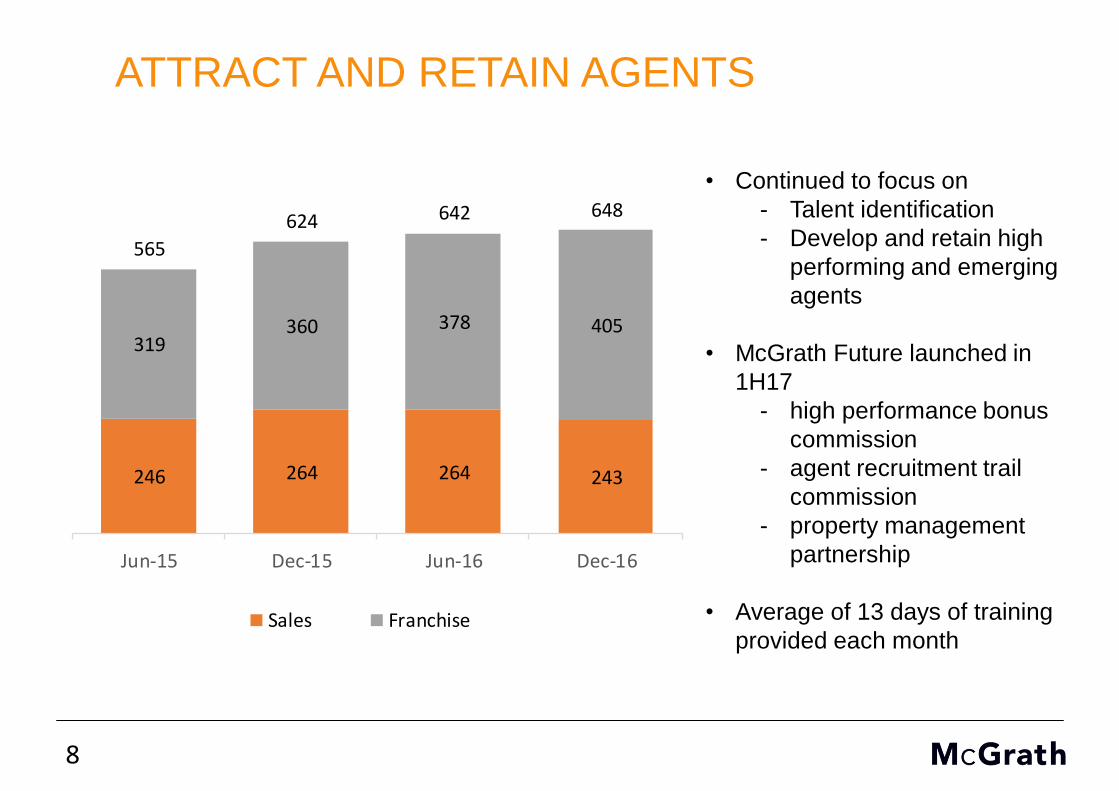
ATTRACT AND RETAIN AGENTS
• Continued to focus on
- Talent identification
- Develop and retain high
performing and emerging
agents
• McGrath Future launched in
1H17
- high performance bonus
commission
- agent recruitment trail
commission
- property management
partnership
• Average of 13 days of training
provided each month
246 264 264 243
319360 378 405
565
624 642 648
Jun-15 Dec-15 Jun-16 Dec-16
Sales Franchise

9
ROLL OUT NEW OFFICES• 96 McGrath offices1
• Opened 3 Sales in 1H17- Forestville, NSW
- Wahroonga, NSW
- Blacktown, NSW
• Opened 7 Franchise in 1H172
- Northcote, VIC
- Hunter Valley, NSW
- Shellharbour, NSW
- Sandringham, VIC
- New Lambton, NSW
- Blackburn, VIC
- Box Hill, VIC
• Geelong, VIC (Franchise) opened in Feb17
• Planned new offices- Yarraville, VIC
- San Souci, NSW
- Berowra, NSW
- Toukley, NSW
1. As at 31 December 20162. Forestville office transferred from franchise to company owned

10
GROWING PROPERTY MANAGEMENT AND
HOME LOANS
0
5,000
10,000
15,000
20,000
25,000
30,000
35,000
Jun-15 Dec-15 Jun-16 Dec-16
No. of properties under management across the McGrath network
0
5
10
15
20
25
Jun-15 Dec-15 Jun-16 Dec-16
Value of properties under management across the McGrath network ($bn)
0
5
10
15
20
25
30
35
Jun-15 Dec-15 Jun-16 Dec-16
No. of Oxygen Brokers
0
200
400
600
800
1,000
0.0
0.5
1.0
1.5
2.0
2.5
3.0
Jun-15 Dec-15 Jun-16 Dec-16
Growth in loan book
Book value ($bn) No. of loans settled

11
OUTLOOK
• Challenging market conditions expected to continue, as seen through lower listing
volumes
• Market share nationally is now 3.6%. We continue to focus on :
- Attract, retain, develop and reward high performing sales agents
- Focus on growing our office network and market share in NSW, ACT, QLD and VIC
- Increase productivity of existing and new agents through new tools and software
• Commenced strategic review with a renewed focus on improving productivity and
performance of each of our existing segments and exploring new revenue opportunities
• Our aim is to grow the relative contributions of our annuity businesses and de-risk the
volatility of our earnings
• Disciplined investment for sustained and profitable growth

Questions

Appendix

14
PRO FORMA P&L
$m 1H16 2H16 1H17
Total revenue 72.5 64.5 66.9
Cost of sales (28.5) (25.7) (25.0)
Gross Profit 44.0 38.8 41.9
Employee benefits expenses (18.1) (16.3) (18.4)
Other expenses (11.2) (11.0) (14.2)
EBITDA 14.7 11.5 9.3
Depreciation and Amortisation (2.4) (3.3) (3.5)
Impairment of software costs 0.0 0.0 (2.2)
EBIT 12.3 8.2 3.6
Net finance costs 0.0 0.1 0.0
Net profit before tax 12.3 8.3 3.6
Tax expense (3.8) (2.2) (1.2)
NPAT 8.5 6.1 2.4
15
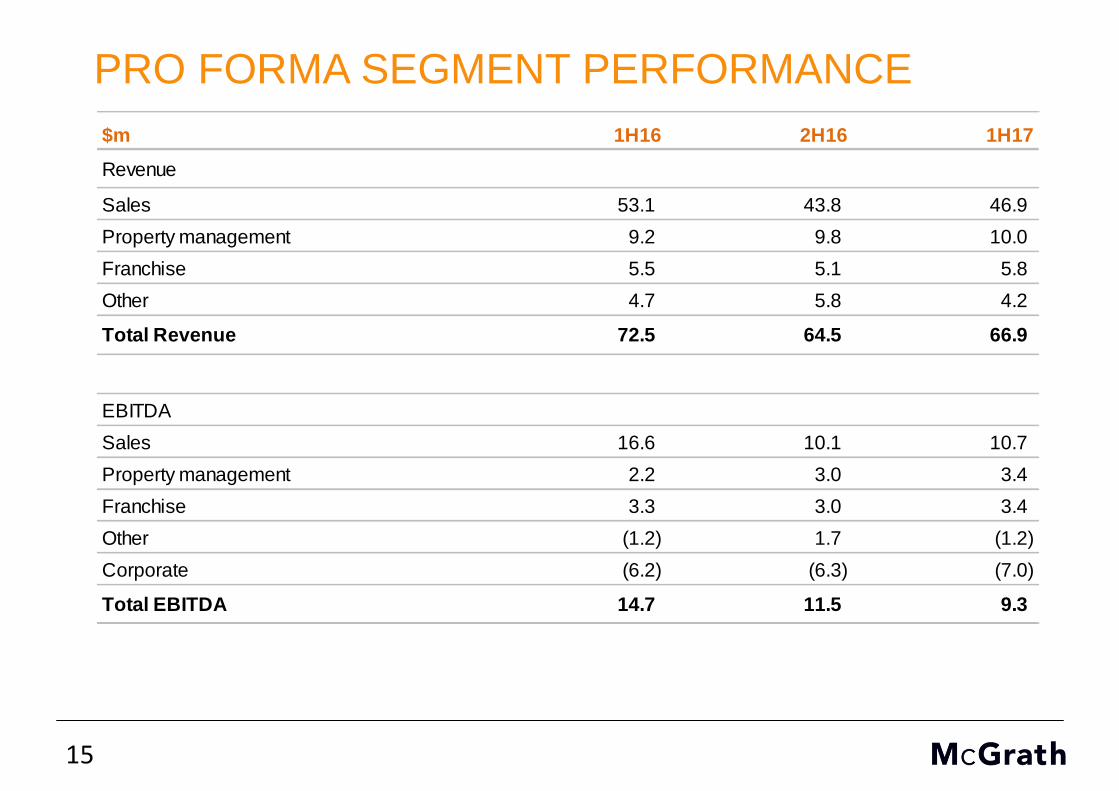
PRO FORMA SEGMENT PERFORMANCE
$m 1H16 2H16 1H17
Revenue
Sales 53.1 43.8 46.9
Property management 9.2 9.8 10.0
Franchise 5.5 5.1 5.8
Other 4.7 5.8 4.2
Total Revenue 72.5 64.5 66.9
EBITDA
Sales 16.6 10.1 10.7
Property management 2.2 3.0 3.4
Franchise 3.3 3.0 3.4
Other (1.2) 1.7 (1.2)
Corporate (6.2) (6.3) (7.0)
Total EBITDA 14.7 11.5 9.3

16
STATUTORY P&L
$m 1H17 1H16 % Change
Total revenue 67.3 54.3 24%
Cost of sales (25.1) (20.7) 21%
Gross Profit 42.2 33.6 26%
Employee benefits expenses (18.3) (14.8) 24%
Other expenses (14.3) (16.2) (12%)
EBITDA 9.6 2.6 269%
Depreciation and Amortisation (3.5) (1.1) 218%
Impairment of software costs (2.2) 0.0 0%
EBIT 3.9 1.5 160%
Net finance costs 0.0 (0.1) (100%)
Net profit before tax 3.9 1.4 179%
Tax expense (1.2) (1.0) 20%
NPAT 2.7 0.4 575%

17
STATUTORY CASH FLOW
• Dividend payment
• Deferred consideration payment made to the
Smollen group
• Capital Expenditure on new offices,
relocations and refurbishment
• IT software spend
- MAP
- Website
• IT program spend
- Infrastructure refresh
• 1H16 high cash conversion ratio due to low
EBITDA base
$m 1H17 1H16
EBITDA 9.6 2.6
Change in net working capital (1.9) (2.3)
IPO transaction costs included in EBITDA 0.0 4.9
Non cash EBITDA items (0.1) 0.1
Net cash flow from operating activities before
capital expenditure, financing and tax7.6 5.3
Capital expenditure (5.2) (3.9)
Net cash flow before financing and tax 2.4 1.4
Net interest received / (paid) 0.0 (0.2)
Income tax paid (1.3) (2.2)
Loan repayments received 0.0 2.1
Loans granted (0.3) (0.5)
Net proceeds of the offer 0.0 66.1
Purchase of controlled entities, net of cash acquired (0.2) (29.1)
Proceeds from borrowings 0.0 9.0
Repayment of borrowings (3.0) (15.9)
IPO and acquisition transaction costs 0.0 (8.4)
Net cash flow before dividends (2.4) 22.2
Dividends and distributions paid (4.8) (11.1)
Net cash flow (7.2) 11.2
Cash conversion ratio 79% 200%
18
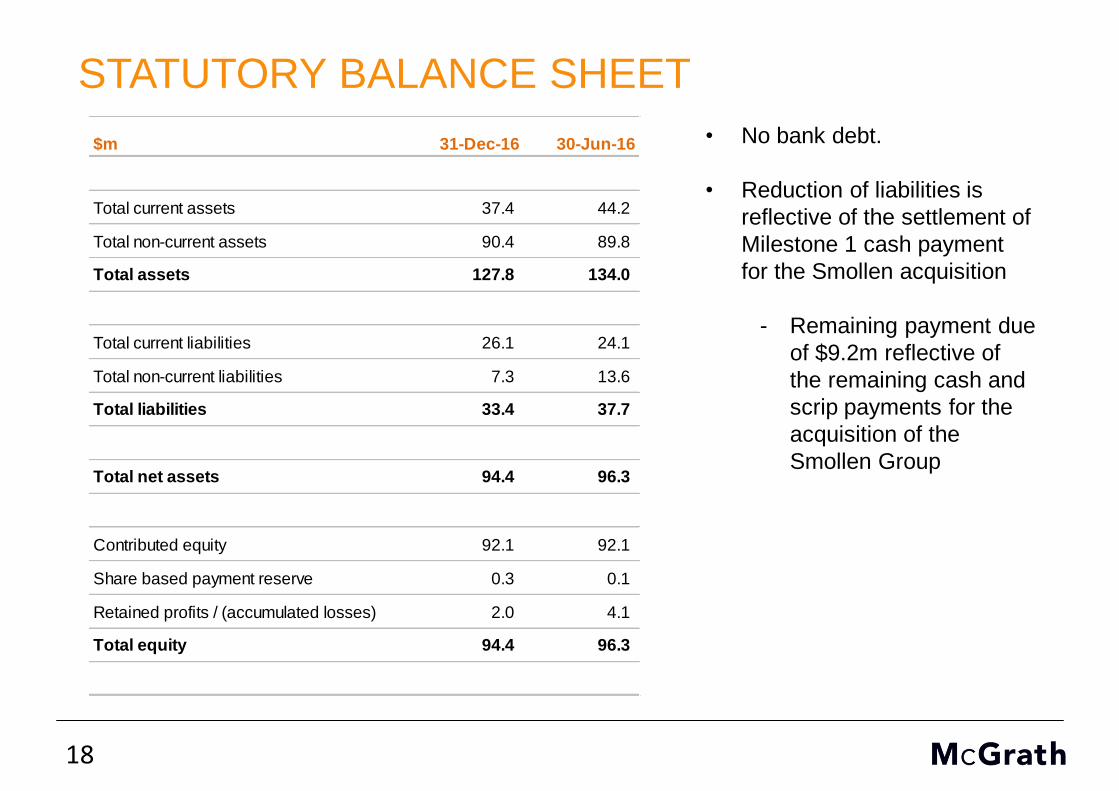
STATUTORY BALANCE SHEET
• No bank debt.
• Reduction of liabilities is
reflective of the settlement of
Milestone 1 cash payment
for the Smollen acquisition
- Remaining payment due
of $9.2m reflective of
the remaining cash and
scrip payments for the
acquisition of the
Smollen Group
$m 31-Dec-16 30-Jun-16
Total current assets 37.4 44.2
Total non-current assets 90.4 89.8
Total assets 127.8 134.0
Total current liabilities 26.1 24.1
Total non-current liabilities 7.3 13.6
Total liabilities 33.4 37.7
Total net assets 94.4 96.3
Contributed equity 92.1 92.1
Share based payment reserve 0.3 0.1
Retained profits / (accumulated losses) 2.0 4.1
Total equity 94.4 96.3

19
DISCLAIMERThis presentation has been prepared by McGrath Limited (Company) together with its related bodies corporate (McGrath Group). The material contained in this presentation is intended
to be general background information on the McGrath Group and its activities.
The information is supplied in summary form and is therefore not necessarily complete. It should be read in conjunction with the Company’s other periodic and continuous disclosure
announcements filed with the Australian Securities Exchange and in particular the Company’s latest full year results. It is not intended that it be relied upon as advice to investors or
potential investors, who should consider seeking independent professional advice depending upon their specific investment objectives, financial situation or particular needs. The
material contained in this presentation may include information derived from publicly available sources that have not been independently verified. No representation or warranty is made
as to the accuracy, completeness or reliability of the information.
All amounts are in Australian dollars unless otherwise indicated.
Unless otherwise noted, financial information in this presentation is based on A-IFRS. McGrath Group uses certain measures to manage and report on its business that are not
recognised under Australia Accounting Standards or IFRS. These measures are collectively referred to in this presentation as ‘non-IFRS financial measures’ under Regulatory Guide 230
‘Disclosing non-IFRS financial information’ published by ASIC. Managements uses these non-IFRS financial measures to evaluate the performance and profitability of the overall
business and the Company believes that they are useful for investors to understand the Company’s financial condition and results of operations. This information is also important for
comparative purposes with the use of those measures in the Company’s IPO prospectus dated 12 November 2015. Unless otherwise specified those non-IFRS financial measures have
not been subject to audit or review in accordance with Australian Accounting Standards.
Forward-looking statements are statements about matters that are not historical facts. Forward looking statements appear in a number of places in this presentation and include
statements regarding the McGrath Group’s intent, belief or current expectations with respect to business and operations, market conditions, results of operations and financial condition,
including, without limitation, future loan loss provisions, financial support to certain borrowers, indicative drivers, forecasted economic indicators and performance metric outcomes.
This presentation contains words such as ‘will’, ‘may’, ‘expect’, ‘indicative’, ‘intend’, ‘seek’, ‘would’, ‘should’, ‘could’, ‘continue’, ‘plan’, ‘probability’, ‘risk’, ‘forecast’, ‘likely’, ‘estimate’,
‘anticipate’, ‘believe’, or similar words to identify forward-looking statements. These forward-looking statements reflect the McGrath Group’s current views with respect to future events
and are subject to change, certain risks, uncertainties and assumptions which are, in many instances, beyond the control of McGrath Group, and have been made based upon the
McGrath Group’s expectations and beliefs concerning future developments and their potential effect upon us. There can be no assurance that future developments will be in accordance
with the McGrath Group’s expectations or that the effect of future developments on the McGrath Group will be this anticipated. Actual results could differ materially from those which the
McGrath Group expects, depending on the outcome of various factors. Factors that may impact on the forward-looking statements made include, but are not limited to, general economic
conditions in Australia, competition in markets in which the McGrath Group will operate and the inherent regulatory risks in the business of the McGrath Group.
When relying on forward-looking statements to make decisions with respect to us, investors and others should carefully consider such factors and other uncertainties and events. The
McGrath Group is under on obligation to update any forward looking statements contained in this presentation, where as a result of new information, future events or otherwise, after the
date of this presentation.
Cameron Judson, CEO Paul Hauenschild, CFO
McGrath Limited (ASX: MEA)Results for the 6 months ended 31 December 2016
24 February 2017