mc/inf/310 - report on human resources management · report on human resources management . ... and...
TRANSCRIPT

MC/INF/310
Original: English 27 September 2013
103RD SESSION REPORT ON HUMAN RESOURCES MANAGEMENT
.
INFORMATION INFORMACIÓN


MC/INF/310 Page 1
REPORT ON HUMAN RESOURCES MANAGEMENT
Introduction 1. This report provides an overview of the activities of the Human Resources Management Division1 and staffing trends during the reporting period (1 July 2012 to 30 June 2013), and highlights developments in the human resources function at IOM over the years. 2. One of the most significant achievements during the reporting period was the launch and implementation of the Human Resources Strategy 2012–2015. The newly appointed Director of Human Resources Management, Ms. Greet de Leeuw, who joined the Organization in October 2012, introduced the Strategy at the IOM Council in November 2012 and has driven its implementation since then. 3. The Strategy has three pillars aimed at strengthening IOM’s effectiveness. The three pillars are closely intertwined and must be pursued in tandem if the Strategy is to be successful. (a) Pillar 1 – A holistic approach to talent management – aims to ensure that the right
people are in the right place, at the right time and at the right cost.
(b) Pillar 2 – Strengthening the enabling environment – ensures that all IOM staff work in a respectful environment that is free from harassment, discrimination and abuse of authority, and meets the changing needs of an increasingly diverse workforce in terms of demographics, expertise and work-life circumstances.
(c) Pillar 3 – Better internal and external alignment – aims to achieve a fair and consistent application of internal human resources policies and practices, and close alignment with the United Nations common system.
4. Despite the staffing and budget constraints that affected its work during the reporting period, the Division carried out a number of activities with a view to achieving the delivery milestones of the Human Resources Strategy. Pillar 1 – Talent management (a) The Training Advisory Committee was formed and met during the reporting period. It
reviewed the strategic priorities of the coming two years along with the new policy on training processes and procedures.
(b) A 97 per cent compliance rate was achieved during the first full year in which the Staff Evaluation System was implemented. A global staff survey of the system was developed in consultation with the Staff Association Committee, to enhance understanding of how to improve its use.
(c) Human resources and information technology staff worked on assessing whether or not and how to overhaul the current e-recruitment system, so as to enable the Human Resources Management Division to attract, nurture and retain people committed to IOM’s work and values and wanting to put their skills to effective use.
1 The Human Resources Management Division encompasses human resources units at Headquarters, the Manila Human
Resources Operations and the Panama Field Personnel Support Unit.
MC/INF/310 Page 2 Pillar 2 – Enabling environment (a) An Official in the Office of the Inspector General was assigned to the coordination of
staff grievances related to IOM standards of conduct, with the objective of professionalizing the handling of staff complaints. The Official was also tasked with setting up an ethics and conduct office by early 2014 to foster awareness and understanding of IOM standards of conduct among IOM staff.
(b) During the reporting period, the Human Resources Management Division, in coordination with the Office of the Director General, embarked on a project to develop a comprehensive and consistent set of policies and procedures for all issues related to appeals and grievances at all levels of the Organization. An independent expert was contracted to help analyse and report on IOM's current processes and make recommendations on the basis of international best practice. The report is currently under review.
(c) A case-tracking tool is being developed to manage and monitor investigations and legal proceedings in cases involving staff.
Pillar 3 – Internal and external alignment (a) In close consultation with the Office of Legal Affairs and the Staff Association
Committee, the Human Resources Management Division has finalized the new unified Staff Rules to accompany the already published Staff Regulations. Implementation of the Staff Rules will start on 1 January 2014 and will be gradually extended to all Field Offices.
IOM staffing Vacancies and placements 5. In the period under review, the Organization’s staff strength decreased by 2.33 per cent, from 8,253 at the beginning of July 2012 to 8,061 at the end of June 2013. Recruitment activities between January 2012 and June 2013 comprised:
• 105 fixed-term vacancy notices for Officials (63 Officials were recruited or placed through 77 internal and 28 external advertisements);
• 6 fixed-term vacancy notices for General Service staff at Headquarters;
• 137 short-term vacancy notices;2
• 150 direct recruitment process requests.3
2 For Officials (most short-term vacancy notices were issued for positions in South Sudan and Haiti). 3 For Officials (mainly for positions at Headquarters and in South Sudan and Yemen).

MC/INF/310 Page 3
Junior Professional Officers 6. During the reporting period, five new Junior Professional Officers (JPOs), funded by the Governments of Australia, Finland, Italy, Japan and the Netherlands, joined the Organization, bringing the number of active Officers to 17. Three Officers were retained as Officials of the Organization at the end of their assignment. IOM is in the process of receiving two more Junior Professional Officers funded by the Governments of France and Germany. 7. The Human Resources Management Division participated in the Career Development Workshop for Junior Professional Officers held in Geneva. The workshop is a joint initiative by the International Labour Organization, IOM, the International Trade Centre, the United Nations Development Programme (UNDP), the United Nations Office in Geneva, the Office of the United Nations High Commissioner for Refugees, UNAIDS, the World Health Organization (WHO) and the World Intellectual Property Organization (WIPO). It is designed to provide coaching and interactive learning modules for the personal career development of Junior Professional Officers. 8. The Division also participated in the ninth Interagency Meeting of National Recruitment Services and UN Organizations on the Associate Expert/JPO/APO Programmes, which was hosted by the Government of Sweden in Stockholm. Staff exchanges, secondments4 and loans 9. During the reporting period, secondments to IOM comprised:
• 1 Official from the Government of Sweden, another from the Government of Turkey and a third from the Migration Policy Institute;
• 17 Officials from the Norwegian Refugee Council deployed to Afghanistan, Haiti, Namibia, Pakistan, Sudan and Zimbabwe;
• 14 Officials from Syni5 seconded to IOM Headquarters and 2 Officials from Syni seconded to Field Offices in Eastern Europe, for a total of 16 Syni secondments;
• 1 Official from Human Resources and Skills Development Canada (HRSDC) seconded to IOM Headquarters;
• 4 Officials seconded from the CANADEM 6 Standby Partnership Programme and 3 from CANADEM’s IFEx7Programme, 2 of whom were placed at Headquarters;
• 2 General Service staff seconded to Headquarters from the Junior Professional Women Intern programme supported by the Ministry of Education and the Ministry of Gender Equality and Family of the Republic of Korea.
4 Secondment is a valuable means of exchanging knowledge on migration activities, strengthening partnerships with
governments and other organizations in the multilateral system, and obtaining support for IOM’s core structure. 5 Syni is a non-profit project carried out by Lausanne City Council that offers professionals the possibility to participate in
international cooperation assignments in Switzerland/Eastern Europe. 6 CANADEM (Canada’s Civilian Reserve) is a non-profit agency dedicated to advancing international peace, security and
socioeconomic development by mobilizing experts committed to international service. 7 International Field Experience.

MC/INF/310 Page 4 10. IOM, for its part, loaned staff members to various United Nations agencies and international organizations, including the Global Forum on Migration and Development, WHO, WIPO, UNDP, the Office for the Coordination of Humanitarian Affairs (OCHA) and the Government of Switzerland. Internship Programme 11. During the reporting period, IOM hosted 242 interns around the world, 86 at Headquarters and 156 in Field Offices. The Programme provides interns with an opportunity to learn about the IOM’s work through practical experience, while at the same time securing valuable support for IOM’s migration activities. The Programme continues to expand its agreements with universities through new partnerships.8 Staff rotation 12. The 2013 rotation list comprises 90 staff members, including those whose rotation had been deferred from the previous year. At the time of writing, a total of 44 staff members had been transferred in 2013 within the rotation framework. Effective human resources service delivery Human resources management policy and services 13. The new Staff Rules were finalized during the reporting period, with implementation commencing with a phased approach from the beginning of 2014. 14. The Policy Unit collaborated with the Information Technology and Communications Division on the development of data visualization “dashboards” providing up-to-date human resources data to stakeholders. 15. Staff from the Human Resources Management Division visited a number of Country Offices to carry out comprehensive structural reviews, classify positions and align conditions of service. 16. During the period under review, training in human resources administration was provided at regional level to enhance the role of Resource Management Officers in strengthening the enabling environment as part of the 2012 delivery milestones of the Human Resources Strategy. Health insurance, duty of care and the administration of justice 17. The Medical Service Plan for Country Offices was extended to four additional offices; 128 Country Offices are now covered by the Plan, which has 7,479 active participants (staff members and eligible dependents). 18. During the period under review, the Human Resources Management Division issued a policy on loss of personal property insurance. The policy defines the terms, conditions and 8 New partnerships with Sciences Po Bordeaux, the University of Toronto and its Faculty of Law International Human
Rights Programme, the Centre for European, Russian and Eurasian Studies, the Munk School of Global Affairs, the Osaka University Global Collaboration Centre; discussions are ongoing with the Mercator Foundation.

MC/INF/310 Page 5
limits governing compensation for loss or damage to the personal effects of staff members in the professional category determined to be directly attributable to war events. It also sets out the procedure by which staff members submit compensation claims. 19. During the reporting period, the Joint Administrative Review Board processed 11 appeals from staff members. Five complaints were filed with the ILO Administrative Tribunal. Gender and diversity
20. In support of IOM’s efforts to promote gender awareness and sensitivity organization-wide, the Human Resources Management Division reported on gender statistics in senior management and town hall meetings, saw to it that decision-making panels and boards reflected gender parity and issued gender-sensitive recommendations, and ensured that the Gender Coordination Unit oversaw and provided support for recruitment and rotation processes, with a view to enhancing the gender parity index among senior staff. The gender ratio changed marginally over the reporting period.9 Staff development and learning 21. During the reporting period, the Division continued to support the implementation of the Field structure review, helping to organize global meetings to strengthen the new functional roles of the Regional Thematic Specialists and providing new tailored learning solutions to secure professional skills for the review and endorsement of IOM projects worldwide. In partnership with the Ombudsman, a new programme on negotiating skills was designed and rolled out worldwide, with the aim of enhancing the ability of IOM staff to negotiate better outcomes, maintain relationships and resolve interpersonal conflicts. 22. The Staff Evaluation System (SES) launched in September 2011 has since earned widespread acceptance among staff worldwide. The compliance rate for the first cycle (2011–2012) was 97 per cent, which is high compared to other international organizations. During the reporting period, the Division initiated an IOM-wide survey of staff satisfaction with the SES; the findings were shared with IOM staff in September 2013. The second cycle (September 2012–September 2013) was in progress at the time of writing and had a compliance rate of 93 per cent. The Division plans to further enhance the integration of SES outcomes into the various human resources administrative processes by linking staff appraisals to recruitment, selection, rotation, and learning and development. It has started to develop a career mobility framework to be launched within the next SES cycle, building on the functionality of the SES system and the incorporation of technical competencies.
9 The number of Officials rose from 830 in 2012 to 865 in 2013 and the gender ratio showed a marginal 1% increase in
female staff (2012: 42% women, 58% men; 2013: 43% women, 57% men).


MC/INF/310 Annex (English only)
Page 1
Annex
STATISTICAL OVERVIEW IOM STAFF COMPOSITION…………..……………..…….…………………………..… 2 Figure 1 Field Offices, 2009–June 2013 …….…………….………….……….……….. 2 Figure 2 Staffing trends, 2009–June 2013 …….…......…….…………………………… 2 Figure 3 Staff worldwide by category, location and gender, June 2013 ……..….......…. 3 Figure 4 Officials worldwide – Gender distribution by category/grade,
2009–June 2013 ………………………………………………………..….….. 3 Figure 5a Officials worldwide – Distribution by gender and category/grade, June 2013… 4 Figure 5b Headquarters General Service Staff – Distribution by gender and
category/grade, June 2013 ...…….….……..…….……………………....…….. 4 Figure 6 Headquarters General Service Staff – Distribution by country of
nationality and gender, June 2013 ...…….….……..…….……………....…….. 5 Figure 7 General Service staff in the Field – Distribution by category/grade and
gender, June 2013 …..………………………………………………………… 5 Figure 8 Officials worldwide – Distribution by country of nationality, category/grade
and gender, June 2013 ………………....……………………………………… 6 Figure 9 General Service staff in the Field worldwide – Distribution by country of
nationality, category/grade and gender, June 2013 ..…..……..……………..… 9 ALTERNATIVE STAFFING RESOURCES….….…………………………...………….. 12 Figure 10 Junior Professional Officers worldwide – Distribution by country of
nationality, 2009–June 2013 .………………………………………………..... 12 Figure 11 Secondees – Distribution by duty station and gender, July 2012-June 2013 .… 12 Figure 12 Interns worldwide – Distribution by duty station and gender,
July 2012–June 2013 ………………………………………………………….. 13 RECRUITMENT AND SELECTION….………………………………………….………. 14 Figure 13 Vacancy notices issued for Officials, 2009–June 2013 ….…….....…………… 14 Figure 14 Officials appointed worldwide through vacancy notices, 2009–June 2013 ….. 14 Figure 15 Officials appointed worldwide through vacancy notices – Distribution by
country of nationality, 2009–June 2013 .…......…………………..…………… 15 Figure 16 Vacancy notices issued for General Service staff at Headquarters,
2009–June 2013 ………...…………………………………………………..… 17 Figure 17 Mobility of IOM staff, 2009–June 2013 ….…….…..……………..………….. 17 Figure 18 Temporary recruitment and selection, 2009–June 2013 ….……...….………... 17 STAFF DEVELOPMENT AND LEARNING….….……………………………………… 18 Figure 19 Staff development and learning activities, 2009–June 2013 ………....………. 18 Figure 20 Staff trained – Distribution by gender, 2009–June 2013 ……..……….…..….. 18 Figure 21 Staff trained – Distribution by location, 2009–June 2013 …..…...…………… 19 Figure 22 Staff trained – Distribution by category, 2009–June 2013 .……....……….…... 19 Figure 23 Staff trained – Regional distribution, January–June 2013 …………….....….… 20 Figure 24 Staff trained – Distribution by main areas of learning and development and
by gender, July 2012–June 2013 …………………………....………………… 20

MC/INF/310 Annex (English only) Page 2
IOM STAFF COMPOSITION1
Figure 1: Field Offices, 2009–June 2013
1 IOM staff statistics have been revised in order to group categories of staff with similar responsibilities.
Figure 2: Staffing trends,2 2009–June 2013
Note: As of 2010, National Officers have been included in the General Services category. 2 Including staff members holding a short-term contract.
440 461 437 469 478
0
50
100
150
200
250
300
350
400
450
500
2009 2010 2011 2012 2013
2009 2010 2011 2012 2013General Service 6642 6883 7382 7423 7196Officials 1093 816 799 830 865Total 7735 7699 8181 8253 8061
0
1 000
2 000
3 000
4 000
5 000
6 000
7 000
8 000
9 000

MC/INF/310 Annex (English only)
Page 3
Figure 3: Staff worldwide by category, location and gender, June 2013
Category Headquarters Field Total
F M F M
Officials
Officials 3 51 59 259 385 754
Officials, short-term 8 2 38 46 94
Associate Experts 5 2 8 2 17
Subtotal 64 63 305 433 865
General Service
National Officers * * 210 247 457
General Service 54 26 2 638 2 988 5 706
General Service, short-term 3 1 460 569 1 033
Subtotal 57 27 3 308 3 804 7 196
TOTAL 121 90 3 613 4 237 8 061
3 Consultants, interns and staff on special leave without pay are excluded.
Figure 4: Officials Worldwide – Gender distribution by category/grade, 2009–June 20134
Category/grade June 2009 June 2010 June 2011 June 2012 June 2013
M F M F M F M F M F
D2 and above * <1% <1% <1% <1%
P5 – D2 76% 24% 75% 25% 74% 26% 75% 25% 74% 26%
P3 – P4 62% 38% 60% 40% 58% 42% 60% 40% 60% 40%
P1 – P2 50% 50% 54% 46% 57% 43% 53% 47% 52% 48%
UG 46% 54% 50% 50% 48% 52% 49% 51% 53% 47%
Short-term Officials 54% 46% 52% 48% 53% 47% 51% 49% 51% 49%
Associate Experts 40% 60% 35% 65% 36% 64% 27% 73% 24% 76%
National Officers ** 54% 46% * * * * * * * *
Total Gender 624 469 470 346 460 339 479 351 496 369
Gender (%) 57% 43% 58% 42% 58% 42% 58% 42% 57% 43%
Total Officials 1 093 816 799 830 865
* This category has included the Director General and the Deputy Director General since 2011. ** Since 2010, National Officers have been included in the General Service category. 4 This table has been changed to reflect the gender ratio per the total number of Officials in the various categories.

MC/INF/310 Annex (English only) Page 4
Figure 5a: Officials worldwide – Distribution by gender and category/grade, June 2013
Figure 5b: Headquarters General Service staff – Distribution by gender and category/grade, June 2013
E1 E2 D2 D1 P5 P4 P3 P2 P1 UG ST AEMale 1 1 23 46 100 127 74 27 45 48 4Female 1 9 15 59 94 77 15 40 46 13Total 1 1 1 32 61 159 221 151 42 85 94 17
G7 G6 G5 G4 G3 G2 G1 UG STMale 2 8 5 4 2 3 0 2 1Female 9 13 17 10 0 0 0 5 3Total 11 21 22 14 2 3 0 7 4

MC/INF/310 Annex (English only)
Page 5
Figure 6: Headquarters General Service staff5 – Distribution by country of nationality and gender, June 2013
Country of Nationality
Gender Total F M
Albania 1 1 Barbados 1 1 Belarus 1 1 Bosnia and Herzegovina 1 1 Bulgaria 1 1 Canada 1 1 Colombia 1 1 Congo 1 1 Ethiopia 1 1 France 16 7 23 Ghana 1 1 Indonesia 1 1 Iran (Islamic Republic of) 1 1 Italy 2 2 4 Mexico 1 1 Netherlands 1 1 Peru 1 1 Philippines 1 1 Romania 1 1 Spain 1 1 Sri Lanka 1 1 Switzerland 14 7 21 The former Yugoslav Republic of Macedonia 1 2 3 United Kingdom of Great Britain and Northern Ireland 7 1 8 United Republic of Tanzania 2 2 United States of America 2 2 Uruguay 2 2 Total 57 27 84
5 Including short-term employees.
Figure 7: General Service staff in the Field – Distribution by category/grade and gender, June 2013

MC/INF/310 Annex (English only) Page 6
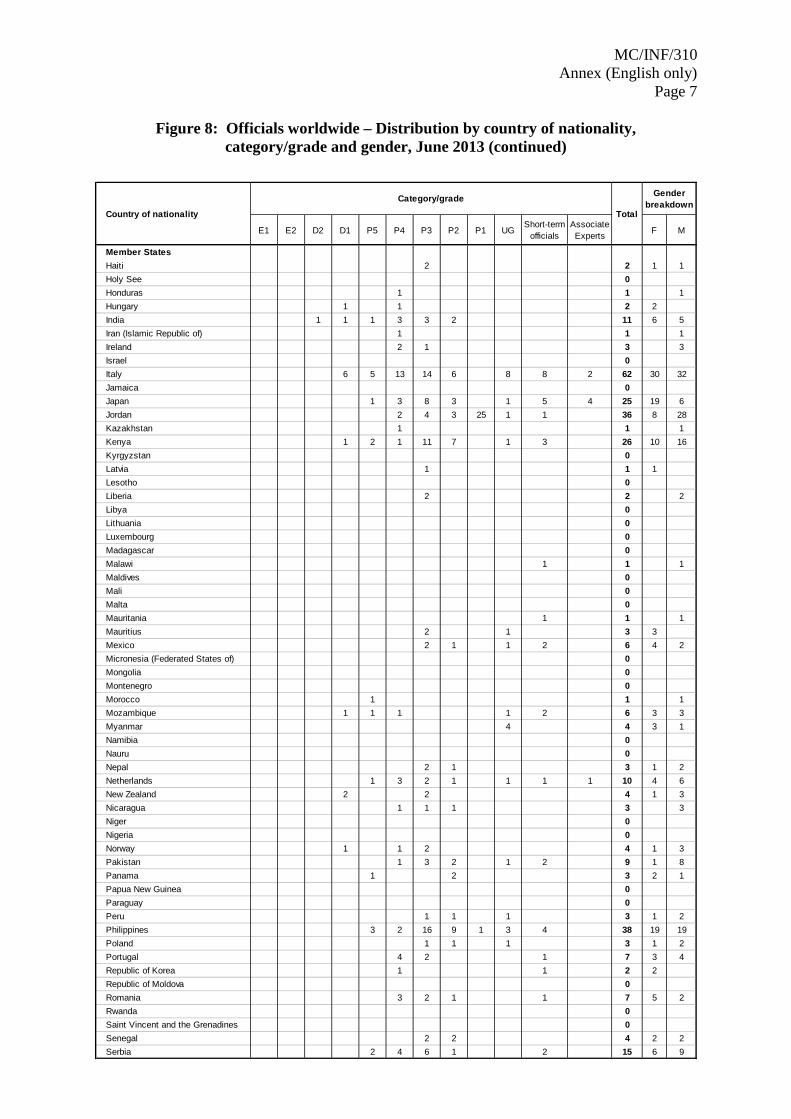
Figure 8: Officials worldwide – Distribution by country of nationality, category/grade and gender, June 2013
E1 E2 D2 D1 P5 P4 P3 P2 P1 UGShort-term
officialsAssociate Experts F M
Member StatesAfghanistan 1 1 1 3 3Albania 1 1 1Algeria 0Angola 0Antigua and Barbuda 0Argentina 2 1 1 4 2 2Armenia 1 1 1Australia 3 3 7 1 2 5 1 22 8 14Austria 3 4 2 1 10 4 6Azerbaijan 1 1 1Bahamas 0Bangladesh 1 1 2 4 1 3Belarus 1 1 1Belgium 1 3 3 2 3 3 1 16 8 8Belize 0Benin 0Bolivia (Plurinational State of) 1 1 2 2Bosnia and Herzegovina 3 1 4 2 2Botswana 1 1 1Brazil 2 1 1 4 1 3Bulgaria 1 1 1Burkina Faso 1 1 1Burundi 0Cambodia 0Cameroon 0Canada 4 3 8 4 1 7 3 30 10 20Cape Verde 0Central African Republic 0Chad 1 1 1Chile 1 1 2 2Colombia 2 2 1 5 2 3Comoros 0Congo 0Costa Rica 1 1 1 2 5 10 3 7Côte d’Ivoire 2 1 1 1 5 1 4Croatia 1 1 1 1 1 1 6 3 3Cyprus 0Czech Republic 1 1 1Democratic Republic of the Congo 1 1 1Denmark 1 1 2 1 1Djibouti 0Dominican Republic 1 1 1Ecuador 1 1 2 1 1Egypt 1 1 2 8 3 1 16 5 11El Salvador 0Estonia 1 1 1Ethiopia 1 2 2 1 6 1 5Finland 1 2 3 2 1France 1 2 10 10 6 1 5 4 39 20 19Gabon 0Gambia 0Georgia 1 2 1 1 5 5Germany 4 2 7 6 6 2 4 31 16 15Ghana 2 1 5 8 2 6Greece 1 1 2 2Guatemala 1 1 1Guinea 1 1 2 2Guinea-Bissau 0Guyana 0
Country of nationality
Category/grade
Total
Gender breakdown
MC/INF/310 Annex (English only)
Page 7
Figure 8: Officials worldwide – Distribution by country of nationality, category/grade and gender, June 2013 (continued)
E1 E2 D2 D1 P5 P4 P3 P2 P1 UGShort-term
officialsAssociate Experts F M
Member StatesHaiti 2 2 1 1Holy See 0Honduras 1 1 1Hungary 1 1 2 2India 1 1 1 3 3 2 11 6 5Iran (Islamic Republic of) 1 1 1Ireland 2 1 3 3Israel 0Italy 6 5 13 14 6 8 8 2 62 30 32Jamaica 0Japan 1 3 8 3 1 5 4 25 19 6Jordan 2 4 3 25 1 1 36 8 28Kazakhstan 1 1 1Kenya 1 2 1 11 7 1 3 26 10 16Kyrgyzstan 0Latvia 1 1 1Lesotho 0Liberia 2 2 2Libya 0Lithuania 0Luxembourg 0Madagascar 0Malawi 1 1 1Maldives 0Mali 0Malta 0Mauritania 1 1 1Mauritius 2 1 3 3Mexico 2 1 1 2 6 4 2Micronesia (Federated States of) 0Mongolia 0Montenegro 0Morocco 1 1 1Mozambique 1 1 1 1 2 6 3 3Myanmar 4 4 3 1Namibia 0Nauru 0Nepal 2 1 3 1 2Netherlands 1 3 2 1 1 1 1 10 4 6New Zealand 2 2 4 1 3Nicaragua 1 1 1 3 3Niger 0Nigeria 0Norway 1 1 2 4 1 3Pakistan 1 3 2 1 2 9 1 8Panama 1 2 3 2 1Papua New Guinea 0Paraguay 0Peru 1 1 1 3 1 2Philippines 3 2 16 9 1 3 4 38 19 19Poland 1 1 1 3 1 2Portugal 4 2 1 7 3 4Republic of Korea 1 1 2 2Republic of Moldova 0Romania 3 2 1 1 7 5 2Rwanda 0Saint Vincent and the Grenadines 0Senegal 2 2 4 2 2Serbia 2 4 6 1 2 15 6 9
Country of nationality
Category/grade
Total
Gender breakdown

MC/INF/310 Annex (English only) Page 8
Figure 8: Officials worldwide – Distribution by country of nationality, category/grade and gender, June 2013 (continued)
E1 E2 D2 D1 P5 P4 P3 P2 P1 UGShort-term
officialsAssociate Experts F M
Member StatesSeychelles 0Sierra Leone 1 2 1 4 1 3Slovakia 1 1 2 1 1Slovenia 0Somalia 0South Africa 1 1 5 3 10 5 5South Sudan 0Spain 2 1 1 2 6 4 2Sri Lanka 1 1 1 3 3Sudan 1 1 1 1 1 5 2 3Suriname 0Swaziland 0Sweden 1 1 2 1 1 1 7 5 2Switzerland 1 7 3 1 2 1 2 17 10 7Tajikistan 2 1 3 1 2Thailand 1 3 6 10 5 5Timor-Leste 0Togo 0Trinidad and Tobago 0Tunisia 1 1 1Turkey 1 1 2 2Uganda 1 3 1 1 1 7 4 3Ukraine 1 1 1 3 2 1United Kingdom of Great Britain and Northern Ireland 1 4 7 10 5 1 5 9 42 17 25
United Republic of Tanzania 1 1 1United States of America 1 4 7 27 21 18 2 9 17 1 107 44 63Uruguay 2 2 2 6 1 5Vanuatu 0Venezuela (Bolivarian Republic of) 1 1 1Viet Nam 1 1 1Yemen 0Zambia 1 1 1Zimbabwe 1 3 1 2 1 8 5 3
Bahrain 0Bhutan 0China 1 1 1Cuba 0Eritrea 1 1 1Fiji 1 1 1Indonesia 3 5 1 1 1 11 6 5Iraq 1 2 1 1 5 2 3Lebanon 1 1 2 1 1 6 2 4Malaysia 1 1 1 3 3Qatar 0Russian Federation 1 2 4 3 10 5 5San Marino 0Sao Tome and Principe 0Saudi Arabia 0Syrian Arab Republic 1 1 1The former Yugoslav Republic of Macedonia 1 3 3 2 1 10 2 8
Turkmenistan 1 1 2 2Others 1 1 1
Total 1 1 1 32 61 159 221 151 42 85 94 17 865 369 496
Non-Member States and others
Country of nationality
Category/grade
Total
Gender breakdown

MC/INF/310 Annex (English only)
Page 9
Figure 9: General Service staff in the Field worldwide – Distribution by country of nationality, category/grade and gender, June 2013
G-1 G-1A G-1B G-2 G-3 G-4 G-5 G-6 G-7 G-8 G-9 G-10 G-11 NO-A NO-B NO-C NO-D UG ST F M
Member StatesAfghanistan 3 9 5 2 19 19 9 4 13 3 56 5 147 11 136Albania 1 1 3 1 2 1 1 1 1 12 9 3Algeria 0Angola 2 1 2 1 6 2 4Antigua and Barbuda 0Argentina 1 2 5 3 1 5 1 1 4 10 33 26 7Armenia 3 4 1 2 2 12 2 26 15 11Australia 6 17 4 1 1 29 19 10Austria 7 11 6 4 1 3 3 1 36 28 8Azerbaijan 1 2 3 6 4 2Bahamas 0Bangladesh 1 3 6 6 8 1 2 7 2 9 3 48 15 33Belarus 1 2 7 2 3 1 16 11 5Belgium 5 15 22 6 1 3 2 1 5 60 35 25Belize 0Benin 0Bolivia (Plurinational State of) 5 3 8 3 5Bosnia and Herzegovina 8 3 2 9 22 11 11Botswana 0Brazil 0Bulgaria 1 2 3 1 2Burkina Faso 1 2 3 2 1Burundi 1 1 2 1 1Cambodia 4 1 3 5 2 3 1 8 27 14 13Cameroon 1 3 1 1 1 1 8 5 3Canada 1 2 2 8 13 10 3Cape Verde 1 2 3 3Central African Republic 0Chad 4 7 2 5 4 5 1 2 3 21 54 11 43Chile 3 2 1 1 7 5 2Colombia 13 12 20 58 34 16 9 32 13 4 2 454 19 686 447 239Comoros 0Congo 4 4 2 2Costa Rica 2 3 2 1 1 1 1 14 3 28 16 12Côte d'Ivoire 5 9 6 1 2 1 6 13 43 13 30Croatia 1 1 2 2Cyprus 0Czech Republic 1 4 1 1 1 1 9 6 3Democratic Republic of the Congo
7 2 2 3 11 8 2 1 1 11 39 87 22 65
Denmark 2 2 1 1Djibouti 1 2 1 1 1 7 13 1 12Dominican Republic 3 2 1 1 3 1 11 7 4Ecuador 1 5 10 2 3 2 1 7 31 22 9Egypt 6 7 4 5 1 3 1 5 14 46 18 28El Salvador 2 1 1 1 2 1 2 1 7 4 22 14 8Estonia 1 1 1 2 5 4 1Ethiopia 3 10 18 34 47 9 2 10 2 1 9 37 182 68 114Finland 5 5 5 2 1 3 21 12 9France 9 2 11 9 2Gabon 1 1 1Gambia 1 1 1Georgia 3 3 2 2 1 2 1 2 21 37 27 10Germany 9 3 4 3 1 2 8 30 23 7Ghana 3 6 3 7 9 6 1 2 2 1 10 50 20 30Greece 5 1 1 2 3 1 1 3 33 50 33 17Guatemala 2 2 4 6 4 1 7 18 44 15 29Guinea 2 4 1 6 4 3 1 1 1 23 9 14Guinea-Bissau 0Guyana 1 1 1 1 1 5 3 2Haiti 60 114 67 82 36 22 5 12 3 21 19 441 116 325Holy See 0Honduras 1 2 3 1 2 1 1 11 7 4
Country of nationalityCategory/grade
Total
Gender breakdown

MC/INF/310 Annex (English only) Page 10
Figure 9: General Service staff in the Field worldwide – Distribution by country of nationality, category/grade and gender, June 2013 (continued)
G-1 G-1A G-1B G-2 G-3 G-4 G-5 G-6 G-7 G-8 G-9 G-10 G-11 NO-A NO-B NO-C NO-D UG ST F M
Member StatesHungary 1 3 1 3 1 6 15 9 6India 1 1 1 1 3 1 1 9 2 7Iran (Islamic Republic of) 1 4 2 2 1 1 3 14 6 8Ireland 1 2 2 1 1 1 1 9 6 3Israel 0Italy 1 1 6 4 5 6 2 2 10 8 45 31 14Jamaica 1 1 2 2Japan 2 4 1 1 3 11 9 2Jordan 27 8 22 73 31 19 5 9 1 1 27 41 264 141 123Kazakhstan 2 1 2 5 1 1 6 18 13 5Kenya 27 38 18 53 72 22 6 7 9 3 4 28 287 128 159Kyrgyzstan 3 2 1 4 1 1 2 1 1 1 17 8 9Latvia 1 1 1 3 2 1Lesotho 0Liberia 1 7 1 9 4 5Libya 2 3 2 1 1 8 12 29 9 20Lithuania 1 2 3 2 1 2 2 13 11 2Luxembourg 0Madagascar 1 1 1Malawi 0Maldives 0Mali 1 1 2 2 25 31 6 25Malta 5 1 6 3 3Mauritania 2 1 1 4 4Mauritius 1 1 4 6 4 2Mexico 10 5 15 10 5Micronesia (Federated States of) 6 3 9 6 3Mongolia 1 1 2 2Montenegro 1 1 2 2Morocco 20 8 28 14 14Mozambique 1 1 1 1 8 12 6 6Myanmar 2 3 6 1 3 3 5 1 135 77 236 121 115Namibia 1 1 2 1 1Nauru 0Nepal 32 36 40 95 50 17 4 14 1 75 15 379 149 230Netherlands 4 2 30 7 1 6 2 7 4 1 2 66 36 30New Zealand 0Nicaragua 3 4 7 6 1Niger 1 1 6 1 1 4 14 2 12Nigeria 5 1 2 7 3 5 4 8 35 16 19Norway 19 7 3 1 30 18 12Pakistan 14 10 45 24 14 5 2 12 3 3 1 35 17 185 55 130Panama 1 12 3 1 2 2 4 3 28 17 11Papua New Guinea 1 1 2 1 1 1 7 3 4Paraguay 1 1 1 3 2 1Peru 1 3 8 11 7 4 1 3 1 2 41 20 21Philippines 1 15 64 60 20 11 30 9 2 19 60 291 174 117Poland 10 9 3 1 2 4 29 25 4Portugal 1 2 1 1 1 1 7 5 2Republic of Korea 2 1 3 3Republic of Moldova 4 3 11 6 3 6 1 56 2 92 62 30Romania 2 1 5 1 1 1 1 2 14 7 7Rwanda 1 1 1 1 1 1 7 8 21 7 14Saint Vincent and the Grenadines 0Senegal 1 3 3 2 4 4 1 2 3 23 12 11Serbia 1 1 4 3 3 2 1 1 16 10 6Seychelles 0Sierra Leone 1 2 1 1 2 1 3 11 1 10Slovakia 2 8 15 4 1 2 6 38 25 13Slovenia 1 1 1Somalia 2 1 10 3 1 1 7 25 5 20South Africa 1 3 2 6 5 7 1 5 3 1 4 9 47 35 12South Sudan 16 52 29 22 16 7 2 2 39 67 252 30 222
Country of nationalityCategory/grade
Total
Gender breakdown

MC/INF/310 Annex (English only)
Page 11
Figure 9: General Service staff in the Field worldwide – Distribution by country of nationality, category/grade and gender, June 2013 (continued)
G-1 G-1A G-1B G-2 G-3 G-4 G-5 G-6 G-7 G-8 G-9 G-10 G-11 NO-A NO-B NO-C NO-D UG ST F M
Member StatesSpain 2 1 1 1 1 1 7 7Sri Lanka 6 22 9 25 35 7 2 3 2 1 5 8 125 31 94Sudan 24 19 8 14 19 10 6 13 1 2 23 30 169 35 134Suriname 0Swaziland 0Sweden 0Switzerland 2 7 2 1 12 9 3Tajikistan 1 2 2 4 2 11 1 23 7 16Thailand 13 15 16 59 37 30 9 3 1 4 1 39 27 254 147 107Timor-Leste 1 2 1 2 4 1 3 1 3 18 4 14Togo 1 1 1Trinidad and Tobago 1 1 2 2Tunisia 3 4 1 5 4 1 1 2 19 40 19 21Turkey 3 3 11 1 2 1 8 3 32 23 9Uganda 7 8 3 13 3 4 1 2 1 1 1 18 62 32 30Ukraine 1 1 3 21 10 6 5 5 1 47 2 102 69 33United Kingdom of Great Britain and Northern Ireland
4 3 2 2 1 3 15 10 5
United Republic of Tanzania 5 2 9 5 1 1 2 2 3 30 13 17United States of America 13 19 19 3 13 1 3 71 40 31Uruguay 2 1 1 4 3 1Vanuatu 0Venezuela (Bolivarian Republic of) 4 1 5 3 2Viet Nam 3 4 14 22 8 7 2 8 1 10 8 87 58 29Yemen 2 8 5 10 5 2 2 9 19 62 25 37Zambia 3 2 1 11 1 18 7 11Zimbabwe 13 5 8 15 10 7 4 2 11 5 80 24 56Observer States, non-Member States and othersBahrain 0Bhutan 0China 1 3 4 1 1 10 7 3Cuba 0Indonesia 3 6 4 51 46 21 13 3 3 1 17 79 247 119 128Iraq 2 5 18 10 13 2 4 1 3 79 16 153 33 120Kuwait 1 1 1 2 2 7 4 3Lao People's Democratic Republic
1 1 2 1 5 3 2
Lebanon 7 15 22 12 10Malaysia 4 4 2 2Marshall Islands 2 2 2Qatar 0Russian Federation 1 2 4 29 20 14 7 2 1 80 60 20San Marino 0Sao Tome and Principe 0Saudi Arabia 1 1 1Syrian Arab Republic 24 4 8 25 9 5 2 2 1 5 1 86 41 45
The former Yugoslav Republic of Macedonia 2 2 2 6 5 1
Turkmenistan 1 1 1 1 3 7 4 3Uzbekistan 1 2 3 2 1UNSC resolution 1244- administered Kosovo 1 3 12 2 7 1 4 1 31 6 25
Total 281 66 28 469 608 1140 909 415 161 3 6 0 2 286 114 37 7 1521 1028 7081 3302 3779
Country of nationalityCategory/grade
Total
Gender breakdown

MC/INF/310 Annex (English only) Page 12
ALTERNATIVE STAFFING RESOURCES
Figure 10: Junior Professional Officers worldwide – Distribution by country of nationality, 2009–June 2013
2009 2010 2011 2012 January–
June 2013 Australia 1 Austria 1 1 1 Belgium 2 2 2 1 Denmark 1 1 1 1 Finland 1 1 1 2 2 France 1 1 1 Germany 2 3 4 6 4 Italy 5 5 3 2 2 Japan 3 4 4 4 4 Netherlands 1 Norway 1 1 Sweden 4 4 3 3 1 United States of America 1 1 Zimbabwe 16 16 16 16 Total 20 23 22 22 17
6 Funded by the Government of Italy.
Figure 11: Secondees – Distribution by duty station and gender, July 2012–June 2013
Female Male Total
Syni1 2 31 3 41 1 2
3 31 1 2
4 10 14
1 11 0 1
1 11 1
0 2 2
1 1
1 0 1
1 10 1 1
6 13 19
Department of Migration Management
Headquarters total
HRSDC Programme
CANADEM Programme
Government of the Republic of Korea
Turkish Government
CANADEM Programme to Headquarters total
Government of the Republic of Korea to Headquarters total
Turkish Government to Headquarters total
Office of the Director General
Department of Migration Management
Duty station
Department of Migration Management
Office of the Director General
Department of Migration ManagementDepartment of Resources ManagementOffice of the Director GeneralGlobal Forum on Migration and Development
Department of International Cooperation and Partnerships
Syni to Headquarters total
HRSDC Programme to Headquarters total
MC/INF/310 Annex (English only)
Page 13
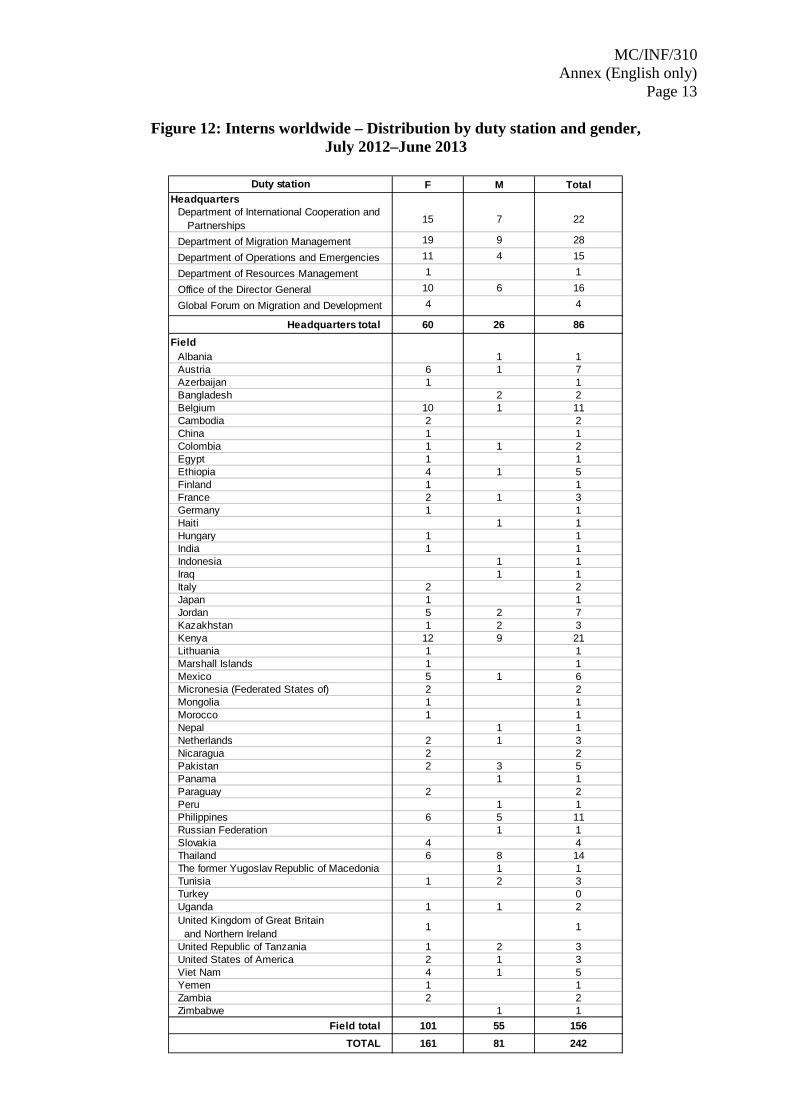
Figure 12: Interns worldwide – Distribution by duty station and gender, July 2012–June 2013
F M TotalHeadquarters
Department of International Cooperation and Partnerships 15 7 22
Department of Migration Management 19 9 28
Department of Operations and Emergencies 11 4 15
Department of Resources Management 1 1
Office of the Director General 10 6 16
Global Forum on Migration and Development 4 4
Headquarters total 60 26 86Field
Albania 1 1Austria 6 1 7Azerbaijan 1 1Bangladesh 2 2Belgium 10 1 11Cambodia 2 2China 1 1Colombia 1 1 2Egypt 1 1Ethiopia 4 1 5Finland 1 1France 2 1 3Germany 1 1Haiti 1 1Hungary 1 1India 1 1Indonesia 1 1Iraq 1 1Italy 2 2Japan 1 1Jordan 5 2 7Kazakhstan 1 2 3Kenya 12 9 21Lithuania 1 1Marshall Islands 1 1Mexico 5 1 6Micronesia (Federated States of) 2 2Mongolia 1 1Morocco 1 1Nepal 1 1Netherlands 2 1 3Nicaragua 2 2Pakistan 2 3 5Panama 1 1Paraguay 2 2Peru 1 1Philippines 6 5 11Russian Federation 1 1Slovakia 4 4Thailand 6 8 14The former Yugoslav Republic of Macedonia 1 1Tunisia 1 2 3Turkey 0Uganda 1 1 2United Kingdom of Great Britain and Northern Ireland
1 1
United Republic of Tanzania 1 2 3United States of America 2 1 3Viet Nam 4 1 5Yemen 1 1Zambia 2 2Zimbabwe 1 1
Field total 101 55 156 TOTAL 161 81 242
Duty station

MC/INF/310 Annex (English only) Page 14
RECRUITMENT AND SELECTION
Figure 13: Vacancy notices issued for Officials, 2009–June 2013
Vacancy notices issued 2009 2010 2011 2012 June 2013
Headquarters positions 18 11 12 15 10
Field positions 57 35 64 62 18
Total number of vacancy notices issued7 75 46 76 77 28
Advertised internally only8 55 33 53 57 20
Headquarters positions 14 6 7 6 7
Field positions 41 27 46 51 13
Advertised internally and externally 20 13 23 20 8
Headquarters positions 4 5 5 9 3
Field positions 16 8 18 11 5 7 From January 2012 to June 2013 IOM issued 105 vacancy notices - (77 + 28). 8 Since January 2008, vacancy notices advertised internally have also been open to external candidates from
non-represented Member States.
Figure 14: Officials appointed worldwide through vacancy notices, 2009–June 2013
Vacancy notices issued 2009 2010 2011 2012 June 2013
Vacancies filled internally 45 34 45 49 3
Headquarters positions 12 6 6 6 0
Field positions 33 28 39 43 3
Vacancies filled externally 18 6 20 9 2
Headquarters positions 4 4 5 4 1
Field positions 14 2 15 5 1
Total9 63 40 65 58 5
9 From January 2012 to June 2013, IOM processed a total of 63 (58 + 5) staff members appointed through vacancy notices.

MC/INF/310 Annex (English only)
Page 15
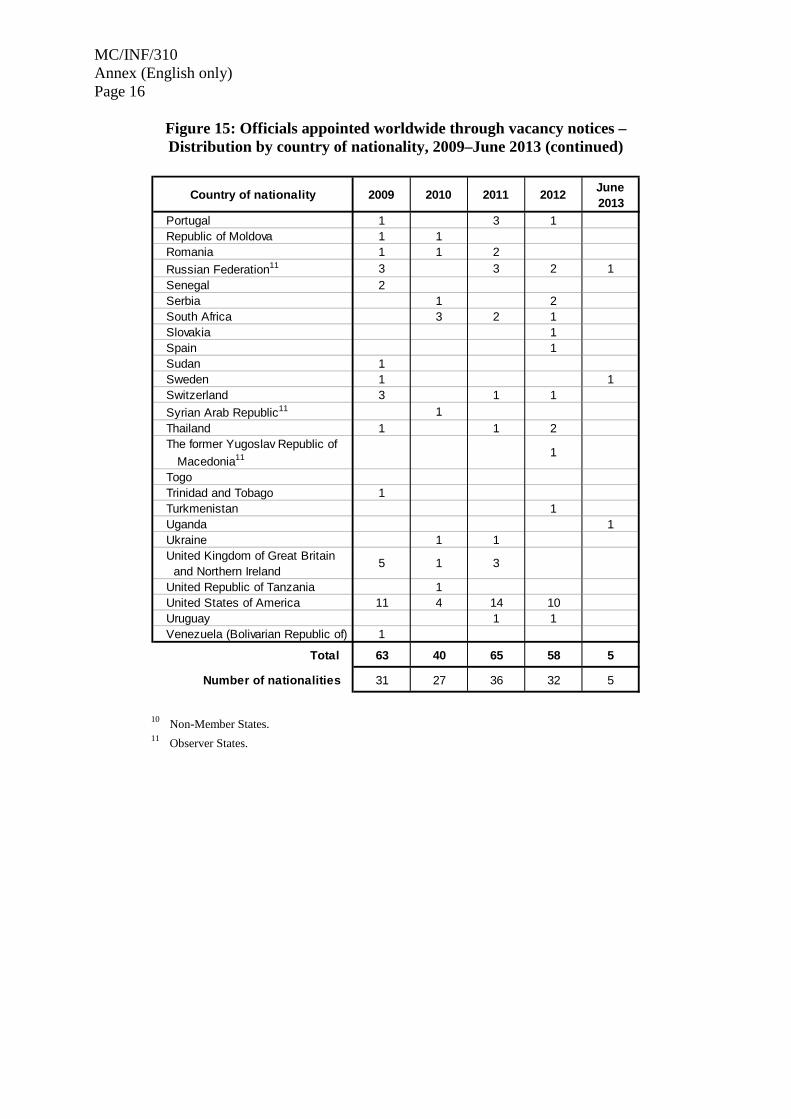
Figure 15: Officials appointed worldwide through vacancy notices Distribution by country of nationality, 2009–June 2013
Country of nationality 2009 2010 2011 2012 June 2013
Afghanistan 1Albania 1Algeria 1Argentina 1Australia 3 2 2 1 1Austria 1 1 1Azerbaijan 1Bangladesh 1 1Belarus 1Belgium 1 2Bolivia (Plurinational State of) 1Bosnia and Herzegovina 1 1Burundi 1Canada 2 2 2 3Chad 1Colombia 1Costa Rica 1 1 1Côte d’Ivoire 1 1Croatia 1 1Denmark 1 1Ecuador Egypt 1 2Ethiopia 1 1Finland 1France 2 6 2Germany 3 2 1 3Ghana 1Greece 1Honduras 1Hungary 1India 2Indonesia10 1Iraq11 2Ireland 1Italy 5 6 2 6Japan 1 1Jordan 1 1Kazakhstan 1Kenya 1 2 1Latvia 1 1Lebanon10 1Liberia 1Mexico 1Morocco 1Netherlands 2 1New Zealand 1Pakistan 1Panama 1Philippines 2 2Poland 1
MC/INF/310 Annex (English only) Page 16
Figure 15: Officials appointed worldwide through vacancy notices – Distribution by country of nationality, 2009–June 2013 (continued)
10 Non-Member States. 11 Observer States.
Country of nationality 2009 2010 2011 2012 June 2013
Portugal 1 3 1Republic of Moldova 1 1Romania 1 1 2Russian Federation11 3 3 2 1Senegal 2Serbia 1 2South Africa 3 2 1Slovakia 1Spain 1Sudan 1Sweden 1 1Switzerland 3 1 1Syrian Arab Republic11 1Thailand 1 1 2The former Yugoslav Republic of Macedonia11 1
TogoTrinidad and Tobago 1Turkmenistan 1Uganda 1Ukraine 1 1United Kingdom of Great Britain and Northern Ireland
5 1 3
United Republic of Tanzania 1United States of America 11 4 14 10Uruguay 1 1Venezuela (Bolivarian Republic of) 1
Total 63 40 65 58 5
Number of nationalities 31 27 36 32 5

MC/INF/310 Annex (English only)
Page 17
Figure 16: Vacancy notices issued for General Service staff at Headquarters, 2009–June 2013
Vacancy notices issued 2009 2010 2011 2012 June 2013
Total number of vacancy notices issued 5 3 3 3 3 Advertised internally only 4 2 3 2 2 Advertised internally and externally 1 1 0 1 1
Total number of corresponding positions 5 3 3 3 3 Vacancies filled internally 4 2 2 1 1
Employees from Headquarters 1 0 2 1 1 Employees from the Field 3 2 0 0 0
Vacancies filled externally 0 1 0 1 0
Figure 17: Mobility of IOM staff,12 2009–June 2013
2009 2010 2011 2012 June 2013
From Headquarters to the Field 0 16 11 12 1
From the Field to Headquarters 5 18 15 9 1
From one Field Office to another 28 157 140 155 76
Reassignment within same duty station 14 60 68 73 31
Total 47 251 234 249 109
12 Starting in 2010, Figure 17 has been revised to include all staff movements for Officials.
Figure 18: Temporary recruitment and selection, 2009–June 2013
2009 2010 2011 2012 June 2013
For Officials Number of temporary vacancy notices issued13 32 73 85 101 36 Number of temporary positions filled 21 69 60 100 25
Of which for emergency and post-conflict operations 1 10 21 62 16
For Employees at Headquarters14 Number of temporary vacancy notices issued 1 0 2 0 0 Number of temporary positions filled 1 0 2 0 0 6
Direct recruitment15 For Officials 153 182 117 101 49 For Employees 5 4 14 7 4
13 From January 2012 to June 2013, 137 (101 + 36) temporary vacancy notices were published. 14 No temporary vacancy notices were issued for Employees from January 2012 to June 2013. 15 From January 2012 to June 2013, IOM processed a total of 161 (108 + 53) direct recruitment requests.

MC/INF/310 Annex (English only) Page 18
STAFF DEVELOPMENT AND LEARNING
Figure 19: Staff development and learning activities, 2009–June 2013
2009 2010 2011 2012 2013
Learning activities organized 60 43 81 72 56
Total staff members 7 735 7 699 8 503 8 253 8 061
Staff members trained 1 266 1 470 1 842 1 670 663
Percentage of staff trained 16.37% 19.09% 21.66% 20.24% 8.22%
Figure 20: Staff trained - Distribution by gender, 2009–June 2012

MC/INF/310 Annex (English only)
Page 19
Figure 21: Staff trained – Distribution by location, 2009–2013
Figure 22: Staff trained – Distribution by category, 2009–2013
MC/INF/310 Annex (English only) Page 20
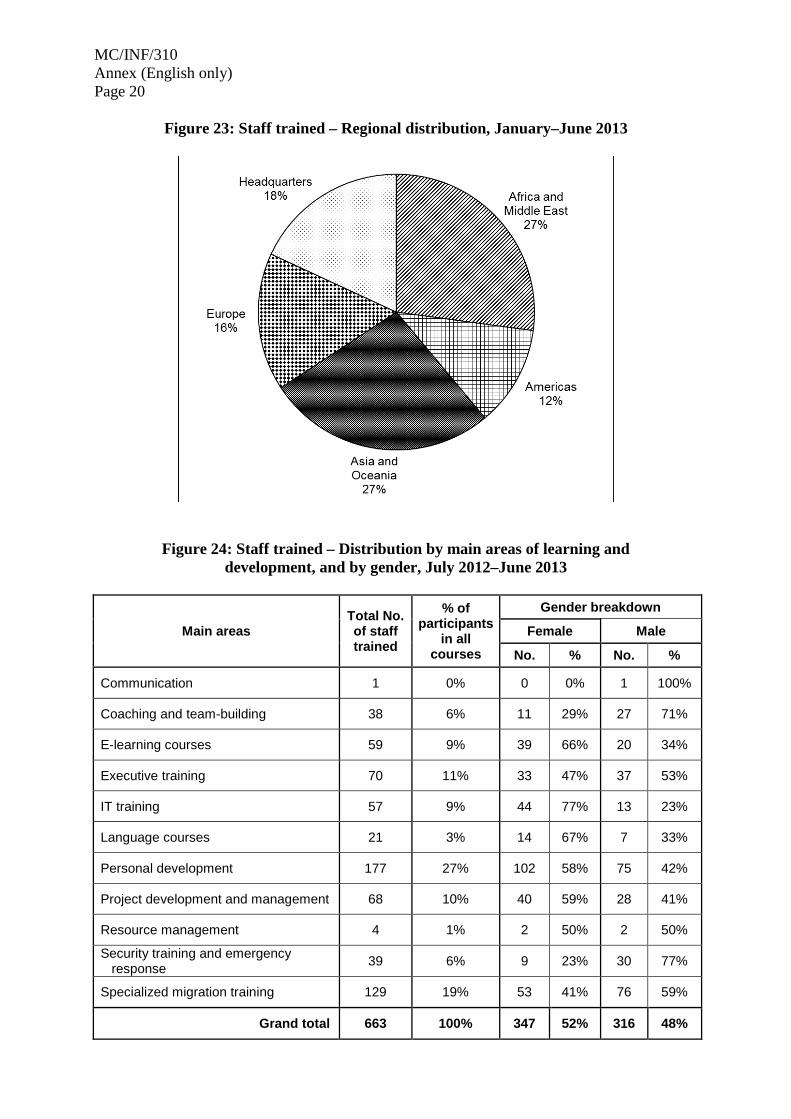
Figure 23: Staff trained – Regional distribution, January–June 2013
Figure 24: Staff trained – Distribution by main areas of learning and development, and by gender, July 2012–June 2013
Main areas Total No. of staff trained
% of participants
in all courses
Gender breakdown
Female Male
No. % No. %
Communication 1 0% 0 0% 1 100%
Coaching and team-building 38 6% 11 29% 27 71%
E-learning courses 59 9% 39 66% 20 34%
Executive training 70 11% 33 47% 37 53%
IT training 57 9% 44 77% 13 23%
Language courses 21 3% 14 67% 7 33%
Personal development 177 27% 102 58% 75 42%
Project development and management 68 10% 40 59% 28 41%
Resource management 4 1% 2 50% 2 50%
Security training and emergency response 39 6% 9 23% 30 77%
Specialized migration training 129 19% 53 41% 76 59%
Grand total 663 100% 347 52% 316 48%