mco management and monitoring workshop 6-17-13 management and monitoring performancemonitoring...
TRANSCRIPT

MCO Management and Monitoring PerformanceMonitoring Performance
Benchmarks - June 17, 2012
Presented by:
David Lloyd FounderDavid Lloyd, FounderM.T.M. ServicesP. O. Box 1027, Holly Springs, NC 27540Ph 919 434 3709 F 919 773 8141Phone: 919-434-3709 Fax: 919-773-8141E-mail: [email protected] Site: mtmservices.org
Presented By: David Lloyd, Founder 1

Learning Objectives for Today:L h f f “ l i ”1. Learn how to focus on outcomes for “population” focused service capacity.
2. Learn the components of an accountable care key performance indicator based provider networkperformance indicator based provider network management model.
3. Learn the recommended MCO financial performance measures to help ensure sustainability of the MCO.p y
4. Learn the recommended provider network contract key performance indicators to support moving to a closed provider network.
5. Learn how to develop utilization management based provider performance review process.
Presented By: David Lloyd, Founder 2

Responsibilities of the MCO“ f h ibili i f1. “Perform the statutory responsibilities of a local management entity as outlined in NC GS § 122C-115.4.
2. Establish procedures for the oversight, monitoring, and evaluation of subcontractors, including its provider network, to ensure
t ti d i t faccurate reporting and appropriate use of State and Federal funds.
3. Maintain full accountability for all aspects of W i ti d f ti llWaiver operations and for meeting all contract requirements specified by the Department.”
Source: The North Carolina Gold Star Provider Monitoring ProcessSource: The North Carolina Gold Star Provider Monitoring Process
Presented By: David Lloyd, Founder 3

Integrated Healthcare “Values”: gNeeded
Under an Accountable Care Organization Model the Value ofUnder an Accountable Care Organization Model the Value of Behavioral Health Services will depend upon our ability to:1. Be Accessible (Fast Access to all Needed Services) 2. Be Efficient (Provide High quality Services at Lowest ( g q y
Possible Cost) 3. Electronic Health Record capacity to connect with other
providers in the BH/IDD arena and quickly with physical health providers MCOs/CCEshealth providers MCOs/CCEs.
4. Focus on Episodic Care Needs and Treat to Target Models 5. Ability/Willingness to participate in Bundled/Case Rate
Shared Risk Payment Models 6. Produce Outcomes!
Engaged Clients using Natural Support Networks Help Clients Self Manage Their Health, Wellness and Recovery Reduce Need for Emergent/ High Cost Services Reduce Need for Emergent/ High Cost Services
4Presented By: David Lloyd, Founder

Change Initiatives to Enhance CBHOsChange Initiatives to Enhance CBHOs “Value” as a Network Provider
d d h h d1. Reduce access to treatment processes and costs through a reduction in redundant collection of information and process variances
2. Develop Centralized Schedule Management with clinic/program wide and individual clinician “Back Fill” management using the “Will Call”
dprocedure3. Develop scheduling templates and standing appointment protocols for all
direct care staff linked to billable hour standards and no show/cancellation percentages
4. Design and implement No Show/Cancellation management principles and practices using an Engagement Specialist to provide qualitative support
5. Design and implement internal levels of care/benefit package designs to support appropriate utilization levels for all consumers
6. Design and Implement re-engagement/transition procedures for current cases not actively in treatment.
7. Develop and implement key performance indicators for all staff including cost-based direct service standards
8. Collaborative Concurrent Documentation training and implementation
5Presented By:
David Lloyd, Founder

Change Initiatives to Enhance CBHOsChange Initiatives to Enhance CBHOs “Value” as a Network Provider9 Design and implement internal utilization management functions9. Design and implement internal utilization management functions
including: Pre-Certs, authorizations and re-authorizations Referrals to clinicians credentialed on the appropriate third
party/ACO panelsparty/ACO panels Co-Pay Collections Timely/accurate claim submission to support payment for services
providedD l d i l t S i i /C hi Pl ith hi / ti10. Develop and implement Supervision/Coaching Plan with coaching/action plans
11. Develop objective and measurable job descriptions including key performance indicators for all staff and develop an objective coaching b d E l ti Pbased Evaluation Process
12. Provide Leadership/Management Training that changes the focus from supervision to a coaching/leadership model
13. Develop public information and collaboration with medical providers in h i h h I B ildi d C S i lthe community through an Image Building and Customer Service plan
6Presented By:
David Lloyd, Founder

Sample MCO Network ProvidersSample MCO Network Providers KPI Categories
1. Population Management Indicators2. Access to treatment indicators3. Financial Performance Indicators4. Clinical Outcome Indicators5. Compliance Performance Indicators6. Utilization Management Indicators7. Consumer Satisfaction Indicators8. Physical Facility Indicatorsy y
Presented By: David Lloyd, Founder 7

Population Management Model To support minimizing financial risk for the MCOs and To support minimizing financial risk for the MCOs and
CCEs a significant qualitative and outcome shift will be needed from primarily “treating consumers that present for care and consumers currently in caseloads” to a re-yfocus on consumers in caseloads that are not engaged in services and the number of consumers that are eligible for services (i.e., Medicaid Eligible) that are not currently in service.
What are the total population healthcare/ wellness needs for BH/IDD services now and shortly the physical health y p yand oral health needs of the consumers
How do MCOs use their care coordination capacity to address high risk/high utilization consumers that are not g / gengaged in services? (i.e., Missouri 3,700 Study )
Presented By: David Lloyd, Founder 8

Distributive Justice Ethical Focus of “At Risk” MCO and Networkof At Risk MCO and Network Providers Distributive Justice Ethical Dilemma: Distributive Justice Ethical Dilemma:
1. How does the MCO/Providers in the Network ensure that it is providing the greatest good to the greatest
b f l b d th li it dnumber of people based on the limited resources available
2. How do the MCO/Providers shift the primary service d li f f it t l d t ldelivery focus from its current caseloads to an equal focus between current caseloads and persons presenting to access services?Th MCO P id N t k M t (PNM) ill3. The MCOs Provider Network Management (PNM) will need to establish key performance standards to ensure that the needs of ALL of the people in the catchment area are responded to timely andcatchment area are responded to timely and effectively.
Presented By: David Lloyd, Founder 9

Focus Areas for UM Plan• Front End (i e Screening/Triage• Front End (i.e., Screening/Triage,
Eligibility, Emergency Services, Referrals, etc.)Concurrent (i e Urgent/Routine• Concurrent (i.e., Urgent/Routine Transfer/Discharge Criteria/Planning, Services for high risk consumers, qualitative review of clinical documentationqualitative review of clinical documentation and treatment planning, etc.)
• Prospective (i.e., what are the next steps with the consumer following current LOC)with the consumer following current LOC)
• Retrospective (i.e., Qualitative/ Quantitative Review of Charts and O t /S ti f ti M t )Outcomes/Satisfaction Measures, etc.)
10Presented By:
David Lloyd, Founder

Key Qualitative Based Utilization Management Focus Area to SecondaryManagement Focus Area to Secondary Service Capacity
• Are we treating the needs we have professionally diagnosed that each
hconsumer has? OR
• Are we carrying inactive active caseload members while consumers
ki i iti ? (iseeking services are waiting?… (i.e., Clinical Protocols that require Therapist to Carry Chart for Physicians)Carry Chart for Physicians)
11Presented By:
David Lloyd, Founder
Population Management Model
Shift from “case management” to “care coordination” model of service that will begin to focus beyond BH/IDD to the total wellness needs of the consumers (i.e., physical health and oral health) in the upcoming Comprehensive Care Entity (CCE) model.
Presented By: David Lloyd, Founder 12

National Healthcare Homes New Medicaid Services Under SectionMedicaid Services Under Section 2703 of the Affordable Care Act
C h i C M1. Comprehensive Care Management2. Care Coordination and Health Promotion
P ti t d F il S t3. Patient and Family Support4. Comprehensive Transitional Care
Referral to Community and Social Support5. Referral to Community and Social Support Services
13Presented By:
David Lloyd, Founder

“Mental Health Community Case Managementand Its Effect on Healthcare Expenditures” By: Joseph J. Parks, MD; Tim Swinfard, MS; and Paul Stuve, PhD Missouri Department of Mental Health Source: PSYCHIATRIC ANNALS 40:8 | AUGUST 2010
People with severe mental illness served by public mental health systems have rates of co-occurring chronic medical illnesses that of two to three times higher than the general population, with a corresponding life expectancy of 25 years less.
Treatment of these chronic medical conditions ……. comes from costly ER visits and inpatient stays, rather than routine screenings and preventive medicine.
In 2003 in Missouri for example more than 19 000 participants In 2003, in Missouri, for example, more than 19,000 participants in Missouri Medicaid had a diagnosis of schizophrenia. The top 2,000 of these had a combined cost of $100 million in Missouri Medicaid claims, with about 80% of these costs being related not to pharmacy, but to numerous urgent care, emergency room, andto pharmacy, but to numerous urgent care, emergency room, and inpatient episodes.
The $100 million spent on these 2,000 patients represented 2.4% of all Missouri Medicaid expenditures for the state’s 1 million eligible recipients in 2003in 2003.
Presented By: David Lloyd, Founder 14

Total healthcare utilization per user per month, pre- and post-community mental health case management. The graph shows rising total costs for the sample during the 2 years before enrolling in CMHCM, with the average per user per monththe 2 years before enrolling in CMHCM, with the average per user per month (PUPM), with total Medicaid costs increasing by over $750 during that time. This trend was reversed by the implementation of CMHCM. Following a brief spike in costs during the CMHCM enrollment month, the graph shows a steady decline over the next year of $500 PUPM, even with the overall costs now including CMHCM
iservices.
Presented By: David Lloyd, Founder 15
Source: PSYCHIATRIC ANNALS 40:8 | AUGUST 2010

Access to Treatment Challenge Areas – Delay Equals IncreasedAreas Delay Equals Increased Risk and Costs: 1. The primary challenge facing almost every healthcare
provider is having adequate service delivery capacity to support timely and effective access to treatment.
2. In an era of integrated healthcare reform, access to treatment is even more critical.
3. The historical three levels of access to care challenge have been:a. Primary Access – Time to provide client face to face initial
intake/assessment after call for helpb. Secondary Access – Time to provide client face to face service
with his/her treating clinician following intake/assessment datec. Tertiary Access – Time to first face to face service with
Psychiatrist/APRN following the intake/assessment data Address
16
Psychiatrist/APRN following the intake/assessment data Address a historical
Presented By: David Lloyd, Founder

What is Same Day Access? What Does it Mean?
Open Access is a shift in definitionOpen Access is a shift in definition of “treatment” from “scheduling a client” as a solution today to a practice management processpractice management process that expects the practice to respond to the client’s needs by p yseeing the client the day services are requested and then engage the client in an Episode of Carethe client in an Episode of Care.
17Presented By:
David Lloyd, Founder

Four Step Process Change ToFour Step Process Change To Move To Same Day Access
Id if h li lli lki i1. Identify when clients are calling or walking in seeking help (two hour segments per day of week)
2. Identify the current first call for routine help to treatment plan completion processes costs andtreatment plan completion processes, costs and time delays
3. Develop standardized process that is more time and cost effective (i.e., one hour assessment ( ,appointment face to face and write up total time)
4. Use new standardized access process as the basis for the Same Day Access model and include JUST IN TIME protocols for assessment capacity beyond onTIME protocols for assessment capacity beyond on call staff
5. Develop service capacity within center to access new referrals more timelynew referrals more timely
Presented By: David Lloyd, Founder 18

Secondary and Tertiary AccessSecondary and Tertiary Access Challenges
Secondary Access - KPI Standard: Total days wait to treatment for therapist/case manager is preferred in 3 to 5 days butmanager is preferred in 3 to 5 days but not more than 8 calendar days or less from Intake/Assessment date
Challenge to Compliance: Level of non-engagement in ongoing therapy and case management services which creates amanagement services which creates a sense of caseloads being full..
Presented By: David Lloyd, Founder 19

Secondary and Tertiary AccessSecondary and Tertiary Access Challenges
Tertiary Access - KPI Standard: total wait time to MD/APRN is 5 days but no more than 10 total calendar days fromthan 10 total calendar days from Intake/Assessment date
Challenge to Compliance: Level of non-engagement in ongoing med follow up services which requires a high level of system noise to provide bridge medicationssystem noise to provide bridge medications by phone that creates a sense of being overwhelmed..
Presented By: David Lloyd, Founder 20

Access to Treatment Outcomes for National Learning Collaboratives
1. Measurement of current processes from first call for routine help to treatment plan completion
2. Measurement processes provided indicate that the h t f 15 t h 191 diff t flcohort of 15 centers have 191 different flow
processes3. Number of staff hours needed range from .5 hours
to 11 7 hours – Cohort average is 5 hours of staffto 11.7 hours Cohort average is 5 hours of staff time
4. Cost of processes range from $11 to $855 – Cohort average cost is $369g $
5. Total days wait to treatment range from less than one day to 150 calendar days – Cohort average wait time is 31.30 calendar days for all divisions/programsdivisions/programs
21Presented By:
David Lloyd, Founder

Access to Treatment National Best PracticeAccess to Treatment National Best Practice Target Averages
S D /O A T i hi1. Same Day/Open Access to Treatment processes within each center: Gold Standard – Standardized Process for the center Silver Standard – No more than one per divisionSilver Standard No more than one per division
2. Number of staff hours needed from first call for routine help to treatment plan completion range from 2 hours to 2.5 hours which will require staff to use collaborative documentation processcollaborative documentation process Assessment process target is one hour using CSR support
3. Cost of processes range from $150 to $2004. Total days wait to treatment for therapist/case y p
manager is preferred in 3 to 5 days but not more than 8 calendar days or less and to MD/APRN is 5 days but no more than 10 total calendar days or less from Intake/Assessment date
22Presented By:
David Lloyd, Founder

Poll Results based on over 600 Registrants for the NC LIVE Webinar on Enhanced Revenue P esented b Da id Llo d MTM Se ices onPresented by David Lloyd, MTM Services on December 15, 2009 and January 12, 2010
F om the clinicians’ pe specti e a e the caseloads in o o gani ation “f ll” at1. From the clinicians’ perspective, are the caseloads in your organization “full” at this time?Yes = 74% No = 26%
2. Do you know the cost and days of wait for your organization’s first call to t t t l l ti ?treatment plan completion process?
Yes = 41% No = 59%3. Indicate the no show/cancellation percentage last quarter in your organization
for the intake/assessment appointments:A. 0 to 19% = 20%B. 20 to 39% = 42%C. 40 to 59% = 15%D. Not aware of percentage = 23%D. Not aware of percentage 23%
4. Indicate the no show/cancellation percentage last quarter in your organization for Individual Therapy appointments:
A. 0 to 19% = 24%B 20% to 39% = 50%B. 20% to 39% = 50%C. Not aware of percentage = 26%
23Presented By:
David Lloyd, Founder

National Engagement g gIndicators:
l d d fNational Standard for Appointment Types:
A i KAppointment KeptNo Show (less than 36 to 24 hrs notice)
Appointment Canceled by Client pp y(36 to 24 hrs or more notice)
Appointment Canceled by StaffAppointment Canceled by Staff
24Presented By:
David Lloyd, Founder

No Show Definition Clarification:No Show Definition Clarification:
1. No Show definition is not based solely on clients behavior as much as the impact of this behavior on service capacity of each directbehavior on service capacity of each direct care staff that day (i.e., Late cancellation results in a potential no show to schedule)
2. Cancellations count as No Shows IF the team is not backfilling 90% of pre-cancelled appointments – Therefore no shows andappointments – Therefore, no shows and cancellations carry the same weight of reduced service capacity if the backfilling process is not happening
25Presented By:
David Lloyd, Founder

National Engagement Key g g yPerformance Indicators
I iti l I t k /Di ti A t S i1. Initial Intake/Diagnostic Assessment Services = 0% No Show/Cancel rate based on Same Day access models
2. Ongoing Therapy Services = 8% - 12% No Show/Late Cancelled
3 Initial Psychiatric Evaluations = 12% to 15% No3. Initial Psychiatric Evaluations 12% to 15% No Show/Late Cancelled
4. Ongoing Medication Follow Up Services – 5% - 8% No Show/Late Cancelled NOTE: MedicationsNo Show/Late Cancelled - NOTE: Medications provided by phone to clients that missed their appointments will have to be addressed to
iti l i t i h tpositively impact ongoing no show rates.
26Presented By:
David Lloyd, Founder

• Kim Beauregard, CEO • Dr. Ann Price, CMO• Tyler Booth COO• Tyler Booth, COO
• Phone 860-291-1313 • Email: [email protected]
InterCommunity IncInterCommunity, Inc.
27Presented By:
David Lloyd, Founder

Identifying The Problem at InterCommunity BHy
Recognizing that what we were doing wasn’t working, and that although it seemed to be the norm for most agencies it wasn’t really good care, we began looking at data and meeting in Project Change Teams to identify where we were working harder rather than smarter. Perhaps the most significant issue we discovered was how No-Shows: Prevented clients in need from getting in to see their “booked”
providerprovider Caused providers to manage case loads rather than provide services Financially were ruining the agency as staff were paid to be busy but
were not generating revenue. No Show Percentage by Service – Sept. – Nov. 2011 Trend
28Presented By: David Lloyd, Founder

InterCommunity - Outcomes Achieved with I di t A M d lImmediate Access Model
29 29Presented By:
David Lloyd, Founder

InterCommunity - Immediate Access Appointment Type Outcomes Achieved:Type Outcomes Achieved: 485 No Shows and Canceled by Clients Vs. 13
1. Average of 54 No Show and Client Canceled Appointments per Month in 2011
2. Compared with an Average of 2 per month in 2012
30 30Presented By:
David Lloyd, Founder
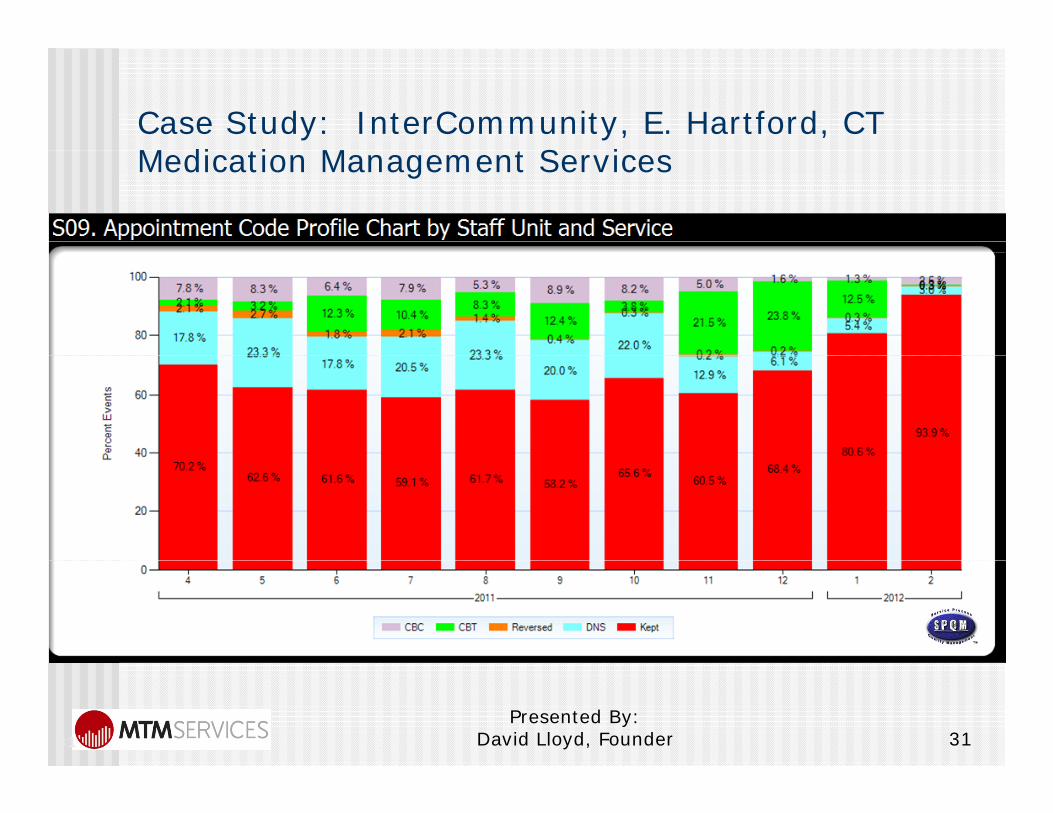
Case Study: InterCommunity, E. Hartford, CTM di ti M t S iMedication Management Services
31 31Presented By:
David Lloyd, Founder

Rosecrance Berry CampusRosecrance Berry Campus Open Access
Richard Jaconette M DRichard Jaconette M.D.
Charity Shaw-Moyado LCSW AdministratorCharity Shaw Moyado, LCSW, Administrator Rosecrance Berry Campus
32Presented By:
David Lloyd, Founder

Dr. Jaconette: Aggregate of Med Monitoring and Evaluation Events Trend
Open Access Model
33 33Presented By:
David Lloyd, Founder

Benefits EXCELLENT CLIENT CARE Increased Capacity to see clients:p y
Decrease in System Noise Level Decrease in System Noise Level through reduction in Canceled and No Show eventsNo Show events
34 34Presented By:
David Lloyd, Founder

Key Performance Indicators –Key Performance Indicators Fiscal Domain
1. Days of Cash on Hand2. Cash Ratio3. Current Ratio4. Days of Unreserved Net Assets to Total y
Expenses5. Long Term Debt to Net Assets
35Presented By:
David Lloyd, Founder

Fiscal KPIs1. Days of Cash on Hand1. Days of Cash on Hand
Standard: 60 Calendar DaysDefinition: Days of operating expenses that can be covered by unrestricted cash on hand.Formula: Cash and Cash Equivalents / (Total Expenditures / 365)Formula: Cash and Cash Equivalents / (Total Expenditures / 365)Standard: Minimum of 60 Calendar Days
2. Cash Ratio: Standard: 1 0:1 0Standard: 1.0:1.0 Definition: Cash and Cash Equivalents available to cover Current Liabilities. Formula: Cash and Cash Equivalents / Current Liabilities.Standard: Minimum of 1.0 to 1.0
3. Current RatioStandard: 1.0 Definition: A measure of Current Assets available to cover Current Liabilities.F l C t A t / C t Li bilitiFormula: Current Assets / Current LiabilitiesStandard: Minimum of 1:1
Presented By: David Lloyd, Founder 36

Fiscal KPIs4. Days of Unreserved Net Assets to Total Expenses
Standard: 60 DaysDefinition: Days of expenses covered by the agency’s
l d daccumulated unrestricted earnings.Formula: Unreserved net assets / (total expenses / 365).Standard: Minimum of 60 calendar days.
5. Long Term Debt to Net AssetsStandard: Maximum ratio of 2.5:1Definition: Comparison of Long Term Debt to Net Assets.Formula: Total Long Term Debt less Current Portion / Total Net Assets.St d d M i ti f 2 5 1
37
Standard: Maximum ratio of 2.5:1
Presented By: David Lloyd, Founder

Remediation ProcessV i t( ) h ll b b itt d ithi 30 Variance report(s) shall be submitted within 30 days from the end of the month in which a negative variance greater than 20% occurs in
i di tany indicator. A corrective action plan shall be submitted no
later than 30 days from the submission of the yvariance report.
Within 30 days of receipt, MCO will review and respond to the corrective action plan, and mayrespond to the corrective action plan, and may request additional information.
Timelines for improvement and reporting requirements will then be negotiated between
38
requirements will then be negotiated between the contract provider and MCO.
Presented By: David Lloyd, Founder

Payment Models – Highest to L t P id /P Ri kLowest Provider/Payer Risk
1. Full Risk Capitation/Sub-Capitation Rates (Per Member per Month)
2. Partial Risk Outpatient Only Capitation/Sub-2. Partial Risk Outpatient Only Capitation/SubCapitation Rates
3. Bundled Rates/Episodes of Care Rates –Shared RiskShared Risk
4. Stratified Case Rates – Shared Risk5. Case Rates – Shared Risk6. Capped Grant Funding – Shared Risk7. Performance Based Fee for Service – Shared Risk
F f S i P Ri k8. Fee for Service – Payer RiskPresented By:
David Lloyd, Founder 39

MCO Financial Management Cost Reduction Focus
MCO ill d id if h i f ll k MCOs will need to identify their process costs for all key UM and operational processes.
Standardize processes across all providers in the network (i.e., PHP in Michigan requires all providers to use same ( e , c ga equ es a p o de s o use sa eEMR)
Minimize redundancy in data collection processes Review Claims Adjudication Processes and streamline (i.e.,
what does it cost per claim to process electronically andwhat does it cost per claim to process electronically and what does it cost for claims that do not clear electronic adjudication?)
How many providers are attaining 97% data accuracy of d t d f bill d i ?documented for billed services?
How many providers submit 95% of their claims timely? What is the percentage of claim denial for each provider?
Presented By: David Lloyd, Founder 40

MCO Access and UM Functions P C tProcess Costs
Presented By: David Lloyd, Founder 41

Standard Access to Treatment for the Consortium
Presented By: David Lloyd, Founder 42

Understanding Your Costs and Changing Your Business PracticesChanging Your Business Practices
Screen Print from Strategic Data Measurement Tools written by Scott LloydScreen Print from Strategic Data Measurement Tools written by Scott Lloyd
43Presented By:
David Lloyd, Founder

Presented By: David Lloyd, Founder 44

Know the Costs Within the Provider Network Your Business PracticesNetwork Your Business Practices
Statewide Avg Avg Statewide Gain/Loss Avg State Gain/LossStaff Type Statewide Avg. Cost Per Hour
Avg. Statewide Reimb. PH
Gain/Loss Pre-Grant
Avg. State Grant Support PH
Gain/Loss After Grant
Psychiatrist ($288.63) $105.78 ($182.86) $9.81 ($173.05)
Mid-Level Practitioners (ARNP/PA) ($167.58) $106.67 ($60.91) $9.81 ($51.10)
Masters Level & Above ($117.30) $63.19 ($54.10) $9.81 ($44.30)
Bachelors Level ($86.62) $72.22 ($14.40) $9.81 ($4.59)
Below Bachelors Level ($69.82) $41.16 ($28.66) $9.81 ($18.85)
Dedicated Crisis Staff ($194.16) $124.88 ($69.28) $9.81 ($59.47)
SA Counselor ($114.41) $67.98 ($46.43) $9.81 ($36.62)
45Presented By:
David Lloyd, Founder

Process/Staff Cost ReductionsProcess/Staff Cost Reductions
Presented By: David Lloyd, Founder 46

EMR Consortia Benefits1. FQHCs have used regional Health Center
Controlled Networks (HCCNs) to develop IT and EMR solutions for multiple FQHCs in thatand EMR solutions for multiple FQHCs in that region which is much more economical as a co-located solution. (Web site reference: http://findanetwork.hrsa.gov/Search_OHIT.aspx
2 CBHOs can use the same concept to address2. CBHOs can use the same concept to address the need for electronic capacity to meet the requirements of a healthcare home
Presented By: David Lloyd, Founder 47

Presented By: David Lloyd, Founder 48

Presented By: David Lloyd, Founder 49

CBHO Consortium EMR Case Study
GAIT C i C S d GAIT Consortium Case Study:1. Six Georgia Community Service Boards (now up to 7
members)2 Reduced 29 separate process flows to one2. Reduced 29 separate process flows to one
standardized service flow process3. Reduced over 2,700 data elements being
recorded to 975 data elements through data mapping process to red ce staff costs and aitmapping process to reduce staff costs and wait times by over 50%
4. Standardized documentation data elements for all clinical forms processesp
5. Co-Location of one IT – electronic record solution6. Consortium based cost savings over $1,000,000
over the next first four years
50Presented By:
David Lloyd, Founder

Roles of Clinical and Financial Staff InRoles of Clinical and Financial Staff In Third Party Billing
l d b f ll d1. Completion and submission of all required clinical documentation by direct care staff will be needed to support authorizationswill be needed to support authorizations after Intake (if required) and re-authorizations – (i.e., Case study from D P C t MHS IL 99 9% t i dDuPage County MHS, IL - 99.9% contained within day of service)
2 Monitoring level of unreimbursed third2. Monitoring level of unreimbursed third party care – determine reasons for non payment and correct issues
51Presented By:
David Lloyd, Founder

R C l M tRevenue Cycle Management
A t d t di f h fl d t f A greater understanding of cash flows and management of billing practices will be needed in the new environment How long is your billing process?
A billi kl ?• Are you billing weekly?• Can you process third party claims daily?
What is your percent of denials? What is your performance standard on reconciliation of
billing errors? What percent of co-pays and self pay amounts are you
ll i d ilcollecting daily• Do you establish a daily collection figure for your front
desk?
52Presented By:
David Lloyd, Founder

“V l B d P h i ” M d l“Value-Based Purchasing” Model
1. Payment Reform is moving from “paying for volume to paying for value/quality”
2. VBP requires integration of our clinical, quality and financial information and the ability to track and analyze costs byinformation and the ability to track and analyze costs by consumer, provider, team, program, and payor and can operate effectively under fee for service, case rate, and sub-capitation payment models in order to succeed under a variety of Pay for p y y yPerformance (P4) bonus arrangements.
3. Medicare Case Study: October 2011 – Medicare will launch VBP for hospitals - +1% to – 1%
rate adjustment based on quality measuresrate adjustment based on quality measures In 2017 = +2% to – 2% Medicare rate adjustment based on
benchmarks that getter higher each year – “race to the top” in hospital quality
Presented By: David Lloyd, Founder 53

Value-Based Purchasing ModelValue Based Purchasing Model Core Elements
/ ff1. Know cost per service/staff type 2. Identify clinically recommended
service mix frequency and durationservice mix, frequency and duration per level of care/intensity of need (i.e., DLA-20, ICD-10 CM) to support d t i ti f t fdetermination of costs of bundled/episodic care needs
3 Provide outcomes to demonstrate3. Provide outcomes to demonstrate reduction of high/disruptive cost services (i.e., reduction in ER visits)
Presented By: David Lloyd, Founder 54

Value-Based PurchasingValue Based Purchasing Attainment Levels:1 We have educated our staff about the new payment models that1. We have educated our staff about the new payment models that
will be unfolding under the rubric of Value-Based Purchasing and understand that payment reform is moving from “paying for volume to paying for value”.
h f l l l d f l2. Leveraging the integration of our clinical, quality and financial information, they are able to determine, in near real-time, the cost of each service provided in their organization.
3. Staff have the ability to track and analyze costs by consumer,3. Staff have the ability to track and analyze costs by consumer, provider, team, program, and payor and can operate effectively under fee for service, case rate, and sub-capitation payment models. St ff b bl t i t t li i l d fi i l d t i4. Staff members are able to integrate clinical and financial data in order to succeed under a variety of Pay for Performance (P4) bonus arrangements.
5. What billing and code changes will need to be made to sustain g gintegrated physical health care in a healthcare home setting?
Presented By: David Lloyd, Founder 55

Responding to CCEs IntegratedResponding to CCEs Integrated Care Requirements
1. Comprehensive Care Entities (CCEs):
1. Treat to Target Focus2. Episodes of Care Models
M ti ti l I t i i b d B i f3. Motivational Interviewing based Brief Therapy Model (i.e., Progressive Care Model)Model)
4. Healthcare Neighbor
Presented By: David Lloyd, Founder 56

Treat to Target Attainment Levels:
M f li i i “ ”1. Most of our clinicians use a “treat to target” approach to planning, service delivery, and adjusting the care plan if it’s not working.
2 The majority of clinicians and supervisors have2. The majority of clinicians and supervisors have studied the treat to target literature and develop care plans that include measureable targets (e.g. 50% reduction in PHQ-9 scores within 12 weeks),
t l t thl d k ithmeasure progress at least monthly, and work with consumers to adjust the care plan if targets are not being met.
3 Part of this process includes the use of clinical tools3. Part of this process includes the use of clinical tools that measure improvement in symptomology, functional status, and recovery and resilience-building for the children, families and adults we serve.
Presented By: David Lloyd, Founder 57

ON-SITE Integrated Care TeamON-SITE Integrated Care Team
NP’s PA’s ReceptionistsNP s PA sPhysician
ConsumersNurses and medical
Behavioral Health
assistantsHealth Therapists
PsychiatristsCase/Care Managers
58Presented By:
David Lloyd, Founder

A Morning in the Life of A Behavioral HealthA Morning in the Life of A Behavioral Health Consultant* – From an Integrated PC System*Cherokee Health Systems
• 8:00 Review records of patients scheduled• 8:30 Chronic pain and depression• 9:00 Trauma Assessment• 9:15 Compliance coping skills• 9:45 Transplant/psycho education• 10:00 Multiple ER Visits/Chest Pain• 10:15 Domestic abuse/depression• 10:30 Depression/substance abuse• 10:45 Work in patient for Dx. Clarification/Tx. Planning• 11:00 Bipolar/diabetes/asthma/obesity• 11:15 Weigh management/obesity• 11:45 Anxiety management
59Presented By:
David Lloyd, Founder

Internal Benefit Design/Levels of Care Provide the Required Framework for UM Plans
d t C t C it f N Cli t tand to Create Capacity for New Clients to Receive Treatment
1. Development of internal levels of care/benefit package designs to support appropriate utilization levels for all consumerslevels for all consumers
2. Core Elements of Benefit Design/LOC Model:1. Admission Criteria (as objective as possible using
Di i P fil DLA 20/LOCUS )Diagnostic Profiles, DLA-20/LOCUS scores, etc.)2. Continue Stay Criteria3. Transition/Discharge Criteria3. Transition/Discharge Criteria4. Service Array and Frequency to be Provided5. Projected Service Duration within each level
60Presented By:
David Lloyd, Founder

Engagement Based Same Day Access/Treatment Plan Model Using Benefit Design/Level of Care Criteria
61Presented By:
David Lloyd, Founder

Episodic Care Model Vs. Histo ical Ch onic A e BH ModelHistorical Chronic Are BH Model:
I t it f
Intensity of Need Episodes of Care Need
Low
Moderate
High
Lifetime of Client/Consumer
62Presented By:
David Lloyd, Founder

H lth N i hb El tHealthcare Neighbor Elements
Staff are well underway developing the capabilities to be Staff are well underway developing the capabilities to be good neighbors to physical health providers. This includes:
1 effective communication coordination and integration with1. effective communication, coordination, and integration with health homes;
2. appropriate and timely consultations and referrals; 3. efficient, appropriate, and effective flow of necessary patient3. efficient, appropriate, and effective flow of necessary patient
and care information; 4. providing guidance in determining responsibility in co-
management situations; and 5. supporting the health home as the leader of the care team.
Toward this end, we provide or have partnerships with other organizations to offer and seamlessly provide a full array of mental health and substance use services for persons withmental health and substance use services for persons with mild, moderate, serious and severe disorders.
Presented By: David Lloyd, Founder 63

Healthcare Home NeighborHealthcare Home Neighbor
A provider that partners to deliver specialty A provider that partners to deliver specialty, subspecialty, or inpatient care
American College of Physicians’ PCMH-N principles: The healthcare home & the specialist should:The healthcare home & the specialist should: Determine type(s) of clinical relationships the specialist is
willing to enter into:• Pre-consultation exchange (“curbside consult”)Pre consultation exchange ( curbside consult ) • Formal consultation • Co-management• Transfer to specialty care
Formalize the structure of these relationships through care coordination agreements
• With financial and nonfinancial incentives to encourage specialist’s participationspecialist s participation
64
Presented By: David Lloyd, Founder

ACP’ PCMH N P i i lACP’s PCMH-N Principles
To be recognized as a neighbor specialists must To be recognized as a neighbor, specialists must demonstrate competency around: Communication, coordination,
& i t ti& integration Timely consultations & referrals Timely, effective exchange of
clinical data Effective participation in co-
management situations Patient-centered care, enhanced
care access, and high levels of care quality and safety
Supporting the health home practice’s work
65
Presented By: David Lloyd, Founder

Practice Readiness Checklist forPractice Readiness Checklist for Integrated Care in CCE Model
• Determine if BH and PC staff are employed, contracted or independent
• Credential BH and PC staff with major private insurers• Enroll as Medicaid provider• Authorization procedures for BH and PC services by plans• Develop directory of community services
S l t d ti l t i l• Select educational materials• Determine scheduling pattern• Establish telephone procedures
Establish protocol for managing psychiatric and social emergencies• Establish protocol for managing psychiatric and social emergencies• Assign roles for communicating with other agencies • Select screening tools and functional assessment scales• Establish billing protocols• Establish billing protocols
66Presented By:
David Lloyd, Founder

Considerations Between Entities through Written MOUs
1. How will consumers be identified?
2. Who will prescribe psychotropic medication?
8. What is the overall implementation strategy?
9. Who will lead/coordinate the effort?
3. Who will provide counseling/psychotherapy?
4. Who will provide mental health back up?
10. What kind of provider/staff training is needed?
11. What structural/program changes are needed?back-up?
5. Who will track clinical outcomes and how?
6. How will treatment changes be
changes are needed?12. What are anticipated barriers and
challenges?13. How will we measure success?
initiated?7. How will team members
communicate?
14. How can the model be sustained?
67Presented By:
David Lloyd, Founder

Consideration for MCO/CCE referral forConsideration for MCO/CCE referral for Behavioral Health Consultation Services
Behavioral Health Conditions1. Diagnostic clarification and intervention planning2 Facilitate consultation with psychiatry regarding2. Facilitate consultation with psychiatry regarding
psychotropic medications3. Behavior and mood management4. Suicidal/homicidal risk assessment5. Substance abuse assessment and intervention6 Panic/Anxiety management6. Panic/Anxiety management
68Presented By:
David Lloyd, Founder

Skills for Behavioral Health Consultant
1. The ability to understand the biological components of health, illness, and disease and interaction between health and behavior
2. An understanding of how cognition, emotion, motivation can influence health
3. An understanding of how social and cultural factors affect health problems, access to health care, and adhering to treatment regimens
4. Knowledge of how to assess cognitive, affective, behavior, social, and psychological reactions for all common conditions seen in primary care
APA Primary Care Psychology Curriculum Interdivisional Task Force
69Presented By:
David Lloyd, Founder

The Behavioral Health/IDD Consultant in d C d l f C Ch i iIntegrated Care Models of Care: Characteristics,
Skills and Orientation to Practice
Characteristics• Flexible, high energy level, match primary care pace and style• Team player – visible and available
Interest in health and wellness• Interest in health and wellness Skills• Finely honed clinical assessment and communication skills• Behavioral medicine knowledge baseg• Cognitive behavioral intervention skills Orientation to Practice • Action-oriented, directive, focus on patient functioning• Emphasis on prevention and building resiliency• Utilizes clinical protocols and pathways • Invested in educating patients
70Presented By:
David Lloyd, Founder
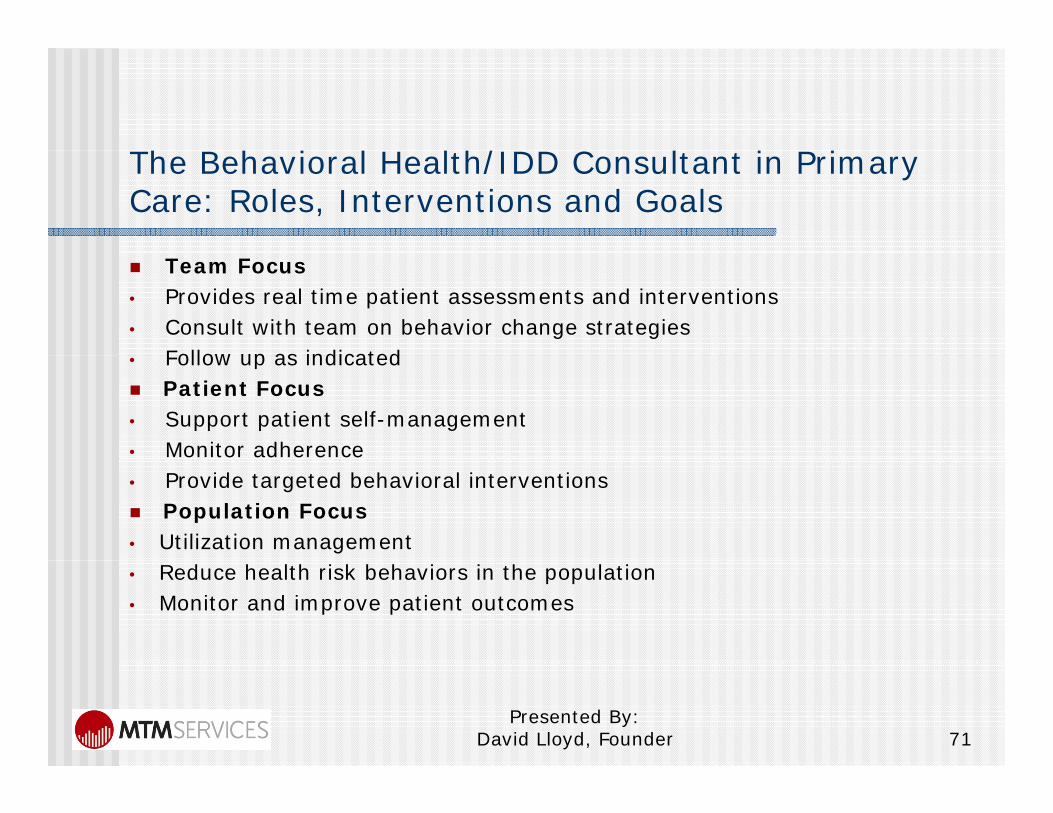
h h i l l h/ C l i iThe Behavioral Health/IDD Consultant in Primary Care: Roles, Interventions and Goals
Team Focus• Provides real time patient assessments and interventions• Consult with team on behavior change strategies
Follow up as indicated• Follow up as indicated Patient Focus• Support patient self-management• Monitor adherence• Provide targeted behavioral interventions Population Focus• Utilization management• Reduce health risk behaviors in the population• Monitor and improve patient outcomes
71Presented By:
David Lloyd, Founder

Typical Roles for an Integrated BH/IDD Health Professional
O BH/IDD i d f l1. Oversee BH/IDD screening and referral process2. Triage patients in crisis for psychiatric/IDD referral 3. Provide consultation to physicians on BH/IDD issues of
patients as needed Including guidance, based on assessment, to physicians in
considering medication options for treating mental health g p gconditions
4. Assist patients in understanding and accessing enhanced BH/IDD services as needed/ se ces as eeded
5. Collaborate with billing specialists to insure maximum reimbursement for services, insuring that preauthorization of care is obtained in a timely manner.care is obtained in a timely manner.
72Presented By:
David Lloyd, Founder

Network Provider Consumer Satisfaction Indicators
Presented By: David Lloyd, Founder 73

Presented By: David Lloyd, Founder 74

Presented By: David Lloyd, Founder 75

Network Provider Clinical Performance Indicators
Presented By: David Lloyd, Founder 76

S l N t k P id KPISample Network Provider KPIs
P id tt i t f 95% li ti1. Provider attainment of a 95% compliance rating on Qualitative and Quantitative Chart Reviews
2. Percent of services that are adequately linked to d d d l / bj ti i th t t tassessed needs and goals/objectives in the treatment
plan3. Provider attainment of 95% documentation submission
th d i id don the day services provided4. Provider attainment of 97% data accuracy of documented
services vs. billed services5. Provider will have 90% of outcome ratings showing
maintenance or improvement in the last survey period. 6. Provider will have 90% positive Consumer Satisfaction
Ratings regarding their opinions about services provided.Presented By:
David Lloyd, Founder 77

Presented By: David Lloyd, Founder 78

Presented By: David Lloyd, Founder 79

Non-Clinical Performance Indicators
Presented By: David Lloyd, Founder 80

Network Provider Non-ClinicalNetwork Provider Non Clinical Performance Indicators
1. Percent of clean claims submitted2. Percent of timely claim submission3. Percent of services provided that did
not have appropriate authorization or re authorization from MCOre-authorization from MCO
4. Fiscal Indicators such as Days of Cash on Hand Current Assets to Currenton Hand, Current Assets to Current Liability Ratio, etc.
5 IT Capacity to transmit to MCO5. IT Capacity to transmit to MCO Presented By:
David Lloyd, Founder 81

Physical Facility Indicators
Presented By: David Lloyd, Founder 82

Consumer Service Indicators – Action Plan
Presented By: David Lloyd, Founder 83

Questions and Feedback Questions?
Feedback?
Next Steps?
Presented By: David Lloyd, Founder 84