mcp checks for the h-4l mass. outline and work program the problems: – higgs mass difference from...
TRANSCRIPT

MCP checks for the H-4l mass
Outline and work program
• The problems:– Higgs mass difference from the gg– Possible single resonant peak mass shift (with low stat)– M12 in the 2mu2e channel shifted
• MCP checks (to be finalized):– Muon absolute mass scale– Overall Momentum scale– Local misalignments– Per Event mass error
• Work program
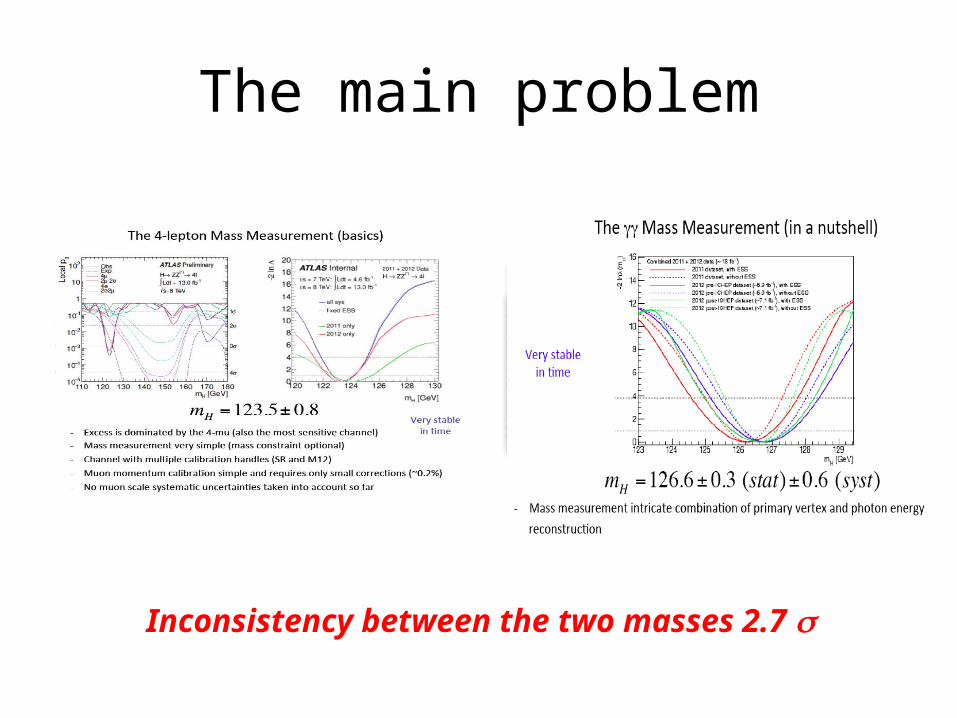
The main problem
Inconsistency between the two masses 2.7 s

Other “features” in the H-4l analysis
• Z-4 Leptons – Single resonant
Distributions
Apparent shift in the the single resonant mass spectra with standard analysis cuts
Fully relaxed analysis to increase stat: M34>0All Pt>4 GeVMass increased from 89.4 -> 90.4For 2011 we have MC without cutsMass DT = 91.0 ± 0.8 GeVMass MC = 91.1
Increasing stat
Mass increased from 89.4 -> 90.4
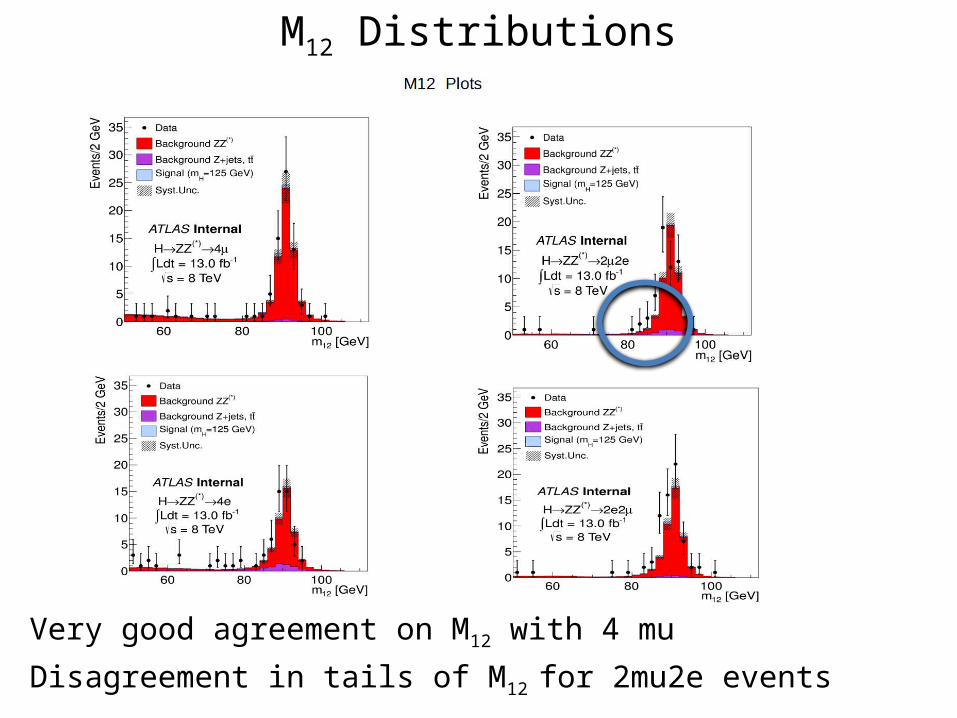
M12 Distributions
Very good agreement on M12 with 4 mu
Disagreement in tails of M12 for 2mu2e events

M12 in 2mu2e events
• Fit crystal-ball conv. BW• cbmean shift w.r.t. MC mass value• Diif = 0.8 ± 0.5
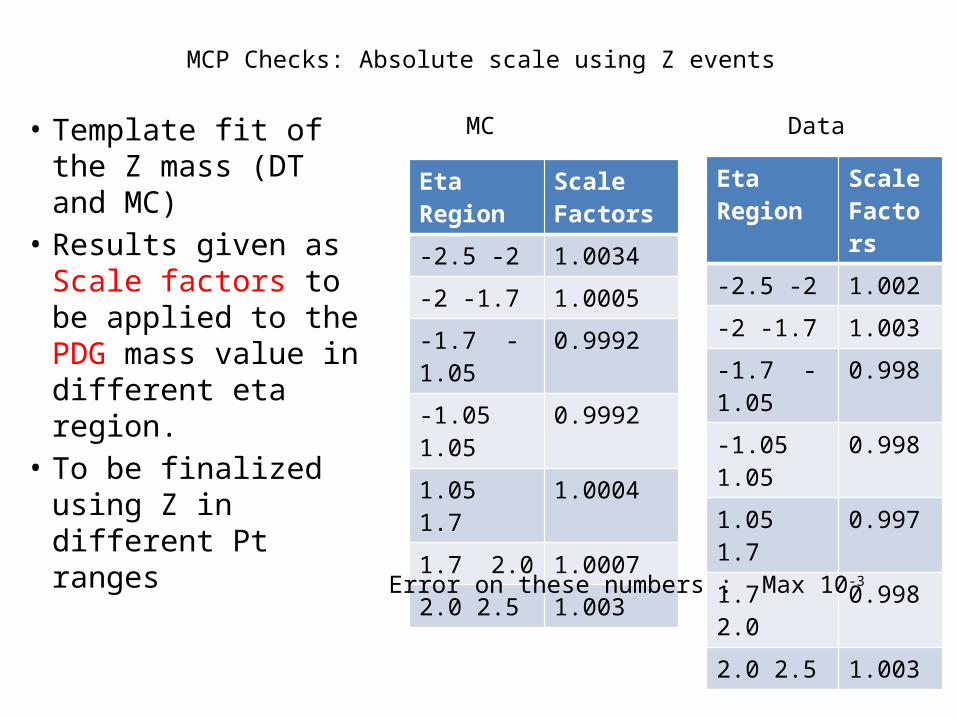
MCP Checks: Absolute scale using Z events
• Template fit of the Z mass (DT and MC)
• Results given as Scale factors to be applied to the PDG mass value in different eta region.
• To be finalized using Z in different Pt ranges
Eta Region Scale Factors
-2.5 -2 1.0034
-2 -1.7 1.0005
-1.7 -1.05 0.9992
-1.05 1.05 0.9992
1.05 1.7 1.0004
1.7 2.0 1.0007
2.0 2.5 1.003
Eta Region Scale Factors
-2.5 -2 1.002-2 -1.7 1.003-1.7 -1.05 0.998-1.05 1.05 0.998
1.05 1.7 0.9971.7 2.0 0.9982.0 2.5 1.003
MC Data
Error on these numbers : Max 10-3

Z reconstruction different Pt regionsData-MC agree at the level of about 100 MeV over the full Pt rangeDisclaimer this is NOT a measurement of the Z mass as in the previous page so we are NOT looking at agreement between PDG value and fit.

MCP Checks: Mass scale vs Pt• Reconstruct Z Mass for data and
MC as a function of leading muon Pt
• Plot difference DT-MC difference vs Pt for ID, MS and CB reconstruction
• Mean difference < 0.2% stable over data taking period and Pt.
• Same results on the other end cap and Barrel
• To be done– Enlarge the Pt coverage to lower Pt. – Cross check the results with J/Psi
and Y data.
Standalone
Combined
ID
End Cap A

MCP Checks: Pt scale vs Pt• Plot difference between DT and
MC of the measured Pt in ID and MS and in ID and Cb
• Difference 100 MeV for Sa-ID stable over data taking period and Pt.
• Same results on the other end cap and on the barrel
• To be done– Enlarge the Pt coverage to lower Pt. – Cross check the results with J/Psi
and Y data.– Check charge dependent
distributions
Standalone
Combined
End Cap AData [PT(SA)-PT(ID)]–MC[PT(SA)-PT(ID)]
Data [PT(CB)-PT(ID)]–MC[PT(CB)-PT(ID)]

Checks with J/Psi and Y • Different studies done with
J/Psi and Y– Some small inconsistencies
between them to be understood
• General picture: – Also from J/Psi absolute
scale of the CB muons is at the 0.2% level
– J/psi Mass measured with SA muons shows a max 40 MeV discrepancy
Y

Local misalignmentStudying curvature offsets as a function of detector region

Effect of local misalignment
• Select Z samples with positive muon and Z sample with negative muon going into the problematic region
• Plot the quantity q(M(mm)-Mz)• Evident shift between the two distribution (about 1.5 GeV) • Due to the MS-ID Z misalignment (See next slides) • Both SA and ID measurement do not show this problem (CB only problem)

Assessing the magnitude of the effect
• Correct the effect in two ways:– Downweight the Z measurement in the MS
covariance matrix– Correct ZME and ThetaME for the measured
misalignment.
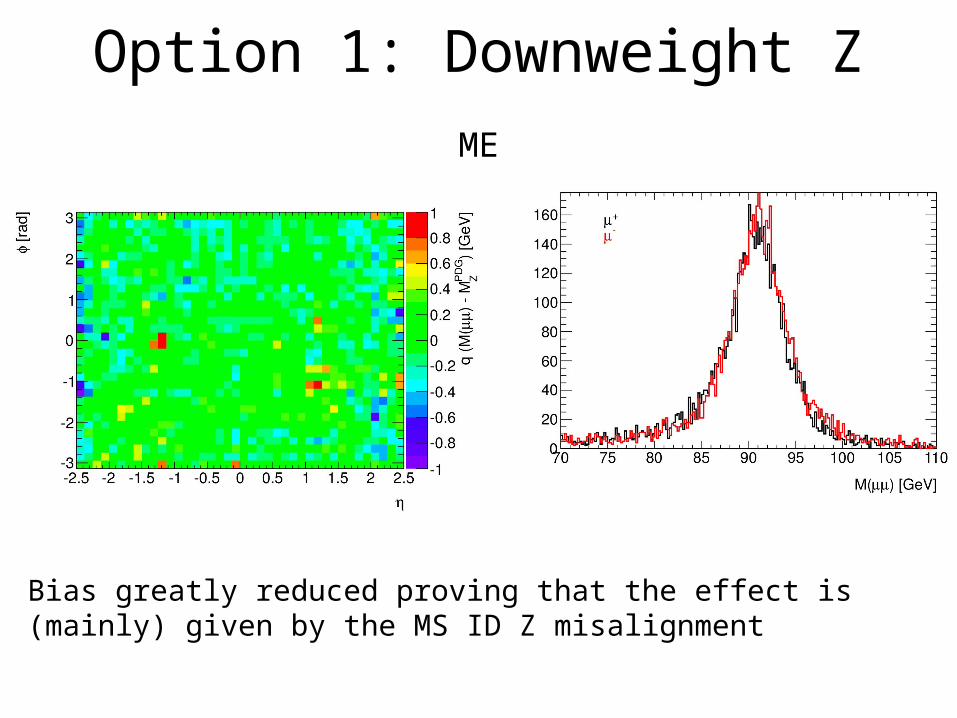
Option 1: Downweight Z ME
Bias greatly reduced proving that the effect is (mainly) given by the MS ID Z misalignment
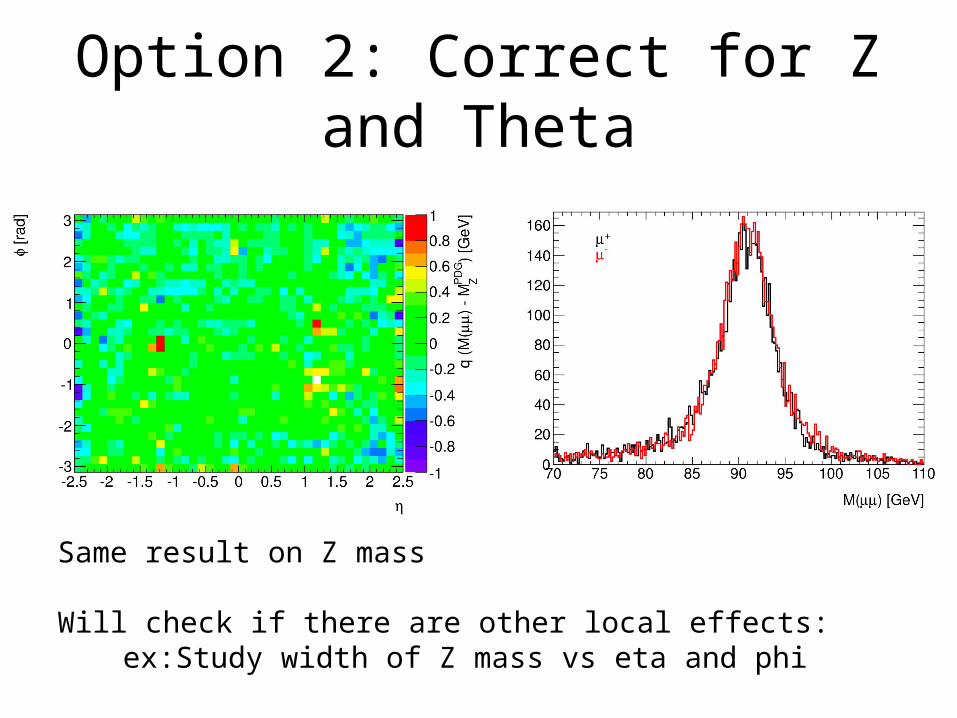
Option 2: Correct for Z and Theta
Same result on Z mass
Will check if there are other local effects: ex:Study width of Z mass vs eta and phi

Effect of local misalignment and corrections
The correction has no effect on the overallmomentum scale and negligible effect on massresolution

Proposed systematics• Reprocessed the ZZ
candidates with the Z and Theta corrections
• One candidate moves by 1.7 GeV
• The average of the distribution (simple average no weighting) moves by less than 300 MeV
• Propose to use this method to assess the systematic error due to local misalignment.
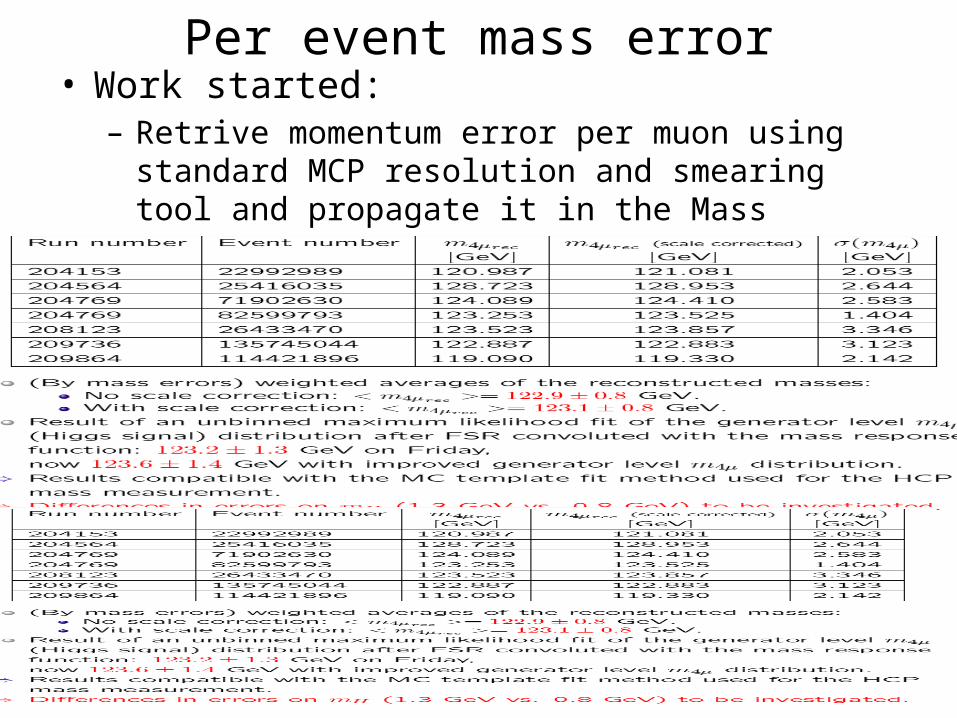
Per event mass error• Work started:– Retrive momentum error per muon using standard MCP
resolution and smearing tool and propagate it in the Mass formula.
Short term program
• Finalize absolute mass scale measurement with Z also as function of pt– Determine the systematic error to be assigned to the absolute
mass scale• Obtain coherency of results of J/PSI studies and between
J/Psi and Z studies in the low Pt regime• Continue checking for local misalignment other than the Z
and assess systematic error for the Z misalignment• Understand the per event error and the discrepancy on
the mass error obtained in the “ standard analysis” and the first results from the analysis using per event errors.