mcr2s unstructured mesh capabilities for use in …15)01.pdf · mcr2s unstructured mesh...
TRANSCRIPT
T. Eade, D. Stonell and A. Turner
CCFE-PR(15)01
MCR2S Unstructured Mesh Capabilities for use in
Shutdown Dose Rate Analysis

Enquiries about copyright and reproduction should in the first instance be addressed to the Culham Publications Officer, Culham Centre for Fusion Energy (CCFE), Library, Culham Science Centre, Abingdon, Oxfordshire, OX14 3DB, UK. The United Kingdom Atomic Energy Authority is the copyright holder.

MCR2S Unstructured Mesh Capabilities for use in
Shutdown Dose Rate Analysis
T. Eade1, D. Stonell1 and A. Turner1
1EURATOM/CCFE Association, Culham Science Centre, OX14 3DB Abingdon, UK.
The following article appeared in Fusion Engineering and Design, February 9, 2015Further reproduction distribution of this paper is subject to the journal publication rules.

.
MCR2S Unstructured Mesh Capabilities for use in Shutdown Dose Rate Analysis
T. Eadea, D. Stonella, A. Turnera
aCulham Centre for Fusion Energy, Culham Science Centre, Abingdon, UK
Abstract
As nuclear fusion progresses towards a sustainable energy source and the power of tokamak devices increases, a greater under-standing of the radiation fields will be required. As well as on-load radiation fields, off-load or shutdown radiation field are animportant consideration for the safety and economic viability of a commercial fusion reactor. Previously codes such as MCR2Shave been written in order to predict the shutdown dose rates within, and in regions surrounding, a fusion reactor. MCR2S utilisesa Constructive Solid Geometry (CSG) model and a superimposed structured mesh to calculate 3-D maps of the shutdown dose rate.A new approach to MCR2S calculations is proposed and implemented using a single unstructured mesh to replace both the CSGmodel and the superimposed structured mesh.
This new MCR2S approach has been demonstrated on three models of increasing complexity. These models were: a sphere, theITER computational shutdown dose rate benchmark and the DEMO computational shutdown dose rate benchmark. In each case theresults were compared to MCR2S calculations performed using MCR2S with CSG geometry and a superimposed structured mesh.It was concluded that the results from the unstructured mesh implementation of MCR2S compared well to the CSG structured meshcalculations. It was found that the resolution of the unstructured mesh can significantly affect the results of the calculations,and therefore it is important to finely mesh components which contribute to the dose rate in the areas of interest. Althoughcomputationally more expensive it was found that there are some clear advantages when using unstructured meshes with MCR2Scalculations which are outlined in this paper.
Keywords: MCR2S, Unstructured Mesh, Neutronics, Shutdown Dose
1. Introduction
Nuclear fusion is the process that powers the stars. If wecould harness this process in a safe and sustainable way hereon Earth it has the potential to fulfil a large portion of our en-ergy needs. On the path to a commercial magnetic confine-ment fusion reactor will be a prototype DEMOnstration reactor(DEMO). It is predicted that devices such as DEMO will be ca-pable of operating at fusion powers between 2.5 and 5 GW andproduce more than 1021 neutrons per second. This is 1000 timesgreater than the neutron output from the current Joint EuropeanTorus (JET) and about 5-10 times greater than ITER, a fusionresearch reactor currently being built in the south of France.
Neutrons are one of the primary methods of transferring en-ergy out of the plasma and also allow tritium, which makesup part of the fusion fuel, to be created in breeder blankets.However these neutrons also create large on-load neutron andprompt photon radiation fields which require evaluating in or-der to ascertain the dose rates to personnel.
During on-load operations the neutron flux causes signifi-cant material activation to occur in the reactor and surround-ing structures. Activation products build up while the reac-tor is on-load and continue to decay during off-load periods.The decay of activation products creates a photon source whichis present even when the reactor is shutdown. This source isknown by many terms including ‘off-load’, ‘decay’, ‘activation’and ‘shutdown’ photon source and can lead to radiation fields
during shutdown in areas where personnel access is required foroperations and maintenance purposes.
In order to meet the As Low As Reasonably Achievable(ALARA) requirements, stringent limits are placed on occupa-tional exposure to radiation and it is therefore essential duringthe design and engineering of new fusion reactors to take theselimits into account. As part of this process of demonstratingcompliance with these limits it is necessary to have validated,robust, reliable and efficient computational codes to estimatethe radiation fields both on- and off-load.
Estimating on-load neutron and prompt photon radiationfields can be carried out with a range of standard particle trans-port codes, such as MCNP [1]. In order to accurately calculateshutdown radiation fields, several methods requiring the cou-pling of radiation transport codes with an inventory code havebeen developed. These include the ‘advanced direct-one-step’or Advanced D1S method [2] and the ‘rigorous-two-step’ orR2S method [3]. This report concerns the R2S method only.
The R2S method couples neutron flux and energy spectra re-sults, from a particle transport code, with an activation code.At CCFE the R2S method has been implemented in the formof the Mesh Coupled Rigorous Two Step [4] (MCR2S) code.MCR2S couples neutron flux data from MCNP with the acti-vation capabilities of FISPACT-II [5], currently via the use ofa superimposed structured mesh tally. MCR2S can be used toproduce 3-D maps of the activation, nuclear inventory and shut-down photon source, with the shutdown photon source being
Preprint submitted to Fusion Engineering and Design February 9, 2015
used in a subsequent MCNP calculation to determine shutdowndose fields.
A full description of the MCR2S process can be found inprevious papers [4] but the process follows these basic steps:
1. A structured rectangular mesh superimposed onto a Con-structive Solid Geometry (CSG) model is used in MCNPto track neutrons throughout regions of interest while thereactor is on-load. The structured rectangular mesh is usedto record the neutron flux and energy spectrum during on-load operations.
2. Activation calculations are carried out for a given irradi-ation and decay schedule using the flux, energy spectrumand material in each structured mesh voxel. The results ofthese activation calculations are collated to create a shut-down photon source within the structured mesh.
3. The CSG model and the shutdown photon source are usedin MCNP to track the shutdown photons and calculate theshutdown dose rate in the areas of interest.
Although the current MCR2S method can be used to producereliable and accurate shutdown dose rate results, one issue withthis approach is the superimposed structured mesh does notnecessarily conform to the shape of the geometry. This can re-sult in mesh voxels containing a mix of materials, large sectionsof void or regions of significantly different neutron flux, partic-ularly where the geometry is complex. Depending on the meshresolution, this can lead to some parts of the geometry havingpredicted levels of activation significantly higher or lower thanthe ‘true value’. The use of superimposed meshes also fails toresolve small features, such as streaming paths, where increasedneutron fluxes are effectively homogenised into the neighbour-ing material regions.
With the addition of an unstructured mesh capability toMCNP6 it is now possible to describe geometry using a vol-umetric unstructured mesh. This mesh can be used not only totrack particles but also to record the neutron flux and energyspectrum. Instead of superimposing a structured mesh, activa-tion calculations can be carried out on each of the unstructuredmesh elements and the results can be collated to create a shut-down photon source.
The main advantage of using an unstructured mesh, over arectangular superimposed mesh, for MCR2S type calculationsis the mesh conforms to the geometry. This means the recordedneutron flux values are more realistic as there is no flux averag-ing between areas of void and material each element only hasa single material. Additionally, the use of unstructured meshesallows for more complex shapes to be modelled as the user isnot limited to analytical surfaces. It also has benefits for geom-etry creation time, with more geometrical complexity able to bemodelled with less user effort when compared to CSG.
In order to investigate some of these advantages, as well asany potential disadvantages, the MCR2S code has been modi-fied. The modifications allow MCR2S to read in neutron fluxand energy spectrum results, as well as element material, den-sity and volume from the MCNP6 unstructured mesh outputfile. MCR2S creates a gamma source file which is then read bya new MCNP6 unstructured mesh photon source routine.
This paper details the modifications made to the MCR2Scode and presents the number of test cases. The results of thetest cases are compared to results produced using the structuredmesh approach and conclusions are drawn.
2. MCR2S Unstructured Mesh Implementation
2.1. Unstructured Meshes
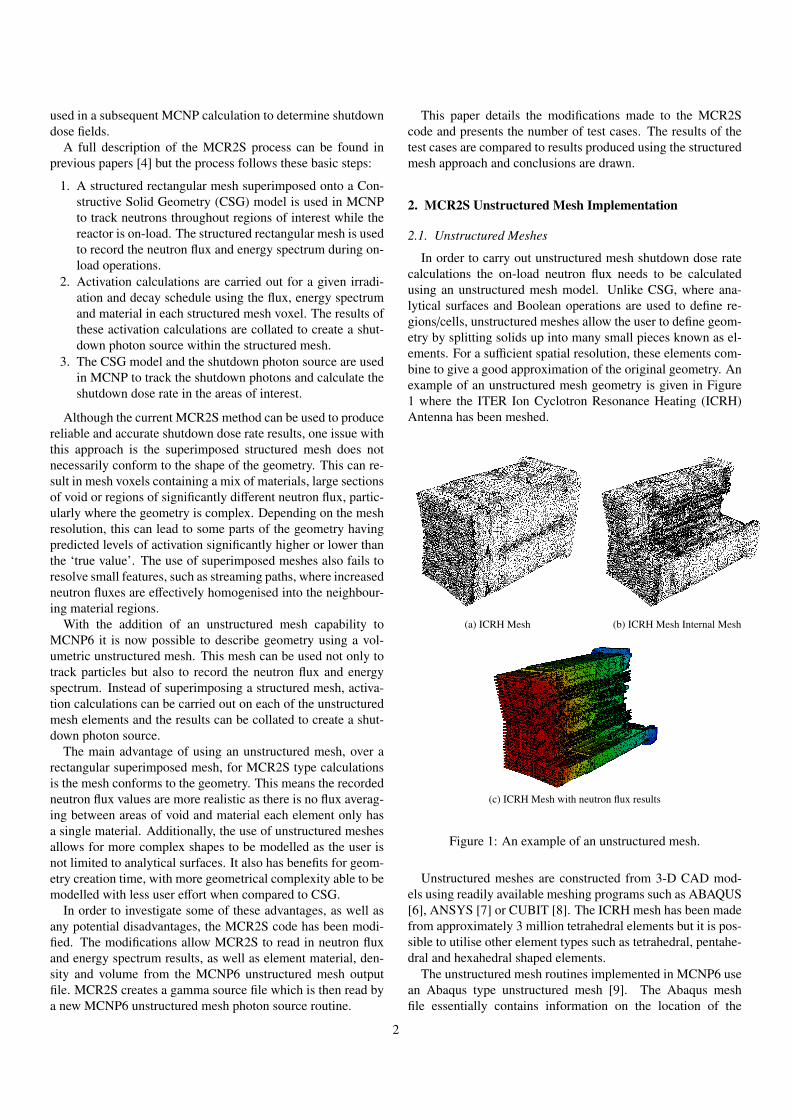
In order to carry out unstructured mesh shutdown dose ratecalculations the on-load neutron flux needs to be calculatedusing an unstructured mesh model. Unlike CSG, where ana-lytical surfaces and Boolean operations are used to define re-gions/cells, unstructured meshes allow the user to define geom-etry by splitting solids up into many small pieces known as el-ements. For a sufficient spatial resolution, these elements com-bine to give a good approximation of the original geometry. Anexample of an unstructured mesh geometry is given in Figure1 where the ITER Ion Cyclotron Resonance Heating (ICRH)Antenna has been meshed.
(a) ICRH Mesh (b) ICRH Mesh Internal Mesh
(c) ICRH Mesh with neutron flux results
Figure 1: An example of an unstructured mesh.
Unstructured meshes are constructed from 3-D CAD mod-els using readily available meshing programs such as ABAQUS[6], ANSYS [7] or CUBIT [8]. The ICRH mesh has been madefrom approximately 3 million tetrahedral elements but it is pos-sible to utilise other element types such as tetrahedral, pentahe-dral and hexahedral shaped elements.
The unstructured mesh routines implemented in MCNP6 usean Abaqus type unstructured mesh [9]. The Abaqus meshfile essentially contains information on the location of the
2

nodes and their connectivity to form elements. The unstruc-tured mesh utilises the universe structure in MCNP6. This al-lows the unstructured mesh to be defined in its own geometricspace/universe and then embedded into a CSG model, thus bothgeometry types may be in the same model if required.
2.2. MCR2S ModificationsModifications to implement shutdown dose rate calculations
on unstructured meshes have been made to MCR2Sv2. Thisversion of MCR2S uses FISPACT II [5] with the 175 ‘VitaminJ energy group EAF 2007 [10] and 2010 [11] libraries to carryout activation calculations.
The structured mesh version of MCR2S reads in both a meshtally file, containing the neutron flux and energy spectrum data,and a seperate file containing data on the fraction of materialsunder each voxel. However, using unstructured mesh geometryin MCNP6 results in an output file which contains not only theflux and energy spectrum in each element but also the material,density and volume of the element. Thus, in the case of the un-structured mesh, the MCR2S calculation only requires a singlefile to be read and processed.
An unstructured mesh reading module has been added toMCR2S. As unstructured mesh elements only ever contain asingle material, the material mixing step in MCR2S can beskipped. MCR2S then carries out FISPACT-II activation calcu-lations on each mesh element and collates the activity, contactdose rate, decay heat and decay photon source results.
The modifications to MCR2S allow the same capabilities andlimitations with unstructured mesh element types as MCNP6.Therefore, like MCNP6, MCR2S support first and second or-der: tetrahedral, pentahedral and hexahedral elements; how-ever, only pentahedral and hexahedral elements are allowed inthe same ‘part’.
The resulting shutdown photon source files for the unstruc-tured mesh contain, for each element; the element index, nor-malised photon source strength and a cumulative energy distri-bution. The normalised photon source strength ( f ) is computedout by MCR2S using Equation 1.
f =VE × NγV
Nγ(1)
Where VE is the volume of the element, NγV is the number ofphotons per cm3 per second for the mesh element and Nγ is thetotal number of photons per second across the entire unstruc-tured mesh.
A VTK output routine, used for visualisation of the results,has also been modified to allow unstructured mesh output. TheVTK output routine outputs the node coordinates, element-noderelationships and activity, contact dose rate and decay heat datain a cell-based format; this can be plotted directly in visualisa-tion programs such as VISIT or paraview.
2.3. MCNP6 Unstructured Mesh Source RoutineIn order to be able to use the unstructured mesh shutdown
photon source file for a shutdown dose rate calculation inMCNP6, an unstructured mesh source reader routine has been
written. The source routine is compiled along with MCNP6 andis activated by the use of the IDUM card [1] in the MCNP inputfile.
A flow diagram showing the process carried out by theMCNP6 unstructured mesh source routine is shown in Figure2.
Figure 2: Flow Chart of MCNP6 Unstructured Mesh SourceRoutine
The new source routine reads in the data from the shutdownphoton source file the first time MCNP creates a source particle.The data is then held in arrays for subsequent source particles.
In order to sample the starting location of a particle a randomnumber is generated. This random number is used to pick amesh element with equal probability. The MCNP6 routines forstarting a particle in a given element are then utilised. Theseroutines set up a bounding rectangular box around the element,and then randomly sample a point in the bounding box and per-form a check to determine whether this location is inside theelement. The position within the bounding box is randomly re-sampled until a point with the element is selected.
The weight of the particle is set based on the normalisednumber of source photons in the selected element multipliedby the number of elements, as shown in Equation 2. The mul-tiplication by the number of mesh elements is required to re-normalise the weight (w) to the number of mesh elements.
w = f × NE (2)
Where NE is the total number of elements in the unstructuredmesh.
By normalising the weight of the particles by the number ofelements, the average weight of the source particles is set to 1.
3
The energy of the starting photon is sampled using the cu-mulative distribution for the selected element in the source file.This distribution allows an energy bin from a 24 group energystructure to be selected. The energy is then picked randomlywithin this energy bin.
All particles are started with a random direction vector.
3. MCR2S Unstructured Mesh Testing
In order to ensure the new MCR2S unstructured mesh rou-tines and gamma source reader perform correctly, comparisonswere undertaken for three models of increasing complexity.
1. A model of a sphere has been created and meshed usingtetrahedral elements. In order to compare results, an iden-tical CSG model was created with a superimposed rectan-gular mesh.
2. A second, slightly more complex model, was then createdof the ’ITER port plug benchmark’. This geometry wasmeshed using hexahedral elements. CSG results are al-ready available from previous analysis [12] for compari-son.
3. A third, more complex model, has also been meshed. Thisis based on the DEMO HCLL CAD model created by KIT[13]. This model has previously been used as a shutdowndose rate benchmark and therefore already has CSG resultsavailable.
3.1. Sphere Model
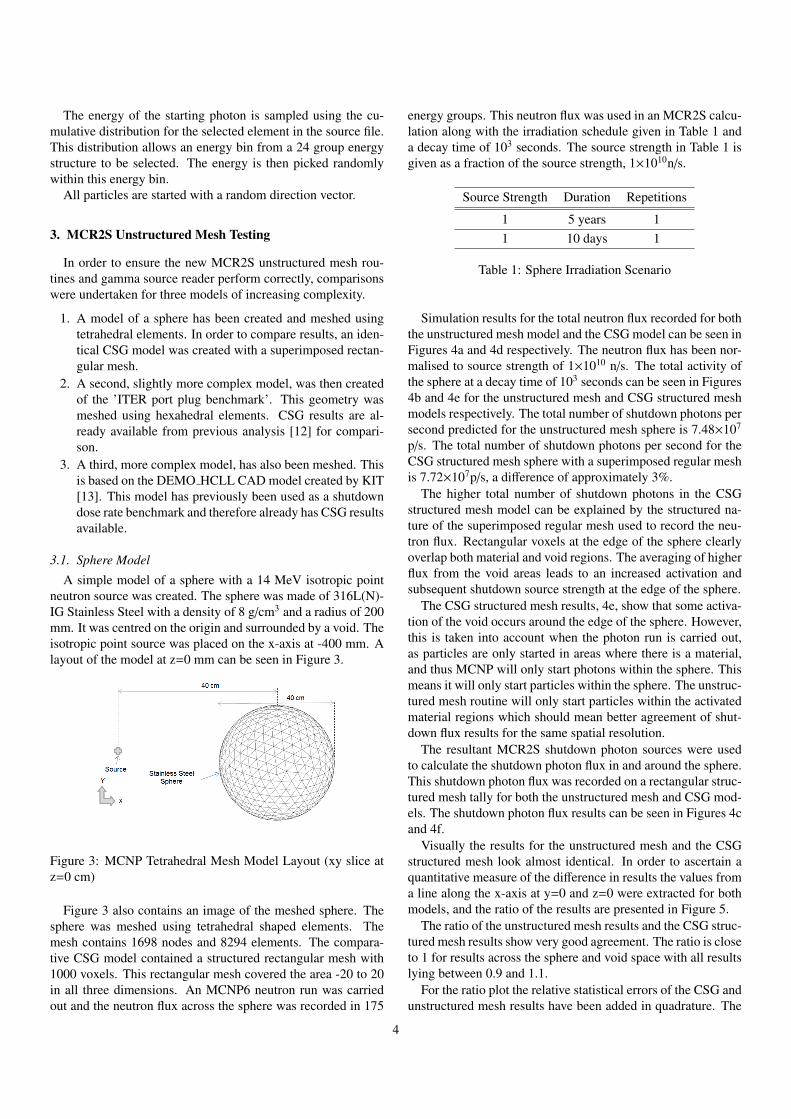
A simple model of a sphere with a 14 MeV isotropic pointneutron source was created. The sphere was made of 316L(N)-IG Stainless Steel with a density of 8 g/cm3 and a radius of 200mm. It was centred on the origin and surrounded by a void. Theisotropic point source was placed on the x-axis at -400 mm. Alayout of the model at z=0 mm can be seen in Figure 3.
Figure 3: MCNP Tetrahedral Mesh Model Layout (xy slice atz=0 cm)
Figure 3 also contains an image of the meshed sphere. Thesphere was meshed using tetrahedral shaped elements. Themesh contains 1698 nodes and 8294 elements. The compara-tive CSG model contained a structured rectangular mesh with1000 voxels. This rectangular mesh covered the area -20 to 20in all three dimensions. An MCNP6 neutron run was carriedout and the neutron flux across the sphere was recorded in 175
energy groups. This neutron flux was used in an MCR2S calcu-lation along with the irradiation schedule given in Table 1 anda decay time of 103 seconds. The source strength in Table 1 isgiven as a fraction of the source strength, 1×10¹⁰n/s.
Source Strength Duration Repetitions
1 5 years 11 10 days 1
Table 1: Sphere Irradiation Scenario
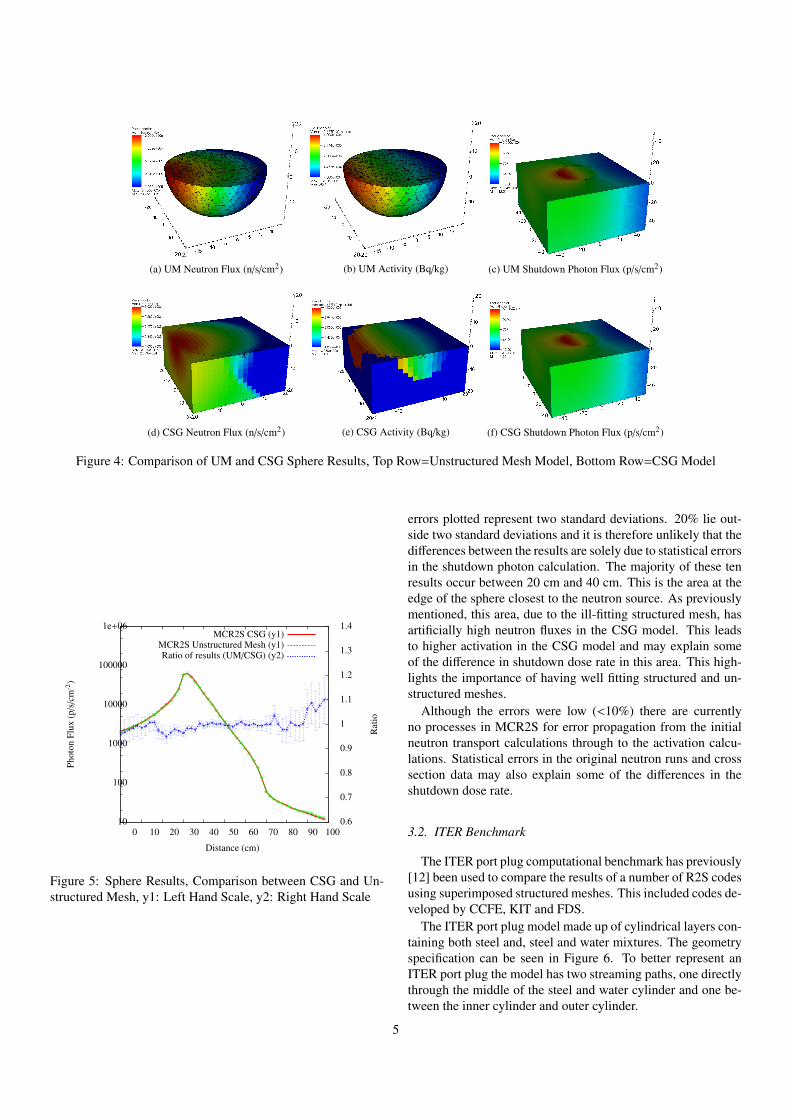
Simulation results for the total neutron flux recorded for boththe unstructured mesh model and the CSG model can be seen inFigures 4a and 4d respectively. The neutron flux has been nor-malised to source strength of 1×10¹⁰ n/s. The total activity ofthe sphere at a decay time of 103 seconds can be seen in Figures4b and 4e for the unstructured mesh and CSG structured meshmodels respectively. The total number of shutdown photons persecond predicted for the unstructured mesh sphere is 7.48×10⁷
p/s. The total number of shutdown photons per second for theCSG structured mesh sphere with a superimposed regular meshis 7.72×10⁷p/s, a difference of approximately 3%.
The higher total number of shutdown photons in the CSGstructured mesh model can be explained by the structured na-ture of the superimposed regular mesh used to record the neu-tron flux. Rectangular voxels at the edge of the sphere clearlyoverlap both material and void regions. The averaging of higherflux from the void areas leads to an increased activation andsubsequent shutdown source strength at the edge of the sphere.
The CSG structured mesh results, 4e, show that some activa-tion of the void occurs around the edge of the sphere. However,this is taken into account when the photon run is carried out,as particles are only started in areas where there is a material,and thus MCNP will only start photons within the sphere. Thismeans it will only start particles within the sphere. The unstruc-tured mesh routine will only start particles within the activatedmaterial regions which should mean better agreement of shut-down flux results for the same spatial resolution.
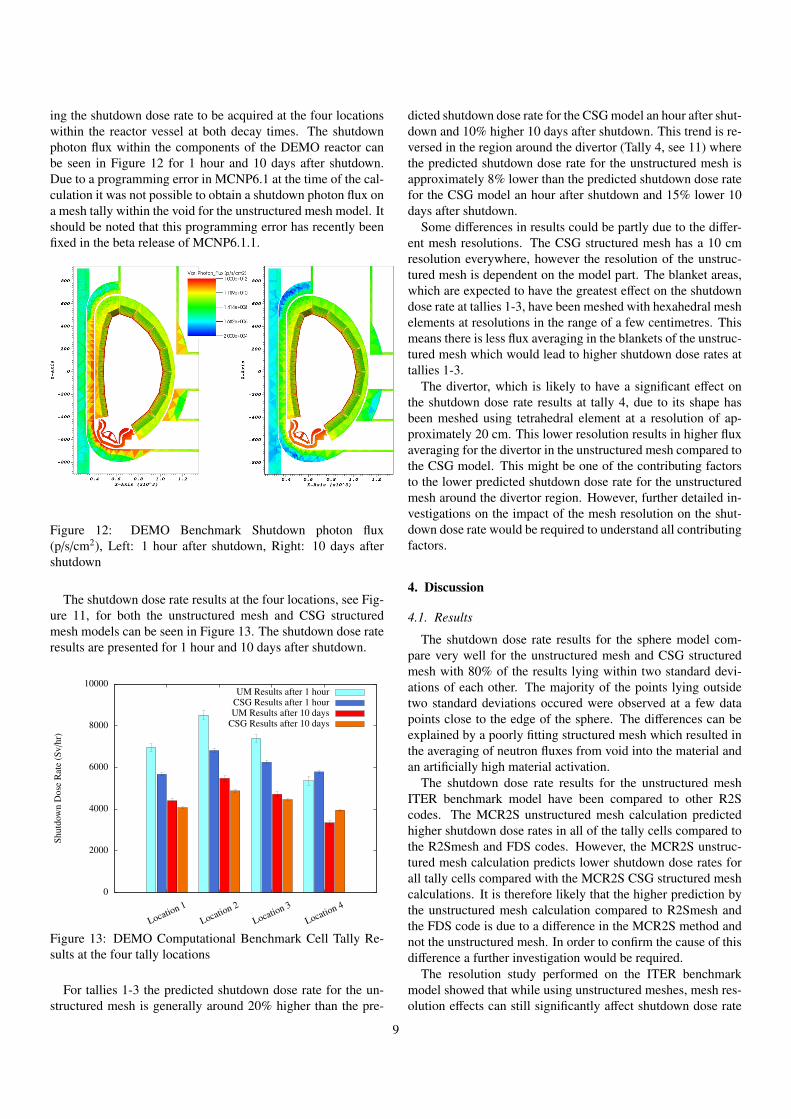
The resultant MCR2S shutdown photon sources were usedto calculate the shutdown photon flux in and around the sphere.This shutdown photon flux was recorded on a rectangular struc-tured mesh tally for both the unstructured mesh and CSG mod-els. The shutdown photon flux results can be seen in Figures 4cand 4f.
Visually the results for the unstructured mesh and the CSGstructured mesh look almost identical. In order to ascertain aquantitative measure of the difference in results the values froma line along the x-axis at y=0 and z=0 were extracted for bothmodels, and the ratio of the results are presented in Figure 5.
The ratio of the unstructured mesh results and the CSG struc-tured mesh results show very good agreement. The ratio is closeto 1 for results across the sphere and void space with all resultslying between 0.9 and 1.1.
For the ratio plot the relative statistical errors of the CSG andunstructured mesh results have been added in quadrature. The
4
(a) UM Neutron Flux (n/s/cm2) (b) UM Activity (Bq/kg) (c) UM Shutdown Photon Flux (p/s/cm2)
(d) CSG Neutron Flux (n/s/cm2) (e) CSG Activity (Bq/kg) (f) CSG Shutdown Photon Flux (p/s/cm2)
Figure 4: Comparison of UM and CSG Sphere Results, Top Row=Unstructured Mesh Model, Bottom Row=CSG Model
10
100
1000
10000
100000
1e+06
0 10 20 30 40 50 60 70 80 90 1000.6
0.7
0.8
0.9
1
1.1
1.2
1.3
1.4
Phot
onFl
ux(p
/s/c
m-2
)
Rat
io
Distance (cm)
MCR2S CSG (y1)MCR2S Unstructured Mesh (y1)Ratio of results (UM/CSG) (y2)
Figure 5: Sphere Results, Comparison between CSG and Un-structured Mesh, y1: Left Hand Scale, y2: Right Hand Scale
errors plotted represent two standard deviations. 20% lie out-side two standard deviations and it is therefore unlikely that thedifferences between the results are solely due to statistical errorsin the shutdown photon calculation. The majority of these tenresults occur between 20 cm and 40 cm. This is the area at theedge of the sphere closest to the neutron source. As previouslymentioned, this area, due to the ill-fitting structured mesh, hasartificially high neutron fluxes in the CSG model. This leadsto higher activation in the CSG model and may explain someof the difference in shutdown dose rate in this area. This high-lights the importance of having well fitting structured and un-structured meshes.
Although the errors were low (<10%) there are currentlyno processes in MCR2S for error propagation from the initialneutron transport calculations through to the activation calcu-lations. Statistical errors in the original neutron runs and crosssection data may also explain some of the differences in theshutdown dose rate.
3.2. ITER Benchmark
The ITER port plug computational benchmark has previously[12] been used to compare the results of a number of R2S codesusing superimposed structured meshes. This included codes de-veloped by CCFE, KIT and FDS.
The ITER port plug model made up of cylindrical layers con-taining both steel and, steel and water mixtures. The geometryspecification can be seen in Figure 6. To better represent anITER port plug the model has two streaming paths, one directlythrough the middle of the steel and water cylinder and one be-tween the inner cylinder and outer cylinder.
5

Figure 6: ITER Benchmark Configuration [12]
Material definitions used were as per those specified in theITER port plug benchmark [12]. Cell tallies were defined inthe void to record the resulting shutdown dose rate, consistingof concentric cylinders with radii of r<30 cm, 30 cm<r<45 cmand 45 cm<r<60 cm.
Since the benchmark geometry was defined only with anMCNP model, a matching CAD model of the solids meetingthe requirements of the reference design was created in Cubit.The CAD model was meshed using hexahedral elements. Animage of the unstructured mesh can be seen in Figure 7. The
(a) Full mesh (b) Clip along the cylindrical axis
Figure 7: ITER Benchmark Hexahedral Mesh, scale in cm
hexahedral mesh has 65520 nodes and 56757 elements. Thisresults in a reasonably fine mesh with an approximate resolu-tion of about 6cm, the streaming paths are still clearly visibleand all have relatively smooth edges.
An isotropic 14 MeV neutron source was defined with a ra-dius of 100 cm and a thickness at 10 cm; located 100 cm fromthe front edge of the port plug and with a source strength of2.0×1019 n/s.
A neutron transport calculation was performed to ascertainthe neutron flux throughout the unstructured mesh in 175 en-ergy groups. In order to improve computational efficiency,source biasing and particle splitting/rouletting [1] variance re-
duction techniques were employed. The results for the totalneutron flux can be seen in Figure 8a.
Small streaming paths between the central steel-water cylin-der and the outer steel cylinder can be seen to slightly increasethe dose rate in the surrounding material. There is also a slightelevation in neutron flux in the centre of the rear plate due tothe steaming path down the centre of the central steel and watercylinder.
MCR2S was used to calculate the activity and shutdown pho-ton source. Along with the neutron flux and material informa-tion, this calculation used the irradiation schedule given in Ta-ble 2. The irradiation schedule is given as a normalised sourcestrength with 1 reflecting the full source strength of 2.0×10¹⁹
n/s.
Source Strength Duration Repetitions
5.36×10⁻³ 2 years 14.13×10⁻² 10 years 1
0.00 0.667 years 18.30×10⁻² 2 years 1
0.00 3920 sec17
1.00 400 sec0.00 3920 sec
41.40 400 sec
Table 2: ITER computational benchmark irradiation scenario
The specific activity of the ITER computational benchmarkat a time of 106 s after the end of the irradiation can be seenin Figure 8b. Using the shutdown photon source calculated byMCR2S a photon transport calculation was carried out. Theshutdown photon flux within the unstructured mesh can be seenin Figure 8c and results for the shutdown dose rate in the celltallies at the end of the port plug can be seen in Figure 9. Theseare plotted alongside results from existing R2S codes using su-perimposed structured mesh tallies and a MCR2S CSG struc-tured mesh calculation using the latest version of MCR2S. TheR2S codes used for comparison are R2Smesh developed by KITand the R2S tool developed by FDS [12].
The shutdown dose rate results from the tally cells for boththe unstructured mesh and structured mesh MCR2S calcula-tions appear to be higher than the results for the other R2Scodes. The difference between the results for the MCR2S un-structured mesh calculation and the MCR2S structured meshcalculation range between 5% and 30% with the unstructuredmesh predicting lower shutdown dose rates for all tallies.
The unstructured mesh shutdown dose rates are approxi-mately 15% higher than the results from the KIT R2Smesh forall of the tally cells and approximately 24% higher than the FDSresults.
As with a superimposed structured mesh R2S approach theresolution of the voxels/elements will affect the predicted shut-down dose rate result. For unstructured meshes larger elementsresult in greater flux averaging in areas with a high flux gradi-
6

(a) Neutron Flux (n/s/cm2) (b) Activation (Bq/kg) (c) Shutdown Photon Flux (p/s/cm2)
Figure 8: ITER computational benchmark results clipped through the centre line of the port plug
0
0.005
0.01
0.015
0.02
<15 cm15<r<30 cm
30<r<45 cm
45<r<60 cm
Shut
dow
nD
ose
Rat
e(S
v/hr
)
MCR2S Unstructured MeshMCR2S CSG
R2SmeshFDS R2S Method
Figure 9: ITER Computational Benchmark Cell Tally ResultsComparison
ent. The averaging of fluxes in this way can result in over- orunder-prediction of the shutdown dose rate levels; dependingon the location relative to the flux gradient. As the size of theunstructured mesh elements are reduced the flux averaging isreduced and therefore its impact on the shutdown photon flux isalso reduced.
In order to study the effect of unstructured mesh resolutionon the shutdown dose rate for the ITER computational bench-mark several models of the port plug were created with varyingnumbers of mesh elements. The models have been meshed us-ing an adaptive algorithm to try to model the geometry morefaithfully. Adaptive meshing allows for refinement of the meshin certain regions such as curved surfaces. This allows for abetter representation of the geometry for a given number of el-ements. All models were meshed using hexahedral elements.The number of elements used for each model can be seen inTable 3. All other aspects of the models were kept the same.
Each model was run through the MCR2S process to ascertainthe shutdown dose rate in the tally cells at the rear of the port
Model Number Number of Mesh Elements
1 49592 72303 233964 56757
Table 3: ITER Computational Benchmark Mesh Resolution
plug. The results for each model can be seen in Figure 10.
0
0.002
0.004
0.006
0.008
0.01
0.012
0.014
0.016
0.018
<15 cm15<r<30 cm
30<r<45 cm
45<r<60 cm
60<r<100 cm
Shut
dow
nD
ose
Rat
e(S
v/hr
)
Model 1 (4959)Model 2 (7230)
Model 3 (23396)Model 4 (56757)
Figure 10: ITER Computational Benchmark Cell Tally ResultsResolution Study
The results show the dose rate at the rear of the port plugincreases as the number of elements increase. It can also beseen that the shutdown dose rate results seem to be convergingas the number of elements is increased. Increasing the numberof elements above 56,757 is expected to lead to a convergedshutdown dose rate as the flux averaging in the elements tendsto zero.
7

3.3. DEMO Computational Benchmark
A more complex shutdown dose rate computational bench-mark, based on a 11.25◦sector of the concept design for theDEMOnstration (DEMO) fusion reactor, was also been carriedout using unstructured mesh geometry. A similar benchmarkexercise has previously been carried out using superimposedstructured meshes [13] on a MCNP CSG model to calculate theshutdown dose rate at four locations within the reactor vessel atdecay times of 1 hour and 10 days after shutdown.
While previous benchmark results are available using theDEMO MCNP model, differences between the available CADand MCNP models, such as the addition of first wall armourand torodial field coil casing, meant that a direct comparisonwas not appropriate. In addition only a sub-set of DEMO com-ponents had been activated, a feature which is not yet availablein the MCR2S unstructured mesh implementation. Instead twocalculations using MCR2S have been carried out; one usingCSG and a superimposed structured mesh, and the other us-ing an unstructured mesh. The MCNP CSG model used in theprevious studies was modified to match the CAD model by re-moval of the first wall armour and the toroidal field coil casing.A superimposed structured mesh was placed over the entire ge-ometry at a resolution of 10 cm. The same material definitions,irradiation schedule and decay schedule were used for both theunstructured mesh and CSG structured mesh calculations.
The DEMO model is made up of a number of parts contain-ing several materials. The materials used in the study are listedin Table 4. The unstructured mesh was created by meshing theparts of the demo model individually. This allowed flexibilityin the number of elements required for each part. Parts such asthe blankets, first wall and divertor, which will have the largestinfluence on the shutdown dose rate in the reactor vessel, havebeen meshed relatively finely (between a resolution of 2cm and20cm). In order to reduce the number of elements in the modeland aid in speeding up the calculation, parts which are posi-tioned away from the plasma, and therefore less likely to have asignificant impact on the shutdown dose rate in the reactor ves-sel, have been meshed coarsely with resolutions in the order ofmetres. The unstructured mesh geometry for the 11.25◦sectorof DEMO can be seen in Figure 11, along with the originalCAD and the in vessel shutdown dose rate tally locations.
Material Reactor Component
Eurofer Steel Blanket Encasing, divertorand ports
Lithium Lead Breeder Blanket MaterialNiobium-Tin Magnetic Coils
Water, Stainless Steel,Eurofer and boron mixture
Vacuum Vessel
Lithium Lead, Euroferand helium mixture
Manifold blankets
Table 4: DEMO Model Materials
(a) DEMO CAD Model (b) DEMO Unstructured Mesh
Figure 11: a) The DEMO CAD model showing the shutdowndose rate tally locations within the vessel and b) the correspond-ing unstructured mesh.
The DEMO unstructured mesh contains 733,813 elements,with a mixture of first order tetrahedra, pentahedra and hexa-hedra. The majority of these elements have been used in themeshing of the blanket and first wall modules which will havethe greatest effect on the shutdown dose rates in the reactor ves-sel.
A 14 MeV parametric plasma neutron source has been usedfor both the unstructured mesh and CSG models. For both theunstructured mesh and superimposed structured mesh the neu-tron flux was recorded over the entire geometry. MCR2S wasused to calculate the activity and shutdown photon source foreach element/voxel in each mesh. Unlike the previous DEMObenchmark comparison [13], where only the blanket and diver-tor were irradiated, due to current limitations in the unstructuredmesh MCR2S routines full model activation had to be carriedout. This also means that all components have to be irradiatedwith the same schedule which does not allow for replacement ofcomponents to occur at different times. It was therefore decidedto base the irradiation schedule for the models on the irradiationseen by a blanket module; assumed to be replaced every 8 yearsin the final phase of DEMO. The irradiation schedule used byMCR2S for all components is given in Table 5.
Source Strength Duration Repetitions
0.5 7.9 years 11.0 0.5 days
600.0 0.5 days
Table 5: DEMO Computational Benchmark Irradiation Sched-ule
The activity and shutdown photon sources were acquired1 hour and 10 days after shutdown. Both shutdown photonsources were then used in photon transport calculations, allow-
8
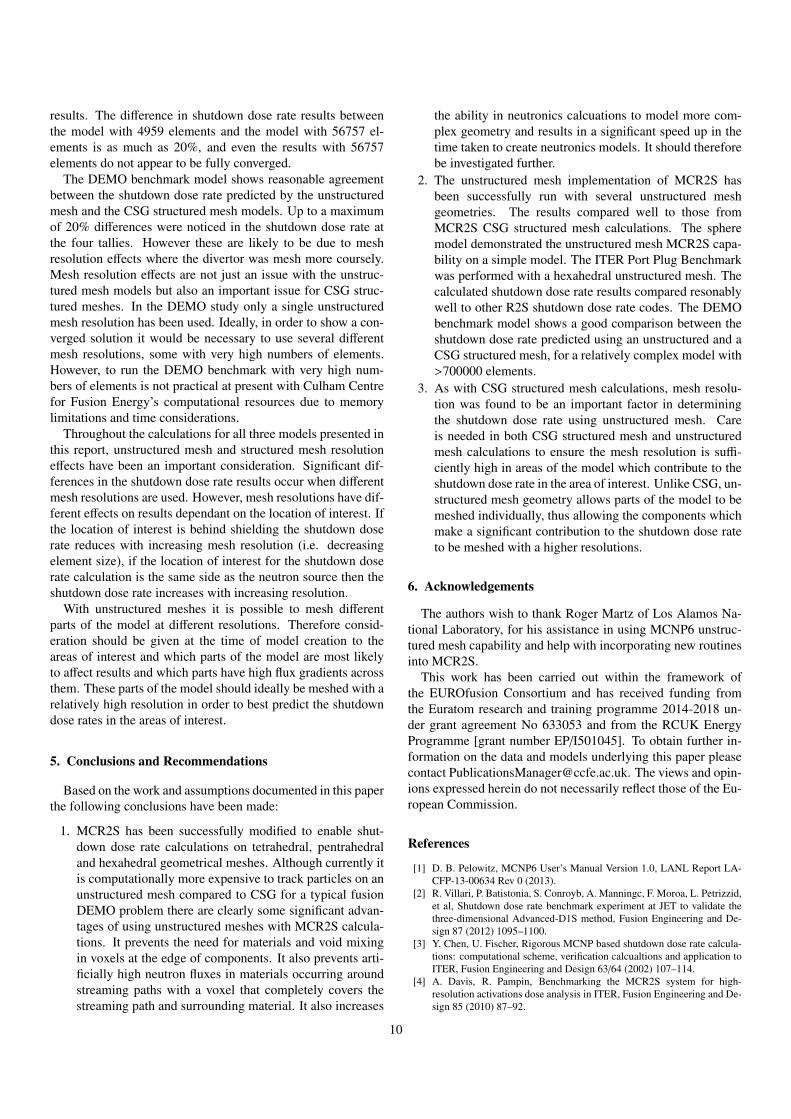
ing the shutdown dose rate to be acquired at the four locationswithin the reactor vessel at both decay times. The shutdownphoton flux within the components of the DEMO reactor canbe seen in Figure 12 for 1 hour and 10 days after shutdown.Due to a programming error in MCNP6.1 at the time of the cal-culation it was not possible to obtain a shutdown photon flux ona mesh tally within the void for the unstructured mesh model. Itshould be noted that this programming error has recently beenfixed in the beta release of MCNP6.1.1.
Figure 12: DEMO Benchmark Shutdown photon flux(p/s/cm2), Left: 1 hour after shutdown, Right: 10 days aftershutdown
The shutdown dose rate results at the four locations, see Fig-ure 11, for both the unstructured mesh and CSG structuredmesh models can be seen in Figure 13. The shutdown dose rateresults are presented for 1 hour and 10 days after shutdown.
0
2000
4000
6000
8000
10000
Location 1
Location 2
Location 3
Location 4
Shut
dow
nD
ose
Rat
e(S
v/hr
)
UM Results after 1 hourCSG Results after 1 hourUM Results after 10 days
CSG Results after 10 days
Figure 13: DEMO Computational Benchmark Cell Tally Re-sults at the four tally locations
For tallies 1-3 the predicted shutdown dose rate for the un-structured mesh is generally around 20% higher than the pre-
dicted shutdown dose rate for the CSG model an hour after shut-down and 10% higher 10 days after shutdown. This trend is re-versed in the region around the divertor (Tally 4, see 11) wherethe predicted shutdown dose rate for the unstructured mesh isapproximately 8% lower than the predicted shutdown dose ratefor the CSG model an hour after shutdown and 15% lower 10days after shutdown.
Some differences in results could be partly due to the differ-ent mesh resolutions. The CSG structured mesh has a 10 cmresolution everywhere, however the resolution of the unstruc-tured mesh is dependent on the model part. The blanket areas,which are expected to have the greatest effect on the shutdowndose rate at tallies 1-3, have been meshed with hexahedral meshelements at resolutions in the range of a few centimetres. Thismeans there is less flux averaging in the blankets of the unstruc-tured mesh which would lead to higher shutdown dose rates attallies 1-3.
The divertor, which is likely to have a significant effect onthe shutdown dose rate results at tally 4, due to its shape hasbeen meshed using tetrahedral element at a resolution of ap-proximately 20 cm. This lower resolution results in higher fluxaveraging for the divertor in the unstructured mesh compared tothe CSG model. This might be one of the contributing factorsto the lower predicted shutdown dose rate for the unstructuredmesh around the divertor region. However, further detailed in-vestigations on the impact of the mesh resolution on the shut-down dose rate would be required to understand all contributingfactors.
4. Discussion
4.1. Results
The shutdown dose rate results for the sphere model com-pare very well for the unstructured mesh and CSG structuredmesh with 80% of the results lying within two standard devi-ations of each other. The majority of the points lying outsidetwo standard deviations occured were observed at a few datapoints close to the edge of the sphere. The differences can beexplained by a poorly fitting structured mesh which resulted inthe averaging of neutron fluxes from void into the material andan artificially high material activation.
The shutdown dose rate results for the unstructured meshITER benchmark model have been compared to other R2Scodes. The MCR2S unstructured mesh calculation predictedhigher shutdown dose rates in all of the tally cells compared tothe R2Smesh and FDS codes. However, the MCR2S unstruc-tured mesh calculation predicts lower shutdown dose rates forall tally cells compared with the MCR2S CSG structured meshcalculations. It is therefore likely that the higher prediction bythe unstructured mesh calculation compared to R2Smesh andthe FDS code is due to a difference in the MCR2S method andnot the unstructured mesh. In order to confirm the cause of thisdifference a further investigation would be required.
The resolution study performed on the ITER benchmarkmodel showed that while using unstructured meshes, mesh res-olution effects can still significantly affect shutdown dose rate
9
results. The difference in shutdown dose rate results betweenthe model with 4959 elements and the model with 56757 el-ements is as much as 20%, and even the results with 56757elements do not appear to be fully converged.
The DEMO benchmark model shows reasonable agreementbetween the shutdown dose rate predicted by the unstructuredmesh and the CSG structured mesh models. Up to a maximumof 20% differences were noticed in the shutdown dose rate atthe four tallies. However these are likely to be due to meshresolution effects where the divertor was mesh more coursely.Mesh resolution effects are not just an issue with the unstruc-tured mesh models but also an important issue for CSG struc-tured meshes. In the DEMO study only a single unstructuredmesh resolution has been used. Ideally, in order to show a con-verged solution it would be necessary to use several differentmesh resolutions, some with very high numbers of elements.However, to run the DEMO benchmark with very high num-bers of elements is not practical at present with Culham Centrefor Fusion Energy’s computational resources due to memorylimitations and time considerations.
Throughout the calculations for all three models presented inthis report, unstructured mesh and structured mesh resolutioneffects have been an important consideration. Significant dif-ferences in the shutdown dose rate results occur when differentmesh resolutions are used. However, mesh resolutions have dif-ferent effects on results dependant on the location of interest. Ifthe location of interest is behind shielding the shutdown doserate reduces with increasing mesh resolution (i.e. decreasingelement size), if the location of interest for the shutdown doserate calculation is the same side as the neutron source then theshutdown dose rate increases with increasing resolution.
With unstructured meshes it is possible to mesh differentparts of the model at different resolutions. Therefore consid-eration should be given at the time of model creation to theareas of interest and which parts of the model are most likelyto affect results and which parts have high flux gradients acrossthem. These parts of the model should ideally be meshed with arelatively high resolution in order to best predict the shutdowndose rates in the areas of interest.
5. Conclusions and Recommendations
Based on the work and assumptions documented in this paperthe following conclusions have been made:
1. MCR2S has been successfully modified to enable shut-down dose rate calculations on tetrahedral, pentrahedraland hexahedral geometrical meshes. Although currently itis computationally more expensive to track particles on anunstructured mesh compared to CSG for a typical fusionDEMO problem there are clearly some significant advan-tages of using unstructured meshes with MCR2S calcula-tions. It prevents the need for materials and void mixingin voxels at the edge of components. It also prevents arti-ficially high neutron fluxes in materials occurring aroundstreaming paths with a voxel that completely covers thestreaming path and surrounding material. It also increases
the ability in neutronics calcuations to model more com-plex geometry and results in a significant speed up in thetime taken to create neutronics models. It should thereforebe investigated further.
2. The unstructured mesh implementation of MCR2S hasbeen successfully run with several unstructured meshgeometries. The results compared well to those fromMCR2S CSG structured mesh calculations. The spheremodel demonstrated the unstructured mesh MCR2S capa-bility on a simple model. The ITER Port Plug Benchmarkwas performed with a hexahedral unstructured mesh. Thecalculated shutdown dose rate results compared resonablywell to other R2S shutdown dose rate codes. The DEMObenchmark model shows a good comparison between theshutdown dose rate predicted using an unstructured and aCSG structured mesh, for a relatively complex model with>700000 elements.
3. As with CSG structured mesh calculations, mesh resolu-tion was found to be an important factor in determiningthe shutdown dose rate using unstructured mesh. Careis needed in both CSG structured mesh and unstructuredmesh calculations to ensure the mesh resolution is suffi-ciently high in areas of the model which contribute to theshutdown dose rate in the area of interest. Unlike CSG, un-structured mesh geometry allows parts of the model to bemeshed individually, thus allowing the components whichmake a significant contribution to the shutdown dose rateto be meshed with a higher resolutions.
6. Acknowledgements
The authors wish to thank Roger Martz of Los Alamos Na-tional Laboratory, for his assistance in using MCNP6 unstruc-tured mesh capability and help with incorporating new routinesinto MCR2S.
This work has been carried out within the framework ofthe EUROfusion Consortium and has received funding fromthe Euratom research and training programme 2014-2018 un-der grant agreement No 633053 and from the RCUK EnergyProgramme [grant number EP/I501045]. To obtain further in-formation on the data and models underlying this paper pleasecontact [email protected]. The views and opin-ions expressed herein do not necessarily reflect those of the Eu-ropean Commission.
References
[1] D. B. Pelowitz, MCNP6 User’s Manual Version 1.0, LANL Report LA-CFP-13-00634 Rev 0 (2013).
[2] R. Villari, P. Batistonia, S. Conroyb, A. Manningc, F. Moroa, L. Petrizzid,et al, Shutdown dose rate benchmark experiment at JET to validate thethree-dimensional Advanced-D1S method, Fusion Engineering and De-sign 87 (2012) 1095–1100.
[3] Y. Chen, U. Fischer, Rigorous MCNP based shutdown dose rate calcula-tions: computational scheme, verification calcualtions and application toITER, Fusion Engineering and Design 63/64 (2002) 107–114.
[4] A. Davis, R. Pampin, Benchmarking the MCR2S system for high-resolution activations dose analysis in ITER, Fusion Engineering and De-sign 85 (2010) 87–92.
10

[5] J.-C. Sublet, J. Eastwood, J. Morgan, The FISPACT-II user manual,CCFE-R (11) 11.
[6] ABAQUS (2011) ‘ABAQUS Documentation’, Dassault Systmes, Provi-dence, RI, USA. .
[7] ANSYS R©, Academic Research, Release 15.0, Help System, MeshingUser’s Guide, ANSYS, Inc.
[8] CUBIT 14.1 ‘User Documentation’, Sandia National Laboratories, Cali-fornia, USA. .
[9] R. L. Martz, The MCNP6 Book On Unstructured Mesh Geometry: User’sGuide, LANL Report LA-UR-11-05668 Rev 7 (2013).
[10] R. A. Forest, J. Kopecky, J.-C. Sublet, EAF 2007 neutron-induced crosssection library, UKAEA FUS 535 Report.
[11] J.-C. Sublet, L. Packer, J. Kopecky, R. A. Forest, A. Koning, D. Rochman,EAF 2010 neutron-induced cross section library, CCFE-R (10) 05.
[12] M. Loughlin, Conclusions of shutdown dose rate benchmark study, IDMNumber: 6593RF v1.0, 6th ITER Neutronics Meeting, Hefei, China.
[13] U. Fischer, C. Bachmann, B. B. J. C. K. Drozdowicz, D. Dworak, et al,Neutronic analyses and tools development efforts in the european DEMOprogramme, Fusion Engineering and Design 89 (2014) 1880–1884.
11