mdot michigan passenger rail station community benefits study
TRANSCRIPT

Michigan Passenger Rail Station
Community Benefits Study
Prepared for: The Michigan Department of Transportation
by Grand Valley State University
June, 2009
2
This report was prepared for the Michigan Department of Transportation by the Seidman College of Business
Grand Valley State University Grand Rapids, Michigan
Dr. John C. Taylor, Principal Investigator Dr. Hari Singh Dr. Paul Isely
Sub-contractor assistance was provided by JLRoach, Inc.
East Lansing, Michigan James L. Roach, President
Jared H. Becker Terrence Eldred

3
Table of Contents Executive Summary ............................................................................................ 6 1.0 Project Background .................................................................................... 11
1.1 Description and objectives......................................................................... 11 1.2 Types of benefits. ...................................................................................... 12 1.3 Assignment of benefits. ............................................................................. 13 1.4 Other societal benefits. .............................................................................. 14 1.5 Time period representation........................................................................ 14
2.0. Michigan’s Passenger rail System ........................................................... 14 2.1 Overview and history. ................................................................................ 14 2.2 Michigan routes and services. ................................................................... 15 2.3 Ridership trends ........................................................................................ 19
3.0 Michigan’s Amtrak Stations ....................................................................... 20 3.1 Station inventory. ....................................................................................... 22 3.2 Station types. ............................................................................................. 22 3.3 Ownership and management of stations. .................................................. 23 3.4 Survey of community benefits associated with passenger rail service. ..... 23 3.5 Station development perspectives ............................................................. 25 3.6 Impact of potential new services. .............................................................. 26
3.61 Midwest Regional Rail System .................................................................... 26 3.62 Commuter Rail Developments27
4.0 Individual Station Benefits ......................................................................... 28 4.1 Individual traveler benefits. ........................................................................ 28
4.11 Procedure ....................................................................................................... 28 4.12 Results ............................................................................................................ 31
4.2 Local Business Benefits ............................................................................ 31 4.21 Procedure ....................................................................................................... 31 4.23 Results ............................................................................................................ 33
4.3 Benefits from Direct Amtrak Expenditures ................................................. 35 4.31 Procedure ....................................................................................................... 35
4.311 Employee Wages ........................................................................... 36 4.312 Other Amtrak expenditures ............................................................ 36 4.313 Results ........................................................................................... 37
4.4 Local Community Expenditures. ................................................................ 39 4.5 Summary of quantifiable community benefits. ........................................... 39 4.6 Intermodal stations and coordinated Amtrak bus services. ....................... 40 4.7 Benefit estimates for new stations or services ........................................... 42
5.0 Case Studies of Station Development ...................................................... 43 5.1 Dearborn: Relocation to access major attractions .................................... 44 5.2 Birmingham-Troy: A joint community effort in an urban suburb ................ 45

4
5.3 Detroit: Accessibility for the region’s core ................................................. 46 5.4 St. Joseph: A possible tourist destination .................................................. 47 5.5 New Buffalo: A retirement\vacation homes complex ................................. 48 5.6 Kalamazoo: A broad multi-modal network ................................................. 49
6.0 Community Benefits of New Station Development .................................. 50 6.1 Increased employment from station construction. ..................................... 50 6.2 Increased property values. ........................................................................ 50 6.3 New development of adjacent land. .......................................................... 51 6.4 Increases to the local tax base. ................................................................. 51 6.5 Factors affecting development: ................................................................. 51
6.51 Overall regional economic strategy ............................................................ 52 6.52 Surrounding land use. .................................................................................. 52 6.53 Frequency of passenger rail service. ......................................................... 52 6.54 Access to the station. .................................................................................... 53
7.0 Literature Review of Economic Impacts ................................................... 53 7.1 Lessons from Major Transit Oriented Development (TOD) ....................... 54 7.2 Policy Implications and lessons of the TRB report .................................... 56 7.3 APTA report about economic impact ......................................................... 58 7.4 Community Impact Studies (CIS) .............................................................. 59 7.5 Implication of previous empirical investigations ......................................... 62
8.0 Appendices ................................................................................................. 64 8.1 Station development perspectives ............................................................ 65 8.2 Integration with MDOT’s Transportation Management System (TMS) ...... 87 8.3 Induced multiplier effects of Amtrak Station related expenditures ............. 88 8.4 Local Community Survey Form ................................................................ 92 8.5 Notes from Table 4.2 ................................................................................. 94 8.6 Statewide Community Benefit Summary Table ......................................... 95 8.7 Individual Community Benefit Sheets ........................................................ 96
Wolverine Corridor: Albion ....................................................................................................... 96 Ann Arbor ................................................................................................. 97 Battle Creek ............................................................................................. 98 Birmingham .............................................................................................. 99 Dearborn ................................................................................................ 100 Detroit .................................................................................................... 101 Dowagiac ............................................................................................... 102 Jackson .................................................................................................. 103 Kalamazoo ............................................................................................. 104 Niles ....................................................................................................... 105 Pontiac ................................................................................................... 106 Royal Oak .............................................................................................. 107 Pere Marquette Corridor: Bangor.................................................................................................... 108 Grand Rapids ......................................................................................... 109 Holland ................................................................................................... 110

5
New Buffalo ............................................................................................ 111 St. Joseph .............................................................................................. 112 Blue Water Corridor: Durand ................................................................................................... 113 Flint ........................................................................................................ 114 Lansing................................................................................................... 115 Lapeer .................................................................................................... 116 Port Huron .............................................................................................. 117
6
Michigan Passenger Rail Station Community Benefits Study
Executive Summary Passenger rail service is perceived to provide important benefits to Michigan communities. The extent of these benefits has never been quantified in a systematic way and, in 2008, the Michigan Department of Transportation (MDOT) contracted with Grand Valley State University to perform a broad based assessment of the community level benefits of passenger rail service. The main objective of the research project has been to estimate the full range of these benefits at the community level. It is understood that passenger rail services provide important additional benefits to the state and the region in terms of congestion relief, safety, air quality improvement, and energy conservation. These benefits are discussed in the report but statewide or regional benefits are not quantified. The research included a literature survey of other related studies to assess methodological implications for this project. Conclusions derived were that: benefits are sensitive to ridership activity (which is in turn influenced by service offerings); regional economic data should be used where possible; benefits of foregone travel should be estimated; long term benefits are contingent on local and regional development plans; and, projected benefits represent only estimates at a point in time subject to changing demographics, the economic profiles of different regions and the cost structure of competing forms of transportation. It is important to recognize that Michigan communities receive only low or medium frequency levels of passenger rail service. Eleven of Michigan’s 22 station communities have only a single daily round trip while the other half have from two to four daily round trips. These levels of service should not be expected to generate the kinds of economic impacts experienced by communities served by commuter rail, light rail, or heavy rail systems with hourly or more frequent service throughout the day. That said, existing Amtrak services to Michigan communities have been found to generate significant benefits and these benefits can be meaningfully quantified. The National Railroad Passenger Corporation, operating under the Amtrak name, has since 1971, been the sole provider of intercity passenger rail service in Michigan. These services are provided to Michigan stations located on three corridors…
o The Wolverine Corridor between Pontiac, Detroit and Chicago o The Blue Water Corridor between Port Huron and Chicago o The Pere Marquette Corridor between Grand Rapids and Chicago.

7
Ridership on these services has grown by over 50% thus far this decade—from 457,000 passengers in the year 2000 to 724,000 passengers in 2008. The 22 stations vary greatly in terms of ownership, age, architecture, staffing, and operation. They range from simple bus stop type shelters to historic restored depots to relatively modern buildings. Only ten of the stations are staffed with Amtrak station agents. Passengers boarding at other locations must purchase their ticket from a ticket machine, travel agent, Amtrak’s web site, or from the conductor on the train. Thirteen of the stations are city owned, five are Amtrak owned, one each are owned by a local transit agency, Michigan State University, MDOT and a private owner. Operating responsibilities lie with cities, transit agencies, Amtrak, civic organizations or a mix of any of these organizations. There is no common model. The principal objective of this research was to determine the benefits of passenger rail service to a local community. As such, a unique “Community Benefits Summary Sheet” was prepared for each station community. This Excel spreadsheet approach utilized information from MDOT’s Transportation Management System (TMS). The spreadsheet is easily updatable and could possibly be directly integrated with the TMS system. Benefits may be classified into the following categories:
a. Individual traveler benefits. Passenger trains offer an economical mode of transportation that is usually less expensive than flying or driving. This task compared existing passenger rail costs to costs that would be incurred if there were no passenger rail service in a community and alternative modes were used (or, alternately the trip was foregone). Ridership information was first obtained for each station from MDOT’s Transportation Management System. The second step was to determine whether these travelers would make the trip in the absence of Amtrak service, and, if so, what mode would they use (auto, bus or plane). The 2007 MDOT/University of Michigan on-board survey was used for this purpose. The third step was to determine the costs of alternative mode travel. This was done primarily by internet searches of bus and airline fares assuming a 14-day advance purchase of a round trip ticket on a non-peak travel day. Costs for auto drivers was assumed to be the first half of 2008, IRS rate of $.505 per mile divided by auto occupancy of about 1.8 persons (occupancy levels varied somewhat from corridor to corridor). This information was compiled for all major travel pairs for each station. Total statewide traveler savings were calculated as $20.0 million for those individuals who used Amtrak instead of other modes of transportation. An estimate of the economic benefit of Amtrak service for passengers who would not make the trip in the absence of Amtrak service was calculated at $2.7 million.
8
b. Local business benefits. Travelers may utilize the train to travel to or from a community where they may use a taxi, rent a car, stay at a hotel, and eat at a restaurant. They may attend a conference or a sports event and they may shop in the community. This may vary from community to community but these and similar expenditures send a stream of benefits to many parts of the area. On-board survey data was used to determine the percentage of travelers that used taxis, rental cars, or local transit to access the train. Information was also obtained on passengers using hotels as well as length of stay. Respondents also indicated a primary trip purpose such as business or shopping. These responses allowed the research team to develop estimates, for example, of the number of persons who used taxis, stayed at hotels and shopped in station communities. The team was careful to isolate persons spending money in Michigan as opposed to Chicago or other out-of-state locations. Since Chicago is an important destination for Michigan train travelers it was important to exclude certain costs for travelers who resided in Michigan and were going to Chicago. As such, a conservative approach was utilized that considered Michigan hotel stays, meals, shopping and other activities for only non-Michigan residents. These types of direct expenditures send a stream of benefits throughout the community and were subject to an economic multiplier that resulted in local community benefits of $25.7 million.
c. Amtrak Expenditures. Amtrak operates all of the passenger rail services in Michigan. As such, Amtrak expends considerable amounts of money in Michigan for employee wages, supplies, and stations. In 2008, Amtrak employed 115 persons in Michigan. There are 48 persons involved in train operations as engineers, conductors, or train maintenance workers. There are 27 persons involved with station services including selling tickets. There are 40 employees involved in track and signal maintenance jobs related to the Amtrak owned track between Kalamazoo and Porter, Indiana. These employees were assigned to individual stations based on their work assignments. Other costs such as hotel, meal, and taxi costs for crew layovers in Michigan were also calculated by station, as were estimates for fuel and other supplies purchased in Michigan for use on Michigan services. As might be expected Amtrak expenditures are heavily weighted towards those station communities that serve as a crew base for Amtrak employees. Pontiac and Niles are good examples of stations with modest ridership but high levels of Amtrak expenditures. Costs for Amtrak vendor procurements that were not directly related to Michigan train operations were not included (e.g., purchase of over $1 million in shoes from a Michigan vendor). Direct and indirect expenditures associated with Amtrak service in Michigan amounted to $13.6 million.

9
The 22 Michigan communities with Amtrak stations receive $62 million annually in quantifiable benefits attributable to passenger rail service. These benefits are summarized below for each of the three corridors. It is important to state that these represent quantifiable benefits attributable only to the local communities. Additional benefits more difficult to quantify relate to how the existence of passenger rail service in a community enhances its image as a place to live and do business. Significant additional benefits also accrue to the region and the state related to traffic congestion relief, safety, energy conservation, and air quality improvement. These benefits are substantial and research for the American Public Transportation Association (APTA) indicates that safety and vehicle emission costs alone amounted to $.07 per vehicle mile in 1999. It is important to emphasize that these and other macro level benefits must be included in any consideration of the overall value of Amtrak service.
Summary of Quantifiable Community Benefits Pere
Marquette Corridor
Blue Water Corridor
Wolverine Corridor
Total Statewide
Traveler savings $2,808,380 $4,283,972 $12,872,105 $19,964,456 Non-traveler savings $ 345,737 $ 545,449 $ 1,848,575 $ 2,739,761 Local business benefits $3,572,199 $2,942,865 $19,159,480 $25,674,544 Amtrak expenditures $ 551,035 $1,949,089 $11,133,556 $13,633,680 Total community benefits $7,277,351 $9,721,374 $45,013,716 $62,012,441
Telephone interviews of community leaders and field surveys of each station were conducted as part of the work effort. This enabled the research team to obtain information and determine perceived and actual benefits associated with having an Amtrak station in a community. In general, there was a high degree of community support for the stations. The importance of the station to the community varies depending on the size and nature of the community and the type of station. In the smaller communities, the station may serve as a focal point for local activities and may even provide meeting space for public events or house the offices of the local chamber of commerce. In many cases, the station is seen as the only public link to intercity transportation because of the lack of intercity bus service or access to air service.
In larger communities, the service is viewed as one part of the multimodal transportation system but an important asset to the community. The location of the facility determines its potential for acting as a catalyst for further community economic development. The direct impact of the station on local businesses was generally acknowledged but little hard data was available. Restaurants and bars near stations receive additional business from travelers waiting for the train or disembarking in the community. Taxis serve most stations if the community is large enough to support a taxi service. In tourist-oriented communities, rail service provides direct access (walking) to local attractions. This is the case in St. Joseph, Dearborn (Greenfield Village platform) and New Buffalo. The survey respondents viewed passenger rail service as an important option for minority

10
and low income populations in the communities. It was also seen as an important service for college students in university communities such as East Lansing, Ann Arbor, Kalamazoo, and Albion. A number of station communities have recently improved their stations and others are planning to do so. The report contains case studies of strategic approaches to station development by six Michigan communities. The report also contains a discussion of other community development benefits resulting from station development initiatives. This includes increased employment, increased property values and increased tax base. The concept of Transit Oriented Development (TOD) is discussed. Further, a literature review was undertaken of economic impacts associated with rail related developments. Most of the national research deals with developments in high-density urban areas where high levels of transit service are being proposed. This is quite different from the Michigan situation but does offer some insight on the strategic and developmental aspects of station development. The authors did obtain information on economic development issues relating to a proposed new commuter rail service in Wisconsin and the Amtrak “Downeaster” service from Boston to Portland. The latter service is more closely aligned with Michigan type services, but with important differences in terms of corridor length and service frequency. Economic studies of the “Downeaster” service expect significant growth in ridership and local development adjacent to the stations over the next few years. Significant local economic benefits are associated with the provision of Amtrak service in Michigan. This research indicates local communities currently realize $62.0 million annually in benefits. Additional benefits accrue to the region, state, and nation in the form of congestion relief, air quality improvement, energy conservation, and safety. The benefits accrue to the local community even though service is very limited with only a single daily round trip provided to half of Michigan’s stations. This severely limits the potential for economic development impacts. The implementation of greatly improved levels of service and train speeds such as those in the proposed high speed Midwest Regional Rail System would dramatically change station area dynamics and overall benefit levels for local communities. The addition of commuter services in the southeast Michigan region would also result in major station development opportunities.
11
Michigan Passenger Rail Station Community Benefits Study
1.0 Project Background 1.1 Description and objectives.
Passenger rail service is perceived to provide important benefits to Michigan
communities. The extent of these benefits has never been quantified in a
systematic way and the Michigan Department of Transportation (MDOT) is
interested in performing a broad based assessment of the community level
benefits of passenger rail service. In Michigan, Amtrak provides intercity
passenger rail service to 22 communities and these services have a wide range
of direct, indirect, and induced economic impacts. Some of the direct impacts
are related to the employment of workers and expenditures on the operation of
the service. Other direct benefits relate to the increased mobility of the
population at lower travel costs. Indirect benefits include expenditures by
travelers for hotels, meals, taxis, and shopping and, economic development
opportunities afforded to the community by the presence of passenger rail
service. Induced benefits relate to the multiplier effect of these expenditures
spread throughout the station community and the region.
The main objective of the research project has been to estimate the full range of
these direct, indirect, and induced benefits at the community level and to develop
approaches to incorporate the findings into MDOT processes such as the
Transportation Management System. It is understood that passenger rail
services provide important additional benefits to the state and the region in terms
of congestion relief, air quality improvement, and energy conservation. These
benefits are discussed in the report but statewide or regional benefits are not
quantified.

12
It is also important to state that Michigan communities receive only low or
medium frequency levels of passenger rail service. Half of Michigan’s 22 station
communities have only a single daily round trip while the other half have from two
to four daily round trips. These levels of service should not be expected to
generate the kinds of economic impacts experienced by communities served by
commuter rail, light rail, or heavy rail systems with hourly or more frequent
service throughout the day. That said, existing Amtrak services to Michigan
communities generate significant benefits and these benefits can be meaningfully
quantified. The results of this initiative should prove useful to local communities
and the state in supporting the continuation or expansion of these services.
1.2 Types of benefits.
Three major categories of community level benefits are considered and
quantified in this report. These are:
o Individual traveler benefits. Passenger trains offer an economical mode of
transportation that is usually less expensive than flying or driving. These
benefits are significant and this report quantifies the savings for each of
the 22 station communities in Michigan.
o Benefits from Amtrak expenditures in station communities. Amtrak
expends considerable amounts of money in Michigan communities for
employee wages and for the procurement of goods and services.
Information was obtained from Amtrak and estimates of expenditures for
each station community were developed. This includes expenditures
relating to train crews, station agents, fuel, and track and equipment
maintenance. These expenditures are quantified for each station
community.
o Local business benefits. Rail passengers may utilize a train to access a
community where they use a taxi, stay at a hotel, eat at a restaurant, or
shop at a store. These and similar expenditures send a stream of benefits

13
to many parts of the community. These expenditures have been
estimated and quantified for each of the station communities.
The availability of passenger rail service may also afford a variety of quality of life
and economic development benefits to a community. The report discusses
community impacts in other states based on a literature review. It also contains
a discussion of existing or planned station developments in Michigan and the
kinds of benefits that are expected.
1.3 Assignment of benefits.
The study assigned all benefits to the community in which the station is located.
That said, the authors recognize that the benefits may actually be spread more
broadly across the entire service area of a given station. Special problems also
exist in assigning benefits to stations located in Southeast Michigan where there
are five stations serving the metropolitan area. Some of these stations are only a
few miles apart (e.g., four miles between Birmingham and Royal Oak). Some
travelers who may live in one part of the region may choose to travel to another
(e.g., Pontiac residents may drive to Dearborn) to board a train because of
perceived travel time, parking or other factors. Nonetheless, the values for each
community when added together present a reasonable representation of the
values for the region. Some outstate stations also draw from a large geographic
area—for example, people from the Tri-Cities area may board the train at Flint
whereas those from Mt. Pleasant may board in East Lansing and those from
Traverse City may board in Grand Rapids. The station community may benefit to
some degree even if the traveler is not a resident of the community where the
station is located.

14
1.4 Other societal benefits.
Benefits at the community level represent only a portion of total societal benefits
associated with passenger rail service. Other benefits accrue at the regional,
state, and national level and include such things as energy savings, air quality
improvements, congestion relief, and safety. In each of these categories,
passenger trains provide a clear and quantifiable benefit over alternative modes.
Any assessment of the total value of passenger rail service to Michigan must be
sure to include these types of regional and statewide benefits in addition to the
community level benefits that are the subject of this report. This is especially
important when one is comparing the public sector costs of passenger rail
service with the benefits derived from those services.
1.5 Time period representation.
The study is representative of the 2007-2008 time period. It utilizes calendar
year 2007 ridership information and modal cost and other information from 2008.
2.0. Michigan’s Passenger rail System
2.1 Overview and history.
Passenger rail services have been provided in Michigan for over 170 years. The
first passenger train operated between Toledo and Adrian in 1836. By 1909, a
9000-mile network of railroad lines provided passenger service to nearly every
city, town, and village in the state. The railway depot provided the doorway to
the community and stations ranged from small wooden shelters to massive and
distinguished buildings.
Railroads provided virtually all of the intercity transportation until the second
decade of the 20th Century when automobiles and improved roads began to

15
siphon off local rail traffic. This trend accelerated over the decades as roads
were improved and longer distance traffic shifted to air. By the early 1960’s, the
construction of the Interstate Highway System and massive investments in
airports and airways dealt an almost fatal blow to the passenger rail industry. As
ridership declined and losses grew, many passenger trains were discontinued by
their private railroad operators and it became apparent that government must
become involved if any passenger rail service was to survive.
In response to this crisis, in 1970, the federal government passed the National
Railway Passenger Service Act that created the National Railroad Passenger
Corporation known as Amtrak. This Act provided for private freight railroads to
turn over passenger equipment and assets to Amtrak and, in return, they were
relieved of their passenger service obligations. On May 1, 1971, virtually every
privately operated intercity passenger train in the country was discontinued and
most remaining services were assumed by Amtrak under a nationwide system.
In Michigan, about a dozen daily round trips on seven routes operated on April
30, 1971. The next day, May 1, only two round trips operated between Detroit
and Chicago. Since that time Amtrak has been the sole operator of intercity
passenger rail services in Michigan and, with minor exceptions, the entire U.S.
These services receive financial assistance from the federal government and
from many states including Michigan. Additional routes were added at the
request of the State of Michigan between Port Huron and Chicago in 1974 and
between Grand Rapids and Chicago in 1984. The existing system is shown in
Figure 2.1.
2.2 Michigan routes and services.
In 2009, three routes provide passenger rail service in Michigan as shown in
Table 2.1. These services have generally been in place for many years as
evidenced by the following:

16
o Wolverine Service provided by Amtrak began with two round trips on
May 1, 1971 between Detroit and Chicago. A third round trip was
added in 1975 and service was extended to Pontiac in 1994. Between
1980 and 1995, one of the round trips was extended to and from
Toledo while continuing to serve Detroit and all other stations to the
west.

17
Figure 2.1
18
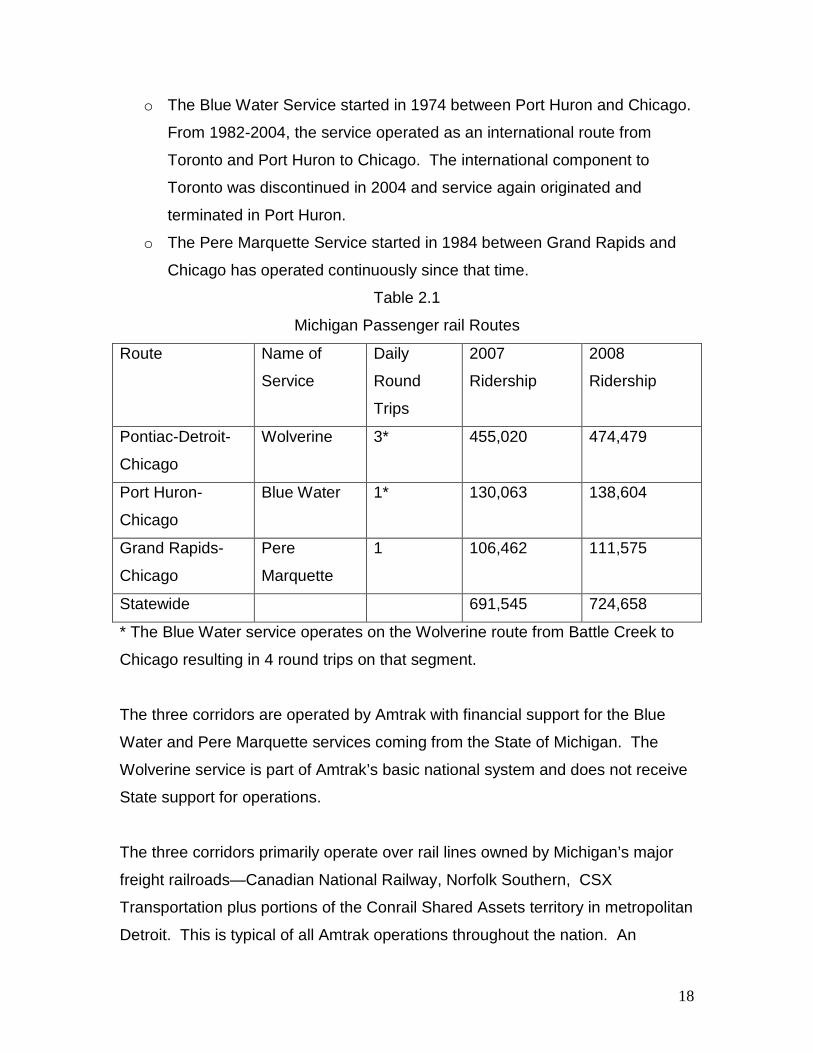
o The Blue Water Service started in 1974 between Port Huron and Chicago.
From 1982-2004, the service operated as an international route from
Toronto and Port Huron to Chicago. The international component to
Toronto was discontinued in 2004 and service again originated and
terminated in Port Huron.
o The Pere Marquette Service started in 1984 between Grand Rapids and
Chicago has operated continuously since that time.
Table 2.1
Michigan Passenger rail Routes
Route Name of
Service
Daily
Round
Trips
2007
Ridership
2008
Ridership
Pontiac-Detroit-
Chicago
Wolverine 3* 455,020 474,479
Port Huron-
Chicago
Blue Water 1* 130,063 138,604
Grand Rapids-
Chicago
Pere
Marquette
1 106,462 111,575
Statewide 691,545 724,658
* The Blue Water service operates on the Wolverine route from Battle Creek to
Chicago resulting in 4 round trips on that segment.
The three corridors are operated by Amtrak with financial support for the Blue
Water and Pere Marquette services coming from the State of Michigan. The
Wolverine service is part of Amtrak’s basic national system and does not receive
State support for operations.
The three corridors primarily operate over rail lines owned by Michigan’s major
freight railroads—Canadian National Railway, Norfolk Southern, CSX
Transportation plus portions of the Conrail Shared Assets territory in metropolitan
Detroit. This is typical of all Amtrak operations throughout the nation. An

19
important exception is the railroad between Kalamazoo, Michigan and Porter,
Indiana that is directly owned and operated by Amtrak. This line has been
improved for service at speeds up to 110 mph, although the current allowable
passenger train speed is 95 mph. This line segment is used by both the
Wolverine and Blue Water trains.
The freight railroads used by Amtrak typically allow Amtrak operations at
maximum speeds of 65-79 mph. Freight railroad ownership of the rail lines with
the resulting control of dispatching duties has caused problems with on-time
performance of passenger trains. Some of the line segments have heavy freight
train volumes that often delay passenger trains, producing persistent on-time
performance problems.
2.3 Ridership trends
Ridership on Michigan passenger trains has grown by over 50 % thus far in this
decade-- from 481,223 passengers in year 2000 to 724,658 passengers in 2008.
Current ridership is, by a wide margin, the highest ridership level since the
inception of Amtrak in 1971.
Recent increases are part of nationwide increases in Amtrak ridership primarily
caused by higher fuel and other transportation costs. In addition, state, local,
and national marketing efforts have increased awareness of the advantages of
train travel. In Michigan, anecdotal evidence suggests that the ridership would
be even higher if more passenger cars were available and if on-time performance
were more reliable. Ticket agents and others told the research team that many
trains are sold out and potential passengers are unable to purchase tickets on
the days that they prefer to travel. Table 2.2 provides information on ridership by
route since 1994.

20
Table 2.2
Michigan Ridership Trends
1994-2008
Year Wolverine Blue Water Pere
Marquette
Statewide
2008 474,479 138,604 111,575 724,658
2007 455,020 130,063 106,462 691,545
2006 444,319 124,953 103,912 673,184
2005 411,092 115,741 98,299 625,132
2004 379,677 98,356 90,522 568,555
2003 344,107 88,530 75,606 503,243
2002 295,550 88,045 63,596 447,191
2001 294,570 103,197 59,437 457,204
2000 313,255 106,866 61,102 481,223
1999 334,946 113,864 69,934 518,744
1998 365,143 112,168 65,788 543,099
1997 414,601 125,126 65,065 604,792
1996 383,426 111,348 58,516 553,290
1995 366,365 111,773 45,159 523,297
1994 402,461 117,100 70,995 589,142
3.0 Michigan’s Amtrak Stations The research team visited all of Michigan’s Amtrak stations, prepared an
inventory of findings, took pictures, and talked to station personnel when
possible. Follow up calls were also made to local community representatives to
get their views on a number of matters pertaining to the station including
perceived benefit to the community.

Table 3.1 Station Characteristics Station Name Fixed Intercity Adjacent Land Uses Immediate Proximity Indoor No. of Ticket Electronic Route Bus Conven. Waiting Seats Agent Ticket Bus Food Store Lodging Info Albion x Mixed industrial, residential x x 15 New Buffalo Commercial Dowagiac Commercial, retail, resident. x x x x 24 Bangor Commercial on site x x 24 Lapeer Industrial, commercial x 10+ St. Joe/Benton Harbor Residental on site x x 16 x Durand Industrial, commercial x 50+ x Port Huron Industrial, commercial x 35 x Pontiac x x Office, commer., industrial x x 20 Niles Residential, industrial x 70 x Birmingham Residential (lofts) x Flint x x Municipal, transit center x 25 x Royal Oak x Commercial x x Jackson x Commercial x x x 80 x x Holland x x Commercial x x x 30 x East Lansing x x/Thruwy University bldg., retail x x x x 35 x x Battle Creek x x/Thruwy Mixed retail, commercial x x 48 x x Grand Rapids x Thruway Industrial, commercial x x 28 x Detroit x Thruway Office, commercial x x x 64 x x Dearborn Thruway Municipal, Office Bldgs. x 57 x x Kalamazoo x x Commercial on site x x x 110 x x Ann Arbor x Thruway Commercial, office x x 50 x X
22
3.1. Station inventory.
Michigan has 22 Amtrak stations. These stations vary greatly in terms of ownership,
age, architecture, staffing and parking availability. They range from simple bus stop
type shelters to historic restored depots to relatively modern buildings. A tabular
presentation of station characteristics is presented in Table 3.1. Stations are listed by
ridership levels from low to high.
Some findings…
o Ten stations have ticket agents.
o Twelve have electronic ticket machines.
o All but three stations have indoor waiting rooms available.
o Most, but not all, stations have arrangements with local contractors to
open the buildings at train time when no agent is available.
o All but one station have parking spaces available. Most are free but
some require payment
o No food service is available at any of the Amtrak stations with the
exception of Kalamazoo that has a small convenience store, St.
Joseph where the station is located in a portion of a restaurant, and
Bangor that has a coffee shop type restaurant. Some other stations
have vending machines.
o Seven of the stations also serve intercity bus passengers and six are
served by the Thruway Bus service
o Eleven of the stations are served by fixed route local transit.
3.2 Station types.
There are four general types of stations.
o Basic. (Three stations) Bus stop type shelters exist at Birmingham,
New Buffalo, and Royal Oak. The Birmingham station may be
replaced by a new station and the Royal Oak station is adjacent to a
23
SMART bus station that has indoor seating available. The New Buffalo
Station is being relocated and enhanced.
o Historic Depots. (Ten stations). Historic station buildings have been
restored in Lapeer, Dowagiac, Bangor, Durand, Niles, Albion, Jackson,
Holland, and Kalamazoo. St. Joseph uses a portion of the old station
as a restaurant.
o Modern. (Eight stations). Since 1971, Amtrak, sometimes with MDOT
financial assistance, has constructed stations in Port Huron, Flint,
Battle Creek, Detroit, Dearborn, and Ann Arbor. Grand Rapids has a
very simple frame building. A new station is scheduled to be built in
Pontiac in 2009.
o Other. East Lansing uses a converted warehouse owned by Michigan
State University (MSU).
3.3 Ownership and management of stations.
There are several ownership models.
o Thirteen stations are owned by the City in which they are located.
o Five of the stations are owned by Amtrak.
o One station is owned by each of the following: MDOT, Flint MTA, MSU,
and private owners.
o Stations in Kalamazoo, Battle Creek, Flint, and East Lansing are
managed by the local transit authority.
3.4 Survey of community benefits associated with passenger rail service.
A telephone survey was conducted of contacts associated with individual stations to
determine perceived and actual local benefits resulting from having an Amtrak station in
their community. A variety of local officials and advocates were surveyed including city
officials, regional planners, transit agency employees, and civic and business

24
organization staff. The same set of questions was used for each interview (see
appendix 8.4 for the survey form).
The research team was able to find at least one person in each community who had
some knowledge and/or responsibility for the station. However, it was sometimes
difficult to obtain substantive information. There are major differences in ownership,
maintenance, management, and operation from community to community. There is no
single model and each community has developed an approach that is suitable for their
specific situation. There is often no single individual who has responsibility for the
station as this may be shared between a city, a transit agency, Amtrak or a civic
organization.
In general, there is a high degree of community support for the stations. The
importance of the station to the community varies depending on the size and nature of
the community and the type of station. In the smaller communities, the station may
serve as a focal point for local activities and may even provide meeting space for public
events or house the offices of the local chamber of commerce. In many cases, the
station is seen as the only public link to intercity transportation because of the lack of
intercity bus service or access to air service.
In larger communities, the service is viewed as one part of the multimodal transportation
system but an important asset to the community. The location of the facility determines
its potential for acting as a catalyst for further community economic development.
Operational responsibilities may rest with the city, transit agency, regional planning
agency, Amtrak, volunteers or a mix of any of these agencies. The organizations, other
than city government, most commonly involved with the operation and promotion of the
passenger rail service are the Chamber of Commerce, the Visitors and Convention
Bureau, and various service organizations. In some instances, the actual operation of
the station (opening and closing) is done by volunteers.

25
The impact of a community’s station on local businesses was generally acknowledged
but little hard data is available. Restaurants and bars near stations receive additional
business from travelers waiting for the train or disembarking in the community. Taxis
serve most stations if the community is large enough to support a taxi service. In
tourist-oriented communities, rail service provides direct access (walking) to local
attractions. This is the case in St. Joseph and the proposed New Buffalo station.
Greenfield Village is currently served by a platform but is not a regularly scheduled stop.
Greenfield Village is not accessible from the current Dearborn station but will be from a
proposed new station location.
Expenditures for improvements to local stations are done on an ad hoc basis. Most
improvements are funded by state or federal grants with no systematic funding
mechanism in place. Several communities are involved in joint marketing efforts with
other communities on the same line.
The passenger rail service is viewed as an important option for minority and low income
populations in the communities. It is also seen as an important service for college
students in university communities such as East Lansing, Ann Arbor, Kalamazoo, and
Albion.
3.5 Station development perspectives
Each station is different in terms of its potential for development. Some stations are
isolated from the surrounding community and offer little potential in their existing
location. Others are located in areas where development can and sometimes is
occurring. That said, most of the stations serve their intended purpose of providing an
acceptable location to board the train. They typically have adequate parking and are
generally, but not always, perceived to be in safe locations. With some exceptions, they
tend to provide an adequate gateway to and from their communities given the relatively
low levels of train service.

26
There are several situations in Michigan where local communities are making plans for
relocating and constructing new stations to take advantage of favorable local conditions.
Those situations are discussed in detail later in this study.
It is unrealistic to expect stations that have only a single daily round trip and a handful of
passengers to trigger high levels of land development. Sometimes this development
occurs in areas adjacent to the station because of other favorable factors that are
incidental to the availability of passenger train service. Developers may perceive that
improvements in service levels in the future could greatly enhance their investments.
3.6 Impact of potential new services.
As previously stated, development potential, and related economic benefits, are driven
largely by passenger activity levels. These in turn are determined by the quality of the
service offerings, especially those relating to service frequency (e.g., daily round trips),
travel time, price, and train capacity. Interviews with Amtrak station personnel indicated
that there is the need for additional passenger rail cars during peak travel time periods.
In Michigan, there are several initiatives under way that could dramatically increase
passenger activity levels.
3.61 Midwest Regional Rail System. The Midwest Regional Rail Initiative represents an
ongoing effort to develop an improved and expanded passenger rail system in the
Midwest. State transportation agencies in nine Midwestern states are sponsors of this
initiative. The over all proposal is the operation of a 3000-mile “hub-and-spoke” system
providing service to and through Chicago to locations in the Midwest. Trains would
operate at speeds up to 110 mph. In Michigan, this system would initially involve an
increase from 3 to 6 trains daily, eventually with 10 daily round trips at 110 mph
between Chicago and Detroit with seven continuing on to Pontiac. In addition to the ten
trains destined for Detroit or Pontiac, there would be an additional four trains between
Chicago and Kalamazoo. These trains would be split at Kalamazoo, and would

27
continue as separate trains at reduced speeds to Port Huron and Grand
Rapids/Holland.
The increased speeds and frequencies are expected to generate
significant additional ridership. Major Michigan stations would receive 3-4 times the
amount of daily train service compared to the current situation. The additional ridership
would dramatically increase local community benefits. These would be further
enhanced by the construction of the necessary new infrastructure including new stations
and track structure. The Midwest Regional Rail System Executive Summary published
in September 2004 indicates that Michigan infrastructure and train expenditures would
total $1.1 billion (in 2002 dollars).
3.62 Commuter Rail Developments. Local communities could also benefit from the
development of rail commuter services. Over the years, there have been studies of
expanded commuter services in Southeast Michigan. Some of the plans involved the
establishment of a comprehensive system serving most parts of the region. The plans
have always assumed that service to/from Ann Arbor and Pontiac would be worthwhile.
In fact, both of these corridors had publicly sponsored rail commuter service into the
1980’s.
The most prominent current proposal is to implement restored service between Ann
Arbor and Detroit. This project is being managed by the Southeast Michigan Council of
Governments (SEMCOG) and start-up is scheduled to occur in October 2010. This
would provide service to Ann Arbor, Ypsilanti, Dearborn, and Detroit as well as one or
more new stations. This would provide the possibility of direct bus service to Detroit
Metro Airport from a station in the Westland/Wayne/Inkster area and a connection to the
proposed light rail service in the Woodward Avenue Corridor.
Another proposal involves the ‘Wally’ service from Howell to Ann Arbor with three
intermediate stops. This project is being managed by the Ann Arbor Transportation

28
Authority. The initial service would not be able to serve the existing Ann Arbor Amtrak
station due to railroad ownership and engineering issues.
4.0 Individual Station Benefits
The principal objective of this research is to determine the benefits of passenger rail
service and its station to a local community. These benefits may be classified into the
following categories:
a. Individual traveler benefits
b. Amtrak expenditures in station communities
c. Local business benefits
These benefits have been quantified for each station community and a summary sheet
for each of Michigan’s 22 Amtrak stations is contained in appendix 8.7. The information
in the summary sheet is largely driven by ridership information contained in MDOT’s
Transportation Management System (TMS). The TMS contains information provided by
Amtrak on the number of passenger boardings and deboardings at each of Michigan’s
Amtrak stations and the origin and destination of their trip. The possibility exists to
automate a process where individual community benefit summaries could be routinely
and easily updated as part of the TMS process.
4.1 Individual traveler benefits.
Passenger trains offer an economical mode of transportation that is usually less
expensive than flying or driving. This task compares existing passenger rail costs to
costs that would be incurred if there were no passenger rail service in a community and
alternative modes were used (or, alternately the trip was foregone).
4.11 Procedure. The first step in the process was to obtain ridership information for
each Michigan passenger rail station from MDOT’s Transportation Management
System (TMS). MDOT obtains this directly from Amtrak, and origin-destination

29
information is available for each station. Year 2007 information was utilized for this
process and data was compiled for stations in the Wolverine, Pere Marquette, and
Blue Water corridors.
The second step in the process was to determine the alternative travel mode that
would be used if Amtrak service were not available. This decision was based on
responses from the comprehensive on-board ridership survey conducted by the
University of Michigan (U of M) in 2007. This survey asked how a traveler would
make the trip in the absence of Amtrak service to a community. It also provided
information on those that would not make the trip in the absence of Amtrak service.
The research team supplemented the 2007 data with information from a similar
survey conducted by U of M in 2000. Without the 2000 survey data, there would
have been a number of gaps in the analysis, including duration of trip in days,
number of travelers in party, and percentage of travelers using hotels.
The use of two separate surveys was beneficial in that different travel time periods
and question sets were involved. For example, the 2000 survey was conducted
during the December holiday travel period when trip purposes (e.g. more shopping)
might be somewhat different than other times of the year. The spring 2007 survey
was perceived to be more representative of overall travel characteristics but the
2000 data provided important additional information.
The third step in the process was to determine the costs of the alternative modes
and compare them to Amtrak costs. This involved internet searches of intercity bus
and airline companies in order to derive a reasonable estimate of ticket costs for
those modes.
This effort is complicated by market-based pricing for each mode wherein the price
can vary significantly on a daily or seasonal basis depending on travel demand.
The basic approach was to utilize 14-day advance purchase fares based on a
round-trip purchase. Thus, a traveler flying to Chicago in lieu of an Amtrak trip was

30
assumed to pay one-half of the round trip fare for each leg of the trip. For those
travelers who would drive in lieu of train service, the IRS rate for the first half of
2008 of $.505 per mile divided by auto occupancy of about 1.8 persons per car was
utilized, although this varied somewhat from corridor to corridor. The IRS rate was
utilized because it is the most widely used measure for automobile cost. It includes
gas, depreciation or lease payment, maintenance and repairs, insurance, tires, oil,
and license and registration. Added for all modes were parking, tolls, and other
appropriate fees to the trip. The last step in the process was to subtract Amtrak
fares from alternative mode fare costs to determine whether there were any
savings. Also a calculation was made for those individuals who would forego the
trip. The procedure utilized was quite complex and numerous tables and data
points were considered in preparing the summary tables at the end of this report. A
more detailed discussion of the procedure is contained in separate technical
memoranda.
Non-traveler benefit occurs because part of the population making a trip by train is
unwilling to make that same trip with more expensive alternatives. Taking the trip
has value to the citizen above the cost that they pay for the trip. An example is
helpful. A regular train trip from Grand Rapids to Chicago is $35 but the overall cost
of driving is $65. Therefore, this person will not make the trip because his
consumer satisfaction is not as high as $65. However, if the trip is available by train
for $35 and his consumer satisfaction is $50, there is an additional consumer
surplus gain of $15. Knowing that a train traveler was willing to purchase the train
ticket, but was unwilling to spend money on the most likely next expensive
alternative provides an estimate of how much “consumer surplus” is lost by
individuals who no longer are willing or able to take the trip in the absence of train
travel. This estimate of non-traveler benefit takes into account that the money they
spent on the ticket will be spent on something else, but they do not get the
additional benefit of the trip beyond the original price of the ticket.
31
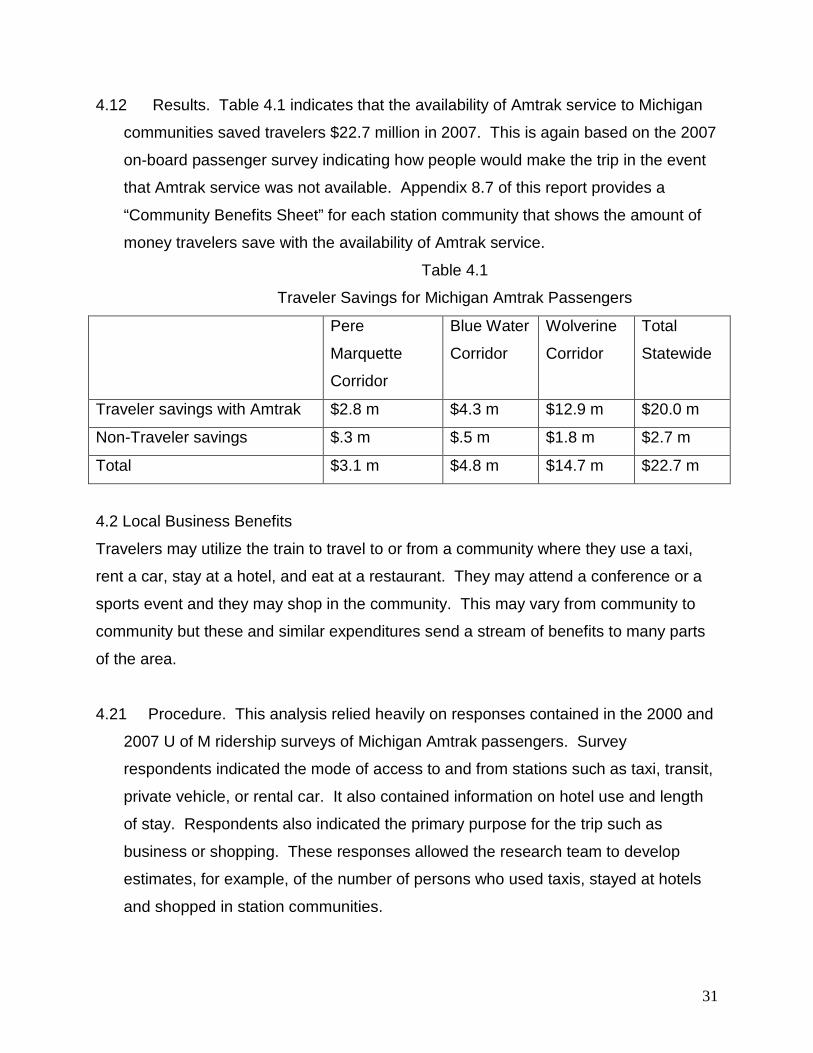
4.12 Results. Table 4.1 indicates that the availability of Amtrak service to Michigan
communities saved travelers $22.7 million in 2007. This is again based on the 2007
on-board passenger survey indicating how people would make the trip in the event
that Amtrak service was not available. Appendix 8.7 of this report provides a
“Community Benefits Sheet” for each station community that shows the amount of
money travelers save with the availability of Amtrak service.
Table 4.1
Traveler Savings for Michigan Amtrak Passengers
Pere
Marquette
Corridor
Blue Water
Corridor
Wolverine
Corridor
Total
Statewide
Traveler savings with Amtrak $2.8 m $4.3 m $12.9 m $20.0 m
Non-Traveler savings $.3 m $.5 m $1.8 m $2.7 m
Total $3.1 m $4.8 m $14.7 m $22.7 m
4.2 Local Business Benefits
Travelers may utilize the train to travel to or from a community where they use a taxi,
rent a car, stay at a hotel, and eat at a restaurant. They may attend a conference or a
sports event and they may shop in the community. This may vary from community to
community but these and similar expenditures send a stream of benefits to many parts
of the area.
4.21 Procedure. This analysis relied heavily on responses contained in the 2000 and
2007 U of M ridership surveys of Michigan Amtrak passengers. Survey
respondents indicated the mode of access to and from stations such as taxi, transit,
private vehicle, or rental car. It also contained information on hotel use and length
of stay. Respondents also indicated the primary purpose for the trip such as
business or shopping. These responses allowed the research team to develop
estimates, for example, of the number of persons who used taxis, stayed at hotels
and shopped in station communities.

32
The research team was careful to isolate persons spending money in Michigan as
opposed to Chicago or other out-of-state destinations. Since Chicago is a major
destination for Michigan train travelers it was important to exclude those travelers
who resided in Michigan and were traveling to Chicago. As such, hotel stays,
meals, shopping and other activities were considered for only non-Michigan
residents. Thus, only about 7% of all Amtrak passengers were assumed to utilize
Michigan hotels for business, convention, shopping, or other purposes. This is a
conservative estimate since there would likely be some Michigan residents who
would stay and shop in-state.
A conservative set of estimates was used for these kinds of activities based on
State of Michigan government travel rates for 2008 for hotels ($65/night) and meals
($38.50 per diem) and the assumption was made that the typical stay was four
nights based on the survey results. An assumption was also made that those
persons declaring shopping as the major trip purpose would expend $100. This is a
very conservative estimate for those individuals declaring shopping as the primary
reason for the trip.
It was also assumed that travelers would spend money for miscellaneous purposes
including meals in the station community or other incidental expenditures.
Discussions with local station agents or others indicated that passengers or persons
dropping off or picking up passengers will sometimes eat at a nearby restaurant or
purchase incidentals from a local coffee shop. Several examples of this include:
o Ann Arbor. Many passengers (or those meeting or dropping off
passengers) eat at several nearby restaurants and at least one restaurant
is very appreciative of the business. A server said they do a lot of Amtrak
passenger related business.
o Bangor. Passengers often purchase coffee or breakfast items at the
coffee shop located in the station. Sometimes the Amtrak train crew will
call ahead and have items delivered to them when they stop.

33
o Kalamazoo. The station has a convenience store and there are nearby
restaurants.
o St. Joseph. The waiting room is located in a restaurant.
o East Lansing. A nearby convenience store does considerable business
since it is close to the station. This is especially true if the train is late.
4.23 Results
Table 4.2 indicates that local communities are the beneficiary of about $15.7
million annually in expenditures by Amtrak passengers using local passenger
stations. This represents the equivalent of about $23 for every Amtrak
passenger using Michigan Amtrak stations. The research team believes that the
assumptions used represent a conservative estimate. However, it is also
recognized that communities differ widely in terms of trip purposes that may
utilize a station. For example, some smaller station communities may attract far
fewer business or conference travelers than a larger more diverse metropolitan
area such as Ann Arbor with the University of Michigan and its related Medical
Center or Detroit as the business and cultural center of Michigan. As a result, it
was decided to assume the following:
o Category 1 Station. Ann Arbor, Battle Creek, Birmingham, Dearborn,
Detroit, Jackson, Kalamazoo, Niles, Pontiac, and Royal Oak. Defined as
a metropolitan area station with multiple daily service frequencies----$25
per passenger.
o Category 2 Station. Grand Rapids, Holland, East Lansing, Flint, Port
Huron, and St. Joseph. Defined as a metropolitan area station with a
single daily frequency----$20 per passenger
o Category 3 Station. Albion, Dowagiac, Bangor, New Buffalo, Durand, and
Lapeer. Smaller community station----$15 per passenger.

34
Station communities may argue that their value should be higher or lower
depending on their special circumstances. The nature of this process allows
them to simply insert a different value in the Community Benefit Summary Sheet
to derive a different figure.
Table 4.2
Local Business Benefits from Passenger rail Service
Notes for Table 4.2 are in Appendix 8.5
% using Trip Total Average Total Cost Cost/Pass. Note Universe Trips Cost Statewide Access Taxi 8.5 691,545 58,781 $10 $587,813 $0.85 1 Transit 2.4 691,545 16,597 $1 $16,597 $0.02 1 Rental Car 0.1 691,545 692 $50 $34,577 $0.05 1 Personal Vehicle 81.7 691,545 564,992 $2.80 $1,581,978 $2.29 2 Total $2,220,966 $3.21 3 Lodging/Meals Hotel/motel 7.42 345,772.5 25,656 $260 $6,670,643 $9.65 4 Meals 7.42 345,772.5 25,656 $154 $3,951,073 $5.71 4 Total $10,621,716 $15.36 Incidentals Shopping 5 345,772.5 17,289 $100 $1,728,863 $2.50 5 Incid. meals 10 691,545 69,155 $10 $691,545 $1.00 6 Misc. 100 691,545 691,545 $1 $691,545 $1.00 6
Total Expenditures by Passenger $15,954,635 $23.07 Used to develop assumptions
Assume Following at Community Level
Category 1 Station Metro area station w/ multiple service $25/passenger Category 2 Station Metro area with single service $20/passenger Category 3 Station Smaller community station $15/passenger Results from Summary Sheets with Above Assumptions Grand Total from Summary Sheets $15,721,820 $22.73 Avr. Direct Exp./Passenger
Indirect Expenditure Multiplier $9,952,725 Avr. Indirect Exp./passenger
Grand Total Direct and Indirect Expenditures $25,674,545 $37.13 Avr. Total Exp./Passenger
1.6331 Avr Multiplier

35
The direct expenditure of money in a community has a multiplier effect that
results in additional induced expenditures in a community. The research team
obtained multipliers generated by the RIMS II model based on the Bureau of
Economic Analysis (BEA) statistics for 2006 at the county level. Different
multiplier sets were obtained for five different regions in Michigan served by
Amtrak. Each set contained a multiplier for retail type expenditures and one for
rail related expenditures. The retail multipliers ranged from 1.4265 to 1.5817.
The rail related multipliers ranged from 1.5591 to 1.8081. This issue is explained
in greater detail in Appendix 8.3.
The application of these multiplier values to local business expenditures in each
station community resulted in indirect and induced expenditures statewide of
$25,674,544.
4.3 Benefits from Direct Amtrak Expenditures
Amtrak operates all of the passenger rail services in Michigan. As such, Amtrak
expends considerable amounts of money in Michigan for employee wages, supplies,
and stations. These expenditures provide benefits to the local communities where
employees live and work or where stations are located.
4.31 Procedure. Information was obtained from Amtrak on employee residence
locations and procurement expenses in Michigan. Employees were assigned to
station locations based on discussions with Amtrak officials and material submitted
to the research team by Amtrak. Some estimates were necessary but overall
employee numbers and wages correlated closely with statewide totals shown on the
Amtrak website. Procurement expenditures were assigned to stations if they had a
relationship to a particular station. Amtrak purchases from Michigan vendors that
were intended to support system operations on a nationwide basis were not
considered. For example, Amtrak purchased $5.7 million in goods or services from
Michigan vendors in 2007 and $13.6 million in 2008. Examples include over $1

36
million in computer software services and over $1 million in shoe purchases. Many
of these vendors are not located near a Michigan station and the procurement has
little or nothing to do with Amtrak’s service at an individual Michigan station. The
test for inclusion in the calculations was that the expenditure must relate
substantially and directly to Amtrak services in Michigan.
4.311 Employee Wages. In 2008, Amtrak employed 115 employees in
Michigan. These employees fall into three categories:
o Operating employees including engineers, conductors, assistant
conductors, and train maintenance personnel. These employees are
primarily based in Pontiac, Port Huron, and Grand Rapids. There are 48
employees in this category.
o Station services include selling tickets, cleaning and providing information
and security. Amtrak station agents are located in 10 Michigan stations.
Some stations have a single agent on a single shift while others have
several agents on several shifts. There are 27 employees in this
category.
o Engineering department employees that maintain track and signal
systems on the Amtrak owned 97-mile rail line between Kalamazoo and
Porter, Indiana. There are 40 employees in this category.
4.312. Other Amtrak expenditures. As stated previously many of Amtrak’s
procurements have little to do with Michigan stations and services and were not
included. However, one major purchase was $6 million in fuel purchased from a
Pontiac fuel vendor. This is used to fuel locomotives assigned to trains 352 and 354
that overnight in Pontiac. Approximately 4,000 gallons per day of diesel fuel is
consumed. This study assigned only an estimate of the cost of direct labor and
vendor profit to the Pontiac station for this procurement. Costs for landscaping
services, station maintenance, office supplies, trash pickup, and other costs that
could be directly tied to an Amtrak station were estimated and included in the
calculations. In addition, Amtrak expenditures for crew layover costs (e.g., taxi,

37
hotel, meals) were estimated for each station. A major cost element was also
supplies and materials related to the Amtrak owned line between Kalamazoo and
Porter, Indiana. Approximately 40 employees utilize everything from rail to ties to
gasoline to maintain this line.
4.313 Results. This process resulted in the assignment of over $9 million in direct
Amtrak expenditures to individual stations. Direct expenditures as shown in Table 4.3
are as follows:
o $7,150,000 in direct employee wages (note: Amtrak’s website shows Michigan
wages of $6.6 million in 2007 and $7.5 million in 2008)
o $242,000 in employee layover costs for taxis, hotels and meals
o $300,000 for miscellaneous expenses such as office supplies, trash pickup, train
toilet waste disposal, train supplies etc.
o $700,000 for Pontiac refueling costs direct vendor labor and profit
o $485,000 for Amtrak line (Kalamazoo-Porter) equipment and materials
o $150,000 for Amtrak owned station operations (includes utilities & maintenance)
These values are subject to economic multipliers, as the expenditures will flow
throughout the community (see appendix 8.3). The addition of these multipliers, ranging
between 1.5591-1.8081 depending on the station, results in $13.6 million of Amtrak
direct and induced expenditures in Michigan.

38
39
4.4 Local Community Expenditures.
Many benefits may be assigned to communities that have Amtrak service. At the same
time, these communities incur certain costs. Direct community costs vary widely but
generally include the following:
o Staff time to coordinate with Amtrak, MDOT or others involved with the station.
This sometimes involves grant applications and project management for new
stations or station rehabilitation. It may also involve planning for new stations.
o Staff time to coordinate local volunteers or to arrange for necessary
maintenance.
o Routine station operating costs when that responsibility resides with the local
community. This may include utilities, landscaping, snow removal, and cleaning.
Only six of 22 Amtrak stations are owned by Amtrak. The balance are the responsibility
of the local community—the city, the transit agency or some other entity. Estimates of
local community expenditures were developed, based in part, on discussions with local
community representatives. Local expenditures were estimated to range from $10,000
annually to $60,000 annually depending on station size and ownership responsibility.
Total local community expenditures for Amtrak stations in Michigan are estimated at
$510,000. Amtrak also expends approximately $150,000 annually on stations that they
own. The Amtrak value has been included in the Amtrak expenditure discussion.
4.5 Summary of quantifiable community benefits.
The 22 Michigan communities with Amtrak stations receive $62.0 million annually in
quantifiable benefits attributable to passenger rail service. These benefits are
summarized in Table 4.5 for each of the three corridors. As might be expected, benefits
are highest for the Detroit-Chicago “Wolverine Corridor” which has the most service and
ridership and the greatest population. The Wolverine Corridor receives $45 million

40
annually in benefits, the Blue Water Corridor receives $9.7 million, and the Pere
Marquette Corridor receives $7.3 million. It is important to state that these represent
quantifiable benefits attributable only to the local communities. Additional benefits more
difficult to quantify relate to how the existence of passenger rail service in a community
enhances its image as a place to live and do business. Significant additional benefits
also accrue to the entire state related to traffic congestion relief, energy conservation,
and air quality improvement. It is important to emphasize that these and other macro
level benefits should be considered in any consideration of the overall value of Amtrak
service.
Table 4.5
Summary of Quantifiable Community Benefits
Pere Marq.
Corridor
Blue Water
Corridor
Wolverine
Corridor
Total
Statewide
Traveler savings $2,808,380 $4,283,972 $12,872,105 $19,964,456
Non-traveler savings $345,737 $545,449 $1,848,575 $2,739,761
Local business benefits $3,572,199 $2,942,865 $19,159,480 $25,674,544
Amtrak expenditures $551,035 $1,949,089 $11,133,556 $13,633,680
Total Community Benefits $7,277,351 $9,721,374 $45,013,716 $62,012,441
Note: Values taken from Excel spreadsheet Table 8.6 and subject to rounding.
4.6 Intermodal stations and coordinated Amtrak bus services.
A number of Amtrak stations are also served by local transit agencies and/or intercity
buses. In some cases, such as Kalamazoo, a major multi-modal transportation center
provides a wide range of services and facilities for transit, intercity bus, and passenger
rail users. Intermodal stations allow for the easy transfer of passengers between the
different modes for both local and intercity travel. There are three Michigan services
where Amtrak and intercity bus services are coordinated:
o Flint, East Lansing, and Battle Creek. Indian Trails buses on a regular route will
pick up Amtrak passengers at Flint and East Lansing and drop them at Battle

41
Creek where they can board an Amtrak train traveling between Detroit and
Chicago. This twice-daily service in each direction supplements the single daily
Amtrak round trip. It greatly expands the travel opportunities for those
passengers who are unable to utilize the limited Amtrak schedule.
o Kalamazoo, Grand Rapids, and northern Michigan. Indian Trails buses serve
Amtrak passengers at Kalamazoo and transport them to and from Grand Rapids
and northern Michigan points such as Traverse City, Petoskey, and St. Ignace.
This daily round trip allows an Amtrak passenger to travel to Kalamazoo on an
Amtrak train and connect with an intercity bus to northern Michigan. This service
also provides increased travel opportunities for Grand Rapids passengers
between Grand Rapids and Chicago that cannot use the single daily Amtrak
round trip.
o East Lansing, Ann Arbor, Detroit, and Toledo. Amtrak operates a dedicated daily
intercity bus service between East Lansing and Toledo with intermediate stops in
Ann Arbor, Dearborn, and Detroit. This service is only available for Amtrak
passengers traveling on Amtrak trains to and from eastern points such as New
York City, Boston, or Washington DC. Connections are made at Toledo for these
points. This service is well utilized even though connecting times in Toledo are in
the middle of the night and this service does not connect directly with any
Michigan Amtrak trains.
Ridership on these “Thruway” services is generally quite low compared to overall
Amtrak ridership in Michigan. Specific information was not readily available to the
research team but it is estimated that, on average, about 100 persons daily or 36,500
passengers annually use these services, predominantly on the Toledo connecting bus
service. The availability of Amtrak connecting services does result in benefits to the
local Michigan community where the trip originates or terminates. Those Michigan
passengers using the Battle Creek or Kalamazoo connection are already included in the
estimates. This area could be further investigated.
42
As a general statement, no significant amount of benefit accrues to the station
community where a simple transfer between modes occurs. The passenger may
purchase a meal, drinks, or other incidentals but typically will be in the area for only an
hour or so. The greater benefit may be that the coverage of the passenger rail service
is increased. The ease of transfer results in additional connecting services, which
increases the number of persons traveling to or from the local community where the
intermodal terminal is located. One could speculate that the development of a Midwest
high-speed rail system with fast and frequent trains would greatly increase the demand
for connecting services to and from those communities that are located on the high-
speed line. This would benefit travelers using the high-speed service and would greatly
increase the accessibility of the local community for others as well.
4.7 Benefit estimates for new stations or services
The community benefit calculation spreadsheet process may be used to estimate
benefits for new services. This could be a new station or enhanced services at an
existing station. The important caveat is that ridership estimates must be provided as an
input as well as certain other information. Ridership is the most important driver of
station benefits. Ridership estimation is a complex process typically involving computer
models that use origin/destination data for auto and other modal travel. These models
also consider passenger rail characteristics such as service frequency, travel time,
pricing (i.e., fare structure), on-board amenities and other factors. The ridership
estimation model will provide the number of individual passenger rail trips for the
different city pairs served by the proposed station.
The benefit estimation process involves the substitution of new ridership data into the
spreadsheet. Passenger fares are obtained and multiplied by the number of one-way trips via rail to derive total user travel costs. Alternate travel mode information must
also be obtained for auto, air and intercity bus. It may be necessary to develop modal
split estimates if this information is not available from surveys or the ridership
forecasting model. Working through the spreadsheet will provide an estimate of total

43
savings for passenger rail travelers at the subject station. Non-traveler savings will be
automatically calculated.
Local business revenues are calculated by multiplying total ridership by spreadsheet
default values of $15, $20 or $25 depending on the classification of the community (see
Section 4.23). A different value may also be substituted based on specific community
level information. Amtrak expenditure information, if any, may be added to the table.
In many cases, this may only be expenditures related to station staff employed by
Amtrak.
Multipliers specific to the location of the station must also be added (see Section 8.33
for appropriate current multipliers). The spreadsheet will automatically calculate the
total community benefits associated with the proposed new station. It is important to
emphasize that this process is designed for intercity passenger rail travel, to estimate
benefits associated with those traveling longer distances (e.g., from Detroit to Chicago).
The intercity traveler often stays overnight, eats at restaurants, visits friends or family,
shops, and uses taxis. The process is not appropriate for commuter rail passengers
since these travelers have very different characteristics.
5.0 Case Studies of Station Development There are numerous direct and indirect benefits to communities resulting from the
passenger rail service provided at existing stations. However, these benefits can be
enhanced and expanded through the investment in a new or relocated station. These
benefits are discussed in more detail in the next chapter of the report. Summarized
here are some current local efforts to increase the value of a station to its community
and to enhance the transportation service it provides. Each situation is unique based
on the characteristics of the station, the community, and the resources available for the
project.

44
5.1 Dearborn: Relocation to access major attractions
The City of Dearborn is planning to relocate the existing Amtrak station and replace it
with a new multi-modal facility that better serves many of the major attractors of the city.
The location of the current station resulted from an effort to locate public facilities
between the two traditional downtown areas of Dearborn. Thus, the police
headquarters, library, and cultural center are in the complex where the station is located
and there is plenty of free parking available. However, the current location is isolated
from most retail services, so there are few businesses that benefit from the station’s
present location and it is isolated from other major community assets.
The proposed new location is at Michigan Avenue (U.S.-12) and Elm Street. At this
new location, the station can become a community focal point and provide an
opportunity for new commercial and residential development. The new location will be
more accessible to the major centers of the west downtown, including the shopping and
restaurant district, the Henry Ford/Greenfield Village complex, and the Dearborn U of M
campus.
Partnerships are being formed with local businesses and developers as part of the
development process. Ford Motor Company is donating the land for the new station.
The Chamber of Commerce is a strong supporter of the project and plans to eventually
have its office in the new station building. The new multi-modal facility will include
space for exhibits by the Henry Ford Museum and other attractions as well as the
Chamber offices. Pedestrian connections to the downtown and U of M campus will be
provided. The city is anticipating significant Transit Oriented Development around the
site.
Conceptual plans, engineering, and rail studies have been completed by a consultant.
The estimated costs for the new station project have been split into phases. The initial
phase would be construction of a temporary station at the new site with minor site
improvements and work on the rail infrastructure. The cost of the first phase is

45
estimated to be approximately $1 million. Construction of the new multi-modal station,
other site improvements, and additional rail infrastructure would cost an estimated $21.4
million. Specific funding sources for the project have not yet been identified. The
Environmental Assessment study for the project was completed late in 2008. Both
Suburban Mobility Authority for Regional Transit (SMART) and the Detroit Department
of Transportation (DDOT) have agreed to serve the new location. The current loading
platform at Greenfield Village would be consolidated into the new station.
Implementation of additional commuter rail service, currently under consideration, is a
key component in development of the new station. The proposed plan being
coordinated by the Southeast Michigan Council of Governments (SEMCOG) would
begin commuter train service between Ann Arbor and Detroit by October of 2010.
Opening of a temporary station at the new site would coincide with the beginning of this
service. If ridership levels prove the viability of the increased service, the full new
station development would begin by 2013. The new station would also be a key
beneficiary of new high-speed rail services that are being proposed for the Detroit-
Chicago corridor.
5.2 Birmingham-Troy: A joint community effort in an urban suburb
The cities of Birmingham and Troy are joint sponsors of a plan for the relocation of the
current Amtrak station in Birmingham to a site in Troy that would have a multi-modal
transportation terminal serving both communities. The current station is a shelter
located on the west side of the tracks in Birmingham amidst a new loft development with
virtually no onsite parking.
The proposed site for the new station is a 3.5-acre parcel of land located in the City of
Troy adjacent to and east of the railroad tracks at the rear of the Midtown Square
Shopping Center. As part of a consent judgment associated with the development of
the mall by Grand Sakwa Properties in 2000, the city was given a ten-year option to use
46
the parcel for development of a transit center. If the development does not occur by
2010 then the land reverts to Grand Sakwa or must be purchased for $1.5 million.
A strategic plan for development of the site has been prepared by U of M’s Taubman
College of Architecture and Urban Planning. It analyzed the transportation,
demographic, and economic characteristics of the communities and presented
development scenarios. The scenarios suggest that the new transportation center
could be associated with as much as 300,000 square feet of new retail space and as
many as 290 new attached residential units. The mix of retail and residential varies by
option.
On September 22, 2008, the two cities voted to create a joint planning commission to
oversee development of the project and to hire a project manager. The current
estimated cost for the new facility is approximately $5.6 million which includes the
station and a tunnel under the tracks for passenger access.
5.3 Detroit: Accessibility for the region’s core
The current Detroit Amtrak station is located adjacent to Woodward Avenue in the
Detroit New Center area. The station is about 3 miles north of the central business
district and the office, sports, cultural and other venues in the downtown area. The
current station is located in a temporary building on the north side of the CN/CR
elevated railroad right-of-way and has very limited parking. MDOT and Amtrak have, for
many years, been planning a new station building on the south side of the railroad from
the existing station. The new station would have more parking and be designed to
serve commuter as well as intercity trains. The land has been acquired. The existing
and proposed new sites both have the advantage of being located on Woodward
Avenue, which is a major north-south route in the region. Two plans for new light rail
service on Woodward Avenue have been proposed by the Detroit Department of
Transportation and by a privately funded group. Either of these plans would allow rail

47
passengers the opportunity to transfer to a light rail system to travel to the downtown
area.
The layout of the Detroit area rail system is the major reason for the location of the
existing and proposed station site. It has significant advantages in terms of rail
operations and regional connectivity for existing and future services. A location closer
to the downtown area would be desirable but does not seem feasible given the rail
system configuration. A concern with the current location, especially for commuters, is
that a transfer to another mode will be required to access the downtown area. While
this is possible today by bus and possibly by light rail in the future, it does cause
additional travel time, cost and inconvenience to travelers.
5.4 St. Joseph: A possible tourist destination
There are major expansion plans around the station area that will be funded mostly from
private sources, with some state\local funding. These plans focus on increasing St.
Joseph’s reputation as a tourist and recreational center and include:
Silver Beach Memory Project ($20 million) which will include a Curious Kids Museum, a
carrousel, an interpretive fountain, and a miniature convention center. Harbor Shores
Project within walking distance will be an ambitious project that will have an 18 hole
Jack Nicholas Signature golf course, boutique hotel, and 850 housing units with mid-
size condo towers. The golf course is expected to open soon but the other parts of the
project may take five to seven years.
The major expansion projects around the station area, along with walking access to the
beach, should make it a more viable tourist destination, especially on weekends.

48
5.5 New Buffalo: A retirement\vacation homes complex
Since the inception of the Pere Marquette Service in 1984, New Buffalo has been
served by one round trip daily, utilizing a bus shelter facility on the edge of an
abandoned rail yard, about ¾ mile south of the community’s downtown and marina
district. Amtrak’s Wolverine corridor runs through the marina district, but no passenger
trains have made stops there in a number of decades. A real estate developer is now
constructing a replacement station in the marina district, and Amtrak indicates at least
two Wolverine Service round trips will be accommodating New Buffalo passengers.
Existing service on the Pere Marquette line will be terminated when the new platform is
operational and Wolverine service begins.
With the new train station, extensive real estate development, and a golf course, there
is a good chance that New Buffalo could be a major focal point for retirement homes or
second homes, with relatively quick access to Chicago.
Most of the shops\restaurants are within walking distance of the new station. There are
an estimated 3000 housing units that will cluster around the New Buffalo area and all of
these residences would benefit from the train access to and from Chicago—62 miles
away. These residences are mostly condominiums and town homes -- many of them
with lake and golf course views.
Most of the funding for the proposed station site and around the station has been from
private funds. Besides relocating the station closer to the lake and the new
condominium developments, there are some projects to re-vitalize the downtown area.
One of them is the Fountain Square Project across from the proposed station site that
will help to increase activity close to the station.
The key issue for the success of the new station would be the density of mixed housing
around the area. The developer indicated that he is obtaining considerable interest
from Chicago clients on these new homes\condos.
49
5.6 Kalamazoo: A broad multi-modal network
The station is truly multi-modal with strong connections to local transit and Indian Trails
and Greyhound intercity bus services. The plans are to expand the multi-modal
framework beyond the City of Kalamazoo to a larger part of the county with the
establishment of a countywide transit entity. The existing multi-modal transportation
center is adjacent to the Kalamazoo downtown area and has bus bays for local transit
as well as intercity buses. The former train station has been renovated to provide
indoor waiting, restroom, convenience shopping and other facilities for both bus and rail
passengers. The transportation center is owned by the City of Kalamazoo and
managed by Metro Transit. This transportation center provides an excellent example of
a multi-modal facility designed to meet the needs of the different modes. The perceived
benefits are many in terms of making the downtown area more connected and vibrant.
The goal is to link the train service with other modes of transportation. Without the train
service anchor, this would not be possible.
It should be emphasized that this station is able to develop a multi-modal framework
because it has sufficient population density/commercial activity around the station in
downtown Kalamazoo and one of highest levels of intercity train and bus activity in
Michigan.
Metro Transit is a large organization employing about 130 persons. They have an
administrative and maintenance facility adjacent to the station. Total operational
expenditures for the station are approximately $180,000 annually. The tickets for Indian
Trails and Greyhound are sold by Metro transit ticket agents on a commission basis.
This commission revenue is about $80,000. Other sources of revenue include
concession stand lease income.
Kalamazoo represents a good model for a wide multi-modal framework that increases
the economic vibrancy of a broader region.
50
6.0 Community Benefits of New Station Development
In situations where a new Amtrak station is to be developed, there is the opportunity for
numerous economic benefits to the community. These benefits may take many forms
including local job creation, increased property values, new residential and commercial
construction, and creation of new businesses in the areas surrounding the station
development.
The primary analysis of economic benefits from new station
development/redevelopment has been through studies of Transportation Oriented
Developments (TODs) throughout the US. These studies generally focus on commuter
rail service in densely developed corridors. However, many of the same types of
benefits could accrue to Michigan Amtrak stations and could be enhanced by
improvements to the station locations and levels of service.
Types of economic benefits:
6.1 Increased employment from station construction.
The construction or redevelopment of a station provides direct construction jobs and
results in the creation of spin off jobs in the local economy. A station construction cost
of $10,000,000 will result in the creation of an estimated 90-140 new jobs and
$5,000,000 in additional spending in the local economy. These are much more
conservative values compared to APTA values shown in Chapter 7. The difference is
that this research only includes direct construction impacts and does not include future
developments based on business stimulation.
6.2 Increased property values.
Estimates from TOD studies throughout the country indicate a wide variation in
property value increases for property within ¼ mile of the station development. The

51
range for residential property is 2% to 45% and for office/retail 1% to 167%.1
6.3 New development of adjacent land.
The
situation for Amtrak stations is somewhat different from many urban light rail systems
since Amtrak generally operates on rail freight lines. This may make residential
proximity somewhat less desirable. However, creative land use planning and an
increase in the level of public transportation services to a site can increase the
desirability and value of adjacent property.
Creating a transportation focal point can be a stimulus for new development of various
types. The location of a station and its surrounding land use is key. A site that is
surrounded by public land has the potential for development by the municipality or by
the municipality in conjunction with a private developer. Stations with little available
vacant land or with incompatible surrounding land uses have limited potential.
Municipalities working with local developers throughout the station development
process can insure that the benefits of the new location are maximized. Estimates from
the Birmingham/Troy station relocation currently under study suggest that the proposed
multi modal station development under optimal conditions could generate up to 300,000
square feet of retail development and 290 new residential units.
6.4 Increases to the local tax base.
As property values increase around a station development, additional property tax
revenue will be generated. These increases can be leveraged by local governments
through the use of assessment districts, Tax Increment Financing (TIF), development
fees, and leveraging public land value through joint development projects with the
private sector.
6.5 Factors affecting development:
Although the above are potential benefits for all station developments, the extent to
which they are realized can be increased or limited by the following:
1 “Capturing the Value of Transit” by Reconnecting America’s Center for TOD. 2008
52
6.51 Overall regional economic strategy
The literature on the economic impact of train stations demonstrates that ambitious
station plans are necessary but not sufficient by themselves to make a major difference
in a region. There has to be an overall economic strategy for the region that is based
on some kind of comparative advantage or “hook” the region can develop to increase
ridership and commercial activity. The critical component is effective long-term station
area planning within the context of an overall regional economic plan for developing a
viable TOD.2
6.52 Surrounding land use.
As in other real estate related situations, location is a primary consideration. Adjacent
land uses can severely limit development potential because of either incompatible uses,
or the lack of vacant land for new development. New commercial or residential
development is also enhanced by proximity to existing centers of urban activity such as
restaurants, shopping, and housing. The current locations of Michigan’s Amtrak
stations are the result of a variety of factors such as historical location and availability of
land and were not always the result of coordinated local planning, thus some locations
are not optimal.
6.53 Frequency of passenger rail service.
As discussed in Chapter III, new development is driven by increased activity in and
around the station site. As already noted, successful TOD occurs where frequent
passenger service generates large numbers of users. Currently this is a significant
issue for Amtrak stations, many of which have only one round trip per day. The
proposed relocation of the Dearborn station, which currently has three round trip trains
per day, is predicated on the implementation of additional commuter service that would
2 Transit-Oriented Development in the United States: Experiences, Challenges, and Prospects, TCRP Report 102, Transportation Research Board, 2004.

53
bring daily usage up to about 1,000 passengers per day by the addition of several
additional daily round trips between Ann Arbor and Detroit.
6.54 Access to the station.
Another way to increase ridership and station activity is to insure there is easy access to
the station for potential users. This includes coordination with local and regional bus
services in terms of schedules and physical access to the station for boarding and
unloading passengers. The walkability of the adjacent community can provide a better
opportunity to integrate the station development with the community. This should
include safe, convenient access to the station area for pedestrians and bicycles. Roads
providing direct access to the station should be kept in good condition and adequate
directional signing provided within the community.
7.0 Literature Review of Economic Impacts
An analysis of past studies on train stations and transport linkages reveals that most of
the literature falls in two broad categories.
The first category includes analysis of transport corridors in high-density areas and how
that leads to a wide variety of economic and social benefits. This type of high-density
analysis has been termed Transit-Oriented Development (TOD) by the national
Transportation Research Board (TRB).
Although the investigation of the economic impact of 22 Amtrak stations in Michigan
clearly does not fall in this category, it is useful to catalogue the benefits and the policy
lessons from these investigations since they focus on the economies of scale and scope
that can eventually accrue in the long run if a critical mass of development takes place
around the station areas. Moreover, the policy implications that are analyzed in these
studies are relevant even for lower density transit systems in order to achieve the next
higher level development and traffic density.

54
The second category of studies is about proposed and existing transportation systems
that involve less density and smaller regional development areas. This type of analysis
would be more in line with the present study of 22 Amtrak stations in Michigan. These
types of studies, for lack of a better term, can be termed Community Impact Studies
(CIS). It has been important to review these studies to glean different methodological
insights that can be employed for the present investigation.
One other methodological issue needs to be discussed. It is difficult to analytically
separate the projected benefits that may accrue because of the rail stations per se and
the benefits that involve higher ridership levels. The studies discussed in this section
tend to estimate the benefits that accrue to the transit system without making an explicit
distinction between rail stations and ridership.
7.1 Lessons from Major Transit Oriented Development (TOD)
The most authoritative analysis of high-density transportation corridors has been
performed by the Transit Cooperative Research Program of the Transportation
Research Board (TRB, TCRP Report 102, 2004). This more than 500 page report
analyzes different aspects of major TOD projects. Topics discussed include the policy
environment that promotes TOD, how to finance and remove barriers, the direct and
indirect benefits, and case studies of major transportation systems. The detailed case
studies relate to ten major high-density transportation areas: Boston, New Jersey’s
transit villages, Washington D.C., Miami-Dade County, Chicago, Dallas, Mountain West
Colorado, Portland, San Francisco Bay Area, and Southern California. The discussion
in this section is based primarily on the TCRP Report 102.
The TRB catalogues the benefits of TOD as follows:
Primary Public Sector Benefits
• More ridership and fare revenues

55
• Economies of scope between rail, air and bus opportunities
• Resurgence of economic growth in neighborhoods
• Broad based economic development
Primary Private Sector Benefits
• Appreciation of land values and real estate improvement
• Better housing opportunities for mixed income
Secondary Public Sector Benefits
• Reduced traffic congestion, fuel use and pollution
• Higher property\sales tax revenues
• Limiting sprawl and conserving open areas
• Lower road and infrastructure expenditures
• Less crime, more social capital and public engagement
Secondary Private Sector Benefits
• Higher retail sales
• Better access to more integrated labor supply
• Lower parking expenditures
• More physically active lifestyles
There is obviously significant overlap between these benefits and one could argue that
some of the benefits classified as primary are actually secondary. However, what the
detailed analysis of many high density transportation corridors makes clear is that these
benefits are significant and substantial. In fact, any regional transportation system
needs to analyze the policy imperatives of how a higher density development can take
advantage of this extended list of benefits that tend to progressively accumulate
because of economies of scale and scope.

56
7.2 Policy Implications and lessons of the TRB report
Most respondents in the TCRP report point out that local area governments need to
resolve specific development obstacles in order to encourage working with private
sector stakeholders. These obstacles typically include an agreement about the
appropriate mix of land uses around rail stops, parking standards, and developing joint
plans that capitalize on the synergy between rail, city, and regional bus systems.
The TCRP report emphases that one critical piece is effective long-term station area
planning within the context of an overall regional economic plan for developing a viable
TOD. The general development plans have to be supported by station area plans that
typically try to increase customers by:
• Promoting interdependent land uses by mixed zoning
• Identifying open space and pedestrian walkways that are conducive to
development
• Developing growth oriented building and parking code policies
• Providing synergies with other non-rail transportation opportunities such as city
buses, intercity buses, and taxis.
Previous investigations indicate that people who reside near large rail stations are
typically 5 to 6 times more likely to use the rail system compared to those who reside far
away. For this reason, it is essential to focus on the following:
• Creating the conditions that allow more self-selection is critical. Persons typically
choose to live close to stations for life style reasons. Typically, self-selection can
explain up to 40% of the increased ridership around a TOD.
• In order to provide opportunities for self-selection, one increasing trend is the
conversion of park-and-ride lots to mixed-use, moderately dense housing
developments. The TCRP report indicates that 20% of the properties around
transit areas are planning to move in this direction.

57
• It is important to improve access to stations by the creation of walk-friendly
designs that are aesthetically pleasing.
• It has been shown that promoting more office\retail projects around rail stations
significantly increases rail boardings and alightings. Some of the models for the
Arlington County (Virginia) region demonstrate that every 100,000 sq. ft of
additional office\retail space during the 1985-2002 period resulted in an increase
of approximately 50 boardings\alightings per day.
One of the major impediments of developing a viable TOD is a lack of consensus
among the major stakeholders due to conflicting expectations. It is important to arrive at
a public-private sector consensus and understanding on a fair share of the projected
risks and rewards for the major participants. The reason why this is difficult is that
different stakeholders tend to have somewhat conflicting goals and motivations for a
TOD. Typically, transit authorities are drawn to TOD mainly to increase public sector
revenue so that the project can be funded for the long term. Other public stakeholders
involved in TOD, such as state and city officials, tend to focus on the broader benefits
that may accrue. These benefits include reducing sprawl, increasing growth
opportunities, a wider set of housing choices, and creating employment opportunities.
On the other hand, private stakeholders are typically interested in a viable rate of return
on their financial investments. Ensuring that the matrix of the risk\return payoffs is
perceived as equitable and viable for the different stakeholders is an ongoing major
issue. In neighborhoods that are facing significant economic challenges, a lack of
consensus about the distribution of risks and return payoffs can often be a major
impediment.
There is a widespread consensus that TOD is primarily a “bottom-up” enterprise.
Regional governments are in the best position to bring projects to a successful
conclusion because of their ability to raise funds. Transit authorities can best aid the
development of TOD by providing reliable quality rail and bus service. An important
component of the “bottom-up” approach is to have a viable network of financiers and
developers. There was uniform consensus among stakeholders that state and federal

58
governments need to provide a nurturing and effective financial, legislative, and
institutional framework for TOD to achieve a critical mass.
7.3 APTA report about economic impact
A report undertaken by Cambridge Systematics, Inc. for the American Public
Transportation Association (APTA, 1999) made a comprehensive economic benefit
analysis of the national public transportation system. Their major findings were:
• An investment of $10 million in transit capital investment would create 314 jobs,
business sales of $30 million, and a saving in transportation expenditures of $15
million which includes fuel savings and less congestion.
• An investment of $10 million in transit expenditures related to operations will
generate 570 jobs and $32 million in sales.
• Transit investment typically accumulates significant positive business impact over
the years. A continued and sustained $10 million transit program investment will
create $2 million in business output and $0.8 million in personal income annually
even in the short run.
Although these broad-brush national averages typically apply to high traffic density
areas, they indicate that the benefits can be substantial. The extent of these impacts
will also be correlated with the amount of traffic density. There are also spillover effects
from one region to another because of the inter-dependence between regions in an
integrated economy. Consequently, the national profile estimates tend to incorporate
not only the benefits of higher density but also the regional spillover effects from the
adjacent areas.
One thing these national studies make clear is that the impact of a TOD depends
critically on the economic base that it serves and seeks to extend to the next level. It is
difficult to analyze the economic impact of train stations without taking into account the
economic conditions around the region. These economic conditions include overall

59
performance measures such as income per capita, job opportunities, and the skills of
labor force.
7.4 Community Impact Studies (CIS)
There have been several regional studies on train systems that are less well known at
the national level. Most of these studies are limited by the availability of regional data.
A community impact study of the Kenosha-Racine-Milwaukee (KRM) Commuter Rail
Project (2007) was performed by the University of Wisconsin, Milwaukee. The study
found that the impact of the KRM commuter rail would be substantial. Initially, it
included the creation of 4,700 jobs with a $560 million impact during construction.
During the project operation and maintenance phase, the impact was more modest: 126
jobs and $24 million annual impact. The project anticipated a significant increase of
tourism from northeastern Illinois to southeastern Wisconsin. A significant increase in
property values in the range of 4% to 20% was also expected. The indirect impact was
calculated by using the Bureau of Economic Analysis RIMS II final demand multipliers.
Of particular note was the expected Transit Oriented Development (TOD) within half a
mile of the nine KRM stations. This included:
• Approximately 23,000 units for living
• An increase in retail space of 7.6 million square feet
• An increase of 4.7 million square feet of office space
• 71,000 employment opportunities
• An appreciation of property values by $7.9 billion
It was anticipated that 20 to 50 percent of this development\expansion would not take
place in the absence of KRM commuter rail. However, this broad estimate of the
indirect economic impact is based on the national profile of the APTA report discussed
above and a case study of the San Diego Area. Although, the range of expected

60
benefits are quite wide, it is not entirely clear how applicable the APTA national baseline
estimates may be for a regional transportation system with lower traffic density.
The KRM study is based on a previous, more comprehensive analysis performed by
HLB Decision Economics for the Wisconsin Department of Transportation (2003). An
important methodological insight of this study was to analyze the benefits of transit
services by the purpose of the visit. This study found:
• Largest proportion of the trips was related to work (48%) which resulted in a total
savings of $333 million. Most of these savings came from a reduction in
transportation costs and reduction in public assistance programs.
• About 23% of the trips were related to education, resulting in a savings of $91.3
million.
• About 10.5% of the trips were related to health care which resulted in a savings
of $193 million. Most of this saving was in transportation costs, although there
were significant reductions in home health care costs of about $59 million that
are included in the total.
• Approximately 18% of the ridership was for shopping, recreation, and tourism.
The total savings attributed to this category was $113 million.
The main methodological improvement in this study is to attribute an opportunity cost
value to the trips that would not be made in the absence of the transit services for each
trip purpose.
The percentage of commuters that would not have made the trip varied depending upon
the purpose of the trip:
Work related: 18.5%
Medical purposes: 13.7%
Education: 12.6%
Recreation\shopping: 11.7%
61
It is not surprising that the lowest percentage of forgone trips is for recreation and the
highest is related to work and medical purposes. The opportunity costs of foregone
travel are divided into two components. One is to estimate the cost of the lost trips that
are not made for specific purposes such as work, health care, or education. The
second indirect impact is on the quality of life that has general societal benefits. These
sector specific overall costs of foregone trips are significant.
An economic impact study of Amtrak’s Downeaster service prepared by the Economic
Development Research Institute for Maine DOT (2005) estimated that the overall
economic benefits to Maine and New Hampshire would amount to approximately $15
million dollars annually. This overall increase had the following components:
Visitor Spending: $3.5 million
Economic Development Impact: $4.4 million
Savings by using Downeaster: $0.7 million
Spin-off activities: $6.5 million
These benefits were expected to generate 240 jobs and personal income of $4.7
million. One time construction benefits of $1.3 million were estimated. It was expected
that the projected benefits by 2015 would exceed $100 million a year.
The authors of the study emphasized that in 2005 the Downeaster rail service did not
have the attributes of a commuter rail system. By 2008, the rail line had a more
frequent service (such as 5 daily round trips from Boston and Portland) and another
study was conducted by the Center for Neighborhood Technology (CNT) in 2008 to
estimate the Transit Oriented Development potential. It noted that Downeaster ridership
had increased significantly by 32% in 2006, 5% in 2007, and 20% in 2008. Several
significant hotel and office developments had taken place. Based on recent trends in
the area and an optimistic prediction that by the year 2030 approximately 27% of the
population in the Maine counties would be located in TODs around the rail stations, the

62
study projects that this will result in the approximately $244 million transportation cost
savings per year.
It also projects the following benefits accumulated over 22 years:
• Construction investment of around $7.2 billion
• Creation of 17,800 employment opportunities
It should be noted that these optimistic projections are based on the national projection
that approximately 27.4% of the population that moves into metropolitan areas in the
U.S. served by small but growing public transit systems, tend to cluster around the TOD
areas. These projections are likely to be quite sensitive to this underlying assumption.
It is not entirely clear whether this ambitious program would be realized.
7.5 Implication of previous empirical investigations
There are several methodological implications for our analysis that flow from these
recent empirical studies that have been reviewed:
1. The direct and indirect benefits are sensitive to the traffic density of the rail
stations. Stations that have a significantly larger volume of passengers tend to
generate a wider array of benefits because of economics of scale and scope.
2. Long-term benefits of train stations are tied ultimately to the comprehensive
regional development around the area. In particular, trends such as population
density, employment, commercial developments, and availability of mixed
housing around the stations tend to impact long-term benefits.
3. In the absence of reliable regional estimates, many studies have relied on the
national profile estimates. Our analysis of the economic impact of Michigan’s 22
Amtrak stations employs regional data as much as possible.
4. Empirical studies on projected benefits are based on different methodological
frameworks that measure opportunity costs in different ways. However, the more
comprehensive studies tend to estimate the benefits foregone for passengers
63
that would not make the trip in the absence of the rail stations. It is important to
take into account the opportunity costs of foregone trips.
5. The projected benefits of these studies are, at best, broad estimates at a point in
time. These estimates are sensitive to the underlying assumptions such as the
demographic and economic profile of the regions, the prices of fuel, labor and
other antecedent costs. Consequently, it is desirable to eschew point estimates
and generate estimates that are associated with different confidence levels.
References for this section:
Amtrak Downeaster: Overview of Projected Economic Impacts, Center for
Neighborhood Technology, Chicago, 2008.
Community Economic Impact Study of the Proposed Kenosha-Racine-Milwaukee
(KRM) Commuter Rail, Institute for Survey & Policy Research, University of Wisconsin-
Milwaukee, January, 2007.
Economic Benefits of Amtrak’s Downeaster service, Economic Development Research
Group, Boston, February 2005.
Public Transportation and the Nation’s Economy. A Quantitative Analysis of the Public
Transportation System, Cambridge Systematics, Inc. October 1999.
The Socio-Economic Benefits of Transit in Wisconsin, HLB Decision Economics, Inc,
Silver Spring, Maryland, December 2003.
Transit-Oriented Development in the United States: Experiences, Challenges, and
Prospects, TCRP Report 102, Transportation Research Board, 2004

64
8.0 Appendices

65
8.1 Station development perspectives
A brief description and photograph of each of the stations is provided to give the reader
a sense for potential development opportunities.
Port Huron. This Amtrak owned station was built in the 1970’s. It is
somewhat isolated from the community in an industrial area and is unlikely to
be much of a catalyst for development at its present location.

66
Flint. This is a modern station housing both Amtrak and intercity bus service
providers. It is owned and operated by the Flint MTA. The station building is
located in the MTA compound and has ample parking and security. The
potential for adjacent development is limited because of the isolation of its
present location.

67
Lapeer. This restored station, originally built in 1900, is located in a
commercial/industrial area. The station was recently painted and improved
and has a community meeting room. It represents a good example of a small
town depot that meets the needs of a smaller community.

68
Durand. This large historic brick structure was built in 1905 to serve the
needs of a railroad-oriented community. Durand was a major railroad junction
point and the building housed railroad offices as well as serving the needs of
the many passenger trains. This station is owned by the City of Durand and
contains a railroad museum as well as space for Amtrak passengers. It is
located on a large parcel of land but is somewhat isolated from the downtown
area by very active rail lines that require a circuitous route to gain access to
the station area.

69
East Lansing. The station is located in a former warehouse owned by
Michigan State University. The area surrounding the station is very
congested with busy rail lines and heavy street traffic that causes access
problems and limits development potential. The station is located near the
Trowbridge Road/US-127 interchange and adjacent to Michigan State
University.

70
Grand Rapids. This station is located in a small building that was renovated
in 2008 by a state grant to the West Train organization. It is located on a
small parcel of land with somewhat limited on-site parking but with a satellite
parking lot nearby. The immediate area is industrial/heavy commercial with
heavy traffic and a layout that results in streets blockages when trains are
loading and unloading.

71
Holland. The Padnos Transportation Center represents a fine example of a
restored older station. It is the community’s intermodal facility for the local
transit agency and Indian Trails as well as Amtrak. The overall environment
and the condition of the station make this a pleasant place to board or
deboard the train.

72
Bangor. The City of Bangor recently renovated this station originally
constructed in 1926, and in addition to an Amtrak waiting room, it contains
offices and a coffee shop. The station is about a block from the downtown
area.
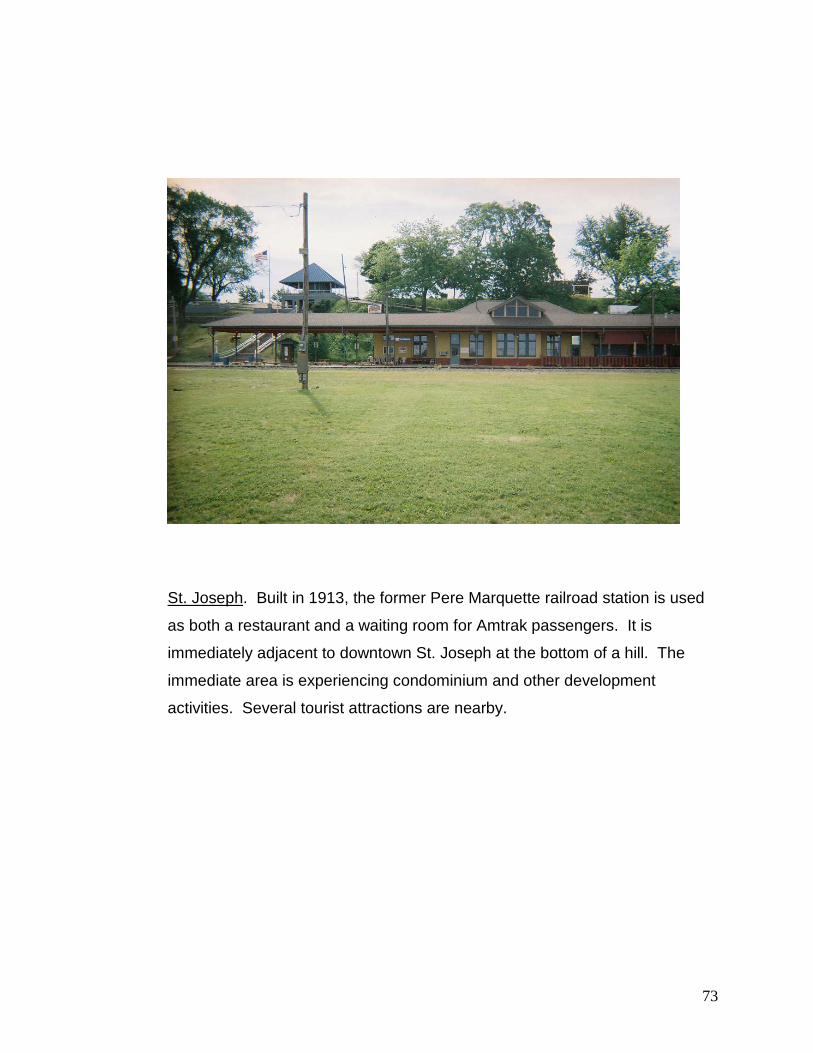
73
St. Joseph. Built in 1913, the former Pere Marquette railroad station is used
as both a restaurant and a waiting room for Amtrak passengers. It is
immediately adjacent to downtown St. Joseph at the bottom of a hill. The
immediate area is experiencing condominium and other development
activities. Several tourist attractions are nearby.

74
New Buffalo. A new station is being built in 2009 on the Wolverine line by a
private developer. It is located immediately adjacent to downtown as well as
a marina and several large condominium projects. The developer expects to
attract sales from Chicago residents because of the short commute to and
from Chicago.

75
Pontiac. The former intermodal center building has been removed and an
interim modular building is currently being used for intercity bus and Amtrak
passengers. A new station building is planned. The general area is relatively
close to downtown Pontiac and adjacent office buildings.
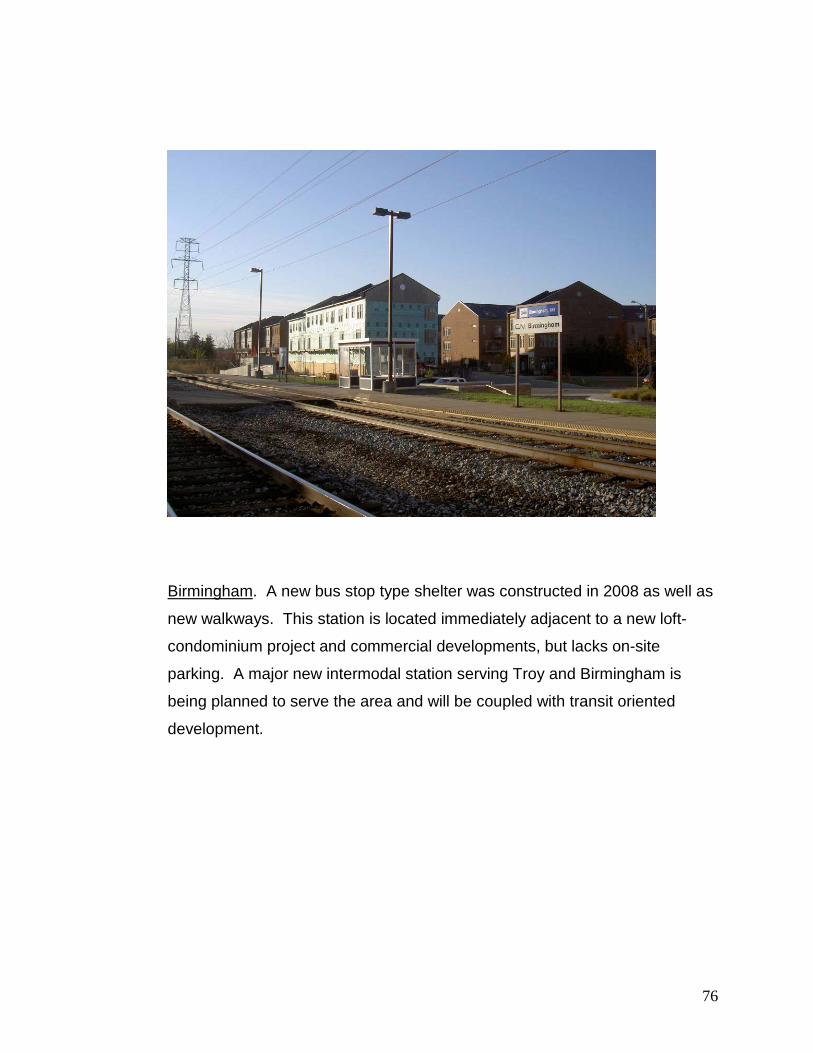
76
Birmingham. A new bus stop type shelter was constructed in 2008 as well as
new walkways. This station is located immediately adjacent to a new loft-
condominium project and commercial developments, but lacks on-site
parking. A major new intermodal station serving Troy and Birmingham is
being planned to serve the area and will be coupled with transit oriented
development.
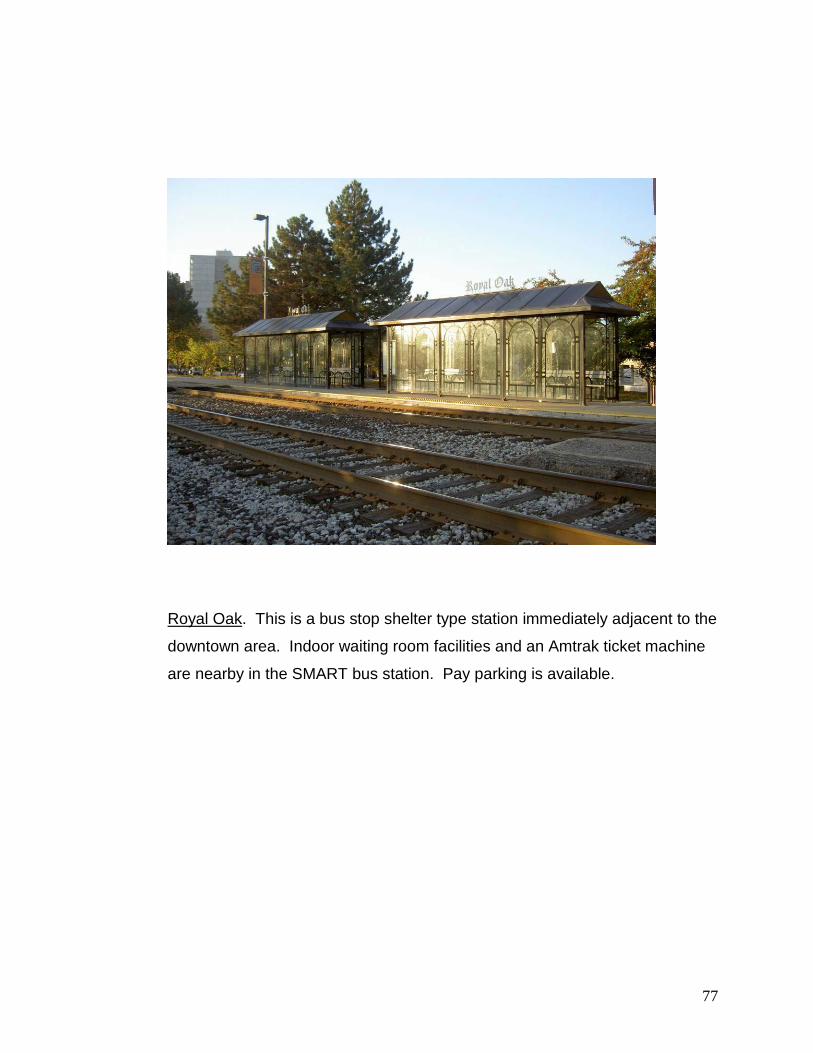
77
Royal Oak. This is a bus stop shelter type station immediately adjacent to the
downtown area. Indoor waiting room facilities and an Amtrak ticket machine
are nearby in the SMART bus station. Pay parking is available.

78
Detroit. This is a modular building constructed in the 1990’s. It is located on
Woodward Avenue, a major north-south thoroughfare in the region. It is
about three miles from downtown Detroit but is adjacent to the Detroit New
Center, a major office/commercial area that was formerly the world
headquarters of General Motors Corporation. There is long-term parking
available in adjacent parking ramps. There have been plans for many years
to replace this station with a new facility immediately south across the railroad
tracks.

79
Dearborn. The current station was constructed as an Amtrak facility in an
area surrounded by other city municipal buildings. There is ample short and
long-term parking but the station is isolated from the downtown business
areas of the city. The City has plans to relocate the station to a site adjacent
to both the western downtown area of the city and the Henry Ford-Greenfield
Village complex and to eventually construct a multimodal station.

80
Ann Arbor. The current station was constructed as an Amtrak facility and is
located on the edge of the downtown area. There is a large long term parking
facility that is separated from the station by the rail tracks requiring a walk
over a nearby bridge to access the station. There are several
bars/restaurants nearby.

81
Albion. This restored 1882 brick train station is also used by Greyhound and
is owned by the city and sub-leased to a private business. It is located in a
mixed industrial/commercial area.

82
Jackson. Built in 1873, this is Michigan’s oldest train station still in active
service. It has been renovated several times but its Italianate architecture is
from an earlier era. It is located in a commercial area near downtown
Jackson. Recent federal grants have been secured for rehabilitation of the
existing station buildings and long-term plans completed for conversion of the
facility to a multi-modal center.

83
Battle Creek. This modern station was built in the 1980’s near downtown
Battle Creek. It serves local and intercity buses as well as Amtrak.

84
Kalamazoo. The Kalamazoo Transportation Center is located in a renovated
and greatly expanded historic station on the edge of downtown. It is an
excellent example of a true multi-modal facility with space for local transit,
intercity buses, and Amtrak.
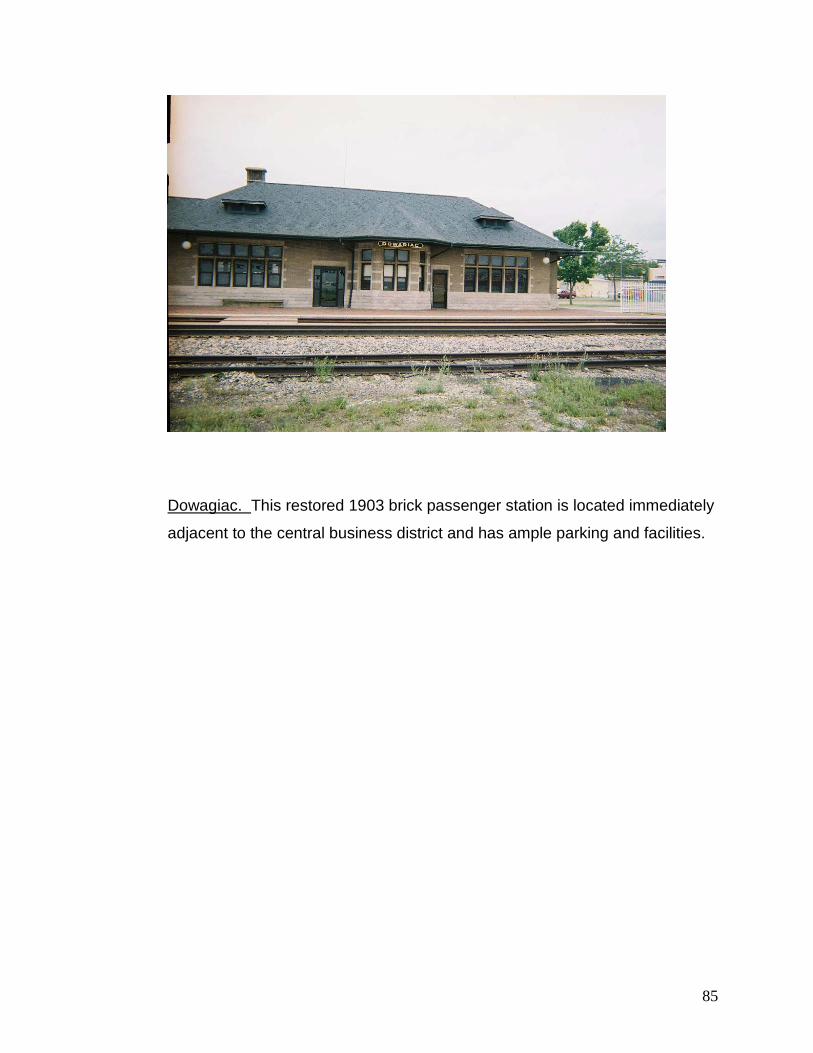
85
Dowagiac. This restored 1903 brick passenger station is located immediately
adjacent to the central business district and has ample parking and facilities.

86
Niles. Another restored historic station with outstanding Romanesque
architecture, built in 1892. The building also serves as a base for Amtrak
track and signal employees responsible for the Amtrak owned line between
Kalamazoo and Porter, Indiana.

87
8.2 Integration with MDOT’s Transportation Management System (TMS)
MDOT was originally interested in the integration of a local benefit assessment
process with their Transportation Management System. Because of budget
constraints this effort was eliminated from the current project with the thought that it
could possibly be done later if resources were available.
Direct integration of the “Community Benefit Summary” process may be possible.
The current Excel spreadsheet approach utilized station specific ridership managed
in TMS. It was manually taken from the TMS and inserted in the spreadsheet. It
served as the main driver for the calculations for each station. A computerized
process to directly transfer ridership from the TMS file to a spreadsheet file may be
feasible.
Experience with the spreadsheet approach also suggested that there might be ways
to simplify and automate the other calculations as well. Manual review of on-board
survey data was required for our process. This could be simplified by assuming that
shifts to alternative modes would be the same in communities with similar
demographics and modal service characteristics. The fare structures for bus and air
also created challenges and problems given the wide variance in fares between city
pairs. This could possibly be simplified and adjusted up or down on an annual basis
dependent on overall trends. These adjustments would generate good estimates
that should generally be adequate. A more in-depth review of assumptions could
occur every few years based on new on-board surveys or significant changes in
travel habits. A streamlined process integrated directly with the TMS could likely be
developed.

88
8.3 Induced multiplier effects of Amtrak Station related expenditures 8.31 Introduction.
To estimate the ultimate impact of expenditures on Amtrak stations, the over all direct
and induced expenditures must be combined. The induced effects happen because the
expenditures for Amtrak operations in Michigan and the expenditures by passengers
traveling on trains stimulate other industries. Typically, these induced effects arise
because of backward and forward linkages between industries. For instance, Amtrak
expenditures on materials to maintain their facilities stimulate other industries that
provide the materials. Some induced effects are changes in local spending that occur
because the Amtrak expenditures generate incomes for others that results in
subsequently more expenditures.
However, there are significant leakages from these induced effects. If Amtrak
purchases goods that are imported into Michigan, what ultimately accrues to the state
will be only the retail, wholesale, or transportation margins. Part of the money received
as income may actually be spent out of state or saved. Consequently, the ultimate
multiplier impact of Amtrak expenditures will be muted to some degree.
8.32 Types of Regional Multipliers
There are three major sources of regional multipliers.
1. The RIMS II model is based on detailed input-output tables from the Bureau of
Economic Analysis (BEA) of more than 500 industries and utilizes the BEA
regional economic accounts.
2. The REMI model includes not only an input-output model but also a simulation
process with econometric equations. In addition to BEA data, the REMI model
uses County Business Patterns (CBP) database to create a detailed regional
model.

89
3. IMPLAN builds a detailed input-output analysis based on BEA and County
Business Pattern data. It builds its linkages from the top (national) to the bottom
(local) levels based on a value added methodology.
Multipliers generated by these three models have two significant components:
1. The amount of demand and supply that is assumed satisfied within the region or
state. This is represented by the regional purchase components (RPCs)
2. The in-built linkages between one industry and another. This is represented by
an input-output matrix known as the national “A” matrix.
Typically, the way these two components are operationalized leads to significant
differences in multiplier estimates. The amount of goods made within the region
(location production columns in these input output models) decline as we move from
state to metro to rural areas. Consequently, statewide multipliers are typically larger,
followed by metro multipliers. The regional multipliers are smallest in rural areas
because the economy is less diversified and there are fewer linkages with other sectors.
An interesting article has compared the ultimate economic impact of transportation
expenditures utilizing three major regional economic models: RIMS II, REMI, and
IMPLAN, Lynch (2000). This article finds that an expenditure of $55.23 million on rail
transit results ultimately in a significantly larger impact based on the multiplier effects.
The ultimate overall impact on output generated by the different models is as follows:
RIMS II $90.7 million
IMPLAN $79.47 million
REMI $93.46 million
This controlled example of rail transit expenditures indicates that for this sector IMPLAN
generates the most conservative estimates compared to the other major regional model

90
methodologies. This study utilized the RIMS multipliers which are typically smaller than
the REMI multipliers.
In the public transportation sector, the IMPLAN model typically comes up with total
sales impact multipliers as follows:
Public Transportation Multipliers
Rural area 1.32
Metro area 1.47
Statewide 1.61
8.33 Multipliers for the MDOT study. This investigation employed the multiplier
generated by the RIMS model based on Bureau of Economic Analysis (BEA) data for
2006 at the county level. These multipliers are specifically for the rail transit sector.
County level data was put into economically similar groups to generate five regional
Type II multipliers .
Berrien, Kalamazoo, Cass and Van Buren counties:
New Buffalo, St. Joseph, Kalamazoo, Dowagiac, Niles, Bangor
Ingham, Calhoun, Jackson and Washtenaw counties:
East Lansing, Albion, Battle Creek, Jackson, Ann Arbor
Ottawa and Kent counties:
Holland, Grand Rapids
Lapeer, St. Clair, Shiawassee, Oakland and Genesee counties:
Lapeer, Port Huron, Durand, Royal Oak, Birmingham, Pontiac, and Flint
Wayne County:
Detroit, Dearborn

91
Station Multiplier Retail
Multiplier Rail
New Buffalo 1.6082 1.4265 St. Joseph 1.6082 1.4265 Kalamazoo 1.6082 1.4265 Dowagiac 1.6082 1.4265 Niles 1.6082 1.4265 Bangor 1.6082 1.4265 Holland 1.7543 1.5544 Grand Rapids 1.7543 1.5544 Lansing 1.5591 1.4483 Albion 1.5591 1.4483 Battle Creek 1.5591 1.4483 Jackson 1.5591 1.4483 Ann Arbor 1.5591 1.4483 Detroit 1.5998 1.4916 Dearborn 1.5998 1.4916 Royal Oak 1.8081 1.5817 Birmingham 1.8081 1.5817 Pontiac 1.8081 1.5817 Lapeer 1.8081 1.5817 Port Huron 1.8081 1.5817 Durand 1.8081 1.5817 Flint 1.8081 1.5817
References for this section:
Lynch, Tim, Oct. 2000, “Analyzing the Economic Impact of Transportation Projects
using RIMSII, IMPLAN, and REMI” Office of Research and Special Programs, U.S.
Department of Transportation, Washington, D.C.
https://www.msu.edu/course/prr/840/econimpact/michigan/MImults.htm

92
8.4 Local Community Survey Form
Michigan Passenger Rail Station Community Benefits Study
Survey of Community Benefits Associated with Passenger Rail Service Community: Name of person interviewed: Position: Date of interview: Interviewer: Could you describe the degree of support for passenger rail service in your community? Are there any official relationships between the station and any business or civic groups such as the Chamber of Commerce, service clubs, rail/historical society, etc. What are some of the perceived benefits to having service available to the community. Do you feel your community has greater opportunity for growth and development than a similar community without passenger rail service? Can you describe any specific businesses that benefit from having passenger rail service in the community (restaurants, lodging, taxis, gas stations, conference centers, retail stores. Have there been any recent expenditures on the station using state or local funding or any other funding source?

93
Is your community planning to upgrade or relocate your station to better serve the community? If so, please describe in detail what these plans are and how they are being coordinated with overall community economic development. Are partnerships being formed with local businesses and/or developers as part of this process? To what degree are local services used by Amtrak customers; such things as rental cars, taxi services, etc. Does the availability of passenger rail service provide mobility benefits to minority, low income or no-car households in your community? Is there any other person or organization that you would recommend we contact regarding the role of the Amtrak station in the community? Other Notes from the interview:

94
8.5 Notes from Table 4.2
1. Pg 16. 2000 Survey. There are differences between pg 44, pg 16 & later cross-tab table without page number. Value used represents a conservative approach. 2. Pg 39 of 2000 Survey. 70.9% travel between 0-15 minutes. 14.2% between 15-30 minutes. Assume 0-15 minutes =7.5 min average trip=about 5 miles at 45mph. Add longer trips for average of 10 miles. 10 miles x $.505=$5.05/1.8 occupants=$2.80/passenger. These people may purchase gas, insurance, new cars, etc. in the station community area. 3. Percentage total is less then 100% since some walk, bike or use bus to station. 4. Pg 7. 2000 Survey. 26.5% of passengers are non-Michigan residents. Assume only non-residents will use Michigan hotels. Assume 28% of travelers will use hotels (pg 15 assume 3% for convention, 10% for vacation, 5% for shopping, 7% for business, 3% for personal business). Thus 28% times 26.5%= 7.42% of travelers will use Michigan hotels. Use state rates for "select" cities. This is $65/ night for lodging at 4 nights=$260 and $38.50 at 4 days =$154 for meals. These are considered to be conservative values. Trip universe assumed to be half of total ridership (i.e., a person will travel by train to Michigan, stay in a hotel and return home by train--thus, two train trips for each hotel stay). 5. Page 15 indicates 19% of travelers have shopping as a primary trip purpose. Many trips are destined for Chicago. This assessment assumes 5 % of trips are shopping trips in Michigan. This is justified as 19% x 26.5%=5.04%. The value of $100 may be very conservative for a person that declares shopping as the primary trip purpose. Trip universe assumed to be half of total ridership (a person travels by train and returns by train for each shopping trip). 6. Travelers sometimes may eat meals or otherwise spend money in the station community prior to boarding or deboarding the train. Individuals waiting to pick-up passengers may also do this especially if the train is delayed. Ann Arbor is a good example of this. This assumes that the equivalent of 10% of travelers will eat meals in station community restaurants. 7. Station specific multipliers of 1.5591-1.8081 from RIMS II model. 4/30/2009

95
8.6 Statewide Community Benefit Summary Table STATEWIDE COMMUNITY BENEFITS SUMMARY TABLE
Summary of Community Benefits for Pere Marquette Corridor
NBM SJM BAM HOM GRR TotalTotal Savings for Pere Marquette travelers $27,166 $216,870 $40,503 $1,101,237 $1,422,603 $2,808,380Non-traveler Savings $187 $15,717 $11,029 $87,494 $231,310 $345,737Local Business Revenues $58,715 $246,569 $88,966 $1,310,778 $1,867,171 $3,572,199Amtrak Expenditures in Local Community $0 $0 $0 $0 $551,035 $551,035
Total Community Benefitsfor Pere Marquette Corridor $86,069 $479,156 $140,498 $2,499,509 $4,072,118 $7,277,351
Summary of Community Benefits for Blue Water Modified Corridor
LAN DRD FLN LPE PTH TotalTotal Savings for Blue Water Modified travelers $1,743,049 $440,157 $1,337,782 $338,831 $424,152 $4,283,972Non-traveler Savings $258,474 $49,804 $152,880 $33,703 $50,588 $545,449Local Business Revenues $1,386,289 $217,731 $794,118 $165,712 $379,014 $2,942,865Amtrak Expenditures in Local Community $108,623 $0 $118,628 $0 $1,721,839 $1,949,089
Total Community Benefitsfor Blue Water Modified Corridor $3,496,435 $707,692 $2,403,407 $538,247 $2,575,593 $9,721,374
Summary of Community Benefits for Wolverine Modified Corridor
NLS DOA KAL BTL ALI JXNTotal Savings for Wolverine Modified travelers $146,933 $21,977 $2,819,277 $1,924,423 $18,418 $897,968Non-traveler Savings $33,009 $4,862 $264,868 $209,825 $4,000 $98,199Local Business Revenues $534,123 $52,275 $3,687,160 $1,877,936 $28,836 $951,986Amtrak Expenditures in Local Community $4,258,103 $0 $213,975 $510,091 $0 $144,830
Total Community Benefits $4,972,168 $79,114 $6,985,281 $4,522,275 $51,253 $2,092,983
ARB DER DET ROY BMM PNT TotalTotal Savings for Wolverine Modified travelers $3,118,922 $1,779,739 $875,716 $515,533 $486,989 $266,209 $12,872,105Non-traveler Savings $586,582 $225,521 $202,470 $81,007 $57,359 $80,874 $1,848,575Local Business Revenues $4,990,835 $2,613,713 $1,989,591 $1,027,182 $754,791 $651,052 $19,159,480Amtrak Expenditures in Local Community $325,868 $335,610 $454,938 $0 $0 $4,890,142 $11,133,556
Total Community Benefits $9,022,206 $4,954,583 $3,522,715 $1,623,722 $1,299,139 $5,888,277 $45,013,716
Summary of Community Benefits for All Michigan Served Communities
Pere Marquette Blue Water Wolverine TotalSavings for Michigan Amtrak travelers $2,808,380 $4,283,972 $12,872,105 $19,964,456Non-traveler Savings $345,737 $545,449 $1,848,575 $2,739,761Local Business Revenues $3,572,199 $2,942,865 $19,159,480 $25,674,544Amtrak Expenditures in Local Communities $551,035 $1,949,089 $11,133,556 $13,633,680
Total Community Benefitsfor All Michigan Served Communities $7,277,351 $9,721,374 $45,013,716 $62,012,441

96
8.7 Individual Community Benefit Sheets Albion Community Benefits Summary
Traveler Savings Derived from Albion Amtrak Station2007 Rail Passenger Trips for Albion:
To/from Chicago Other ALI Originations Total*2007 one-way train trips 920 313 1,233Typical one-way train fare $28.91 $12.65Total train costs to users $26,594 $3,961 $30,555
Alternative Mode Trips if No Rail Passenger Service Existed:To/from Chicago Other ALI Originations Total
Intercity Bus - - -Air - - -Auto 641 218 860Would make trip by alternative mode 641 218 860Would not make trip 279 95 373
Cost of Rail Passenger Service for Those Who also Would Travel by Alternative Mode:To/from Chicago Other ALI Originations Total
Total one-way train trips 641 218 10,733Typical one-way train fare $28.91 $12.65Total train costs to alternative mode users $18,541 $2,761 $21,303
Costs for Alternative Mode Travel:To/from Chicago Other ALI Originations Total
Intercity BusTotal one-way bus trips - - -Typical one-way bus fare w/ground costs - - -Total cost to users - - -
AirTotal one-way air trips - - -Typical one-way air fare w/ground costs - - -Total cost to users - - -
AutoTotal vehicle trips @1.79 occupancy 358 122 480Cost for trip/vehicle $97.01 $40.68Cost for trip/occupant $54.19 $22.72Total costs @1.79 occupancy $34,762 $4,959 $39,720
Cost Summary for Rail and Alternative Modes:To/from Chicago Other ALI Originations Total
Total costs by alternative mode $34,762 $4,959 $39,720Total train costs to alternative mode users $18,541 $2,761 $21,303
Total Savings for Albion travelers $16,220 $2,198 $18,418
Non-traveler Savings $3,522 $477 $4,000
Summary of Community BenefitsMultiplier Total
Total Savings for Albion travelers $18,418 1.00 $18,418Non-traveler Savings $4,000 1.00 $4,000Local Business Revenues $18,495 1.56 $28,836Amtrak Expenditures in Local Community $0 1.45 $0
Total Community Benefits for Albion $51,253
* The total number of passengers using the Albion station in 2007 was 1,529; to avoid double counting, thetraveler benefits of 296 passengers detraining at Albion were assigned to their Michigan originating station.
(All calculations subject to rounding)

97
Ann Arbor Community Benefits Summary Traveler Savings Derived from Ann Arbor Amtrak Station2007 Rail Passenger Trips for Ann Arbor:
To/from Chicago To Kalamazoo Other ARB Originations Total*2007 one-way train trips 114,705 4,220 9,119 128,044Typical one-way train fare $38.17 $16.28 $11.83Total train costs to users $4,378,128 $68,681 $107,843 $4,554,652
Alternative Mode Trips if No Rail Passenger Service Existed:To/from Chicago To Kalamazoo Other ARB Originations Total
Intercity Bus 7,826 788 - 8,614Air 30,675 197 - 30,872Auto 50,269 985 6,358 57,611Would make trip by alternative mode 88,770 1,969 6,358 97,097Would not make trip 25,935 2,251 2,761 30,947
Cost of Rail Passenger Service for Those Who also Would Travel by Alternative Mode:To/from Chicago To Kalamazoo Other ARB Originations Total
Total one-way train trips 88,770 1,969 6,358 97,097Typical one-way train fare $38.16 $16.28 $11.83Total train costs to alternative mode users $3,387,706 $32,051 $75,188 $3,494,945
Costs for Alternative Mode Travel:To/from Chicago To Kalamazoo Other ARB Originations Total
Intercity BusTotal one-way bus trips 7,826 788 - 8,614Typical one-way bus fare w/ground costs $33.48 $21.49 -Total cost to users $261,997 $16,931 - $278,927
AirTotal one-way air trips 30,675 197 - 30,872Typical one-way air fare w/ground costs $83.64 $209.88 -Total cost to users $2,565,660 $41,333 - $2,606,993
AutoTotal vehicle trips @1.79 occupancy 28,083 550 3,552 32,185Cost for trip/vehicle $126.96 $50.00 $38.01Cost for trip/occupant $81.38 $27.93 $21.24Total costs @1.79 occupancy $3,565,431 $27,502 $135,014 $3,727,947
Cost Summary for Rail and Alternative Modes:To/from Chicago To Kalamazoo Other ARB Originations Total
Total costs by alternative mode $6,393,088 $85,766 $135,014 $6,613,867Total train costs to alternative mode users $3,387,706 $32,051 $75,188 $3,494,945
Total Savings for Ann Arbor travelers $3,005,382 $53,715 $59,825 $3,118,922
Non-traveler Savings $560,475 $13,116 $12,991 $586,582
Summary of Community BenefitsMultiplier Total
Total Savings for Ann Arbor travelers $3,118,922 1.00 $3,118,922Non-traveler Savings $586,582 1.00 $586,582Local Business Revenues $3,201,100 1.56 $4,990,835Amtrak Expenditures in Local Community $225,000 1.45 $325,868
Total Community Benefits for Ann Arbor $9,022,206
* The total number of passengers using the Ann Arbor station in 2007 was 141,558; to avoid double counting, thetraveler benefits of 13,514 passengers detraining at Ann Arbor were assigned to their Michigan originating station.
(All calculations subject to rounding)

98
Battle Creek Community Benefits Summary Traveler Savings Derived from Battle Creek Amtrak Station2007 Rail Passenger Trips for Battle Creek:
To/from Chicago Other BTL Originations Total*2007 one-way train trips 42,717 5,463 48,180Typical one-way train fare $27.97 $12.24Total train costs to users $1,194,840 $66,891 $1,261,731
Alternative Mode Trips if No Passenger Train Service:Total
Intercity Bus 7,935 - -Air 9,606 - -Auto 11,835 3,744 15,579Would make trip by alternative mode 29,376 3,744 33,120Would not make trip 13,341 1,719 15,060
Cost of Rail Passenger Service for Those Who also Would Travel by Alternative Mode:To/from Chicago Other BTL Originations Total
Total one-way train trips 29,376 3,744 33,120Typical one-way train fare $27.97 $12.24Total train costs to alternative mode users $821,706 $45,846 $867,552
Costs for Alternative Mode Travel:To/from Chicago Other BTL Originations Total
Intercity BusTotal one-way bus trips 7,935 - -Typical one-way bus fare w/ground costs $24.50 - -Total cost to users $194,406 - -
AirTotal one-way air trips 9,606 - -Typical one-way air fare w/ground costs $199.19 - -Total cost to users $1,913,453 - -
AutoTotal vehicle [email protected]/1.56 occupancy 6,612 2,133 8,745Cost for trip/vehicle $90.60 $39.90Cost for trip/occupant $58.08 $22.73Total costs @1.79/1.56 occupancy $599,013 $85,104 $684,116
Cost Summary for Rail and Alternative Modes:To/from Chicago Other BTL Originations Total
Total costs by alternative mode $2,706,872 $85,104 $2,791,976Total train costs to alternative mode users $821,706 $45,846 $867,552
Total Savings for Battle Creek travelers $1,885,166 $39,258 $1,924,423
Non-traveler Savings $200,814 $9,010 $209,825
Summary of Community BenefitsMultiplier Total
Total Savings for Battle Creek travelers $1,924,423 1.00 $1,924,423Non-traveler Savings $209,825 1.00 $209,825Local Business Revenues $1,204,500 1.56 $1,877,936Amtrak Expenditures in Local Community $352,200 1.45 $510,091
Total Community Benefits for Battle Creek $4,522,275
* The total number of passengers using the Battle Creek station in 2007 was 53,425; to avoid double counting, thetraveler benefits of 5,245 passengers detraining at Battle Creek were assigned to their Michigan originating station.
(All calculations subject to rounding)
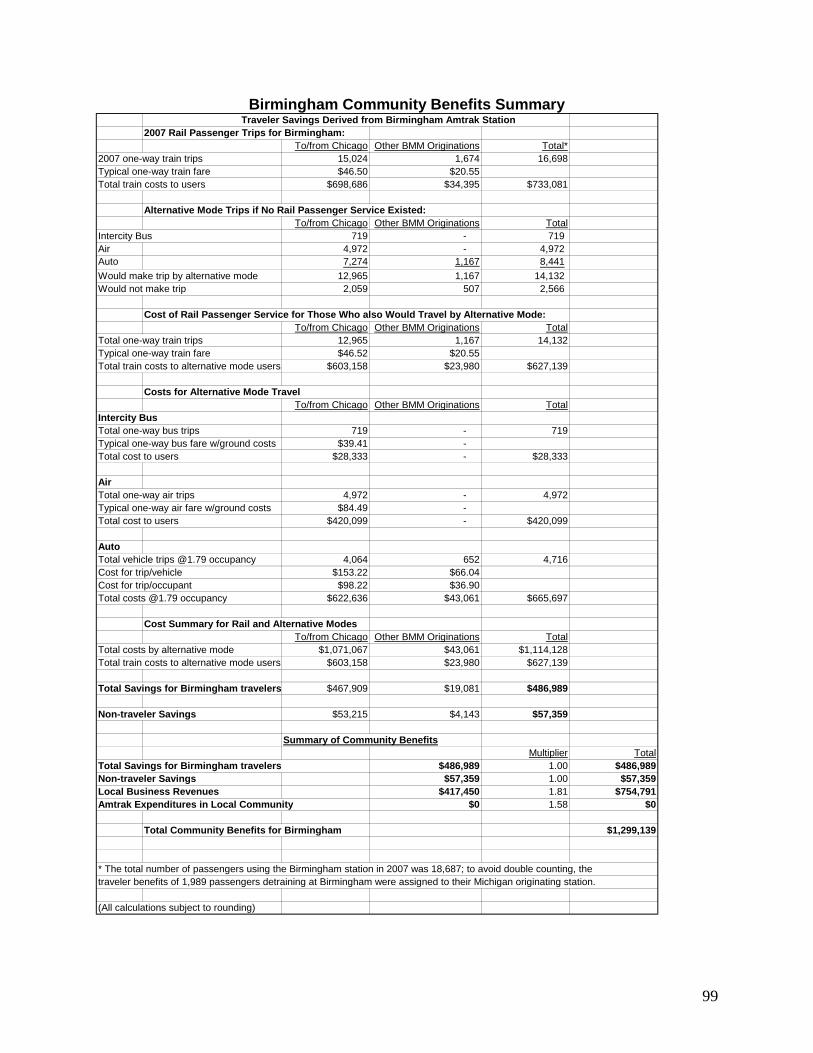
99
Birmingham Community Benefits Summary Traveler Savings Derived from Birmingham Amtrak Station 2007 Rail Passenger Trips for Birmingham:
To/from Chicago Other BMM Originations Total*2007 one-way train trips 15,024 1,674 16,698Typical one-way train fare $46.50 $20.55Total train costs to users $698,686 $34,395 $733,081
Alternative Mode Trips if No Rail Passenger Service Existed:To/from Chicago Other BMM Originations Total
Intercity Bus 719 - 719Air 4,972 - 4,972Auto 7,274 1,167 8,441Would make trip by alternative mode 12,965 1,167 14,132Would not make trip 2,059 507 2,566
Cost of Rail Passenger Service for Those Who also Would Travel by Alternative Mode:To/from Chicago Other BMM Originations Total
Total one-way train trips 12,965 1,167 14,132Typical one-way train fare $46.52 $20.55Total train costs to alternative mode users $603,158 $23,980 $627,139
Costs for Alternative Mode TravelTo/from Chicago Other BMM Originations Total
Intercity BusTotal one-way bus trips 719 - 719Typical one-way bus fare w/ground costs $39.41 -Total cost to users $28,333 - $28,333
AirTotal one-way air trips 4,972 - 4,972Typical one-way air fare w/ground costs $84.49 -Total cost to users $420,099 - $420,099
AutoTotal vehicle trips @1.79 occupancy 4,064 652 4,716Cost for trip/vehicle $153.22 $66.04Cost for trip/occupant $98.22 $36.90Total costs @1.79 occupancy $622,636 $43,061 $665,697
Cost Summary for Rail and Alternative ModesTo/from Chicago Other BMM Originations Total
Total costs by alternative mode $1,071,067 $43,061 $1,114,128Total train costs to alternative mode users $603,158 $23,980 $627,139
Total Savings for Birmingham travelers $467,909 $19,081 $486,989
Non-traveler Savings $53,215 $4,143 $57,359
Summary of Community BenefitsMultiplier Total
Total Savings for Birmingham travelers $486,989 1.00 $486,989Non-traveler Savings $57,359 1.00 $57,359Local Business Revenues $417,450 1.81 $754,791Amtrak Expenditures in Local Community $0 1.58 $0
Total Community Benefits for Birmingham $1,299,139
* The total number of passengers using the Birmingham station in 2007 was 18,687; to avoid double counting, thetraveler benefits of 1,989 passengers detraining at Birmingham were assigned to their Michigan originating station.
(All calculations subject to rounding)

100
Dearborn Community Benefits Summary Traveler Savings Derived from Dearborn Amtrak Station2007 Rail Passenger Trips for Dearborn:
To/from Chicago Other DER Originations Total*2007 one-way train trips 57,769 7,582 65,351Typical one-way train fare $42.87 $18.80Total train costs to users $2,476,594 $142,542 $2,619,136
Alternative Mode Trips if No Rail Passenger Service Existed:To/from Chicago Other DER Originations Total
Intercity Bus 3,519 - 3,519Air 19,783 - 19,783Auto 26,109 5,286 31,395Would make trip by alternative mode 49,410 5,286 54,697Would not make trip 8,359 2,296 10,654
Cost of Rail Passenger Service for Those Who also Would Travel by Alternative Mode:To/from Chicago Other DER Originations Total
Total one-way train trips 49,410 5,286 54,697Typical one-way train fare $42.86 $18.80Total train costs to alternative mode users $2,117,817 $99,380 $2,217,197
Costs for Alternative Mode Travel:To/from Chicago Other DER Originations Total
Intercity BusTotal one-way bus trips 3,519 - 3,519Typical one-way bus fare w/ground costs $36.03 -Total cost to users $126,773 - $126,773
AirTotal one-way air trips 19,783 - 19,783Typical one-way air fare w/ground costs $79.97 -Total cost to users $1,582,074 - $1,582,074
AutoTotal vehicle trips @1.79 occupancy 14,586 2,953 17,539Cost for trip/vehicle $144.64 $60.43Cost for trip/occupant $92.71 $33.76Total costs @1.79 occupancy $2,109,635 $178,454 $2,288,089
Cost Summary for Rail and Alternative Modes:To/from Chicago Other DER Originations Total
Total costs by alternative mode $3,818,482 $178,454 $3,996,935Total train costs to alternative mode users $2,117,817 $99,380 $2,217,197
Total Savings for Dearborn travelers $1,700,665 $79,074 $1,779,739
Non-traveler Savings $208,350 $17,171 $225,521
Summary of Community BenefitsMultiplier Total
Total Savings for Dearborn travelers $1,779,739 1.00 $1,779,739Non-traveler Savings $225,521 1.00 $225,521Local Business Revenues $1,633,775 1.60 $2,613,713Amtrak Expenditures in Local Community $225,000 1.49 $335,610
Total Community Benefits for Dearborn $4,954,583
* The total number of passengers using the Dearborn station in 2007 was 72,254; to avoid double counting, thetraveler benefits of 6,903 passengers detraining at Dearborn were assigned to their Michigan originating station.
(All calculations subject to rounding)

101
Detroit Community Benefits Summary Traveler Savings Derived from Detroit Amtrak Station2007 Rail Passenger trips for Detroit:
To/from Chicago Other DET Originations Total*2007 one-way train trips 42,589 7,157 49,746Typical one-way train fare $45.79 $18.80Total train costs to users $1,950,349 $134,552 $2,084,900
Alternative Mode trips if No Rail Passenger Service Existed:To/from Chicago Other DET Originations Total
Intercity Bus 9,930 - 9,930Air 11,626 - 11,626Auto 13,507 4,990 18,497Would make trip by alternative mode 35,063 4,990 40,053Would not make trip 7,526 2,167 9,693
Cost of Rail Passenger Service for Those Who also Would Travel by Alternative Mode:To/from Chicago Other DET Originations Total
Total one-way train trips 35,063 4,990 40,053Typical one-way train fare $45.81 $18.80Total train costs to alternative mode users $1,606,146 $93,809 $1,699,956
Costs for Alternative Mode Travel:To/from Chicago Other DET Originations Total
Intercity BusTotal one-way bus trips 9,930 - 9,930Typical one-way bus fare w/ground costs $33.50 -Total cost to users $332,656 - $332,656
AirTotal one-way air trips 11,626 - 11,626Typical one-way air fare w/ground costs $81.95 -Total cost to users $952,714 - $952,714
AutoTotal vehicle trips @1.79 occupancy 7,546 2,788 10,333Cost for trip/vehicle $148.68 $60.43Cost for trip/occupant $95.30 $33.76Total costs @1.79 occupancy $1,121,851 $168,451 $1,290,302
Cost Summary for Rail and Alternative Modes:To/from Chicago Other DET Originations Total
Total costs by alternative mode $2,407,221 $168,451 $2,575,672Total train costs to alternative mode users $1,606,146 $93,809 $1,699,956
Total Savings for Detroit travelers $801,074 $74,641 $875,716
Non-traveler Savings $186,261 $16,209 $202,470
Summary of Community BenefitsMultiplier Total
Total Savings for Detroit travelers $875,716 1.00 $875,716Non-traveler Savings $202,470 1.00 $202,470Local Business Revenues $1,243,650 1.60 $1,989,591Amtrak Expenditures in Local Community $305,000 1.49 $454,938
Total Community Benefits for Detroit $3,522,715
* The total number of passengers using the Detroit station in 2007 was 56,494; to avoid double counting, thetraveler benefits of 6,748 passengers detraining at Detroit were assigned to their Michigan originating station.
(All calculations subject to rounding)

102
Dowagiac Community Benefits Summary Traveler Savings Derived from Dowagiac Amtrak Station2007 Rail Passenger Trips for Dowagiac:
To/from Chicago Other DOA Originations Total*2007 one-way train trips 1,591 576 2,167Typical one-way train fare $16.02 $15.25Total train costs to users $25,495 $8,782 $34,276
Alternative Mode Trips if No Rail Passenger Service Existed:To/from Chicago Other DOA Originations Total
Intercity Bus - - -Air - - -Auto 1,109 392 1,502Would make trip by alternative mode 1,109 392 1,502Would not make trip 482 184 665
Cost of Rail Passenger Service for Those Who also Would Travel by Alternative Mode:To/from Chicago Other DOA Originations Total
Total one-way train trips 1,109 392 1,502Typical one-way train fare $16.02 $15.25Total train costs to alternative mode users $17,775 $5,982 $23,757
Costs for Alternative Mode Travel:To/from Chicago Other DOA Originations Total
Intercity BusTotal one-way bus trips - - -Typical one-way bus fare w/ground costs - - -Total cost to users - - -
AirTotal one-way air trips - - -Typical one-way air fare w/ground costs - - -Total cost to users - - -
AutoTotal vehicle [email protected]/1.56 occupancy 620 225 845Cost for trip/vehicle $55.60 $50.11Cost for trip/occupant $31.06 $28.75Total costs @1.79/1.56 occupancy $34,453 $11,280 $45,734
Cost Summary for Rail and Alternative Modes:To/from Chicago Other DOA Originations Total
Total costs by alternative mode $34,453 $11,280 $45,734Total train costs to alternative mode users $17,775 $5,982 $23,757
Total Savings for Dowagiac travelers $16,679 $5,299 $21,977
Non-traveler Savings $3,622 $1,240 $4,862
Summary of Community BenefitsMultiplier Total
Total Savings for Dowagiac travelers $21,977 1.00 $21,977Non-traveler Savings $4,862 1.00 $4,862Local Business Revenues $32,505 1.61 $52,275Amtrak Expenditures in Local Community $0 1.43 $0
Total Community Benefits for Dowagiac $79,114
* The total number of passengers using the Dowagiac station in 2007 was 2,782; to avoid double counting, thetraveler benefits of 615 passengers detraining at Dowagiac were assigned to their Michigan originating station.
(All calculations subject to rounding)
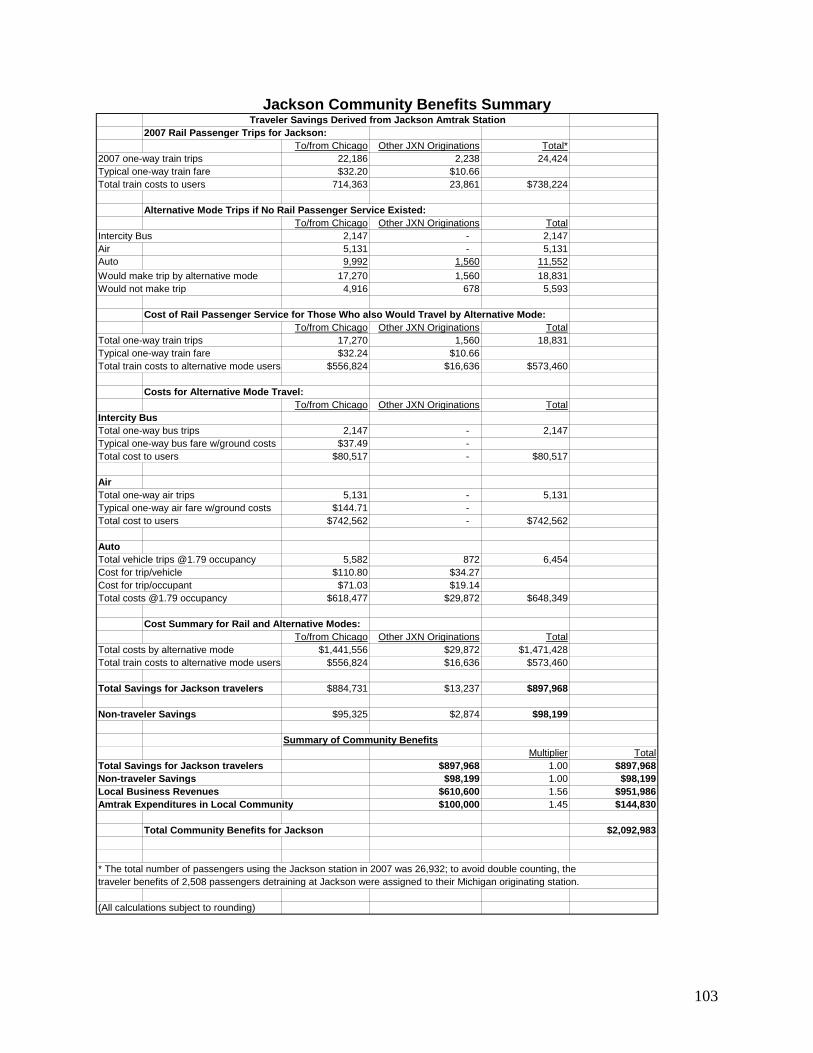
103
Jackson Community Benefits Summary Traveler Savings Derived from Jackson Amtrak Station 2007 Rail Passenger Trips for Jackson:
To/from Chicago Other JXN Originations Total*2007 one-way train trips 22,186 2,238 24,424Typical one-way train fare $32.20 $10.66Total train costs to users 714,363 23,861 $738,224
Alternative Mode Trips if No Rail Passenger Service Existed:To/from Chicago Other JXN Originations Total
Intercity Bus 2,147 - 2,147Air 5,131 - 5,131Auto 9,992 1,560 11,552Would make trip by alternative mode 17,270 1,560 18,831Would not make trip 4,916 678 5,593
Cost of Rail Passenger Service for Those Who also Would Travel by Alternative Mode:To/from Chicago Other JXN Originations Total
Total one-way train trips 17,270 1,560 18,831Typical one-way train fare $32.24 $10.66Total train costs to alternative mode users $556,824 $16,636 $573,460
Costs for Alternative Mode Travel:To/from Chicago Other JXN Originations Total
Intercity BusTotal one-way bus trips 2,147 - 2,147Typical one-way bus fare w/ground costs $37.49 -Total cost to users $80,517 - $80,517
AirTotal one-way air trips 5,131 - 5,131Typical one-way air fare w/ground costs $144.71 -Total cost to users $742,562 - $742,562
AutoTotal vehicle trips @1.79 occupancy 5,582 872 6,454Cost for trip/vehicle $110.80 $34.27Cost for trip/occupant $71.03 $19.14Total costs @1.79 occupancy $618,477 $29,872 $648,349
Cost Summary for Rail and Alternative Modes:To/from Chicago Other JXN Originations Total
Total costs by alternative mode $1,441,556 $29,872 $1,471,428Total train costs to alternative mode users $556,824 $16,636 $573,460
Total Savings for Jackson travelers $884,731 $13,237 $897,968
Non-traveler Savings $95,325 $2,874 $98,199
Summary of Community BenefitsMultiplier Total
Total Savings for Jackson travelers $897,968 1.00 $897,968Non-traveler Savings $98,199 1.00 $98,199Local Business Revenues $610,600 1.56 $951,986Amtrak Expenditures in Local Community $100,000 1.45 $144,830
Total Community Benefits for Jackson $2,092,983
* The total number of passengers using the Jackson station in 2007 was 26,932; to avoid double counting, thetraveler benefits of 2,508 passengers detraining at Jackson were assigned to their Michigan originating station.
(All calculations subject to rounding)

104
Kalamazoo Community Benefits Summary Traveler Savings Derived from Kalamazoo Amtrak Savings2007 Rail Passenger Trips for Kalamazoo:
To/from Chicago To Ann Arbor To E. Lansing Other KAL Originations Total*2007 one-way train trips 74,109 4,390 1,675 11,535 91,709Typical one-way train fare $23.75 $16.72 $10.21 $19.65Total train costs to users $1,760,039 $73,383 $17,095 $226,631 $2,077,149
Alternative Mode Trips if No Rail Passenger Service Existed:To/from Chicago To Ann Arbor To E. Lansing Other KAL Originations Total
Intercity Bus 8,649 690 403 - 9,742Air 11,594 99 0 - 11,692Auto 32,717 1,478 806 7,898 42,899Would make trip by alternative mode 52,960 2,266 1,210 7,898 64,333Would not make trip 21,149 2,124 465 3,637 27,376
Cost of Rail Passenger Service for Those Who also Would Travel by Alternative Mode:To/from Chicago To Ann Arbor To E. Lansing Other KAL Originations Total
Total one-way train trips 52,960 2,266 1,210 7,898 64,333Typical one-way train fare $23.75 $16.72 $10.21 $19.65Total train costs to alternative mode users $1,257,688 $37,875 $12,346 $155,172 $1,463,082
Costs for Alternative Mode Travel:To/from Chicago To Ann Arbor To E. Lansing Other KAL Originations Total
Intercity BusTotal one-way bus trips 8,649 690 403 - 9,742Typical one-way bus fare w/ground costs $24.50 $21.49 $16.20 -Total cost to users $211,868 $14,821 $6,533 - $233,222
AirTotal one-way air trips 11,594 99 - - 11,692Typical one-way air fare w/ground costs $191.85 $212.28 - -Total cost to users $2,224,266 $20,913 - - $2,245,179
AutoTotal vehicle trips @1.79 occupancy 18,278 826 517 4,504 24,125Cost for trip/vehicle $79.49 $50.00 $41.92 $63.96Cost for trip/occupant $44.41 $27.93 $26.87 $36.48Total costs @1.79 occupancy $1,452,897 $41,272 $21,669 $288,120 $1,803,958
Cost Summary for Rail and Alternative Modes:To/from Chicago To Ann Arbor To E. Lansing Other KAL Originations Total
Total costs by alternative mode $3,889,030 $77,007 $28,202 $288,120 $4,282,359Total train costs to alternative mode users $1,257,688 $37,875 $12,346 $155,172 $1,463,082
Total Savings for Kalamazoo travelers $2,631,342 $39,131 $15,856 $132,948 $2,819,277
Non-traveler Savings $218,469 $11,911 $3,876 $30,612 $264,868
Summary of Community BenefitsMultiplier Total
Total Savings for Kalamazoo travelers $2,819,277 1.00 $2,819,277Non-traveler Savings $264,868 1.00 $264,868Local Business Revenues $2,292,725 1.61 $3,687,160Amtrak Expenditures in Local Community $150,000 1.43 $213,975
Total Community Benefits for Kalamazoo $6,985,281
* The total number of passengers using the Kalamazoo station in 2007 was 107,819; to avoid double counting, thetraveler benefits of 16,110 passengers detraining at Kalamazoo were assigned to their Michigan originating station.
(All calculations subject to rounding)

105
Niles Community Benefits Summary Traveler Savings Derived from Niles Amtrak Station2007 Rail Passenger Trips for Niles:
To/from Chicago Other NLS Originations Total*2007 one-way train trips 7,917 5,368 13,285Typical one-way train fare $13.98 $23.01Total train costs to users $110,695 $123,508 $234,203
Alternative Mode Trips if No Rail Passenger Service Existed:To/from Chicago Other NLS Originations Total
Intercity Bus - - -Air - - -Auto 5,520 3,665 9,185Would make trip by alternative mode 5,520 3,665 9,185Would not make trip 2,397 1,703 4,100
Cost of Rail Passenger Service for Those Who also Would Travel by Alternative Mode:To/from Chicago Other NLS Originations Total
Total one-way train trips 5,520 3,665 9,185Typical one-way train fare $13.98 $23.01Total train costs to alternative mode users $77,176 $84,334 $161,510
Costs for Alternative Mode Travel:To/from Chicago Other NLS Originations Total
Intercity BusTotal one-way bus trips - - -Typical one-way bus fare w/ground costs - - -Total cost to users - - -
AirTotal one-way air trips - - -Typical one-way air fare w/ground costs - - -Total cost to users - - -
AutoTotal vehicle [email protected]/1.56 occupancy 3,084 2,097 5,181Cost for trip/vehicle $49.03 $74.98Cost for trip/occupant $27.39 $42.90Total costs @1.79/1.56 occupancy $151,200 $157,243 $308,443
Cost Summary for Rail and Alternative Modes:To/from Chicago Other NLS Originations Total
Total costs by alternative mode $151,200 $157,243 $308,443Total train costs to alternative mode users $77,176 $84,334 $161,510
Total Savings for Niles travelers $74,024 $72,909 $146,933
Non-traveler Savings $16,075 $16,934 $33,009
Summary of Community BenefitsMultiplier Total
Total Savings for Niles travelers $146,933 1.00 $146,933Non-traveler Savings $33,009 1.00 $33,009Local Business Revenues $332,125 1.61 $534,123Amtrak Expenditures in Local Community $2,985,000 1.43 $4,258,103
Total Community Benefits for Niles $4,972,168
* The total number of passengers using the Niles station in 2007 was 18,479; to avoid double counting, thetraveler benefits of 5,194 passengers detraining at Niles were assigned to their Michigan originating station.
(All calculations subject to rounding)

106
Pontiac Community Benefits Summary Traveler Savings Derived from Pontiac Amtrak Station 2007 Rail Passenger Trips for Pontiac:
To/from Chicago Other PNT Originations Total*2007 one-way train trips 12,616 1,787 14,403Typical one-way train fare $47.75 $23.21Total train costs to users $602,396 $41,479 $643,875
Alternative Mode Trips if No Rail Passenger Service Existed:To/from Chicago Other PNT Originations Total
Intercity Bus 2,163 - 2,163Air 3,710 - 3,710Auto 3,591 1,246 4,837Would make trip by alternative mode 9,464 1,246 10,710Would not make trip 3,152 541 3,693
Cost of Rail Passenger Service for Those Who also Would Travel by Alternative Mode:To/from Chicago Other PNT Originations Total
Total one-way train trips 9,464 1,246 10,710Typical one-way train fare $47.80 $23.21Total train costs to alternative mode users $452,417 $28,919 $481,336
Costs for Alternative Mode Travel:To/from Chicago Other PNT Originations Total
Intercity BusTotal one-way bus trips 2,163 - 2,163Typical one-way bus fare w/ground costs $33.49 -Total cost to users $72,442 - $72,442
AirTotal one-way air trips 3,710 - 3,710Typical one-way air fare w/ground costs $87.02 -Total cost to users $322,874 - $322,874
AutoTotal vehicle trips @1.79 occupancy 2,006 696 2,702Cost for trip/vehicle $149.69 $74.61Cost for trip/occupant $95.95 $41.68Total costs @1.79 occupancy $300,301 $51,929 $352,230
Cost Summary for Rail and Alternative Modes:To/from Chicago Other PNT Originations Total
Total costs by alternative mode $695,616 $51,929 $748,910Total train costs to alternative mode users $452,417 $28,919 $482,096
Total Savings for Pontiac Travelers $243,199 $23,010 $266,209
Non-traveler Savings $75,877 $4,997 $80,874
Summary of Community BenefitsMultiplier Total
Total Savings for Pontiac travelers $266,209 1.00 $266,209Non-traveler Savings $80,874 1.00 $80,874Local Business Revenues $360,075 1.81 $651,052Amtrak Expenditures in Local Community $3,091,700 1.58 $4,890,142
Total Community Benefits for Pontiac $5,888,277
* The total number of passengers using the Pontiac station in 2007 was 16,248; to avoid double counting, thetraveler benefits of 1,845 passengers detraining at Pontiac were assigned to their Michigan originating station.
(All calculations subject to rounding)

107
Royal Oak Community Benefits Summary Traveler Savings Derived from Royal Oak Amtrak Station2007 Rail Passenger Trips for Royal Oak:
To/from Chicago Other ROY Originations Total*2007 one-way train trips 19,751 2,973 22,724Typical one-way train fare $48.31 $20.14Total train costs to users $954,128 $59,890 $1,014,018
Alternative Mode Trips if No Rail Passenger Service Existed:To/from Chicago Other ROY Originations Total
Intercity Bus 1,624 - 1,624Air 5,745 - 5,745Auto 8,237 2,073 10,310Would make trip by alternative mode 15,606 2,073 17,678Would not make trip 4,145 900 5,046
Cost of Rail Passenger Service for Those Who also Would Travel by Alternative Mode:To/from Chicago Other ROY Originations Total
Total one-way train trips 15,606 2073 17678Typical one-way train fare $48.30 $20.14Total train costs to alternative mode users $753,795 $41,755 $795,550
Costs for Alternative Mode TravelTo/from Chicago Other ROY Originations Total
Intercity BusTotal one-way bus trips 1,624 - 1,624Typical one-way bus fare w/ground costs $37.72 -Total cost to users $61,254 - $61,254
AirTotal one-way air trips 5,745 - 5,745Typical one-way air fare w/ground costs $84.20 -Total cost to users $483,745 - $483,745
AutoTotal vehicle trips @1.79 occupancy 4,602 1,158 5,760Cost for trip/vehicle $150.19 $64.75Cost for trip/occupant $83.91 $36.17Total costs @1.79 occupancy $691,106 $74,978 $766,084
Cost Summary for Rail and Alternative ModesTo/from Chicago Other ROY Originations Total
Total costs by alternative mode $1,236,105 $74,978 $1,311,083Total train costs to alternative mode users $753,795 $41,755 $795,550
Total Savings for Royal Oak travelers $482,310 $33,223 $515,533
Non-traveler Savings $73,793 $7,215 $81,007
Summary of Community BenefitsMultiplier Total
Total Savings for Royal Oak travelers $515,533 1.00 $515,533Non-traveler Savings $81,007 1.00 $81,007Local Business Revenues $568,100 1.81 $1,027,182Amtrak Expenditures in Local Community $0 1.58 $0
Total Community Benefits for Royal Oak $1,623,722
* The total number of passengers using the Royal Oak station in 2007 was 25,987; to avoid double counting, thetraveler benefits of 3,263 passengers detraining at Royal Oak were assigned to their Michigan originating station.
(All calculations subject to rounding)

108
Bangor Community Benefits Summary Traveler Savings Derived from Bangor Amtrak Station 2007 Rail Passenger Trips for Bangor:
To/from Chicago Other BAM Originations Total*2007 one-way train trips 3,510 178 3,688Typical one-way train fare $19.48 $4.85Total train costs to users $68,368 $863 $69,231
Alternative Mode Trips if No Rail Passenger Service Existed:To/from Chicago Other BAM Originations Total
Intercity Bus 678 - 678Air - - -Auto 1,697 107 1,804Would make trip by alternative mode 2,375 107 2,482Would not make trip 1,135 71 1,206
Cost of Rail Passenger Service for Those Who also Would Travel by Alternative Mode:To/from Chicago Other BAM Originations Total
Total one-way train trips 2,375 107 2,482Typical one-way train fare $19.51 $4.85Total train costs to alternative mode users $46,335 $518 $46,853
Costs for Alternative Mode Travel:To/from Chicago Other BAM Originations Total
Intercity BusTotal one-way bus trips 678 - 678Typical one-way bus fare w/ground costs $30.59 - -Total cost to users $20,740 - $20,740
AirTotal one-way air trips - - -Typical one-way air fare w/ground costs - - -Total cost to users - - -
AutoTotal vehicle trips @1.83 occupancy 928 58 986Cost for trip/vehicle $70.91 $14.58Cost for trip/occupant $38.75 $7.97Total costs @1.83 occupancy 65,764.7 850.9 66,615.6
Cost Summary for Rail and Alternative Modes:To/from Chicago Other BAM Originations Total
Total costs by alternative mode $86,505 $851 $87,355Total train costs to alternative mode users $46,335 $518 $46,853
Total Savings for Bangor travelers $40,170 $333 $40,503
Non-traveler Savings $10,918 $111 $11,029
Summary of Community BenefitsMultiplier Total
Total Savings for Bangor travelers $40,503 1.00 $40,503Non-traveler Savings $11,029 1.00 $11,029Local Business Revenues $55,320 1.61 $88,966Amtrak Expenditures in Local Community $0 1.43 $0
Total Community Benefits for Bangor $140,498
* The total number of passengers using the Bangor station in 2007 was 3,784; to avoid double counting, thetraveler benefits of 96 passengers detraining at Bangor were assigned to their Michigan originating station.
(All calculations subject to rounding)

109
Grand Rapids Community Benefits Summary Traveler Savings Derived from Grand Rapids Amtrak Station2007 Rail Passenger Trips for Grand Rapids:
To/from Chicago Other GRR Originations Total*2007 one-way train trips 52,580 637 53,217Typical one-way train fare $29.55 $7.16Total train costs to users $1,553,578 $4,564 $1,558,141
Alternative Mode Trips if No Rail Passenger Service Existed:To/from Chicago Other GRR Originations Total
Intercity Bus 4,532 - 4,532Air 9,205 - 9,205Auto 18,542 382 18,924Would make trip by alternative mode 32,279 382 32,661Would not make trip 20,301 255 20,556
Cost of Rail Passenger Service for Those Who also Would Travel by Alternative Mode:To/from Chicago Other GRR Originations Total
Total one-way train trips 32279 382 32661Typical one-way train fare $29.54 $7.16Total train costs to alternative mode users $953,448 $2,738 $956,186
Costs for Alternative Mode Travel:To/from Chicago Other GRR Originations Total
Intercity BusTotal one-way bus trips 4,532 - 4,532Typical one-way bus fare w/ground costs $37.05 -Total cost to users $167,936 - $167,936
AirTotal one-way air trips 9,205 - 9,205Typical one-way air fare w/ground costs $134.40 -Total cost to users $1,237,228 - $1,237,228
AutoTotal vehicle trips @1.83 occupancy 10,132 209 10,341Cost for trip/vehicle $95.65 $21.55Cost for trip/occupant $52.27 $11.78Total costs @1.83 occupancy $969,124 $4,501 $973,625
Cost Summary for Rail and Alternative Modes:To/from Chicago Other GRR Originations Total
Total costs by alternative mode $2,374,287 $4,501 $2,378,788Total train costs to alternative mode users $953,448 $2,738 $956,186
Total Savings for Grand Rapids traveler $1,420,840 $1,763 $1,422,603
Non-traveler Savings $230,722 $588 $231,310
Summary of Community BenefitsMultiplier Total
Total Savings for Grand Rapids travelers $1,422,603 1.00 $1,422,603Non-traveler Savings $231,310 1.00 $231,310Local Business Revenues $1,064,340 1.75 $1,867,171Amtrak Expenditures in Local Community $354,500 1.55 $551,035
Total Community Benefits for Grand Rapids $4,072,118
* The total number of passengers using the Grand Rapids station in 2007 was 53,545; to avoid double counting, thetraveler benefits of 328 passengers detraining at Grand Rapids were assigned to their Michigan originating station.
(All calculations subject to rounding)

110
Holland Community Benefits Summary Traveler Savings Derived from Holland Amtrak Station2007 Rail Passenger Trips for Holland:
To/from Chicago Other HOM Originations Total*2007 one-way train trips 36,830 529 37,359Typical one-way train fare $25.35 $8.14Total train costs to users $933,679 $4,308 $937,987
Alternative Mode Trips if No Rail Passenger Service Existed:To/from Chicago Other HOM Originations Total
Intercity Bus 3,250 - 3,250Air 6,229 - 6,229Auto 18,024 317 18,342Would make trip by alternative mode 27,504 317 27,821Would not make trip 9,326 212 9,538
Cost of Rail Passenger Service for Those Who also Would Travel by Alternative Mode:To/from Chicago Other HOM Originations Total
Total one-way train trips 27,504 317 27,821Typical one-way train fare $25.34 $8.14Total train costs to alternative mode users $697,069 $2,585 $699,654
Costs for Alternative Mode Travel:To/from Chicago Other HOM Originations Total
Intercity BusTotal one-way bus trips 3,250 - 3,250Typical one-way bus fare w/ground costs $33.26 -Total cost to users $108,085 - $108,085
AirTotal one-way air trips 6,229 - 6,229Typical one-way air fare w/ground costs $143.79 -Total cost to users $895,687 - $895,687
AutoTotal vehicle trips @1.83 occupancy 9,849 173 10,023Cost for trip/vehicle $80.50 $24.50Cost for trip/occupant $43.99 $13.39Total costs @1.83 occupancy $792,870 $4,249 $797,120
Cost Summary for Rail and Alternative Modes:To/from Chicago Other HOM Originations Total
Total costs by alternative mode $1,796,642 $4,249 $1,800,891Total train costs to alternative mode users $697,069 $2,585 $699,654
Total Savings for Holland travelers 1,099,573 1,664 $1,101,237
Non-traveler Savings 86,939 555 $87,494
Summary of Community BenefitsMultiplier Total
Total Savings for Holland travelers $1,101,237 1.00 $1,101,237Non-traveler Savings $87,494 1.00 $87,494Local Business Revenues $747,180 1.75 $1,310,778Amtrak Expenditures in Local Community $0 1.55 $0
Total Community Benefits for Holland $2,499,509
The total number of passengers using the Holland station in 2007 was 37,915; to avoid double counting, thetraveler benefits of 556 passengers detraining at Holland were assigned to their Michigan originating station.
(All calculations subject to rounding)

111
New Buffalo Community Benefits Summary Traveler Savings Derived from New Buffalo Amtrak Station2007 Rail Passenger Trips for New Buffalo:
To/from Chicago Other NBM Originations Total*2007 one-way train trips 2,336 98 2,434Typical one-way train fare $10.25 $14.85Total train costs to users $23,939 $1,456 $25,395
Alternative Mode Trips if No Rail Passenger Service Existed:To/from Chicago Other NBM Originations Total
Intercity Bus - - -Air - - -Auto 2,336 59 2,395Would make trip by alternative mode 2,336 59 2,395Would not make trip - 39 39
Cost of Rail Passenger Service for Those Who also Would Travel by Alternative Mode:To/from Chicago Other NBM Originations Total
Total one-way train trips 2,336 59 2,395Typical one-way train fare $10.25 $14.85Total train costs to alternative mode users $23,939 $873 $24,813
Costs for Alternative Mode Travel:To/from Chicago Other NBM Originations Total
Intercity BusTotal one-way bus trips - - -Typical one-way bus fare w/ground costs - - -Total cost to users - - -
AirTotal one-way air trips - - -Typical one-way air fare w/ground costs - - -Total cost to users - - -
AutoTotal vehicle trips @1.83 occupancy 1,277 32 1,309Cost for trip/vehicle $39.60 $44.68Cost for trip/occupant $21.64 $24.42Total costs @1.83 occupancy $50,543 $1,436 $51,979
Cost Summary for Rail and Alternative Modes:To/from Chicago Other NBM Originations Total
Total costs by alternative mode $50,543 $1,436 $51,979Total train costs to alternative mode users $23,939 $873 $24,813
Total Savings for New Buffalo travelers $26,604 $562 $27,166
Non-traveler Savings - $187 $187
Summary of Community BenefitsMultiplier Total
Total Savings for New Buffalo travelers $27,166 1.00 $27,166Non-traveler Savings $187 1.00 $187Local Business Revenues $36,510 1.61 $58,715Amtrak Expenditures in Local Community $0 1.43 $0
Total Community Benefits for New Buffalo $86,069
* The total number of passengers using the New Buffalo station in 2007 was 2,559; to avoid double counting, thetraveler benefits of 125 passengers detraining at New Buffalo were assigned to their Michigan originating station.
(All calculations subject to rounding)

112
St. Joseph Community Benefits Summary Traveler Savings Derived from St. Joseph Amtrak Station2007 Rail Passenger Trips for St. Joseph:
To/from Chicago Other SJM Originations Total*2007 one-way train trips 7,472 194 7,666Typical one-way train fare $14.94 $11.19Total train costs to users $111,659 $2,170 $113,829
Alternative Mode Trips if No Rail Passenger Service Existed:To/from Chicago Other SJM Originations Total
Intercity Bus 1,564 - 1,564Air 832 - 832Auto 2,935 116 3,051Would make trip by alternative mode 5,331 116 5,447Would not make trip 2,141 78 2,219
Cost of Rail Passenger Service for Those Who also Would Travel by Alternative Mode:To/from Chicago Other SJM Originations Total
Total one-way train trips 5,331 116 5,447Typical one-way train fare $14.94 $11.19Total train costs to alternative mode users $79,661 $1,302 $80,963
Costs for Alternative Mode Travel:To/from Chicago Other SJM Originations Total
Intercity BusTotal one-way bus trips 1,564 - 1,564Typical one-way bus fare w/ground costs $16.00 -Total cost to users $25,025 - $25,025
AirTotal one-way air trips 832 - 832Typical one-way air fare w/ground costs $221.68 -Total cost to users $184,498 - $184,498
AutoTotal vehicle trips @1.83 occupancy 1,604 64 1,667Cost for trip/vehicle $53.74 $33.65Cost for trip/occupant $29.36 $18.39Total costs @1.83 occupancy $86,169 $2,141 $88,310
Cost Summary for Rail and Alternative Modes:To/from Chicago Other SJM Originations Total
Total costs by alternative mode $295,693 $2,141 $297,833Total train costs to alternative mode users $79,661 $1,302 $80,963
Total Savings for St. Joseph travelers $216,032 $838 $216,870
Non-traveler Savings $15,437 $279 $15,717
Summary of Community BenefitsMultiplier Total
Total Savings for St. Joseph travelers $216,870 1.00 $216,870Non-traveler Savings $15,717 1.00 $15,717Local Business Revenues $153,320 1.61 $246,569Amtrak Expenditures in Local Community $0 1.43 $0
Total Community Benefits for St. Joseph $479,156
* The total number of passengers using the St. Joseph station in 2007 was 8,197; to avoid double counting, thetraveler benefits of 531 passengers detraining at St. Joseph were assigned to their Michigan originating station.
(All calculations subject to rounding)
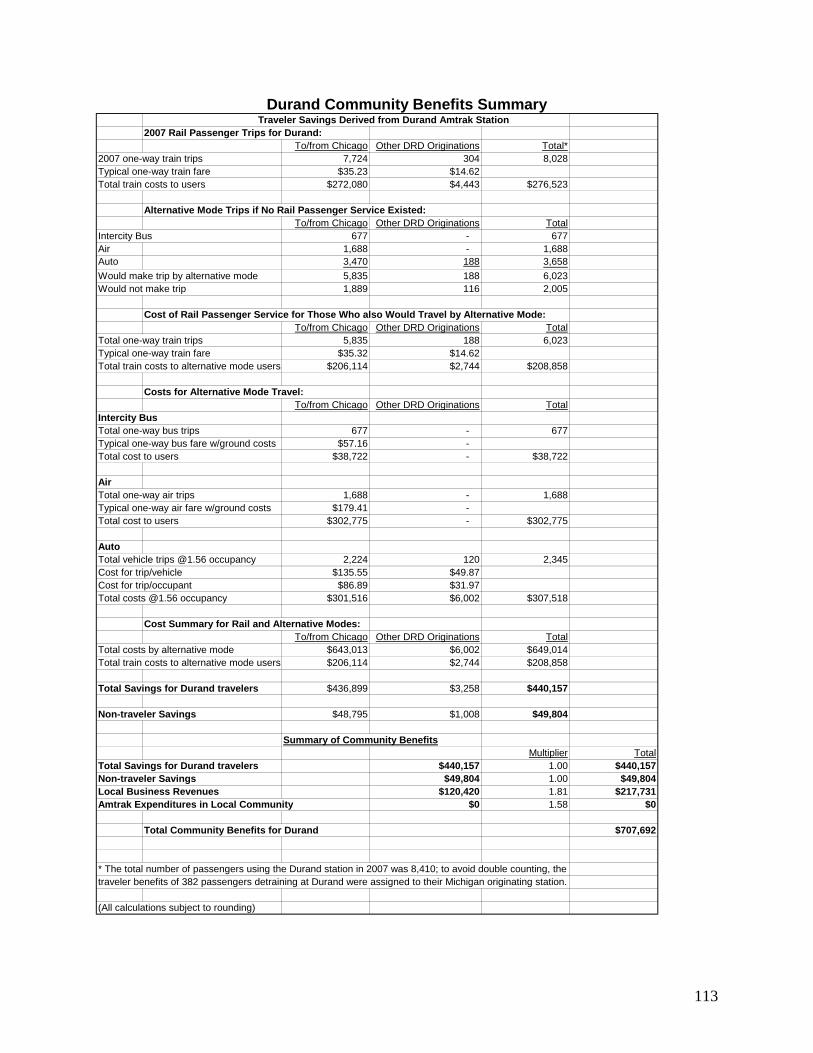
113
Durand Community Benefits Summary Traveler Savings Derived from Durand Amtrak Station 2007 Rail Passenger Trips for Durand:
To/from Chicago Other DRD Originations Total*2007 one-way train trips 7,724 304 8,028Typical one-way train fare $35.23 $14.62Total train costs to users $272,080 $4,443 $276,523
Alternative Mode Trips if No Rail Passenger Service Existed:To/from Chicago Other DRD Originations Total
Intercity Bus 677 - 677Air 1,688 - 1,688Auto 3,470 188 3,658Would make trip by alternative mode 5,835 188 6,023Would not make trip 1,889 116 2,005
Cost of Rail Passenger Service for Those Who also Would Travel by Alternative Mode:To/from Chicago Other DRD Originations Total
Total one-way train trips 5,835 188 6,023Typical one-way train fare $35.32 $14.62Total train costs to alternative mode users $206,114 $2,744 $208,858
Costs for Alternative Mode Travel:To/from Chicago Other DRD Originations Total
Intercity BusTotal one-way bus trips 677 - 677Typical one-way bus fare w/ground costs $57.16 -Total cost to users $38,722 - $38,722
AirTotal one-way air trips 1,688 - 1,688Typical one-way air fare w/ground costs $179.41 -Total cost to users $302,775 - $302,775
AutoTotal vehicle trips @1.56 occupancy 2,224 120 2,345Cost for trip/vehicle $135.55 $49.87Cost for trip/occupant $86.89 $31.97Total costs @1.56 occupancy $301,516 $6,002 $307,518
Cost Summary for Rail and Alternative Modes:To/from Chicago Other DRD Originations Total
Total costs by alternative mode $643,013 $6,002 $649,014Total train costs to alternative mode users $206,114 $2,744 $208,858
Total Savings for Durand travelers $436,899 $3,258 $440,157
Non-traveler Savings $48,795 $1,008 $49,804
Summary of Community BenefitsMultiplier Total
Total Savings for Durand travelers $440,157 1.00 $440,157Non-traveler Savings $49,804 1.00 $49,804Local Business Revenues $120,420 1.81 $217,731Amtrak Expenditures in Local Community $0 1.58 $0
Total Community Benefits for Durand $707,692
* The total number of passengers using the Durand station in 2007 was 8,410; to avoid double counting, thetraveler benefits of 382 passengers detraining at Durand were assigned to their Michigan originating station.
(All calculations subject to rounding)

114
Flint Community Benefits Summary Traveler Savings Derived from Flint Amtrak Station2007 Rail Passenger Trips for Flint:
To/from Chicago Other FLN Originations Total*2007 one-way train trips 20,443 1,517 21,960Typical one-way train fare $37.90 $14.40Total train costs to users $774,769 $21,849 $796,618
Alternative Mode Trips if No Rail Passenger Service Existed:To/from Chicago Other FLN Originations Total
Intercity Bus 867 - 867Air 6,626 - 6,626Auto 7,553 937 8,490Would make trip by alternative mode 15,046 937 15,983Would not make trip 5,397 580 5,977
Cost of Rail Passenger Service for Those Who also Would Travel by Alternative Mode:To/from Chicago Other FLN Originations Total
Total one-way train trips 15,046 937 15,983Typical one-way train fare $37.85 $14.40Total train costs to alternative mode users $569,495 $13,494 $582,989
Costs for Alternative Mode Travel:To/from Chicago Other FLN Originations Total
Intercity BusTotal one-way bus trips 867 - 867Typical one-way bus fare w/ground costs $41.99 -Total cost to users $36,398 - $36,398
AirTotal one-way air trips 6,626 - 6,626Typical one-way air fare w/ground costs $174.23 -Total cost to users $1,154,387 - $1,154,387
AutoTotal vehicle trips @1.56 occupancy 4,842 601 5,442Cost for trip/vehicle $144.64 $49.15Cost for trip/occupant $92.71 $31.50Total costs @1.56 occupancy $700,292 $29,515 $729,807
Cost Summary for Rail and Alternative Modes:To/from Chicago Other FLN Originations Total
Total costs by alternative mode $1,891,077 $29,694 $1,920,771Total train costs to alternative mode users $569,495 $13,494 $582,989
Total Savings for Flint travelers $1,321,582 $16,200 $1,337,782
Non-Traveler Savings $147,920 $4,960 $152,880
Summary of Community BenefitsMultiplier Total
Total Savings for Flint travelers $1,337,782 1.00 $1,337,782Non-traveler Savings $152,880 1.00 $152,880Local Business Revenues $439,200 1.81 $794,118Amtrak Expenditures in Local Community $75,000 1.58 $118,628
Total Community Benefits for Flint $2,403,407
* The total number of passengers using the Flint station in 2007 was 23,863; to avoid double counting, thetraveler benefits of 1,903 passengers detraining at Flint were assigned to their Michigan originating station.
(All calculations subject to rounding)

115
Lansing Community Benefits Summary Traveler Savings Derived from East Lansing Amtrak Station2007 Rail Passenger Trips for East Lansing:
To/from Chicago To Kalamazoo To Port Huron Other LNS Originations Total*2007 one-way train trips 41,691 936 722 1,109 44,458Typical one-way train fare $30.79 $10.51 $16.18 $10.62Total train costs to users $1,283,623 $9,841 $11,685 $11,775 $1,316,924
Alternative Mode Trips if No Rail Passenger Service Existed:To/from Chicago To Kalamazoo To Port Huron Other LNS Originations Total
Intercity Bus 4,038 - 80 93 4,211Air 7,930 - - - 7,930Auto 18,774 312 161 731 19,978Would make trip by alternative mode 30,741 312 241 824 32,119Would not make trip 10,950 624 481 285 12,340
Cost of Rail Passenger Service for Those Who also Would Travel by Alternative Mode:To/from Chicago To Kalamazoo To Port Huron Other LNS Originations Total
Total one-way train trips 30,741 312 241 824 32,119Typical one-way train fare $30.84 $10.51 $16.18 $10.62Total train costs to alternative mode users $947,998 $3,280 $3,900 $8,750 $963,929
Costs for Alternative Mode Travel:To/from Chicago To Kalamazoo To Port Huron Other LNS Originations Total
Intercity BusTotal one-way bus trips 4,038 - 80 93 4,211Typical one-way bus fare w/ground costs $46.80 - $34.16 $17.33Total cost to users $188,980 - $2,732 $1,608 $193,321
AirTotal one-way air trips 7,930 - - - 7,930Typical one-way air fare w/ground costs $133.13 - - -Total cost to users $1,055,692 - - - $1,055,692
AutoTotal vehicle trips @1.56 occupancy 12,034 200 103 528 12,866Cost for trip/vehicle $118.38 $41.92 $55.55 $36.48Cost for trip/occupant $75.88 $26.87 $35.61 $23.38Total costs @1.56 occupancy $1,424,579 $8,383 $5,733 $19,269 $1,457,964
Cost Summary for Rail and Alternative Modes:To/from Chicago To Kalamazoo To Port Huron Other LNS Originations Total
Total costs by alternative mode $2,669,252 $8,383 $8,465 $20,878 $2,706,978Total train costs to alternative mode users $947,998 $3,280 $3,900 $8,750 $963,929
Total Savings for Lansing Area travelers $1,721,254 $5,103 $4,565 $12,127 $1,743,049
Non-travelers Savings $246,881 $5,103 $4,672 $1,818 $258,474
Summary of Community BenefitsMultiplier Total
Total Savings for Lansing Area travelers $1,743,049 1.00 $1,743,049Non-traveler Savings $258,474 1.00 $258,474Local Business Revenues $889,160 1.56 $1,386,289Amtrak Expenditures in Local Community $75,000 1.45 $108,623
Total Community Benefits for Lansing Area $3,496,435
* The total number of passengers using the East Lansing station in 2007 was 48,025; to avoid double counting, thetraveler benefits of 3,567 passengers detraining at East Lansing were assigned to their Michigan originating station.
(All calculations subject to rounding)

116
Lapeer Community Benefits Summary Traveler Savings Derived from Lapeer Amtrak Station2007 Rail Passenger Trips for Lapeer:
To/from Chicago To E. Lansing Other LPE Originations Total*2007 one-way train trips 5,559 128 423 6,110Typical one-way train fare $40.57 $9.91 $19.19Total train costs to users $225,504 $1,269 $8,118 $234,890
Alternative Mode Trips if No Rail Passenger Service Existed:To/from Chicago To E. Lansing Other LPE Originations Total
Intercity Bus 679 64 - 743Air 1,262 - - 1,262Auto 2,524 64 261 2,850Would make trip by alternative mode 4,466 128 261 4,855Would not make trip 1,093 - 162 1,255
Cost of Rail Passenger Service for Those Who also Would Travel by Alternative Mode:To/from Chicago To E. Lansing Other LPE Originations Total
Total one-way train trips 4,466 128 261 4,855Typical one-way train fare $40.42 $9.91 $19.19Total train costs to alternative mode users $180,519 $1,269 $5,013 $186,801
Costs for Alternative Mode Travel:To/from Chicago To E. Lansing Other LPE Originations Total
Intercity BusTotal one-way bus trips 679 64 - 743Typical one-way bus fare w/ground costs $47.82 $17.32 -Total cost to users $32,482 $1,109 - $33,590
AirTotal one-way air trips 1,262 - - 1,262Typical one-way air fare w/ground costs $182.32 - -Total cost to users $230,129 - - $230,129
AutoTotal vehicle trips @1.56 occupancy 1,618 41 167 1,827Cost for trip/vehicle $154.23 $33.33 $65.48Cost for trip/occupant $98.87 $21.37 $41.97Total costs @1.56 occupancy $249,581 $1,367 $10,965 $261,913
Cost Summary for Rail and Alternative Modes:To/from Chicago To E. Lansing Other LPE Originations Total
Total costs by alternative mode $512,191 $2,476 $10,965 $525,632Total train costs to alternative mode users $180,519 $1,269 $5,013 $186,801
Total Savings for Lapeer travelers $331,673 $1,207 $5,952 $338,831
Non-traveler Savings $31,861 - $1,843 $33,703
Summary of Community BenefitsMultiplier Total
Total Savings for Lapeer travelers $338,831 1.00 $338,831Non-traveler Savings $33,703 1.00 $33,703Local Business Revenues $91,650 1.81 $165,712Amtrak Expenditures in Local Community $0 1.58 $0
Total Community Benefits for Lapeer $538,247
* The total number of passengers using the Lapeer station in 2007 was 6,795; to avoid double counting, thetraveler benefits of 685 passengers detraining at Lapeer were assigned to their Michigan originating station.
(All calculations subject to rounding)

117
Port Huron Community Benefits Summary
Traveler Savings Derived from Port Huron Amtrak Station2007 Rail Passenger Trips for Port Huron:
To/from Chicago To E. Lansing Other PTH Originations Total*2007 one-way train trips 8,392 747 1,342 10,481Typical one-way train fare $47.24 $16.67 $20.39Total train costs to users $396,400 $12,454 $27,363 $436,217
Alternative Mode Trips if No Rail Passenger Service Existed:To/from Chicago To E. Lansing Other PTH Originations Total
Intercity Bus 752 - - 752Air 2,548 - - 2,548Auto 3,737 747 829 5,313Would make trip by alternative mode 7,038 747 829 8,614Would not make trip 1,354 0 513 1,867
Cost of Rail Passenger Service for Those Who also Would Travel by Alternative Mode:To/from Chicago To E. Lansing Other PTH Originations Total
Total one-way train trips 7,038 747 829 8,614Typical one-way train fare $47.18 $16.67 $20.39Total train costs to alternative mode users $332,033 $12,454 $16,899 $361,387
Costs for Alternative Mode Travel:To/from Chicago To E. Lansing Other PTH Originations Total
Intercity BusTotal one-way bus trips 752 - - 752Typical one-way bus fare w/ground costs $53.24 - -Total cost to users $40,047 - - $40,047
AirTotal one-way air trips 2,548 - - 2,548Typical one-way air fare w/ground costs $102.19 - -Total cost to users $260,404 - - $260,404
AutoTotal vehicle trips @1.56 occupancy 2,396 479 531 3,406Cost for trip/vehicle $175.95 $55.55 $69.57Cost for trip/occupant $112.79 $35.61 $44.60Total costs @1.56 occupancy $421,526 $26,600 $36,961 $485,088
Cost Summary for Rail and Alternative ModesTo/from Chicago To E. Lansing Other PTH Originations Total
Total costs by alternative mode $721,978 $26,600 $36,961 $785,539Total train costs to alternative mode users $332,033 $12,454 $16,899 $361,387
Total Savings for Port Huron travelers $389,945 $14,146 $20,062 $424,152
Non-Traveler Savings $44,377 - $6,211 $50,588
Summary of Community BenefitsMultiplier Total
Total Savings for Port Huron travelers $424,152 1.00 $424,152Non-traveler Savings $50,588 1.00 $50,588Local Business Revenues $209,620 1.81 $379,014Amtrak Expenditures in Local Community $1,088,600 1.58 $1,721,839
Total Community Benefits for Port Huron $2,575,593
* The total number of passengers using the Port Huron station in 2007 was 12,619; to avoid double counting, thetraveler benefits of 2,138 passengers detraining at Port Huron were assigned to their Michigan originating station.
(All calculations subject to rounding)