mdp parcel viewer web map tutorial...
TRANSCRIPT

Maryland Department of Planning 1 Last Updated 6/30/2015
MDP Parcel Viewer Web Map Tutorial
Table of Contents
1. How to Access MDP Parcel Viewer Web Map ......................................................................................... 3
Helpful Tips ............................................................................................................................................... 3
Set Screen Resolution ........................................................................................................................... 3
Undo a Task ........................................................................................................................................... 3
2. About Maryland Department of Planning (MDP) Parcel Viewer ......................................................... 4
3. Pushpin on the Map/Tax Maps ................................................................................................................ 4
4. Find a Place or Address ............................................................................................................................ 5
5. How to Display Parcel Boundaries and Parcel Information ..................................................................... 6
Select SDAT URL .................................................................................................................................... 6
SDAT View Map ..................................................................................................................................... 6
Closing Parcel Information .................................................................................................................... 7
6. County Boundaries Zoom Out View ......................................................................................................... 8
7. Parcel Points .......................................................................................................................................... 8
8. Property Sales ....................................................................................................................................... 9
9. CAMA .................................................................................................................................................... 9
10. Census .................................................................................................................................................. 10
11. Floodplains ........................................................................................................................................... 11
Select Legend ...................................................................................................................................... 11
12. 6 Inch Imagery - 50% Transparent (2013/2014) .................................................................................. 12
13. 6 Inch Imagery (2013/2014) ................................................................................................................. 13
14. Generalized Zoning .............................................................................................................................. 13
Select Legend ...................................................................................................................................... 14
15. Light Gray Base Map ............................................................................................................................ 14
16. World Street Base Map ........................................................................................................................ 15
17. Closing Left Hand Navigation Menu for Extended Map View .............................................................. 16
Extended Map View Display ............................................................................................................... 16
18. Zoom Out / Zoom In ............................................................................................................................. 17
19. Find My Location .................................................................................................................................. 17
20. Default Extent ...................................................................................................................................... 17
Maryland Department of Planning 2 Last Updated 6/30/2015
21. Drawing Tools: Point, Line, Polygon ..................................................................................................... 17
Step 1: Click on drawing tool. ............................................................................................................. 17
Step 2: Instructions to complete drawing. .......................................................................................... 17
22. Measuring tools ................................................................................................................................... 18
Area ..................................................................................................................................................... 19
Distance ............................................................................................................................................... 19
23. Enter Text ............................................................................................................................................. 20
24. Print ...................................................................................................................................................... 21

Maryland Department of Planning 3 Last Updated 6/30/2015
1. How to Access MDP Parcel Viewer Web Map The MDP Parcel Viewer Web Map can be accessed using the following link:
http://mdpgis.mdp.state.md.us/mris/pi/index.html.
Sharing Map with URL Parameters
Users can add text at the end of the link for sharing specific locations and exact map extents of the MDP Parcel Map Viewer, using ?address= for sharing addresses and place names and ?id= for sharing parcel Account ID point locations. (Note, be sure to remove any “#” characters at the end of the URL).
Examples below:
http://mdpgis.mdp.state.md.us/mris/pi/index.html?address=301 W Preston St Baltimore http://mdpgis.mdp.state.md.us/mris/pi/index.html?address=Rockville Library http://mdpgis.mdp.state.md.us/mris/pi/index.html?id=04090919000840
Set Screen display:
Helpful Tips:
Set Screen Resolution. Set desktop / laptop screen resolution at 1280 x 1024 for best
screen display. (See below)
Undo a Task. To undo a task such as drawing or measuring, refresh the screen display by:
o pressing F5 on the keyboard, or
o highlighting the web address at the top of the browser and press return, or
o right clicking the mouse on the browser page and select Reload or Refresh.
Maryland Department of Planning 4 Last Updated 6/30/2015
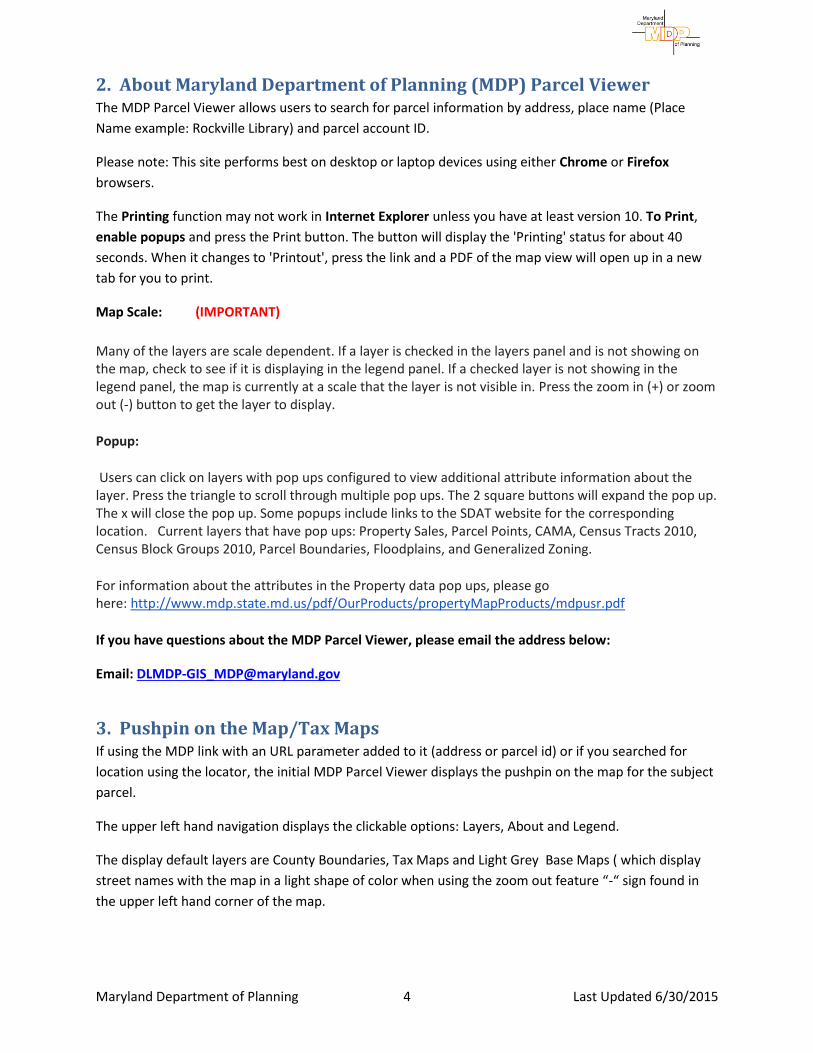
2. About Maryland Department of Planning (MDP) Parcel Viewer The MDP Parcel Viewer allows users to search for parcel information by address, place name (Place
Name example: Rockville Library) and parcel account ID.
Please note: This site performs best on desktop or laptop devices using either Chrome or Firefox
browsers.
The Printing function may not work in Internet Explorer unless you have at least version 10. To Print,
enable popups and press the Print button. The button will display the 'Printing' status for about 40
seconds. When it changes to 'Printout', press the link and a PDF of the map view will open up in a new
tab for you to print.
Map Scale: (IMPORTANT)
Many of the layers are scale dependent. If a layer is checked in the layers panel and is not showing on the map, check to see if it is displaying in the legend panel. If a checked layer is not showing in the legend panel, the map is currently at a scale that the layer is not visible in. Press the zoom in (+) or zoom out (-) button to get the layer to display.
Popup:
Users can click on layers with pop ups configured to view additional attribute information about the layer. Press the triangle to scroll through multiple pop ups. The 2 square buttons will expand the pop up. The x will close the pop up. Some popups include links to the SDAT website for the corresponding location. Current layers that have pop ups: Property Sales, Parcel Points, CAMA, Census Tracts 2010, Census Block Groups 2010, Parcel Boundaries, Floodplains, and Generalized Zoning.
For information about the attributes in the Property data pop ups, please go here: http://www.mdp.state.md.us/pdf/OurProducts/propertyMapProducts/mdpusr.pdf
If you have questions about the MDP Parcel Viewer, please email the address below:
Email: [email protected]
3. Pushpin on the Map/Tax Maps If using the MDP link with an URL parameter added to it (address or parcel id) or if you searched for
location using the locator, the initial MDP Parcel Viewer displays the pushpin on the map for the subject
parcel.
The upper left hand navigation displays the clickable options: Layers, About and Legend.
The display default layers are County Boundaries, Tax Maps and Light Grey Base Maps ( which display
street names with the map in a light shape of color when using the zoom out feature “-“ sign found in
the upper left hand corner of the map.
Maryland Department of Planning 5 Last Updated 6/30/2015
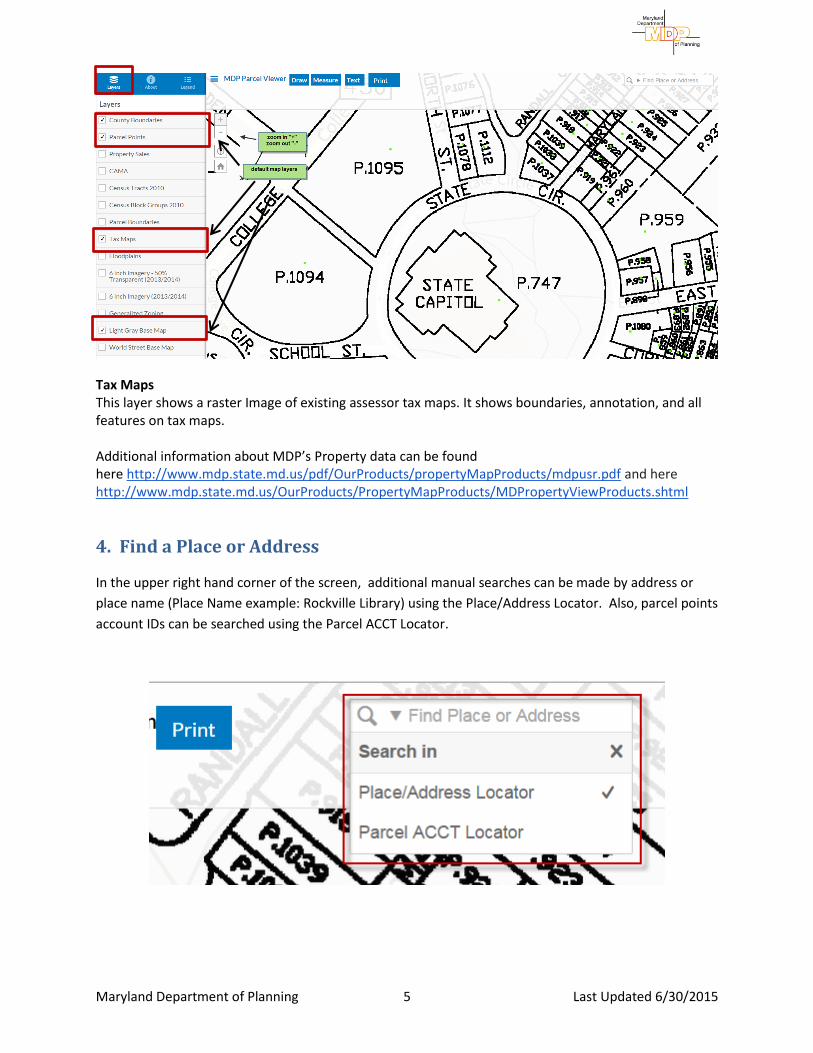
Tax Maps This layer shows a raster Image of existing assessor tax maps. It shows boundaries, annotation, and all features on tax maps. Additional information about MDP’s Property data can be found here http://www.mdp.state.md.us/pdf/OurProducts/propertyMapProducts/mdpusr.pdf and here http://www.mdp.state.md.us/OurProducts/PropertyMapProducts/MDPropertyViewProducts.shtml
4. Find a Place or Address
In the upper right hand corner of the screen, additional manual searches can be made by address or
place name (Place Name example: Rockville Library) using the Place/Address Locator. Also, parcel points
account IDs can be searched using the Parcel ACCT Locator.
Maryland Department of Planning 6 Last Updated 6/30/2015
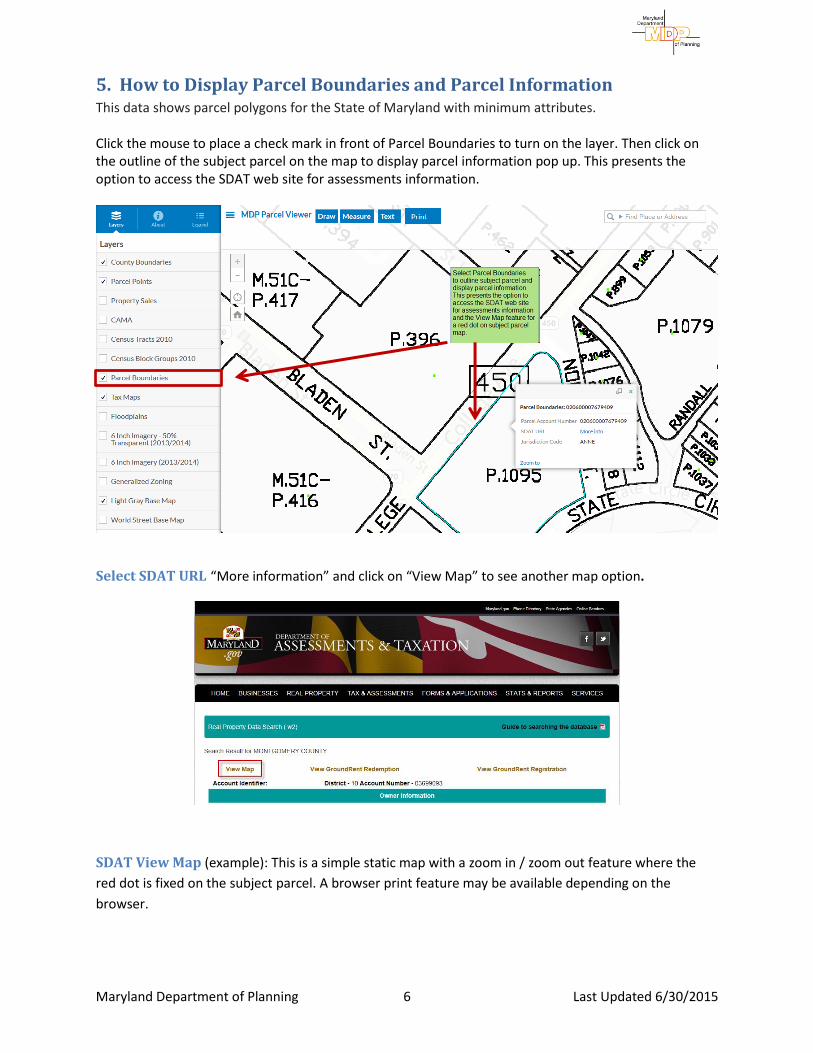
5. How to Display Parcel Boundaries and Parcel Information This data shows parcel polygons for the State of Maryland with minimum attributes. Click the mouse to place a check mark in front of Parcel Boundaries to turn on the layer. Then click on the outline of the subject parcel on the map to display parcel information pop up. This presents the option to access the SDAT web site for assessments information.
Select SDAT URL “More information” and click on “View Map” to see another map option.
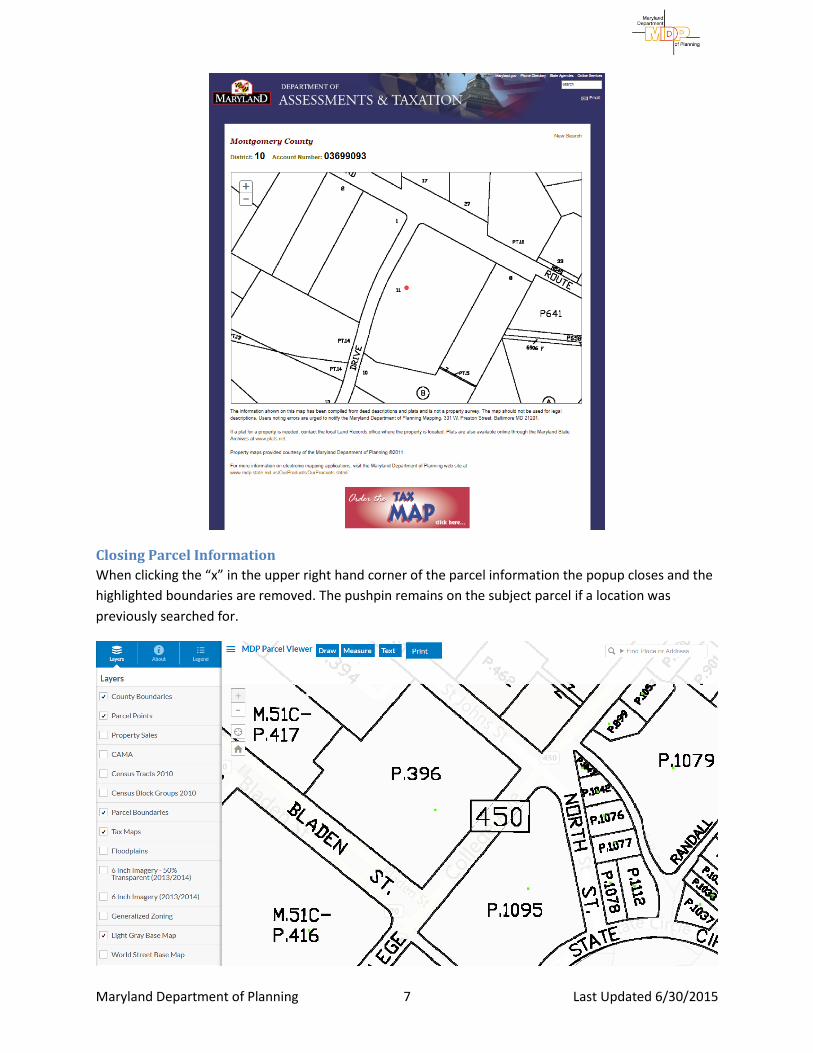
SDAT View Map (example): This is a simple static map with a zoom in / zoom out feature where the
red dot is fixed on the subject parcel. A browser print feature may be available depending on the
browser.
Maryland Department of Planning 7 Last Updated 6/30/2015
Closing Parcel Information
When clicking the “x” in the upper right hand corner of the parcel information the popup closes and the
highlighted boundaries are removed. The pushpin remains on the subject parcel if a location was
previously searched for.
Maryland Department of Planning 8 Last Updated 6/30/2015
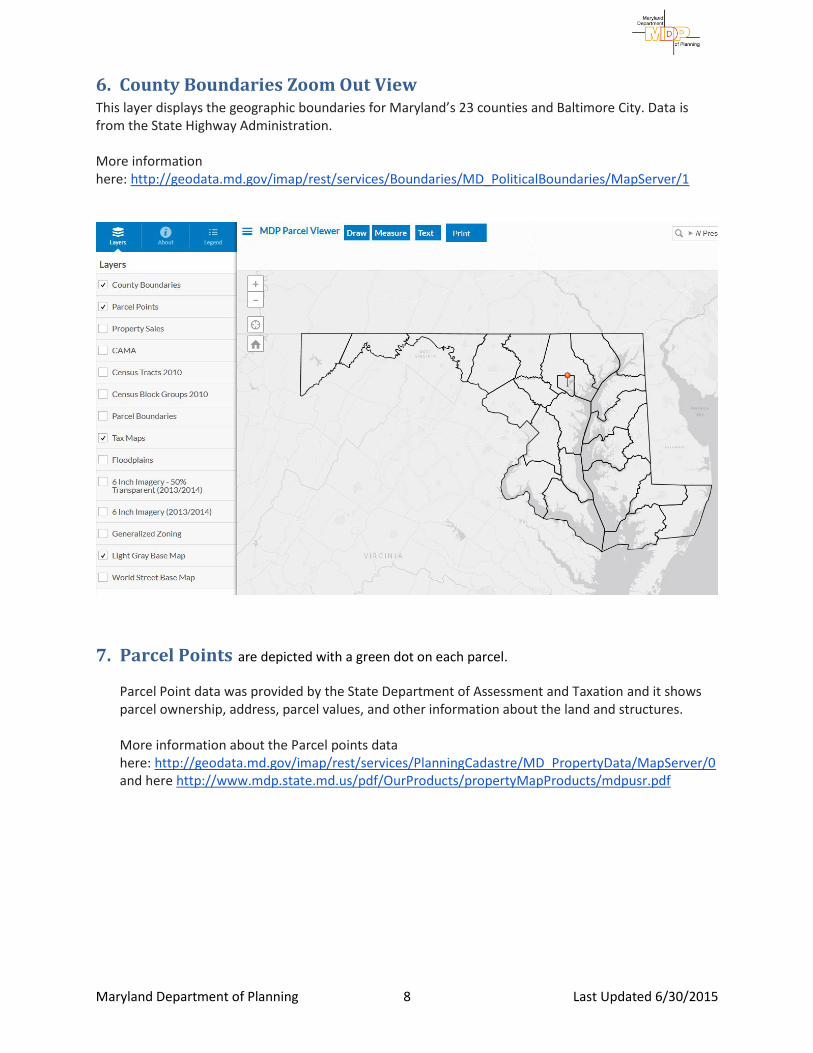
6. County Boundaries Zoom Out View This layer displays the geographic boundaries for Maryland’s 23 counties and Baltimore City. Data is from the State Highway Administration. More information here: http://geodata.md.gov/imap/rest/services/Boundaries/MD_PoliticalBoundaries/MapServer/1
7. Parcel Points are depicted with a green dot on each parcel.
Parcel Point data was provided by the State Department of Assessment and Taxation and it shows parcel ownership, address, parcel values, and other information about the land and structures. More information about the Parcel points data here: http://geodata.md.gov/imap/rest/services/PlanningCadastre/MD_PropertyData/MapServer/0 and here http://www.mdp.state.md.us/pdf/OurProducts/propertyMapProducts/mdpusr.pdf
Maryland Department of Planning 9 Last Updated 6/30/2015
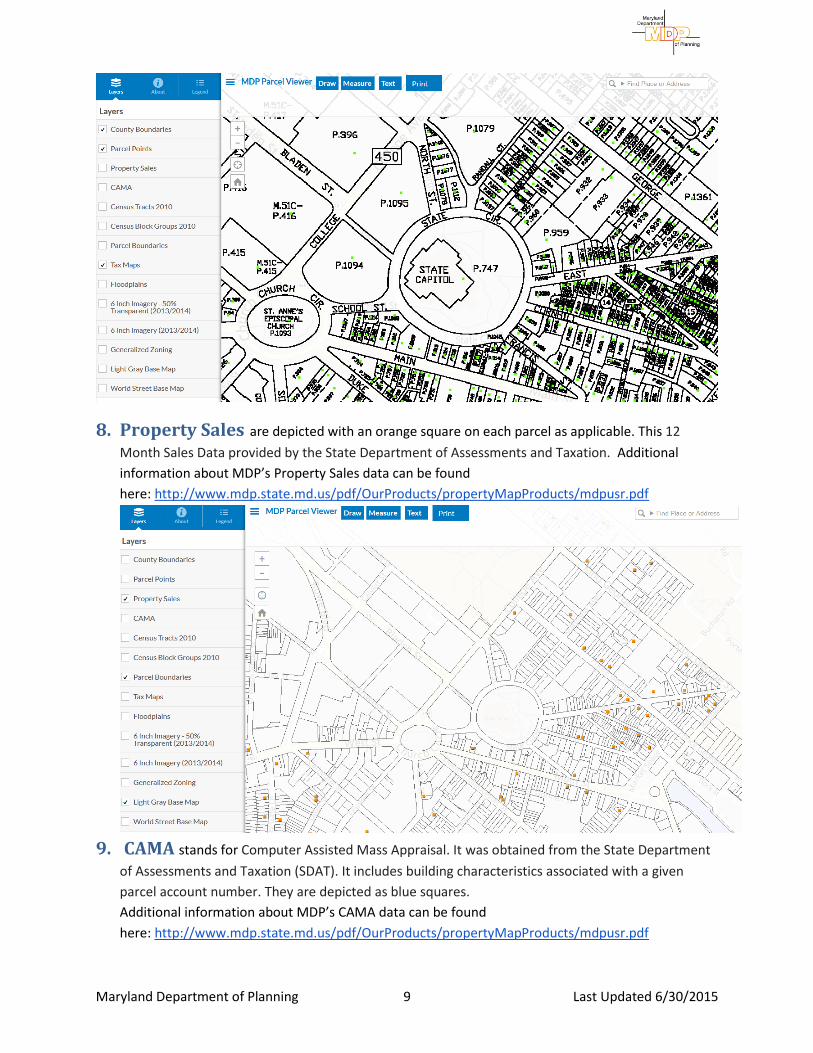
8. Property Sales are depicted with an orange square on each parcel as applicable. This 12
Month Sales Data provided by the State Department of Assessments and Taxation. Additional
information about MDP’s Property Sales data can be found
here: http://www.mdp.state.md.us/pdf/OurProducts/propertyMapProducts/mdpusr.pdf
9. CAMA stands for Computer Assisted Mass Appraisal. It was obtained from the State Department
of Assessments and Taxation (SDAT). It includes building characteristics associated with a given
parcel account number. They are depicted as blue squares.
Additional information about MDP’s CAMA data can be found
here: http://www.mdp.state.md.us/pdf/OurProducts/propertyMapProducts/mdpusr.pdf
Maryland Department of Planning 10 Last Updated 6/30/2015
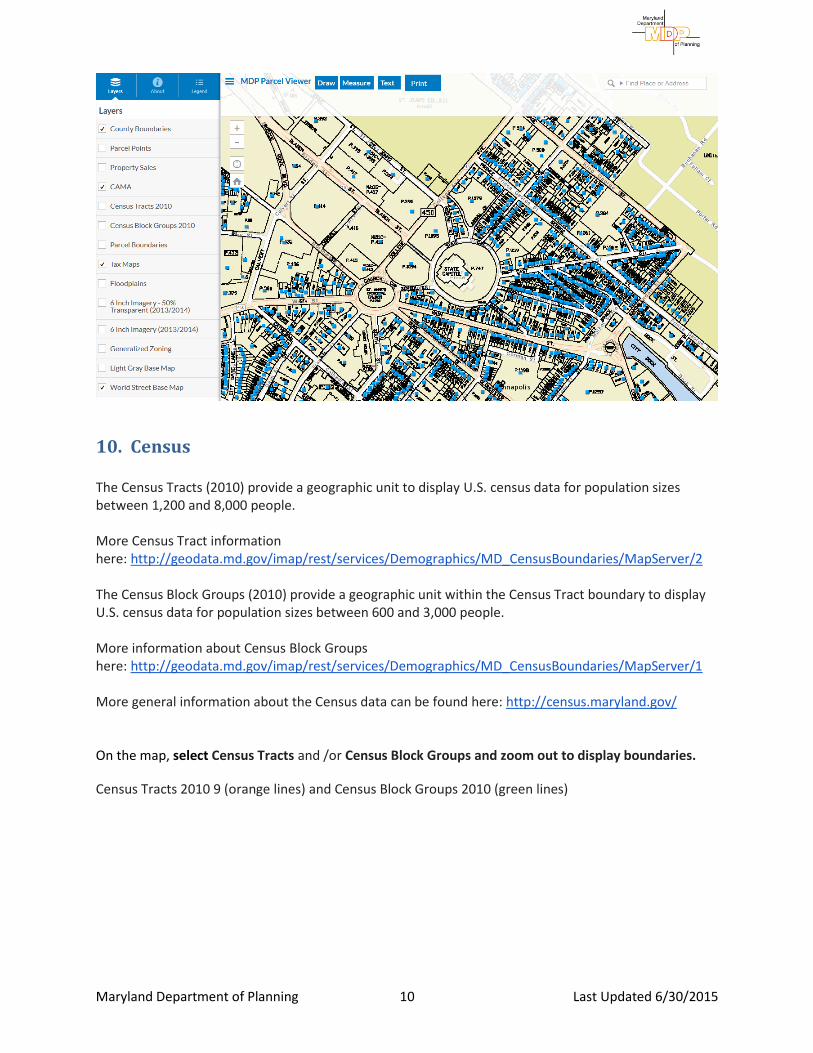
10. Census The Census Tracts (2010) provide a geographic unit to display U.S. census data for population sizes between 1,200 and 8,000 people. More Census Tract information here: http://geodata.md.gov/imap/rest/services/Demographics/MD_CensusBoundaries/MapServer/2 The Census Block Groups (2010) provide a geographic unit within the Census Tract boundary to display U.S. census data for population sizes between 600 and 3,000 people. More information about Census Block Groups here: http://geodata.md.gov/imap/rest/services/Demographics/MD_CensusBoundaries/MapServer/1 More general information about the Census data can be found here: http://census.maryland.gov/ On the map, select Census Tracts and /or Census Block Groups and zoom out to display boundaries.
Census Tracts 2010 9 (orange lines) and Census Block Groups 2010 (green lines)
Maryland Department of Planning 11 Last Updated 6/30/2015
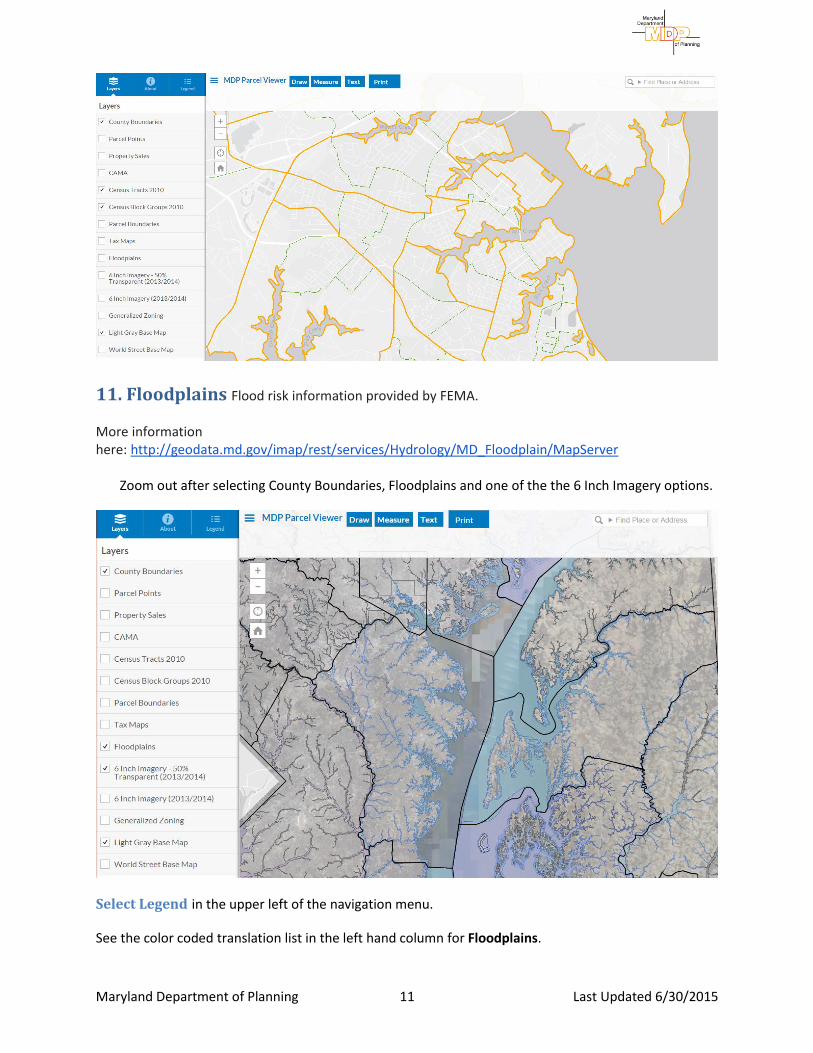
11. Floodplains Flood risk information provided by FEMA. More information here: http://geodata.md.gov/imap/rest/services/Hydrology/MD_Floodplain/MapServer
Zoom out after selecting County Boundaries, Floodplains and one of the the 6 Inch Imagery options.
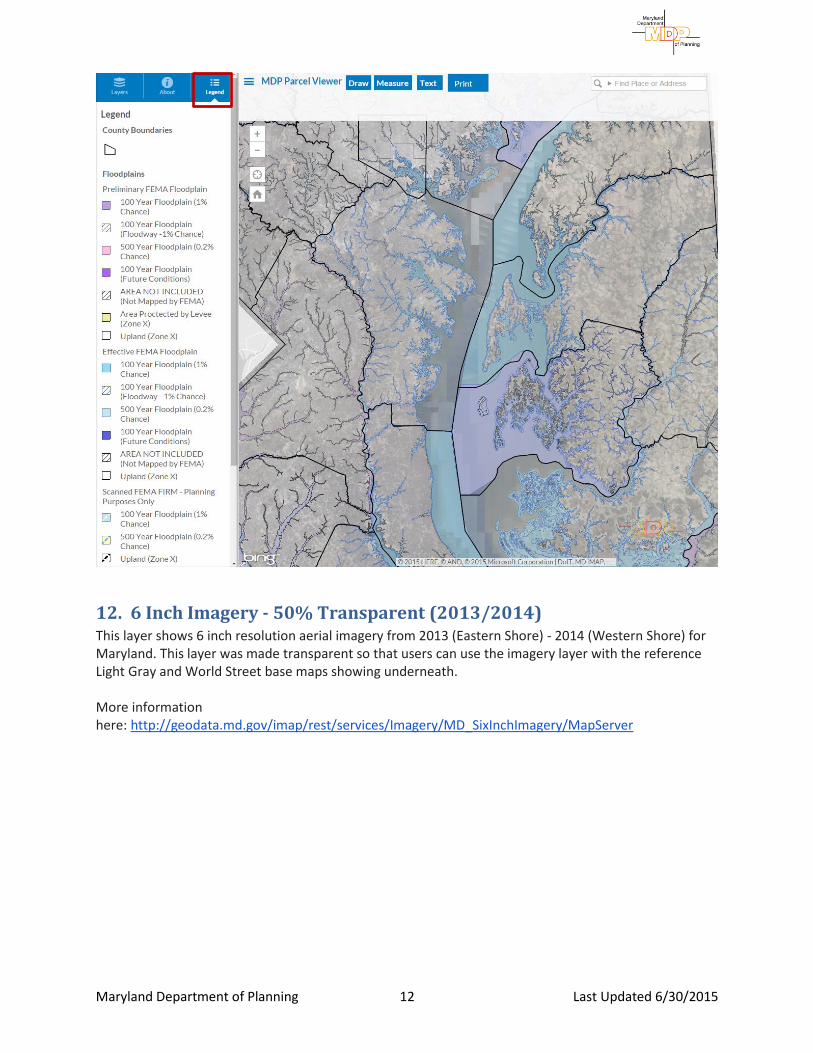
Select Legend in the upper left of the navigation menu.
See the color coded translation list in the left hand column for Floodplains.
Maryland Department of Planning 12 Last Updated 6/30/2015
12. 6 Inch Imagery - 50% Transparent (2013/2014) This layer shows 6 inch resolution aerial imagery from 2013 (Eastern Shore) - 2014 (Western Shore) for Maryland. This layer was made transparent so that users can use the imagery layer with the reference Light Gray and World Street base maps showing underneath. More information here: http://geodata.md.gov/imap/rest/services/Imagery/MD_SixInchImagery/MapServer
Maryland Department of Planning 13 Last Updated 6/30/2015
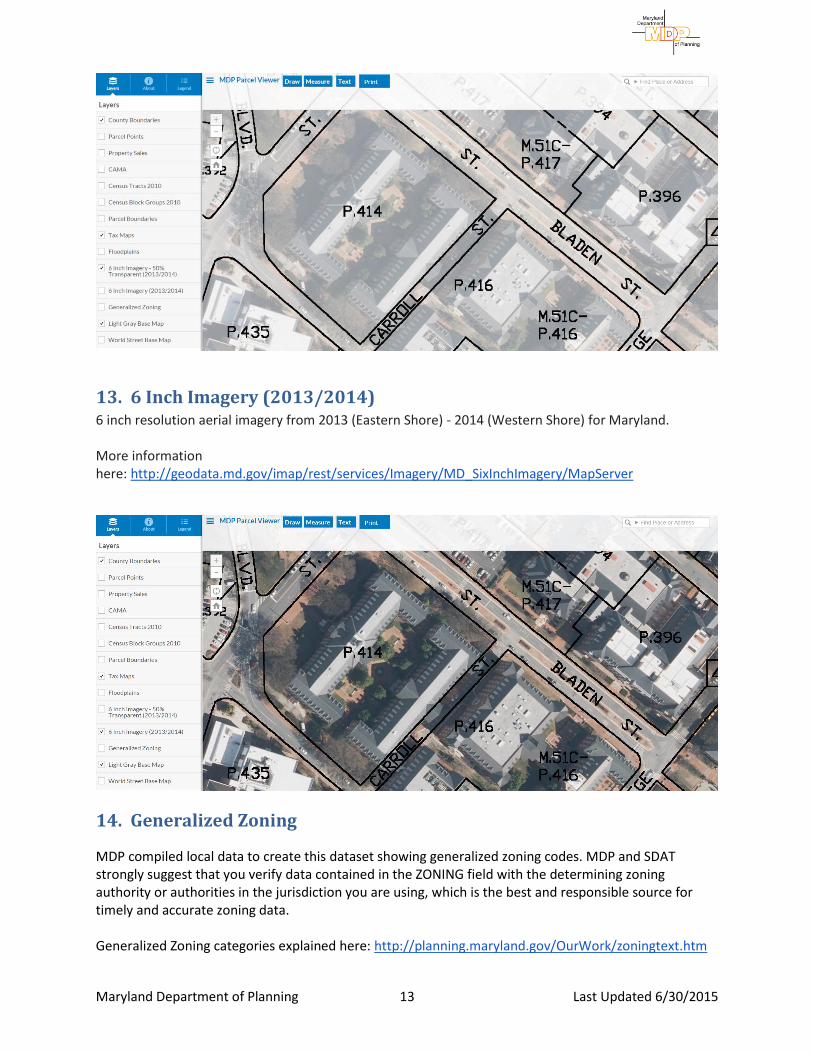
13. 6 Inch Imagery (2013/2014) 6 inch resolution aerial imagery from 2013 (Eastern Shore) - 2014 (Western Shore) for Maryland. More information here: http://geodata.md.gov/imap/rest/services/Imagery/MD_SixInchImagery/MapServer
14. Generalized Zoning
MDP compiled local data to create this dataset showing generalized zoning codes. MDP and SDAT strongly suggest that you verify data contained in the ZONING field with the determining zoning authority or authorities in the jurisdiction you are using, which is the best and responsible source for timely and accurate zoning data. Generalized Zoning categories explained here: http://planning.maryland.gov/OurWork/zoningtext.htm
Maryland Department of Planning 14 Last Updated 6/30/2015
Contact information for zoning here: http://planning.maryland.gov/OurWork/Counties/LocalPlanningByCounty.shtml
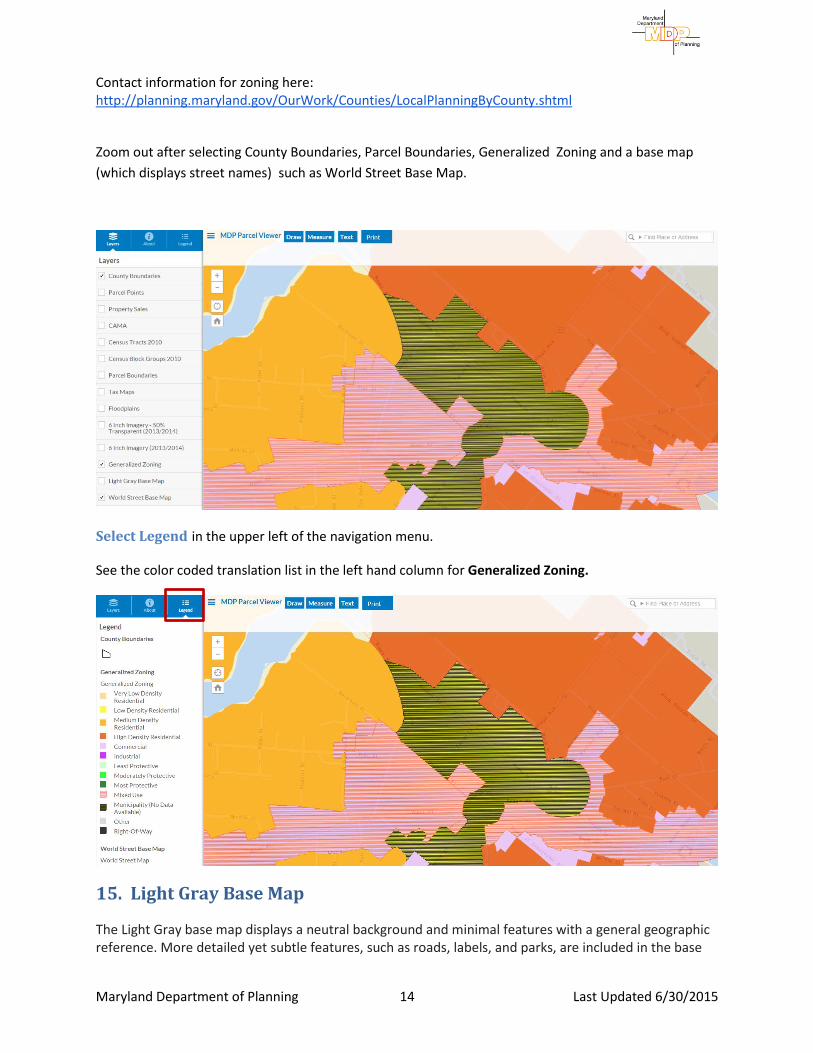
Zoom out after selecting County Boundaries, Parcel Boundaries, Generalized Zoning and a base map
(which displays street names) such as World Street Base Map.
Select Legend in the upper left of the navigation menu.
See the color coded translation list in the left hand column for Generalized Zoning.
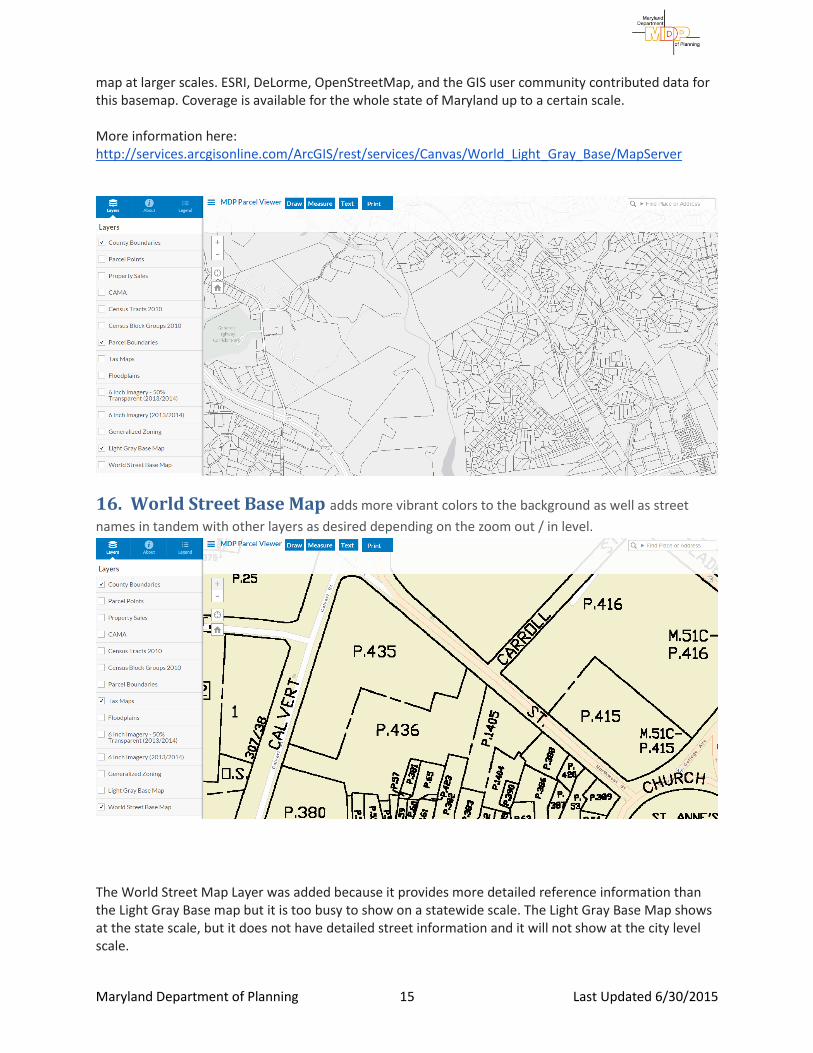
15. Light Gray Base Map
The Light Gray base map displays a neutral background and minimal features with a general geographic reference. More detailed yet subtle features, such as roads, labels, and parks, are included in the base
Maryland Department of Planning 15 Last Updated 6/30/2015
map at larger scales. ESRI, DeLorme, OpenStreetMap, and the GIS user community contributed data for this basemap. Coverage is available for the whole state of Maryland up to a certain scale. More information here: http://services.arcgisonline.com/ArcGIS/rest/services/Canvas/World_Light_Gray_Base/MapServer
16. World Street Base Map adds more vibrant colors to the background as well as street
names in tandem with other layers as desired depending on the zoom out / in level.
The World Street Map Layer was added because it provides more detailed reference information than the Light Gray Base map but it is too busy to show on a statewide scale. The Light Gray Base Map shows at the state scale, but it does not have detailed street information and it will not show at the city level scale.
Maryland Department of Planning 16 Last Updated 6/30/2015
The World Street map shows highway level data of the world such as major/minor roads, railways, water features, administrative boundaries, parks, and landmarks.
More information about the World Street Map Layer here
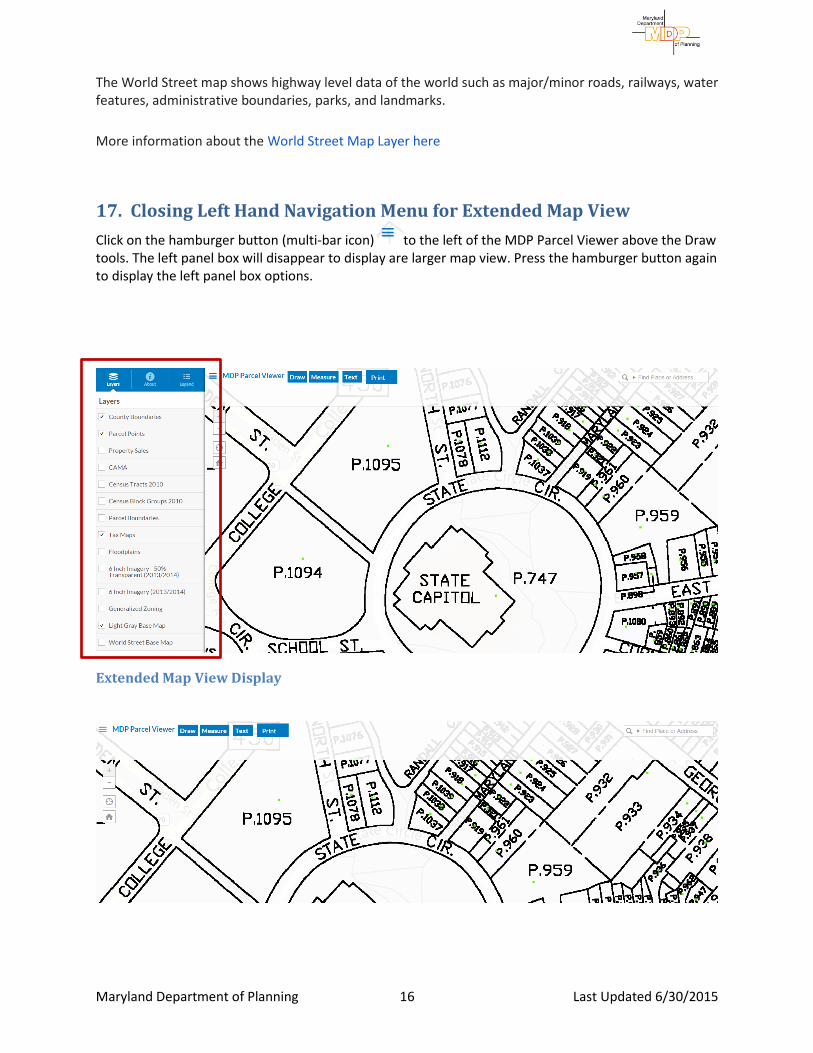
17. Closing Left Hand Navigation Menu for Extended Map View
Click on the hamburger button (multi-bar icon) to the left of the MDP Parcel Viewer above the Draw tools. The left panel box will disappear to display are larger map view. Press the hamburger button again to display the left panel box options.
Extended Map View Display
Maryland Department of Planning 17 Last Updated 6/30/2015
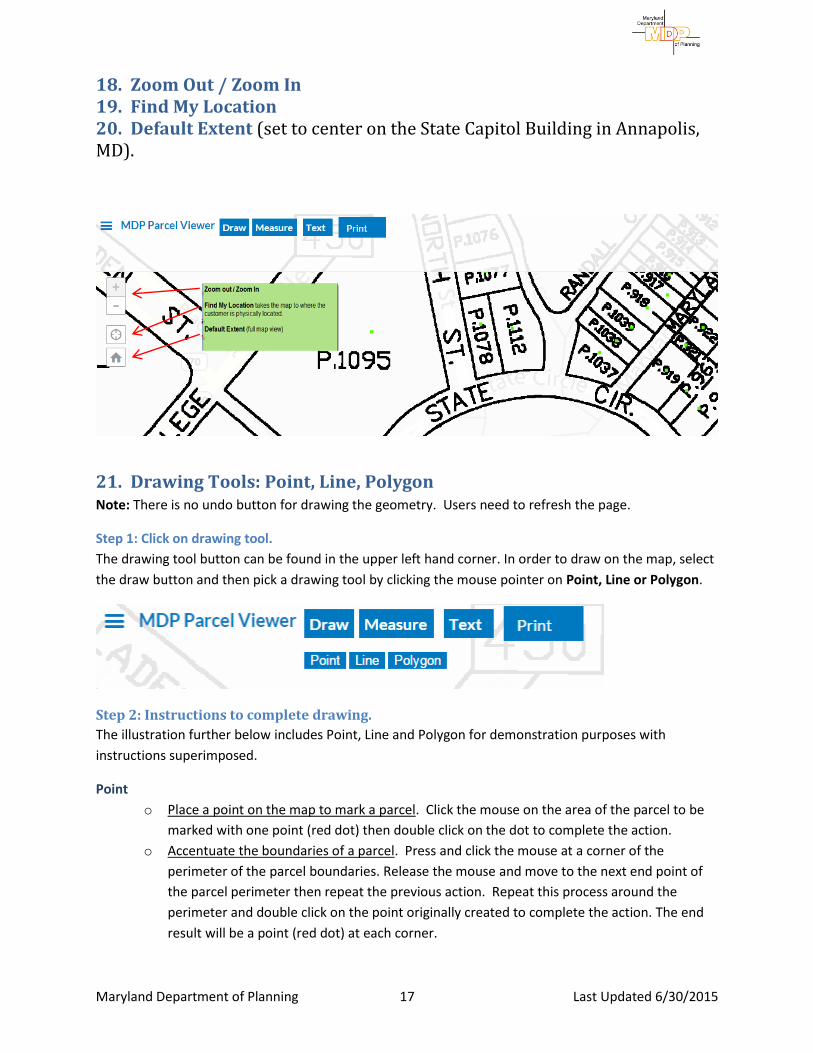
18. Zoom Out / Zoom In 19. Find My Location 20. Default Extent (set to center on the State Capitol Building in Annapolis, MD).
21. Drawing Tools: Point, Line, Polygon Note: There is no undo button for drawing the geometry. Users need to refresh the page.
Step 1: Click on drawing tool.
The drawing tool button can be found in the upper left hand corner. In order to draw on the map, select
the draw button and then pick a drawing tool by clicking the mouse pointer on Point, Line or Polygon.
Step 2: Instructions to complete drawing.
The illustration further below includes Point, Line and Polygon for demonstration purposes with
instructions superimposed.
Point
o Place a point on the map to mark a parcel. Click the mouse on the area of the parcel to be
marked with one point (red dot) then double click on the dot to complete the action.
o Accentuate the boundaries of a parcel. Press and click the mouse at a corner of the
perimeter of the parcel boundaries. Release the mouse and move to the next end point of
the parcel perimeter then repeat the previous action. Repeat this process around the
perimeter and double click on the point originally created to complete the action. The end
result will be a point (red dot) at each corner.
Maryland Department of Planning 18 Last Updated 6/30/2015
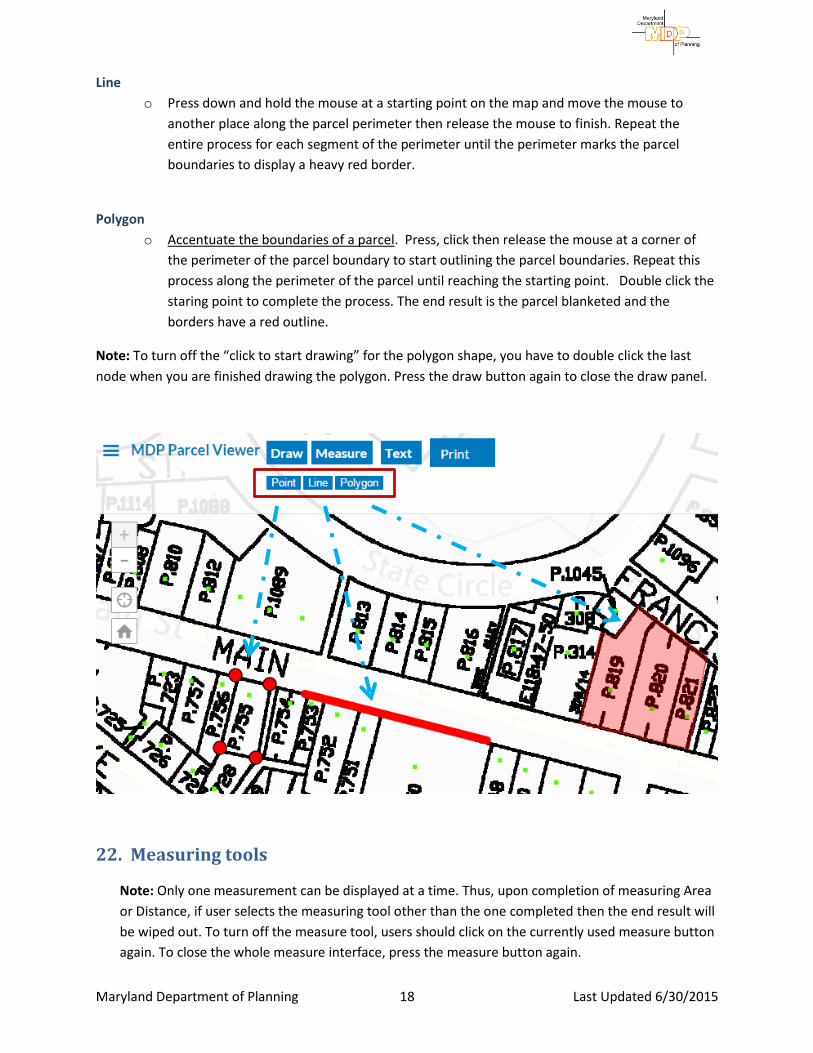
Line
o Press down and hold the mouse at a starting point on the map and move the mouse to
another place along the parcel perimeter then release the mouse to finish. Repeat the
entire process for each segment of the perimeter until the perimeter marks the parcel
boundaries to display a heavy red border.
Polygon
o Accentuate the boundaries of a parcel. Press, click then release the mouse at a corner of
the perimeter of the parcel boundary to start outlining the parcel boundaries. Repeat this
process along the perimeter of the parcel until reaching the starting point. Double click the
staring point to complete the process. The end result is the parcel blanketed and the
borders have a red outline.
Note: To turn off the “click to start drawing” for the polygon shape, you have to double click the last
node when you are finished drawing the polygon. Press the draw button again to close the draw panel.
22. Measuring tools
Note: Only one measurement can be displayed at a time. Thus, upon completion of measuring Area
or Distance, if user selects the measuring tool other than the one completed then the end result will
be wiped out. To turn off the measure tool, users should click on the currently used measure button
again. To close the whole measure interface, press the measure button again.
Maryland Department of Planning 19 Last Updated 6/30/2015
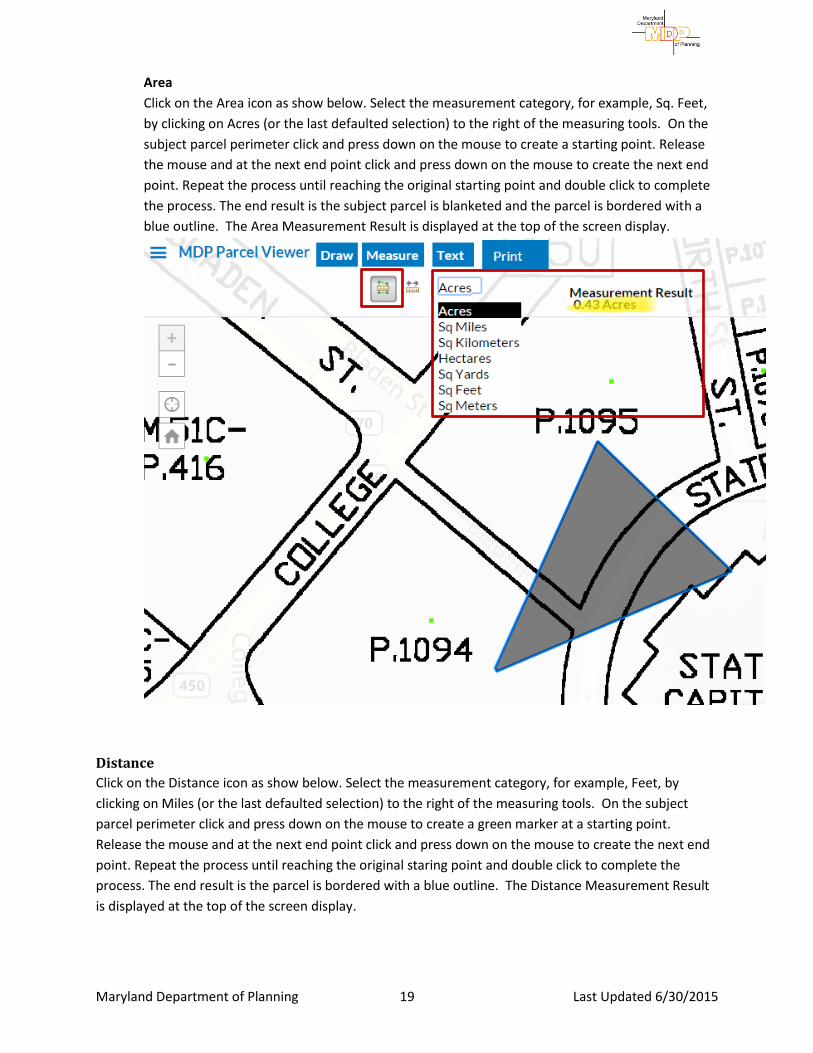
Area
Click on the Area icon as show below. Select the measurement category, for example, Sq. Feet,
by clicking on Acres (or the last defaulted selection) to the right of the measuring tools. On the
subject parcel perimeter click and press down on the mouse to create a starting point. Release
the mouse and at the next end point click and press down on the mouse to create the next end
point. Repeat the process until reaching the original starting point and double click to complete
the process. The end result is the subject parcel is blanketed and the parcel is bordered with a
blue outline. The Area Measurement Result is displayed at the top of the screen display.
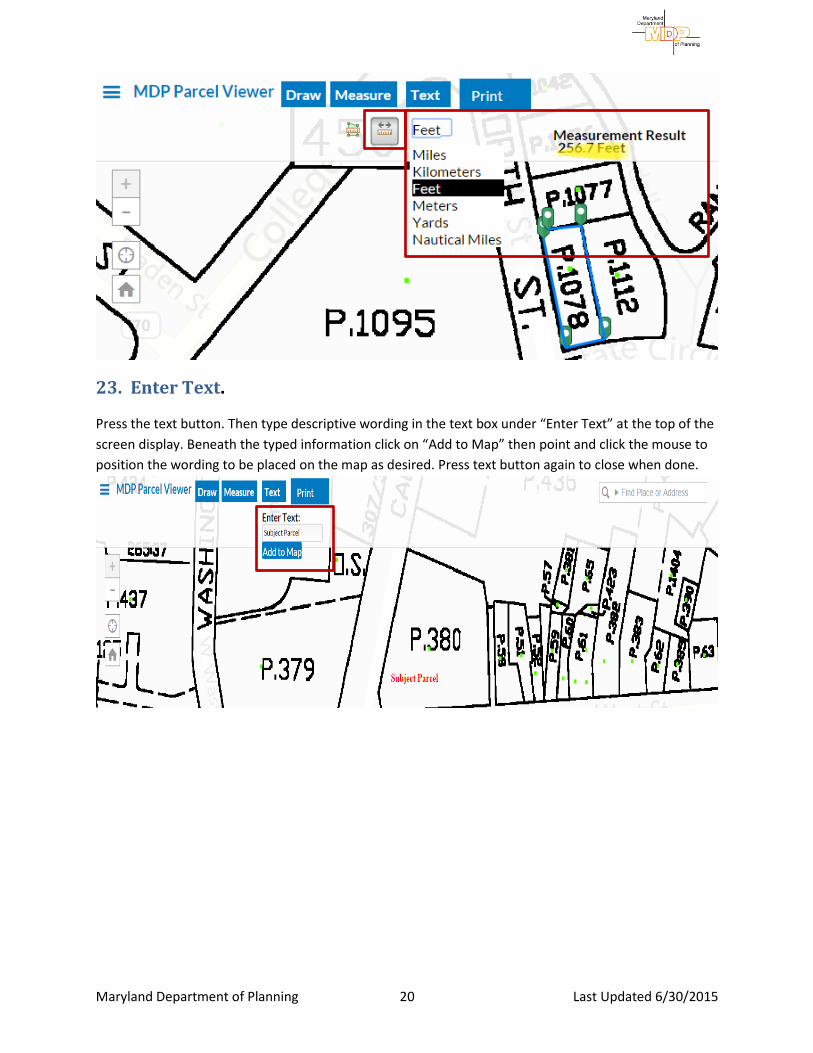
Distance Click on the Distance icon as show below. Select the measurement category, for example, Feet, by
clicking on Miles (or the last defaulted selection) to the right of the measuring tools. On the subject
parcel perimeter click and press down on the mouse to create a green marker at a starting point.
Release the mouse and at the next end point click and press down on the mouse to create the next end
point. Repeat the process until reaching the original staring point and double click to complete the
process. The end result is the parcel is bordered with a blue outline. The Distance Measurement Result
is displayed at the top of the screen display.
Maryland Department of Planning 20 Last Updated 6/30/2015
23. Enter Text.
Press the text button. Then type descriptive wording in the text box under “Enter Text” at the top of the
screen display. Beneath the typed information click on “Add to Map” then point and click the mouse to
position the wording to be placed on the map as desired. Press text button again to close when done.
Maryland Department of Planning 21 Last Updated 6/30/2015
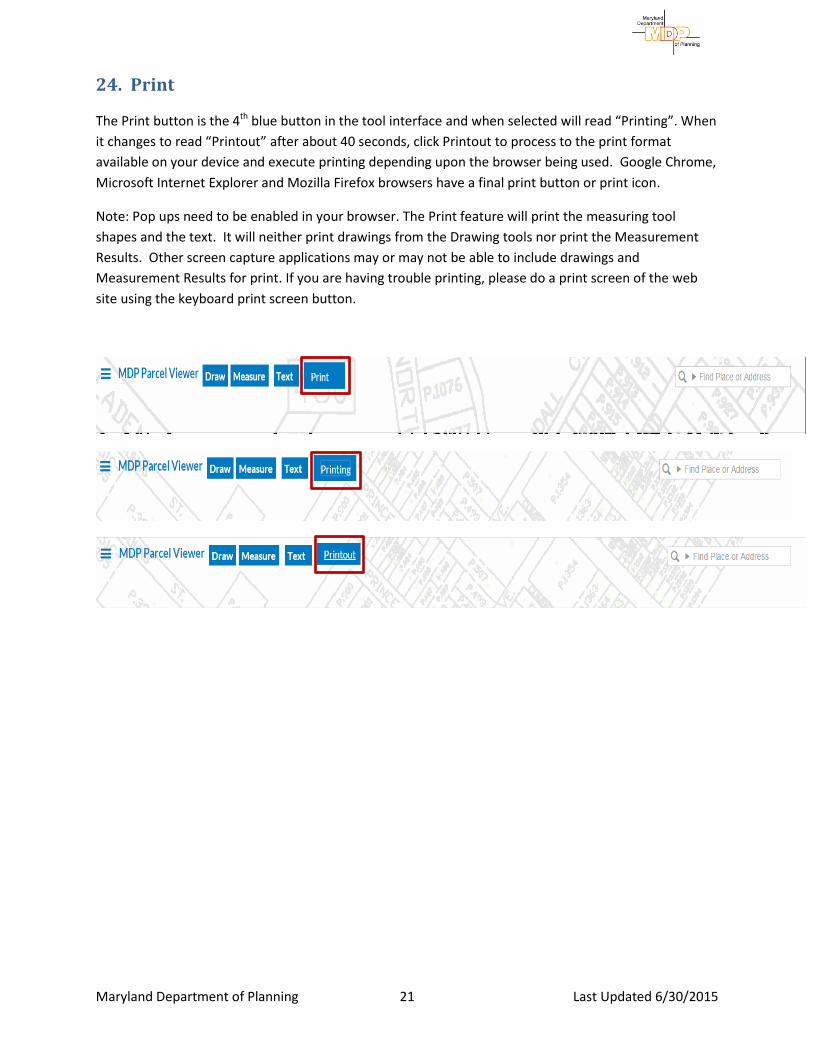
24. Print
The Print button is the 4th blue button in the tool interface and when selected will read “Printing”. When
it changes to read “Printout” after about 40 seconds, click Printout to process to the print format
available on your device and execute printing depending upon the browser being used. Google Chrome,
Microsoft Internet Explorer and Mozilla Firefox browsers have a final print button or print icon.
Note: Pop ups need to be enabled in your browser. The Print feature will print the measuring tool
shapes and the text. It will neither print drawings from the Drawing tools nor print the Measurement
Results. Other screen capture applications may or may not be able to include drawings and
Measurement Results for print. If you are having trouble printing, please do a print screen of the web
site using the keyboard print screen button.
Maryland Department of Planning 22 Last Updated 6/30/2015
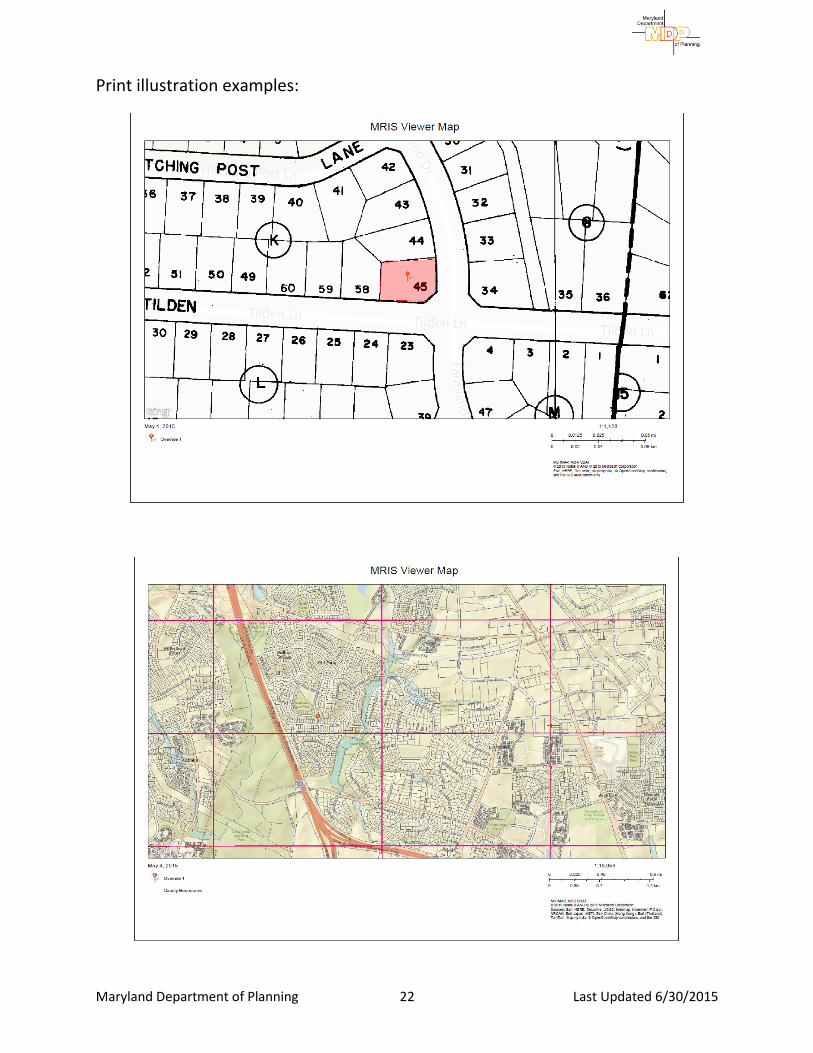
Print illustration examples: