mds program
DESCRIPTION
Program document for MDS.TRANSCRIPT
PROGRAM White[SUGAR]
Blake Thomas Caskey
PROGRAM White[SUGAR]
Blake Thomas Caskey

I
II
A STUDY OF SUGAR REFINEMENT AND THE ADAPTION OF THE INDUSTRIAL ENVIRONMENT
A PROCESS OF SUGAR By
BLAKE THOMAS CASKEY
A Thesis In Architecture Submitted to the Architecture Faculty of the College of Architecture
Of Texas Tech University in Partial Fulfillment for the Degree of
MASTERS OF ARCHITECTURE
____________________________________ Prof. James White
Chairman of the Committee
____________________________________ ___________________________________ Prof. John White Dr. Elizabeth Louden
Master Project Advisor Master Project Advisor
____________________________________ Andrew Vernooy, AIA
Dean, College of Architecture

III
Contents Abstract [V] Thesis Statement [VI] Scope of Project/Context Statement [VI] Theory Supporting Theory Preservation [2] Sustainability [12] Historic Sustainability [22] Architectural Issues [32]
Potential Design Response [35] Architectural Case Studies [47] References [51]
Facility Existing State Epistemology [54]
Modern Refining Process [66] Bone Char Filtration [70] Char House [76]
Mission Statement / Goals[85] Spatial Summery / Activity Analysis [99] Architectural Precedents [119] References [125]
Space Summery [127]

IV
Context Overview [130] Sugar Land [148] Site Analysis [154] Contextual Synthesis Relevant Content [174] Architectural Precedents [177] References [181] Appendix A Preservation Standards [183] B LEED-EV 2.0 Reference [187] C Issues Reference[191] D Environmental Controls / Lighting Reference[195]
V
Abstract
The Imperial Sugar Mill in Sugar Land Texas has been processing sugar in the same location since 1845. Due to recent economic events, Imperial had to close down the sugar refinery in 2003. The project will focus on redeveloping this factory site using both historical preservation guidelines as well as sustainable design concepts. It will focus on the historic Char House and adapt the structure into both a museum for the history of Sugar Land as well as an venue for the arts. Sugar Land has no major art galleries or museums and the project will focus on the opportunities in combining both artistic gallery space and museum exhibits as well as preserving the historical sense of place of the area. The design approach is to provide a holistic solution to both the historical fabric of the site as well as the viability of sustainable design concepts for the contemporary adaptive reuse.
VI
Thesis Statement
Abandoned industrial architecture can be examined from original intent through adaptive reuse and sustain-able design concepts to create a place both rich in history and provide a contemporary reuse.
Scope of Project
One of the most distinct buildings in Sugar Land Texas is Imperial Sugar Factory Char house. It is a 60,000 square foot building used in the purification process of sugar manufacturing. The project will center around
its redevelopment and adaptive reuse providing community functions within the old char house.
Context Statement The site is located in the old Imperial Sugar Factory Refinery in Sugar Land Texas. The refinery ceased op-erations in January of 2002 and is now in the process of redevelopment. The refinery is located on 724 acres in northwest Sugar Land. The original factory occupied 34.5acres and was located on the north east
corner of the plantation on Oyster Creek.
Facility Type The project will be an adaptive reuse of an industrial building from a sugar manufacturing process
to a museum and art gallery.

P 1
[PR
ES
ER
VA
TIO
N]
P 2
Architecture is constantly regenerating and
reinventing itself. Many of these cycles of investi-
gation center around the exploration of past
forms of architectural expression. Each genera-
tion brings about new ideas and interpretations of
past forms. These cycles highlight forms and
buildings which signify or embodies important
idea and thoughts during a certain time. These
buildings act as transcendental artifacts, which
convey both time and history. The power of
these historical artifact juxtaposed against the
present, serves to form a historical value of
place.
The basic need for preservation is the link be-
tween buildings and use. If the building is con-
tinuously used, it is naturally preserved. Early
preservation was based driven upon economics
and financing, with little thought given to charac-
ter or integrity. Much of the early preservation of
buildings was out of necessity with little thought
given to many nonessential structures. However,
as early as 44AD the Romans instituted penalties
P 3
of demolishing buildings for speculative purposes.
These early forms of preservation mainly focused
upon celebrating important events, monuments,
and religious structures.1
It was not until the 19th century that legislation
rooted in romantic and historic philosophy would
begin to emerge an avocation for the protection of
historical properties. These way in which these
philosophies are received and implemented varies
by country. Preservation is first embraced in
France with support from the government. Britain
would follow, centering primarily with the support
of private individuals, such as William Morris, who
founded societies of the protection of ancient
buildings. Heavily influenced by the writing of
John Ruskin, these foundations would eventually
lead to laws limiting the rights of property own-
ers.2 The preservation attitudes of England would
lay the basis for those in the United States. With
this interest in preservation growing two major
ideas about preservation arose.
As the mainstream views of historic preserva-
tion develop, the two philosophies emerge which
center around the teachings of Viollet-le-Duc and
John Ruskin. Viollet-le-Duc wrote that restoration
is a "means to reestablish to a finished state,
which may in fact never have actually existed at
any given time.3" Viollet-le-Duc insisted that any
building could be rebuilt to look as it might have
existed in a certain time period or it may be re-
stored with contemporary features added. The
other main view was taken by John Ruskin. In
The Seven Lamps of Architecture he writes:
“Neither by the public, nor by those who
have the care of public monuments, is the true
meaning of the word restoration understood. It
means the most total destruction which a
building can suffer: a destruction out of which
no remnants can be gathered: a destruction
accompanied with false description of the thing
destroyed. Do not let us deceive ourselves in
this important matter; it is impossible, as im-
possible as to raise the dead, to restore any-
P 4
thing that has ever been great or beautiful in
architecture.4”
Ruskin centered around his belief that age was
the most important aspect of a building. His
views of conservation and preservation focusing
on the integrity of the structure and site. The
two views of Viollet-le-Duc and John Ruskin con-
tinue to be debated in the preservation move-
ments.
Preservation in the United States is as old as
the country itself. However, it would not become
prevalent until mid twentieth century.5 The
movement mainly centered around structures
which were becoming important American proper-
ties, such as George Washington’s Mount Vernon
and Philadelphia’s Independence Hall. Early pres-
ervation in America centered around two as-
pects, Patriotism and involvement from private
groups and individual.6
In 1779 the Massachusetts Historical Society
became the first in the United States and by 1876

P 5
there were seventy-eight historical societies in the
states.7 With mounting pressure from private
groups and individuals the federal government
passes the Antiquities Act of 1906, which pro-
tected historic monuments on government proper-
ties. The next law passed created the Nation
Parks Services in 1916. The Historic Sites Act of
1935 defines the national policy of preservation
for public use. This Act solidifies conservation in
America by establishing a standard of documenta-
tion, facilitating the employment of preservation
specialist, and providing a educational means of
heritage. The Act of 1949 establishes and defines
the powers of the National Trust for Historic Pres-
ervation. The Housing Act of 1961 and 1965 give
the Department of Housing and Urban Develop-
ment the power to use federal funds to move his-
toric structures in urban renewal areas.
In 1966 With Heritage So Rich is published and
galvanizes many of the aspects of modern preser-
vation movement in the United States. The book
explains:
“The pace of urbanization is accelerating and
the threat to our environmental heritage is
mounting; it will take more than the sounding
of periodic alarms to stem the tide. The United
States is a nation and a people on the move.
It is in an era of mobility and change. Every
year 20 per cent of the population moves from
its place of residence. The result is a feeling of
rootlessness combined with a longing for those
landmarks of the past which give us a sense of
stability and belonging. If the preservation
movement is to be successful, it must go be-
yond saving bricks and mortar. It must go
beyond saving the occasional historic houses
and opening museums. It must be more than
a cult of antiquarians. It must do more than
revere a few precious national shrines. It must
attempt to give a sense of orientation to our
society, using structures and objects of the
past to establish values of time and place.8”
The book recommends three issues which must
P 6
be addressed for the preservation movement to
be successful. First, the preservation movement
must recognize the importance of architecture,
design, and esthetics as well as historic and cul-
tural values. Emphasis is placed upon preserving
a building for its pleasing appearance and that
local sentiment do not find them less important
because they lack the proper historic credentials.
Second, new preservation must look beyond the
individual buildings and landmarks and concern
itself with the historic and architectural value of
areas and districts which contain special meaning
within communities. Third, if the effort to pre-
serve historic and architecturally significant areas
as well as individual buildings is to succeed, in-
tensive thought and study must be given to eco-
nomic conditions and tax policies which affect the
efforts to preserve such areas as living parts of
the community.
These recommendations influenced the values
of the preservation movement and resulted in the
passing of many laws. In 1966 the National His-
P 7
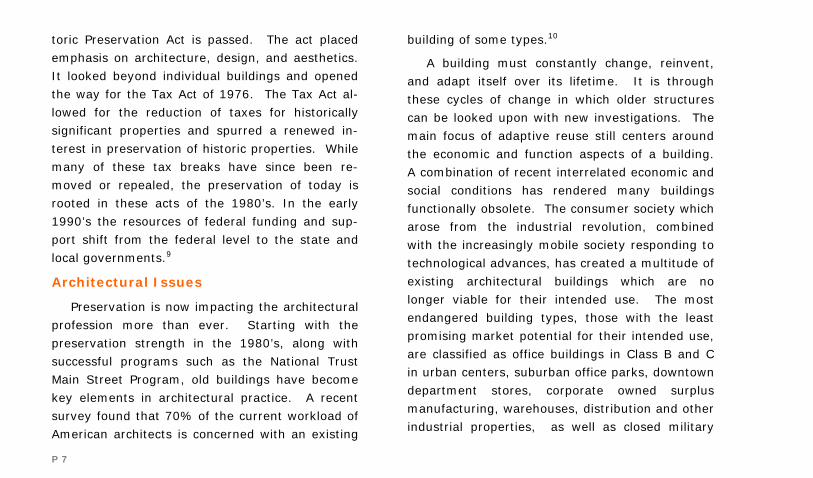
toric Preservation Act is passed. The act placed
emphasis on architecture, design, and aesthetics.
It looked beyond individual buildings and opened
the way for the Tax Act of 1976. The Tax Act al-
lowed for the reduction of taxes for historically
significant properties and spurred a renewed in-
terest in preservation of historic properties. While
many of these tax breaks have since been re-
moved or repealed, the preservation of today is
rooted in these acts of the 1980’s. In the early
1990’s the resources of federal funding and sup-
port shift from the federal level to the state and
local governments.9
Architectural Issues
Preservation is now impacting the architectural
profession more than ever. Starting with the
preservation strength in the 1980’s, along with
successful programs such as the National Trust
Main Street Program, old buildings have become
key elements in architectural practice. A recent
survey found that 70% of the current workload of
American architects is concerned with an existing
building of some types.10
A building must constantly change, reinvent,
and adapt itself over its lifetime. It is through
these cycles of change in which older structures
can be looked upon with new investigations. The
main focus of adaptive reuse still centers around
the economic and function aspects of a building.
A combination of recent interrelated economic and
social conditions has rendered many buildings
functionally obsolete. The consumer society which
arose from the industrial revolution, combined
with the increasingly mobile society responding to
technological advances, has created a multitude of
existing architectural buildings which are no
longer viable for their intended use. The most
endangered building types, those with the least
promising market potential for their intended use,
are classified as office buildings in Class B and C
in urban centers, suburban office parks, downtown
department stores, corporate owned surplus
manufacturing, warehouses, distribution and other
industrial properties, as well as closed military
P 8
facilities.11 The massive amount of underutilized
buildings which retain only a fraction of their for-
mal value can offer tremendous opportunity to
adapt and redevelop these properties.
Many older buildings can provide elements
which most new buildings can not afford to dupli-
cate. These characteristics can be high ceilings,
well proportioned layouts, historic construction
types, as well as large spaces. The patina of old
materials, such as brick walls, heavy timber
trusses, and metal work can add considerable to
a project. Many older building technologies which
were considered unfinished are now looked upon
favorably and if simply left exposed can offer
lower cost and greater market capabilities to pro-
jects.12 When buildings are preserved and re-
stored they can posses characteristics and appeal
to a growing number of users.
Many historic buildings are being economically
adapted for new uses and functions with a wider
range of involvement from multiple users and
organizations than ever before. In the beginning,

P 9
a large majority of adaptive reuse projects were
speculative and initiated by developers. Now,
buildings are just as likely to be reused by the
owners of the properties who are looking to satisfy
the user groups needs. Feasibility of adaptive re-
use projects includes adequate market demand,
public approval, physical characteristics and loca-
tion, as well as the availability of investors.13
Many helpful factors already exis in adapting a
historic property. Oftentimes the current city and
community infrastructure is already in place as
well as favorable locations within the urban envi-
ronments.
A successful adaptive reuse project should cen-
ter on process instead of product. It should en-
gage the dynamics of the future but must also
address the past. The adaption and preservation
must celebrate diversity while moderating moder-
nity with tradition. This process is the inverse of
new construction. It centers on the reduction of
volumes rather than their creation. These pro-
jects engage a connection between memory and
anticipation, as well as time and space. Aldo Van
Eyck describes this relationship as, “places we
remember and places we anticipate are mingled in
present time. Memory and anticipation, in fact,
constitute the real perspective of space, giving it
depth.14”
As David Chipperfield states,
“Architecture must transform between the
old and new, creating something containing
both. We should not live in a bright shining
new future, any more than we should hide in
the pastiche of the past. We must inhabit a
deeper evolving present, motivated by the
possibility of change, restricted by the baggage
of memory and experience.15”
P 10
End Notes 1 White, John. ARCH 5324 History and Theory of Historic Preservation. Texas Tech University: Fall 2007. 2 Greer, Nora Richter. Architecture Transformed: New Life for Old Buildings. Massachusetts: Rockport Publishers, 1998. 3 Eugène-Emmanuel Viollet-le-Duc. The Foundations of Architecture. New York: George Braziller. P 195. 4 John Ruskin. The Seven Lamps of Architecture. New York: Dover Publications. P 186. 5 Cantacuzino, Sherban. Re/Architecture: Old Buildings/New Uses. New York: Abbeville Press, 1989. 6 White, John. ARCH 5324 History and Theory oh Historic Preservation. Texas Tech University: Fall 2007. 7 Stipes, Robert E. A Richer Heritage: Historic Preservation in the Twenty-First Century. North Carolina: NC Press, 2003. 8 United State Conference of Mayors. With Heritage So Rich. New York: Preservation Press, 1983. 9 Stipes, Robert E. A Richer Heritage: Historic Preservation in the Twenty-First Century. North Carolina: NC Press, 2003. 10 Rober, Philippie. Adaptation: New Uses for Older Buildings. New York: Princeton Architectural Press, 1991. 11 Gause, Jo Allen. New Uses For Obsolete Buildings. Washington DC: Urban Land Institute, 1996. 12 Patina refers to accumulated changes in surface texture and color that result from normal use of an object. 13 Cantacuzino, Sherban. Re/Architecture: Old Buildings/New Uses. New York: Abbeville Press, 1989. 14 Byard, Paul Spencer. The Architecture of Additions: Design and Regulations. New York: Norton & Company, 1998. 15 Rober, Philippie. Adaptation: New Uses for Older Buildings. New York: Princeton Architectural Press, 1991.

P 11
[SU
STA
INA
BIL
ITY
]
P 12
In the earliest state, sustainable habitats were
simple caves and sites inhabited by humans and
passed from one generation to the next. Sustain-
able architecture in ancient cities usually meant
construction based out of regionally accessible
materials which satisfied the demands of climate,
topography, and agriculture. This sustainability
was rarely given much thought and hardly ever
approached outside a local area. As technology
increased and the impact of the Industrial Revolu-
tion caused a transition to a consumer society,
sustainability was lost for quick production and
distribution. During the rise of modernism, sus-
tainability was dominated by the progressive
ideas and the creation of a new modern society.
With current concerns on environmental impact
and global warming, sustainability has begun to
emerge and dominate mainstream thought.
A fusion of the stylistic imagery of the 20th
century with industrial and technological imagery
of today has produced building which resemble
everything from ocean liners to space ships, with
P 13
oftentimes a superficial association with the earth.
These creations hinge on an association with the
consumption of fossil fuels and promote both a
technocentric and anthropocentric view of the
built environment.1 The architecture profession is
in the process of reevaluating its priorities, sus-
tainability has now become a mainstream focus.
With the influx of environmental awareness con-
verging with current architectural practice there
will perhaps be more change in the architectural
profession in the next few decades than in the
past 100 years.2 Architecture will no longer re-
spond to dogmas of style and theory, buildings
will be forced to respond to the demands of envi-
ronmental resources. It is in the balance of
merging sustainable design with historic and sty-
listic forms which will challenge architecture in the
coming years.
Sustainability is one word which has become
saturated with meanings. The accepted definition
of sustainability develops from the U.N. World
Commission on Environment and Development’s
1987 report Our Common Future, and is defined
as meeting the needs of the present without com-
promising the ability of future generations to meet
their own needs.3
The fear of mankind’s abuse of the planet are
not radically new ideas. Plato complained about
the loss of the forest around Athens to shipbuild-
ing and fuel, “what now remains, compared to
what was, is like the skeleton of a sick man, all
the fat and soft earth wasted away and only the
bare framework of the land is left.4” In the an-
cient world, nature was regarded with awe and
fear, and people were presumed to be helpless in
the face of its power. However, with the discover-
ies of the 16th to 18th century, the belief started to
develop that nature could be controlled and con-
quered.
In the early 19th century the subtle qualities of
the environment were not yet a widespread con-
cern. The resources present seemed immeasur-
able vast. The essence of nature itself was looked
upon as mother earth and that it would always be

P 14
a regenerative nurturing source.5 Ralph Waldo
Emerson, a dominant writer and poet concerned
with nature, captured the nature in the early
1830’s as "nature, in the common sense, refers
to essences unchanged by man; space, the air
the river, the leaf.6" There existed a majority
view which there would always be vast expanses
of untamed land. The literature of Rudyard
Kipling spoke of wild parts of the world which still
existed, and it seemed, always would.7 The
Western view started to develop which held na-
ture as a dangerous brutish force to be civilized
and subdued. In the United States this took form
in the taming of the frontier, the conquering of a
wild vast territory and became held as a cultural,
even spiritual imperative.8
The relationship of the reliance of humans on
nature started to be reevaluated and shift from
reliance to dominance. With the impact of indus-
trialization, the problems of resolving the rela-
tionship between nature and man starts to be
confronted across multiple professions. John
Figure 1.1 Energy Consumption and Production
P 15
Ruskin even admonished technocrats for their cal-
lous disregard for human identity in a machine
dominated world.9 As mentioned with Emerson in
literature as well as painters like Gustav Courbet,
who centered upon creating landscapes which
were being endangered by technological industry,
the repercussion of the separation of man from
nature start to become apparent. At the start of
the 19th century Thomas Malthus in his essay
Population in warned that humans would repro-
duce exponentially, with devastating conse-
quences of mankind.10 However, his pessimism
was overshadowed by the potential that this new
industrial technology would benefit mankind.
Around this time English romantic writers such as
William Wordsworth and William Blake described
the spiritual and imaginative depth that nature
could inspire, and they spoke out against an in-
creasing mechanistic urban society. They would
go on to inspire such American writers as Henry
David Thoreau, John Muir, Aldo Leopold, and
many others who voiced preservation of the wil-
derness.11 These writings helped to form such
conservative societies as the Sierra Club and the
Wilderness Society, which centered around pre-
serving the wilderness and keeping it away from
industrial growth. These writings inspired a new
generation of environmental awareness in the
United States.
While the Modernist movement would appear
to turn away from the environmental architecture,
it is important that it not be disregarded. The
movements in architecture of the Arts and Crafts
and Art Nouveau were the last major movements
before modernism to celebrate relationship be-
tween the building arts and natural forms.12 Be-
fore modernism iconographic and stylistic ele-
ments were fully representative of the Machine
Age, there was a transition and attempt made to
incorporation the past. Architects such as Josef
Hoffmann, Otto Wagner, Adolf Loos, Peter
Behrens, Auguste Perret and Louis Sullivan in the
early 1900’s still retained much of the stylistic ref-
erences of a metropolitan scale reminiscent of the
P 16
early 19th century. While this architecture was
distinctly modern in feeling, it was not overbear-
ing in its message. It was not until Le Corbusier,
Walter Gropius, and Mies van der Rohe, when
high modernism exerted it dominant influence,
that the parallels between industrial production
and expression became easily perceived.13 Frank
Lloyd Wright as far back as 1910 was advocating
an extension of buildings from their environment
long before the sustainable consciousness of to-
day. Wright pioneered organic architecture which
laid the foundation for much of the modern green
movement.13
By the 1920’s and 1930’s the impact of tech-
nology was already being questioned but it would
take a back seat to the progressive designs. This
minimalist design took hold with developers, who
were focused on building technologies which were
cheap, functional, and fast. In 1938 Louis Mum-
ford published Culture of Cities, which forcefully
asserted, “as the pavement spreads, nature is
pushed father away, the whole routine divorces
P 17
itself more completely from the soil, the slaughter
house and the cemetery are equally remote and
their processes are equally hidden.14” Mumford
also touches in the psychological effects of over-
whelming dreariness which was occurring in
suburbia,
“standardization material, patterns, plans,
and elevations are the ingredients of the ma-
chine age, by escaping it we get our superfi-
cially vivacious suburbs, by accepting it, those
vast acres of nondescript monotony… the chief
thing needful for the full enjoyment of this ar-
chitecture is a standardized people.”15
The first national wave of green consciousness
was centered in the youth movement of the
1960’s. In 1962 Rachel Carson’s book Silent
Spring launched a popular concern with ecology.
Even with this popularity the causes of the 1960’s,
however environmentally conscious, became asso-
ciated with political radicalism. The proponents of
this environmental conservation were deemed by
the press as “naked eco freaks” living in isolated
eco friendly communes.16 These early views were
deemed by mainstream America as threatening to
their traditional way of life. The advocates of this
view, according the James Wines, departed from
the first principle of ecology, that nature is all one
intergraded system. These groups enjoyed a lot
of attention but they ultimately failed in gaining
the proper influence of government and the pub-
lic.
However, during the 1970’s the basic founda-
tion for the association of growth with negative
consequences would again emerge as a major
theme of environmentalism. In 1973 Fritz
Schumacher’s Small Is Beautiful: Economics as If
People Mattered approached the issue of growth
from a philosophical vantage point, pointing out
that people should take a serious look at what
they consider wealth and progress.17 While the
environmentalist were issuing warnings, the con-
sumers was now starting to be approached. In
Cradle to Cradle William McDonough terms the
products of an industrial system designed in a lin-
P 18
ear one way process, cradle to grave. One ex-
ample of this was the push to achieve universal
design solutions, which had emerged as the lead-
ing design strategy in the last century.18 The book
proposes that the solution to wastefulness prac-
tices is not the refinement of the technology but a
complete rethinking of the entire process. While
Cradle to Cradle was primarily focused on indus-
tries, the consumer has now been targeted to
bring about this change. Robert Lilienfeld and
William Rathje’s 1998 Use Less Stuff: Environ-
mental Solutions for Who We really Are centered
around consumers taking the lead in reducing
negative environmental impact. The authors
state, “the simply truth is that all of our environ-
mental concerns are either caused by, or contrib-
ute to, the ever-increasing consumptions of
goods and services.19” In the late 1980’s major
governments began to pass environmental legis-
lation. The 1992 Rio Earth Summit termed the
phrase, “eco-efficiency” but it only meant doing
more with less. However, this would lead to the
P 19
Kyoto Protocol in December of 1997 in which 174
countries would meet and make a global effort to
decrease carbon dioxide emissions.
With such a massive influx of sustainable phi-
losophy the reevaluation and establishment of
architectural principles can offer a great opportu-
nity for creative holistic design responses. The
early industrial and economic issues which have
faced architecture in the first part of this century
were rooted in cultural and economic changes.
With these issues, rarely did the architects of
early modernism deal with issues of environ-
mental impact or the psychological effects of their
work on city dwellers or the effects of the discon-
nection with architecture and its surroundings.
The modernist were concerned with a formalist
and functional invention of the implication of new
technology.20 This rift has created many of the
environmental problems which exist today. With
a set of design features divorced from environ-
mental issues, universal designs rarely allowed for
a connection with a sense of place.
Even the most advanced advocates of ecologi-
cal design are struggling with way to incorporate
environmental technology, resource conservation,
and aesthetic content. A major factor in the lon-
gevity of buildings is the fusion between nature
and art. Buildings must be both environmentally
updatable as well as aesthetically worth of preser-
vation. Much of the debate about sustainability
has to do with state of performance as a desirable
feature, followed by speculative methods, materi-
als, and building construction, which have no re-
cord of extending durability.21 Sustainability can
not be approached from the perspective of lon-
gevity alone, nor can it be reduced to environ-
mental impact reduction strategies. There is an
inherent physiological connection between hu-
mans and the natural environment which can me-
diate a connection between experience and place.
This connection can not be produced by superfi-
cially aligning sustainability to environmentalism.
There are examples of contemporary green build-
ings, crammed with cutting edge technology,

P 20
which have neither withstood the test of time or
contain much aesthetic value, it may be green,
but it is boring.22
End Notes 1 Wines, James. Green Architecture. Los Angela’s: Taschen, 2000. 2 IBID, 23. 3 UN World Commission on Environment and Development. Our Common Future 1987. Oxford: Oxford University Press. 4 Wines, James. Green Architecture. Los Angela’s: Taschen, 2000. 5 McDonough, William. Cradle to Cradle Remaking the Way We Make Things. New York: North Point Press, 2002. 6 Emerson, Ralf Waldo. Nature. 1836, Page 142. 7 McDonough, William. Cradle to Cradle Remaking the Way We Make Things. New York: North Point Press, 2002. 8 IBID, 25. 9 Wines, James. Green Architecture. Los Angela’s: Taschen, 2000. 10 Malthus, Thomas Robert. First Essay on Population 1798. London: Macmillan, 1926. 11 McDonough, William. Cradle to Cradle Remaking the Way We Make Things. New York: North Point Press, 2002. 12 IBID, 24. 13 IBID, 25. 14 Wines, James. Green Architecture. Los Angela’s: Taschen, 2000. 15 IBID, 24. 16 IBID, 24. 17 Schumacher, E. F. Small Is Beautiful: Economics As If People Mattered. New York: Hartley & Marks Publishers, 1999. 18 McDonough, William. Cradle to Cradle Remaking the Way We Make Things. New York: North Point Press, 2002. 19 IBID, 46. 20 Wines, James. Green Architecture. Los Angela’s: Taschen, 2000. 21 IBID, 23. 22 IBID, 24.

P 21
[His
tori
c S
ust
ain
ab
ilit
y]

P 22
Energy Conservation in Historic Buildings
When the rehabilitation of old buildings is sub-
jected to scientific analysis, it is proven that it
saves more energy to reuse and preserve build-
ings than it does new construction. The need for
an energy study of historic structures grew out of
section 106 of the National Historic Preservation
Act of 1966. This section of law requires federal
agencies that undertake work which affects prop-
erties on the National Register for Historic Places
to seek council. Frequently these cases center
around the proposal to remove older buildings
and construct new ones. It was also looked on as
a way to meet the Public Building Cooperative
Use Act of 1976.1 The focus was on acquiring
data to compare between the energy use of pres-
ervation and new construction.
Change is the benchmark of our fast pasted
society but the values of historic preservation are
now gradually becoming the norm. However,
these values have recently been overshadowed
by another movement, the ecologically based
P 23
green movement. “The preservation business has
always been about sustainability and steward-
ship,” says Mike Johnson, a chief architect with
the Illinois Historic Preservation Agency, ”but it’s a
message that is not getting out.”2 Preservationist
and environmentalist have long shared a root set
of values. There exist a main drive toward stew-
ardship and conservation of resources, whether
cultural or environmental and both groups prefer
minimal intervention as to major overhauls. How-
ever, it would seem that very little has been done
when it comes to the combining the green move-
ment with historic preservation.
The early rush toward ecofriendliness was
dubbed “conspicuous conservation” more than a
decade ago by Wired magazine3. Green, is seems,
is the new Gehry. The green movement has be-
come more than a style, it is now an imperative.
Henry Moss, an architect with Bruner/Cott in Mas-
sachusetts, recently suggested in a talk with the
Boston Preservation Alliance that “sustainability
has taken the moral high ground from preserva-
tion.”4 Old is nice, but green is now essential.
Going green is something that society is being
pushed to do now, but these pressures should not
take precedence over preservation guidelines.
There exists a comparison between the recent
green movement and the half-century old rise of
modernism. The planners and architects of the
time went beyond simply wanting universal design
solutions; they also wished to change society.
The old ways of thinking became outmoded. The
overall consensus was that yesterdays buildings
solved yesterday’s problems and new buildings
were needed to solve the problems of today.
However, last time the nation undertook a nation-
wide overhaul of the built landscape the historic
fabric became the scapegoat. The resulting urban
renewal left many of the best urban areas of cities
in tatters and many of the historical buildings in
piles of rubble.
There is an evident division between green
buildings and older buildings. New green build-
ings, brimming with the latest in modern technol-
P 24
ogy, are perceived to be on the side of change;
while older buildings, full of quaint inefficient
technologies and drafty windows, exist as rem-
nants of the past. However, the now soaring
price of energy has brought about a new exami-
nation of exactly how energy efficient these older
buildings are. The reputation of older structures
as energy sieves, in short, is simply not justified
by the data. According to the U.S. Energy Infor-
mation Administration, commercial buildings con-
structed prior to 1920 have an average energy
consumption of 80,127 BTU per square foot. For
the more efficient buildings built since 2000, the
number is 79,703 BTUs. Buildings built between
1950-2000 are less enviable, reaching around
100000 BTSs which reflected the cheap oil and
electricity available during that time.5
Older structures are often overlooked as ex-
amples of sustainable architecture. “The original
buildings had no choice but to be green,” said
Florida architect Steve Mouzon, “otherwise you
would die of a heat stroke in the summer, or

P 25
freeze to death in the winter.”5 Houses in the
South had high ceilings and louvered shutters; in
the North, they featured thick walls and smaller
windows. Sleeping porches provided coolness in
summer, and woodstove-centered kitchens gave
off warmth in the winter. Today new construction
seems largely interchangeable. Shutters, for ex-
ample, have become vestigial totems for the past
screwed into sides of new houses that do nothing
against the wind or the sun. “People often tend to
think that historic buildings are inherently energy
inefficient,” writes Walter Sedovic, a preservation
architect in Irvington, N.Y.
“The opposite, though, is more likely to be
true: that many historic buildings are inher-
ently very energy efficient. Before sustain-
ability had name, traditional builders incor-
porated sustainable elements into buildings.
Working in sync with the environment was
the norm, including siting, local materials,
natural ventilation, shading, reflective roof-
ing, cisterns, indigenous planting- the list
become long, and in many ways mirrors
‘new’ standards espoused today.”6
Architect Carl Elefante writes, “the greenest
building is one that is already built.” Illinois archi-
tect Jackson adds, “the ‘green design’ movement
has largely ignored the inherent ecological advan-
tages of building reuse, including the primary one-
embodied energy.”7 When people talk about
energy use and buildings, they invariable mean
operating energy, or how much energy a building
will use for the present forward for primary func-
tions such as heating, cooling, and illumination.
Embodied Energy refers to the quantity of energy
required to manufacture, and supply to the point
of use, a product, material or service. Traditionally
considered, embodied energy is an accounting
methodology which aims to find the sum total of
the energy necessary - from the raw material ex-
traction, to transport, manufacturing, assembly,
installation as well as the capital and other costs
of a specific material - to produce a service or
product and finally its disassembly, deconstruction

P 26
and/or decomposition. The concept has been
around since 1976, when energy pioneer Bruce
Hannon and Richard Stein calculated how many
BTUs were required to produce various building
materials. They determined that the typical
buildings of the mid-20th century required the
equivalent of 15 gallons of gasoline a square foot.
Embodied energy also pertains to demolition. For
example, the Wainwright Building in St. Louis
would require 6,454,200 gallons of gasoline to
demolish and Union Station in Washington D.C.
would require 7,432,300 gallons.8
Using the concept of embodied energy can
greatly influence the argument for historic preser-
vation. According to Jackson, if embodied energy
is used in calculating energy efficiency, even a
new, energy efficient office building doesn’t actu-
ally start saving energy for about 40 years. How-
ever, if it replaced an existing structure, which
was removed, the period of energy savings does-
n’t start for 65 years, being that demolition con-
sumes a significant amount of energy. Jackson
P 27
goes on to say, “We’re not going to build anything
today that is going to last 65 years.” These figures
are not as staggering for residential construction;
it takes about 13 years to recoup the lost energy
if replaced by a similar sized home. However, the
average new house size has increased 105% from
1950 to 1999 and this pushes the time needed to
recoup the energy loss to around 28 years. Some
other building type examples containing embodied
energy are Offices which have 1,640 MBtu/sq ft;
Hotels which contain 1,130 MBtu/sq ft; Educa-
tional 1,380 MBtu/sq ft; and Hospital which have
1,720 MBtu/sq ft.9
It can also be beneficial to apply the embodied
energy concept to materials as well. Some com-
monly used materials contain large amounts of
embodied energy. Wood products contain an av-
erage 9,000 Btu/board foot. Glass products also
contain amounts of embodied energy. A sheet
glass window contains 15,000 Btu/square foot and
a plate-glass window contains 40,000 Btu/square
foot. Stone and clay products contain some of the
highest embodied energy with concrete containing
96,000 Btu/cubic foot and brick masonry up to
400,000 Btu/Cubic foot. It is also important to
note that painting products contain a very high
embodied energy, averaging around 482,000 btu/
gallon.10
The green movement often focuses on energy
consumption and savings but oftentimes there are
hidden energy cost which are less apparent. The
Chesapeake Bay Foundation’s newly constructed
Phillip Merrill Environmental Center opened in late
2000. The foundation notes that this “may be the
worlds greenest building” and it was the first to
earn a LEED platinum rating. However, Environ-
mental Building News recently noted that the
building was constructed 10 miles from the origi-
nal headquarters in downtown Annapolis, Md.
Which resulted in many of the 100 employees
which walked to work now need to drive. It is
uncertain whether the energy savings of the new
building can offset the increased consumption for
the commute but an analysis by Environmental
P 28
Building News has conclude that energy used by
workers getting to and from work is about 30%
more than the building consumes.11
It is important to understand holistically the
impacts of conserving cultural resources and the
understanding of implementing preservation
methods which impact historic properties. This
brings up one of the most important traits for
preservation and one which has received little
attention with sustainability, is the trait of lovabil-
ity. “The very first core of sustainability is: Can a
building be loved? It doesn’t matter how much
energy you save if you’re carting if off to a landfill
after one generation.”12 Take for example the
advent of solar power panels during the energy
crunch of the 1970’s. Technical shortcomings
aside, these sustainable measures didn’t last be-
cause they were viewed as eyesores. “We lost a
generation of sustainability because it couldn’t be
loved,” Mouzon said. The authors of the Whole
Building Design Group see sustainability begin-
ning with preservation. This motto is gaining
P 29
ground in the National Trust. The President of
the National Trust, Richard Moe, noted that the
preservation movement has periodically rein-
vented itself: It started with a focus on iconic
landmarks, then took up the benefits of adaptive
use before going on to emphasize the social val-
ues of preservation in building stronger communi-
ties. Now we’re on the threshold of a new phase,
as growing numbers of people are concerned
about the environmental degradation of and the
relentless consumption of irreplaceable energy
and natural resources. Preservation certainly isn’t
the solution to these problems, but it can-and
should be- an important part of the solution.13
P 30
End Notes 1 New Energy for Old Buildings, National Trust Historic Preservation, page 102. 2 Preservation Magazine Feb 2008. 3 Wired is a monthly American magazine and on-line periodical published in San Francisco, California since March 1993, it reports on how technology affects culture, the economy, and politics. 4 Preservation Magazine Feb 2008. 5 Founder of the New Urban Guild and presented at Fall of 2009 Traditional Building Conference. Preservation Feb 2008 6 Interview by Wayne Curtis Preservation Magazine Feb 2008 7 Forum Journal Published by the National Trust. Summer 2008 8 Preservation Trust Magazine, Jan 2008, Pg 23. 9 IBID, Pg 24. 10 Energy Use for Building Construction, by Energy Research Group, Center for Advanced Computation, University of Illinois, and Richard G Stein and Associates. 11 Source: Energy Use for Building Construction. 12 Preservation Magazine Jan 2008. 13 Trust Annual Meeting in St. Paul Fall 2008.
P 31
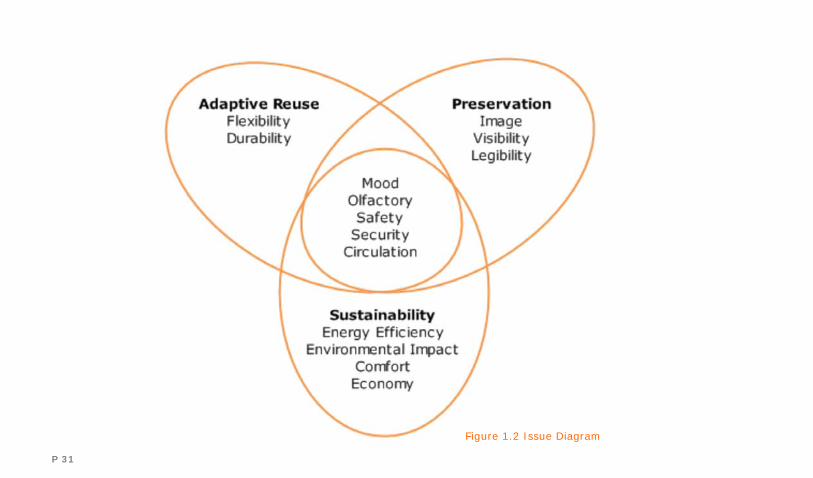
Figure 1.2 Issue Diagram

P 32
Adaptive Reuse
FLEXIBILITY
The facility by default will provide space for use
other than the original intention. These spaces
must be flexible in providing for a multitude of
events and uses within the structure as well as
incorporating a division between certain activities.
These spaces should offer visitors a variety of ex-
periences to explore and experience.
DURIBILITY
The durability of existing materials must be re-
spected. The patina as well as deterioration of
such industrial materials will offer a great design
opportunity. New materials should be chosen for
their complementing of the existing material.
Preservation
IMAGE
The Char House must be respectfully preserved in
appearance. The main date of focus will be on the
Char House as it appeared in 1950’s.
VISIBILITY
The Char House was the largest building con-
structed in Fort Bend Country for 55 years. It
must maintain its highly visible location.
LEGIBILITY
The industrial layering of the site should be under-
stood and utilized. The Imperial Sugar Factory
layout should be respected and added to with re-
spect to the historic layout. Major building orien-
tations and industrial processes should be utilized
within the plan.
P 33
Sustainability
COMFORT Comfort must be integrated into the Char House by sus-
tainable design. The largest challenge of the project will
consist of providing a comfortable interior in the Texas
gulf coast environment. ECONOMY Economy of the reuse of the facility should be investi-
gated and all portions of the building which are fit for
reuse should be incorporated. ENERGY EFFECIENCY The energy efficiency of the building should be consid-
ered during the design phase and incorporate sustain-
able design strategies and not rely upon forcefully condi-
tioned areas. The project will incorporate the LEED-EB
v2.2 rating system. ENVIROMENTAL IMPACT A study of the life cycle impact of the project should be
considered in the design phase.
Adaptive Reuse+Preservation+Sustainability
MOOD AMBIENCE The Char House must create an atmosphere which high-
lights the historic presence of the factory as well as
speaks to the sustainable strategies which will be imple-
mented. The atmosphere must facilitate interaction
between the older residence of the community and the
new younger residence. OLFACTORY The ability of the Char House to engage the senses is
essential to the completions of a successful process. CIRCULATION The ability of the Char House to offer circulation within
the building will be important to the final design. The
circulations must be respectful of the historic character
but also allow for quick and easy movement within the
building. SAFETY Safety issues will be addressed with the adaptation of
the building. Structural will be undertaken as well as
checking the equipment which will be left in the Char
House. SECURITY Security must allow for a division between large spaces
and smaller service spaces. There must be the ability to

P 34
Figure 1.3 Issues in the Duerk Model, See Appendix C

P 35
Issue: FLEXIBILITY ability to change over time.
Potential Design Response Adaptability- Incorporations of outdoor gallery and indoor areas through large operating windows can allow dual uses. Potential Design Response Choice/Variety- Allow for varying locations of service spaces allowing for visitors to take multiple paths through the build-ing instead having to return to same location. Potential Design Response Expansion/Contraction- Allow for multi floor use, giving the option for users to experience multiple floor for larger gather-ings or for spaces to be secured within certain floors for fewer people. Potential Design Response Multi-Use-Incorporate public spaces on ground floor to in-clude facilities which may service by different user groups throughout the day.

P 36
Issue: DURABILITY ability to endure the designed use over time.
Potential Design Response Material- Material must be chosen to respond both to the contemporary new use as well as fit in with the historic char-acteristic of the Char House
P 37
Issue: IMAGE how the place looks and is interpreted by the observer, visual impression.
Potential Design Response Identity- The Char House is the most Iconic Building in Sugar Land Texas and any additions must be sensitive to this image. Potential Design Response Order/Proportion- The structural system of the Char House must be utilized on any new construction. The window treatments can be updated but should be built to reflect the current window condition. Potential Design Response Message- The historic character of the Char House can be preserved with the use of historic signage and fonts which can be incorporated into new designs. Potential Design Response Hierarchy- The hierarchy of the Char House on the site must be preserved. New additions should respect the building mass and orientation.
P 38
Issue: VISIBILITY ability to see, includes light levels and site lines.
Potential Design Response Symbolism- The Char House must maintain the historic signage, especially the neon Imperial Sugar writing and logo found on the top floor. Potential Design Response Status- The Char House must be highly visible from the highway as well as the views into the site respected.

P 39
Issue: LEGIBILITY quality of the environment as readable.
Potential Design Response Layering- The historic layering of the site must be capi-talized. Any new additions should try to keep as much historic fabric as possible. Potential Design Response Orientation- The orientation of the site must allow for a new establishment of hierarchy to exist. The Char House currently sits in a factory setting and new addi-tions, such as the main public entrance, can establish a sense of place. Design Response Plan Recognition- Additions to the site plan must allow of a more prominent entrance to the Char House. A path from the parking lot can highlight the entrance as well as signage or respectful historic additions to the base of the building. Design Response Sequence- A sequence of experiences must lead up to the entrance of the Char House. A hierarchy of pedes-trian as well as vehicle traffic should allow for access to the Char House.
P 40
Issue: COMFORT providing ease and enjoyment.
Potential Design Response Physical- A comfortable level of conditions space should be provided year round. The use of sustainable strate-gies to achieve this, such as passive solar heating, should be emphasized. Potential Design Response Psychological- A connection should be made between the outdoors and indoor spaces as well as historical content, either by views or with the preservation of the structure.
P 41
Issue: ECONOMY maximum benefit for minimum means.
Potential Design Response Phasing- The char house can be the first phase of a re-development of the Imperial Sugar Factory site. Potential Design Response Quality- The economic and sustainable importance or reusing as much existing structure should be priori-tized. The current machinery can be left in place to augment the spaces.

P 42
amount and/or percentage of energy available that is used.
Potential Design Response Efficiency- The use of the LEED-EB v2.0 will serve as the primary guide for measuring the project sustainable designs. Potential Design Response Environmental Impact- The carbon footprint of the project should be reduced as much as possible. This could be either in construction phase or installing equipment which can monitor energy use.
Issue: ENERGY / ENVIROMENTAL IMPACT
P 43
Issue: MOOD AMBIENCE the emotional sensation in response to a place.
Potential Design Response Attitude- The facility should reflect the attitudes of preservation and sustainable design by showcasing and highlighting certain aspects of the design. This can be done by identification plates or by exposing certain ma-terials or utilities. Potential Design Response Emotional Response- The emotional response should evoke a sense of historical place as well as the enjoy-ment of the new use. The inclusion of preservation methods with sustainable strategies will offer an unique experience to the user. Potential Design Response Spirit of the Place- This historic characteristic mixed with the contemporary use will offer an experience in which a mixing of the past and present combine.
P 44
the sense of smell and the smells of the environment.
Potential Design Response Materials- Materials can be chosen which are rich in texture and color. The historic emphasis can be juxta-posed against contemporary materials to offer a unique combination. Potential Design Response Senses- An effort must be made to preserve not just visual material but also material which appeals to the other senses. The naturally sweet smell of the facility should be preserved as much as possible and harsh cleaners should not be used.
Issue: OLFACTORY

P 45
Issue: CIRCULATION the movement or flow of people, objects, information or substances.
Potential Design Response Informational- It is important the clearly visible signage existing on the premises which can both inform about the history as well as navigational aids for the users. Potential Design Response Material- Materials which respects both historical prece-dents of the areas as well can accommodate circula-tion, such as ADA requirements, should be used. Design Response Parking- The existing parking should be utilized as much as possible, however, street parking can also be used as a design feature around the Char House. Design Response Pedestrians- Pedestrian paths must be landscaped pleasantly and provide for covered walking for circula-tion within the site.

P 46
Issue: SAFETY and SECURITY protection from harm or danger, protection from un wanted aggressions by another person.
Potential Design Response Safety- The structural safety of the building should be examined and any changes should be historically accu-rate. Potential Design Response Security- Public spaces should be highly visible and contain adequate lighting at night. Areas which are not visible should be secured during events or off-time ac-tivities.
P 47
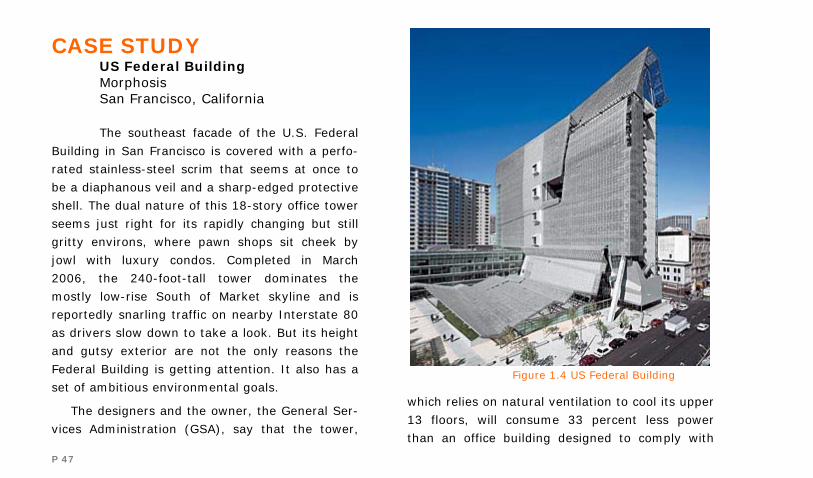
CASE STUDY US Federal Building Morphosis San Francisco, California
The southeast facade of the U.S. Federal
Building in San Francisco is covered with a perfo-
rated stainless-steel scrim that seems at once to
be a diaphanous veil and a sharp-edged protective
shell. The dual nature of this 18-story office tower
seems just right for its rapidly changing but still
gritty environs, where pawn shops sit cheek by
jowl with luxury condos. Completed in March
2006, the 240-foot-tall tower dominates the
mostly low-rise South of Market skyline and is
reportedly snarling traffic on nearby Interstate 80
as drivers slow down to take a look. But its height
and gutsy exterior are not the only reasons the
Federal Building is getting attention. It also has a
set of ambitious environmental goals.
The designers and the owner, the General Ser-
vices Administration (GSA), say that the tower,
which relies on natural ventilation to cool its upper
13 floors, will consume 33 percent less power
than an office building designed to comply with
Figure 1.4 US Federal Building
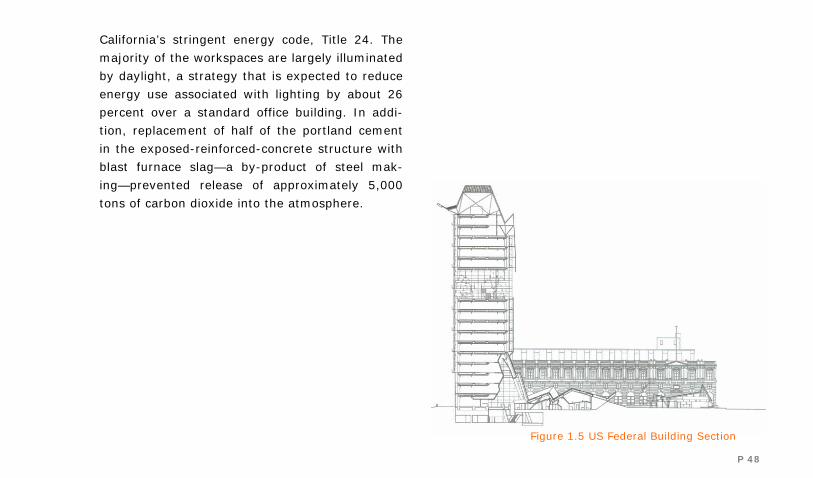
P 48
California’s stringent energy code, Title 24. The
majority of the workspaces are largely illuminated
by daylight, a strategy that is expected to reduce
energy use associated with lighting by about 26
percent over a standard office building. In addi-
tion, replacement of half of the portland cement
in the exposed-reinforced-concrete structure with
blast furnace slag—a by-product of steel mak-
ing—prevented release of approximately 5,000
tons of carbon dioxide into the atmosphere.
Figure 1.5 US Federal Building Section
P 49
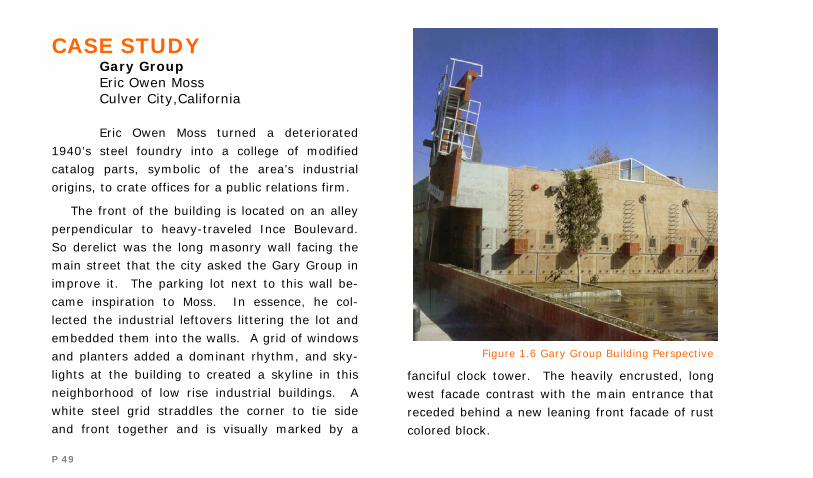
CASE STUDY Gary Group Eric Owen Moss Culver City,California
Eric Owen Moss turned a deteriorated
1940’s steel foundry into a college of modified
catalog parts, symbolic of the area’s industrial
origins, to crate offices for a public relations firm.
The front of the building is located on an alley
perpendicular to heavy-traveled Ince Boulevard.
So derelict was the long masonry wall facing the
main street that the city asked the Gary Group in
improve it. The parking lot next to this wall be-
came inspiration to Moss. In essence, he col-
lected the industrial leftovers littering the lot and
embedded them into the walls. A grid of windows
and planters added a dominant rhythm, and sky-
lights at the building to created a skyline in this
neighborhood of low rise industrial buildings. A
white steel grid straddles the corner to tie side
and front together and is visually marked by a
fanciful clock tower. The heavily encrusted, long
west facade contrast with the main entrance that
receded behind a new leaning front facade of rust
colored block.
Figure 1.6 Gary Group Building Perspective
P 50
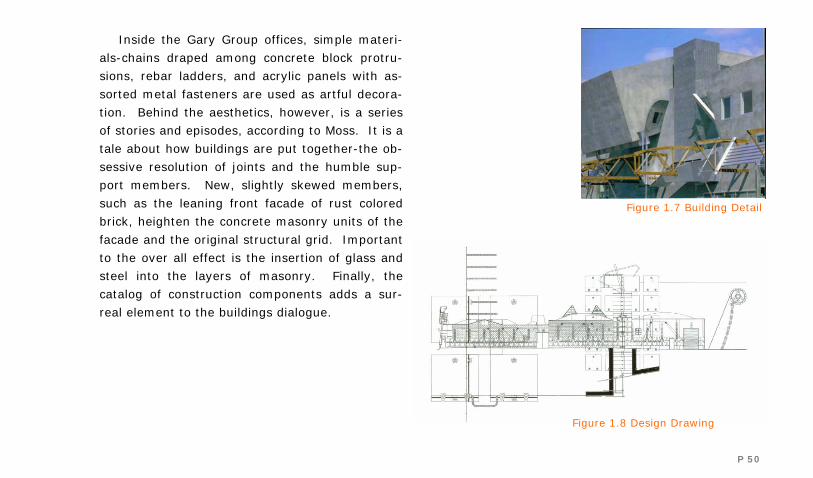
Inside the Gary Group offices, simple materi-
als-chains draped among concrete block protru-
sions, rebar ladders, and acrylic panels with as-
sorted metal fasteners are used as artful decora-
tion. Behind the aesthetics, however, is a series
of stories and episodes, according to Moss. It is a
tale about how buildings are put together-the ob-
sessive resolution of joints and the humble sup-
port members. New, slightly skewed members,
such as the leaning front facade of rust colored
brick, heighten the concrete masonry units of the
facade and the original structural grid. Important
to the over all effect is the insertion of glass and
steel into the layers of masonry. Finally, the
catalog of construction components adds a sur-
real element to the buildings dialogue.
Figure 1.7 Building Detail
Figure 1.8 Design Drawing

P 51
List of Figures [1.x]
Figure 1.1 Energy Consumption (Jo Allen, 24) Figure 1.2 Issue Diagram (Author) Figure 1.3 Issues in Duerk Model (Appendix C) Figure 1.4 US Federal Building (Sherban, 245) Figure 1.5 US Federal Building Section (Sherban, 246) Figure 1.6 Gary Group Building Perspective (Spencer, 23) Figure 1.7 Gary Group Building Detail (Spencer, 23) Figure 1.8 Gary Group Design Drawing (Spencer, 24)

P 52
Works Cited [THEORY] Byard, Paul Spencer. The Architecture of Additions: Design and Regulations. New York: Norton & Company, 1998.
Cantacuzino, Sherban. Re/Architecture: Old Buildings/New Uses. New York: Abbeville Press, 1989.
Gause, Jo Allen. New Uses For Obsolete Buildings. Washington DC: Urban Land Institute, 1996.
Greer, Nora Richter. Architecture Transformed: New Life for Old Buildings. Massachusetts: Rockport Publishers, 1998.
McDonough, William. Cradle to Cradle Remaking the Way We Make Things. New York: North Point Press, 2002.
Rober, Philippie. Adaptation: New Uses for Older Buildings. New York: Princeton Architectural Press, 1991.
Stipes, Robert E. A Richer Heritage: Historic Preservation in the Twenty-First Century. North Carolina: NC Press, 2003.
Wines, James. Green Architecture. Los Angela’s: Taschen, 2000.

P 53
Faci
lity
P 54
S u g a r I n t r o d u c t i o n
The word “sugar” in its Anglicized form, comes
from the Sanskirt word sarkara which, in turn, is
derived from the roots sre- meaning to tear and
kara-which means forming. A literal equivalent
would be that which is in pieces, little rocks, or
gravel. This is based upon the granulated form
which sugar takes on crystallization. The implica-
tions of these roots of the word sugar is in con-
trast to the Sanskrit world khanda and the prakrit
words gudasarkara and motoyandika, which refer
to the solidified or dried sugar mass whether used
as a confection or not. Much of the sugar con-
sumed in early days was dispensed directly as
cane juice or as various concoctions of this juice.
The Arabian word for beverage, sherab, is clearly
a root of our present word for syrup.1
Sugar started to be cultivated in northern In-
dia. The Chinese first mention the trading of
sugar cane in 200 BC and several of Alexander
the Great’s officers reference it in 327 BC. How-
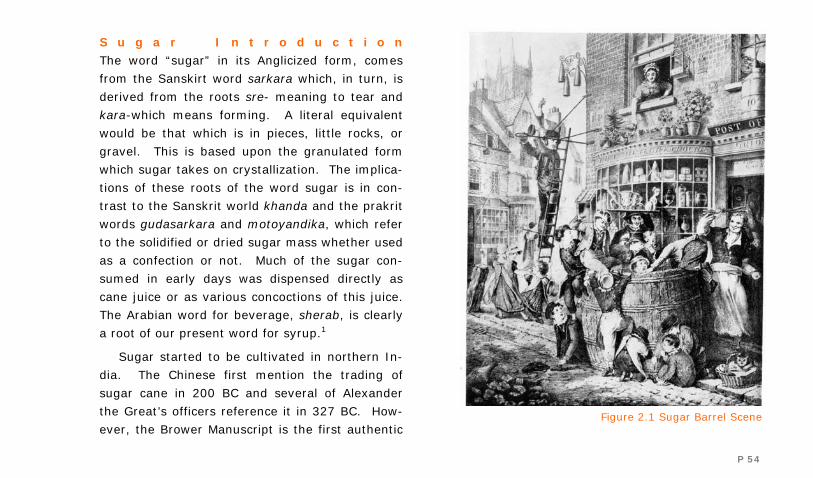
ever, the Brower Manuscript is the first authentic Figure 2.1 Sugar Barrel Scene

P 55
reference to sugar. This birch-bark scroll, dates
to around 375 AD, but it would be for another
1000 years before the production left India.
Eventually the art of evaporating sugar cane juice
spread form India to Persia. From there it spread
eastward to China, next to the East Indies and
westward through trade to Egypt. The Chinese
sugar industry was thriving by the time of Marco
Polo’s visit in 1270-1275. Less is known about
sugars introduction to the East Indies, but sugar
cane was being grown in Java by the eighth cen-
tury. The refining of sugar by boiling, draining,
and recrystalizing can be traced back to early In-
dia but would not become prevalent until trade
opened with Europe.
This early product consisted of the production
of a relatively low grade sugar, which was unsepa-
rated or imperfectly separated. However, as the
refining process evolved, eventually a more con-
sistent product emerged. The forms in which
sugar was traded and sold evolved quite naturally
from the first attempts to mold the sticky mass in
readily available containers. The Indians and Per-
sians poured the thick syrup into pieces of hol-
lowed out bamboo. When the syrup adhering to
the sugar crystals was drained away, a stick like
mass would result. This was called a khanda
which is the predecessor of modern word candy.
The Egyptians learned that glass could used as a
mold and then broken away to produce solid
candy. The Chinese were the first to use porous
clay molds, which produced a purer and whiter
product because of the absorptive properties of
the clay. These types of mold remained in use for
centuries and are still in used today in certain
parts of China.2
The art of refining sugar was first documented
in 1464, when Duhamel de Monceau gave the first
detailed description of the process. The raw sugar
or Muscovado described by Monceau was put in a
storage room especially constructed to allow for
the molasses to drain off3. This molasses was
sold to distillers, particularly the Dutch, to pro-
duce rum. These different qualities were then
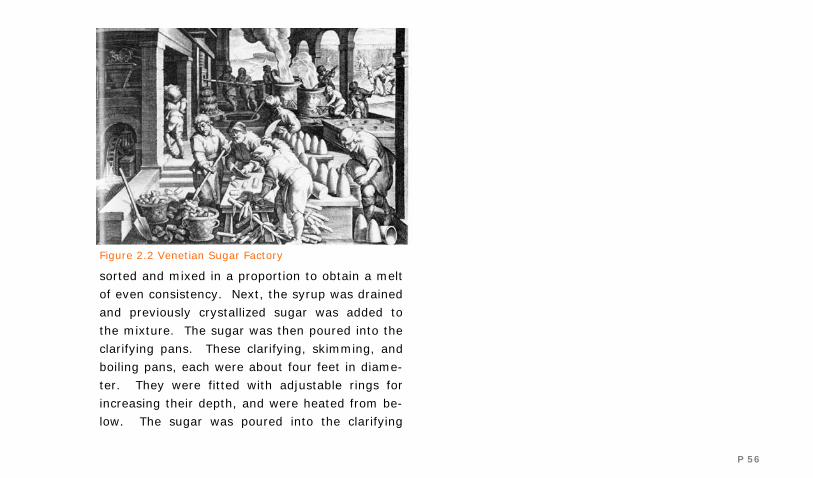
P 56
sorted and mixed in a proportion to obtain a melt
of even consistency. Next, the syrup was drained
and previously crystallized sugar was added to
the mixture. The sugar was then poured into the
clarifying pans. These clarifying, skimming, and
boiling pans, each were about four feet in diame-
ter. They were fitted with adjustable rings for
increasing their depth, and were heated from be-
low. The sugar was poured into the clarifying
Figure 2.2 Venetian Sugar Factory

P 57
pans with two-thirds of lime to every third of
sugar. For a pan of between four of five tons of
sugar, seventy to ninety eggs or two gallons of
bullocks’ blood were required for the clarification
process.
When the mixture was heated, the impurities
would rise to the top and were skimmed off. After
being repeatedly heated and skimmed, the liquid
would become bright and clear. This was boiled
for about three quarters of an hour until the sugar
master, who at this time had tested the sugar by
drawing out a thread between the finger and the
thumb. This process is called preauve de doigt,
which literally is translated from French means the
proof of the finger. Using this test and personal
knowledge the sugar master would be able to
bring the liquid to the exact degree required for
successful crystallization and the mixture was
transported to a cooling vessel.5
After cooling, it would be stirred and poured
into clay molds in the traditional cone shapes. It
would then be left to sit and after six days all the
liquid would have drained out. The cones, varying
in height from eleven to twenty-two inches and in
diameter from five to ten inches, were then exam-
ined. In this examination the sugar was then
“clayed” in which the surface of the cones was
scraped away and a fine sifted sugar put in its
place. A thin covering of damp clay was then laid
on top of these cones. The liquid from the clay
would run through the cones, removing any re-
maining impurities, and after another eight to ten
Figure 2.3 Primitive Sugar Mill

P 58
days the sugar was knocked out of the moulds
and left to dry. The sugar was then stored in a
moderate but increasing heat for a further week,
at the end of which the time those that were con-
sidered perfect were re-cooled and wrapped in
blue paper to disguise the yellow appearance of
the sugar. Any stage of the early sugar refining
process was liable to be repeated several times
until the desired result was obtained. Cones
found to be imperfect were remelted and re-
manufactured. This process was the typical proc-
ess used in most refineries until well into the
nineteenth century.6
Originally sugar was refined by the early grow-
ers and manufacturers of the raw product. In the
early history of sugar refining the owner and
grower of the sugar would refine it and sell it.
However, as the technique was improved and
manufacturing increased, there arose a need for
central locations where the sugar could be refined
and marketed. Sugar cane grows only about five
months out of the year and it was uneconomical Figure 2.4 Mill Showing Boiling Pans

P 59
and expensive to operate a sugar refinery, which
would be unused for nine month out of the year.
As trade increased, these central locations became
increasingly independent of areas where the raw
sugar cane was grown.
The split between the process of growing and
refining of sugar began when Venice became the
center for the art of refining. It is contested as to
whether the Venetians actually invented the refin-
ing process; however, they were the first to bring
raw sugar to refineries located in centralized con-
venient places. By the middle of the 15th century,
the sugar refining industry was in full swing.
There were other Italian refineries but Venice
would hold the lead until the mid 17th century.
However, the Dutch started to open sugar refiner-
ies in Antwerp in the mid 16th century and im-
ported raw sugar from Brazil, the Canaries, Ma-
deira, Barbary, and Spain. They started to export
the refined sugar to Germany and the Baltic re-
gion, as well as to England. The prosperity of
Antwerp rose quickly and peaked in the middle of
the century, but declined tremendously during the
Wars of Liberations. Venice lost its lead for two
reasons; the Turkish conquest endangered her
markets in the Mediterranean, and the develop-
ment of sugar refineries in the West Indies, which
exported directly to European countries, made the
city no longer the most convenient geographic
center for refining.7
In 1602 the Dutch East India company was
formed to carry raw sugars, principally from Java,
to the refineries in Amsterdam and Antwerp. The
Dutch trade thrived and Amsterdam took the
place of Antwerp as the main sugar refining center
and exported its refined sugar to most European
countries. It is around this time that the rise of
high tariffs in countries start to effect the export-
ing and importing of sugar, a trend which would
affect the sugar industry up to today. These tar-
iffs would make sugar production become more
country specific and shift the distribution yet
again.
Refineries had been established by this time in
P 60
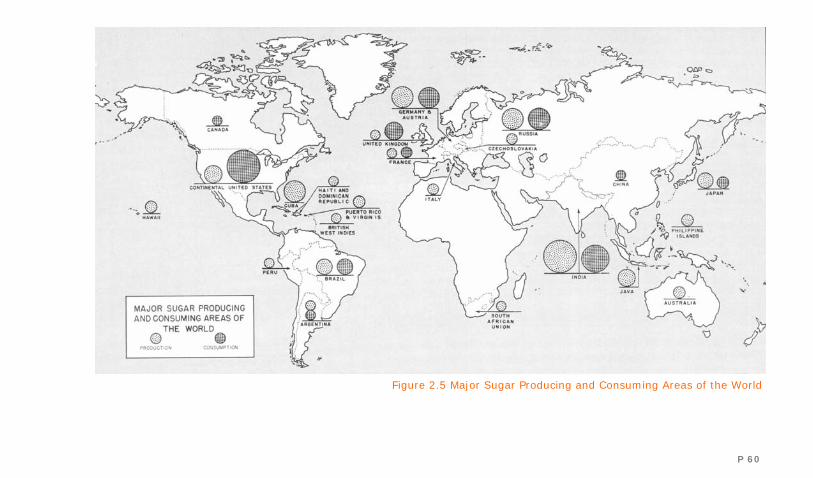
Figure 2.5 Major Sugar Producing and Consuming Areas of the World
P 61
Germany, a refinery in Hamburg was sending
sugar to England as early as 1600. The Germans
proceeded steadily until the refineries in Hamburg
eventually replaced those in Amsterdam. The
American War of Independence also brought great
prosperity to Hamburg. In France the industry
grew steadily until at the end of the 17th century
and refined sugar was France’s most important
export and it continued to prosper until the Napo-
leonic Wars.
The English refining industry has its first home
in London, and rapidly spread to many of the
large towns, particularly the towns on the coast.
Its early process had been complicated and are
best accounted for by Stow:
“about the year 1544 refining sugar was first
use in England… Then there were but two
sugar houses. And their profit was but very
little, by reason that there were so many sugar-
bankers in Antwerp. And sugar came thence
better and cheaper than it could be afforded in
London. And for the space of twenty years to-
gether these two sugar houses served the
whole realm, both the commendation and profit
of them that undertook the same, whose bene-
fits was occasioned by the stopping of inter-
course between England and Antwerp.”10
There was not real progress in England until
raw sugar began to arrive in quantity from the
West Indies. At this time the sugar which had
been sent to Antwerp for refining was now proc-
essed directly in England. By 1650 there were no
fewer than fifty sugar bakeries in London alone.
By the middle of the 18th century refineries had
been set up in towns such as Chester and Liver-
pool and by the end of the century in Glasgow and
Edinburgh. The refineries were usually small,
processing at most a hundred tons or so of sugar
in a batch like way. The refineries had an average
employment of around 30, most of whom where
members of the same family. However, with the
introduction of technology in the middle of the
19th century the amalgamation of these houses
formed the basics of the modern sugar industry in

P 62
England.
The refining of raw sugar in the United States
can be traced back to 1689, when purification on
a small scale was practiced in New York. Sugar
refining would make its way to the southern
United States by 1751 when it was introduced
into Louisiana, but there are reports of specula-
tive attempts as early as 1673. The first recog-
nized commercial installation was the Bagard re-
finery on Wall Street in New York City. By 1795
Figure 2.6 Old Sugar Mill Showing Cane Extractor
P 63
there were refineries in New York, Philadelphia,
and Boston which were producing 600 tons a year,
but this was only 2 percent of the counties sugar
consumption. In 1861 the Havenmeyer and Elder
refinery in Brooklyn was the world largest and
melted about thirty five tons of raw sugar a day.13
The nineteenth century mechanical develop-
ments were as important to the sugar industry as
they were to industry as a whole. Inventions such
as the milling machine, improvements to the proc-
ess of evaporation and draining, the introduction
of the centrifugal machine, as well as the develop-
ment of the steam engine all revolutionized the
sugar refining industry. Chemical and physical
research influenced the progress in clarification
and boiling. The thermometer took the place of
the preauve de doigt, and molds, bacteria, and
other micro-organism were identified and treated.
All of these inventions produced for the first time,
large amounts of literature about the various as-
pects of the industry, such as E O Von Lippmann
work Geschichte des Zuckers, which was one of
the earliest books to offer a complete history and
overview of the sugar industry. As a result of
these inventions, the old system of small scale
and independent sugar refineries became uneco-
nomical and impractical. At this time, with the
need for capital to invest in this new technologies,
the smaller refineries are conglomerated into sin-
gle large companies. These industrial changes
brought about the modern way in which sugar is
refined.
P 64
End Notes 1 A confection is a food high in sugar content. 2 Strong, L A G. The Story of Sugar. London: Chiswick Press, 1954. 3 Rolph, George M. Something About Sugar: Its History, Growth, Manufacture. San Francisco: Taylor, 1917. 4 Aykroyd, W R. The Story of Sugar. Chicago: Quadragle Books, 1967. 5 Strong, L A G. The Story of Sugar. London: Chiswick Press, 1954. 6 Blood from a young castrated bull, a steer. 7 Aykroyd, W R. The Story of Sugar. Chicago: Quadragle Books, 1967. 8 Hook, Andrew Van. Sugar: Its Production, Technology, and Uses. New York: The Ronald Press Company, 1949. 9 IBID, 137. 10 Strong, L A G. The Story of Sugar. London: Chiswick Press, 1954. P 136. 11 Aykroyd, W R. The Story of Sugar. Chicago: Quadragle Books, 1967. 12 Proof of the finger 13 Lippmann, E O von. Geschiichte des Zuckers. Berlin: Julius Springer, 1929. 14 Hook, Andrew Van. Sugar: Its Production, Technology, and Uses. New York: The Ronald Press Company, 1949.

P 65
Mo
dern
Refi
nin
g P
roce
ss

P 66
W a s h i n g
The raw sugar arrives at the refinery and it passes
over several scales to be measured and weighed.
After it has been measured it is sent to the melt
house. It is here that the sugar enters the refin-
ing process by being melted or dissolved in water.
Here it is put into a mixing machine called the
mingler. This is an oblong tank with a semi-
cylindrical bottom, near which is a revolving hori-
zontal shaft, with arms or paddles that stir and
mix the sugar while the syrup is added. The re-
sulting mixture, or magma, has similar properties
and appearance of a soft brown mortar. From the
mingler the magma drops to the floor below, fal-
ling into centrifugal machines. These machines
spin the magma which separates the impurities
from the sugar crystals.
M e l t i n g
From the centrifugal machine the syrup is now
place onto the melting pan. This is a cylindrical
tank in the center of which is a revolving vertical
shaft, to which are attached horizontal paddles
that serve to facilitate the melting of the magma.
Once the syrup reaches 58.6 percent of solid
matter, it leaves the melt house to the char
house.
D e f e c a t i o n
The melted sugar is pumped to the top floor of the
char house, which are usually structures twelve to
fourteen stories high to aid in the handling of the
liquors from floor to floor by gravity. The process
of removing the remaining impurities is called
defecation. Early on this was done by adding bul-
locks blood to the raw sugar liquor but today the
purification is primarily done with bone char.
B o n e C h a r F i l t r a t i o n The liquor is mixed with bone char in large cylin-
ders. The liquor cycles through these cylinders to
the liquor gallery and then is reintroduced to the
bone char. After around two to three of these
P 67
cycles the liquor begins to run clear. The clear
liquor is then pumped from the liquor gallery into
tanks on the top of the char house. From here is
it pumped to the pan house.
C r y s t a l l i z a t i o n
The last step of refining the liquor occurs in the
pan house. This is the last step in which the
sugar is handled as a liquid. Here the clear liquor,
by means of a vacuum pump, is drawn into the
vacuum pans. These vacuum pans are usually
fourteen to sixteen feet in diameter and appear
almost spherical in shape. These vacuum pans
force the remaining liquid and impurities out of
the liquor. From the vacuum pans the liquor
drops by gravity from floor to floor, slowly trans-
forming from a liquid to a solid or semi-solid.
P a r t i a l D r y i n g
The mixture is then spun in a centrifugal machine
spinning at the rate of 11,000 rotations a minute,
which discharges all the remaining liquor sur-
rounding the sugar crystals. Water is then added
and repeatedly spun off until the mixture is
cleaned and appears bright white. The sugar is
then discharged to a holding bin below.
F i n a l D r y i n g of C r y s t a s
The next step is called granulation even though
the actual crystallization of the sugar crystals took
place in the pan house. The final drying occurs in
an apparatus consisting of two large drums.
These drums are about six feet in diameter and
thirty feet long with a light downward pitch from
the receiving end to the discharge end. The first
drum rest on the floor directly below the storage
bin and is called the sweater. Here the sugar is
passed through the revolving inner cylinder and
then drops down to the granulator. The second
drum is the granulator and is the final step on the
drying process. It works in the same size and
manner as the upper drum but instead of traveling
the length of the drum, the sugar is introduced
P 68
into the center and spun outward. From here the
sugar is carried to dry storage bins where it is left
to cool at normal temperatures until being packed
into containers.
S c r e e n i n g and P a c k i n g
The next and final step in the production of sugar
is the separation and screening of the sugar crys-
tals. There are many different types of screening
methods, but each is based upon a series of steps
which filter any remaining impurities and result in
a variety of sugar crystal sizes. This separated
sugar is then packaged into containers and
shipped from the refinery.

P 69
Bo
ne C
har
Filtr
ati
on
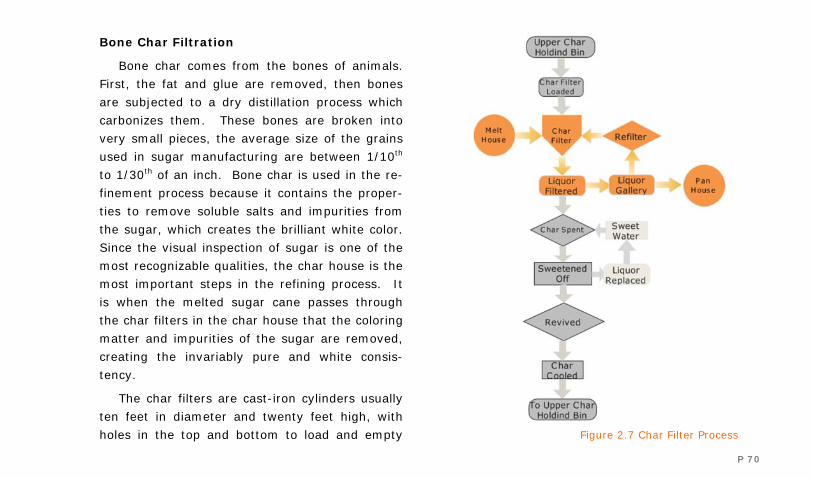
P 70
Bone Char Filtration
Bone char comes from the bones of animals.
First, the fat and glue are removed, then bones
are subjected to a dry distillation process which
carbonizes them. These bones are broken into
very small pieces, the average size of the grains
used in sugar manufacturing are between 1/10th
to 1/30th of an inch. Bone char is used in the re-
finement process because it contains the proper-
ties to remove soluble salts and impurities from
the sugar, which creates the brilliant white color.
Since the visual inspection of sugar is one of the
most recognizable qualities, the char house is the
most important steps in the refining process. It
is when the melted sugar cane passes through
the char filters in the char house that the coloring
matter and impurities of the sugar are removed,
creating the invariably pure and white consis-
tency.
The char filters are cast-iron cylinders usually
ten feet in diameter and twenty feet high, with
holes in the top and bottom to load and empty Figure 2.7 Char Filter Process
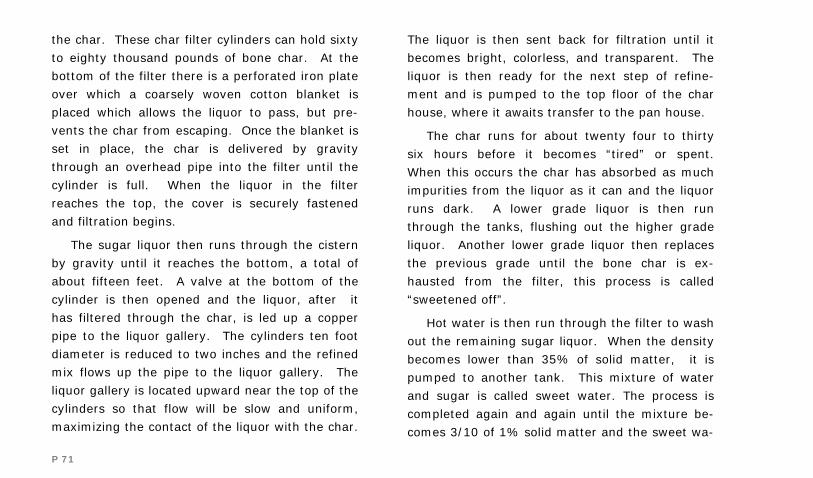
P 71
the char. These char filter cylinders can hold sixty
to eighty thousand pounds of bone char. At the
bottom of the filter there is a perforated iron plate
over which a coarsely woven cotton blanket is
placed which allows the liquor to pass, but pre-
vents the char from escaping. Once the blanket is
set in place, the char is delivered by gravity
through an overhead pipe into the filter until the
cylinder is full. When the liquor in the filter
reaches the top, the cover is securely fastened
and filtration begins.
The sugar liquor then runs through the cistern
by gravity until it reaches the bottom, a total of
about fifteen feet. A valve at the bottom of the
cylinder is then opened and the liquor, after it
has filtered through the char, is led up a copper
pipe to the liquor gallery. The cylinders ten foot
diameter is reduced to two inches and the refined
mix flows up the pipe to the liquor gallery. The
liquor gallery is located upward near the top of the
cylinders so that flow will be slow and uniform,
maximizing the contact of the liquor with the char.
The liquor is then sent back for filtration until it
becomes bright, colorless, and transparent. The
liquor is then ready for the next step of refine-
ment and is pumped to the top floor of the char
house, where it awaits transfer to the pan house.
The char runs for about twenty four to thirty
six hours before it becomes “tired” or spent.
When this occurs the char has absorbed as much
impurities from the liquor as it can and the liquor
runs dark. A lower grade liquor is then run
through the tanks, flushing out the higher grade
liquor. Another lower grade liquor then replaces
the previous grade until the bone char is ex-
hausted from the filter, this process is called
“sweetened off”.
Hot water is then run through the filter to wash
out the remaining sugar liquor. When the density
becomes lower than 35% of solid matter, it is
pumped to another tank. This mixture of water
and sugar is called sweet water. The process is
completed again and again until the mixture be-
comes 3/10 of 1% solid matter and the sweet wa-
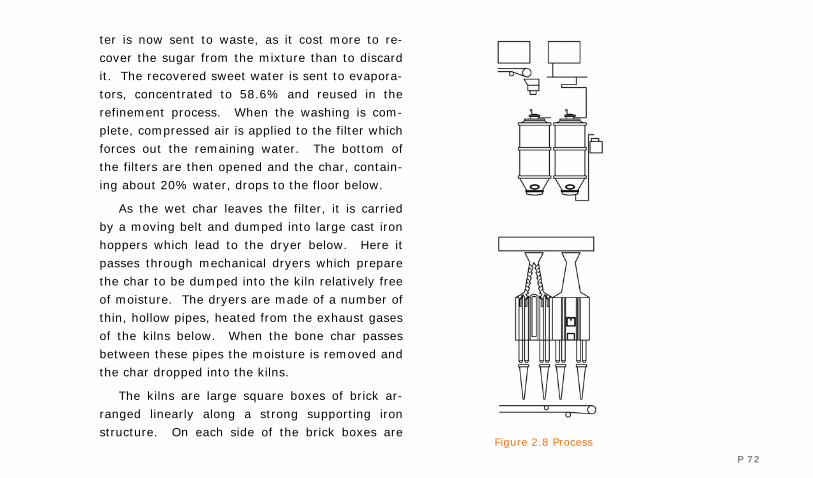
P 72
ter is now sent to waste, as it cost more to re-
cover the sugar from the mixture than to discard
it. The recovered sweet water is sent to evapora-
tors, concentrated to 58.6% and reused in the
refinement process. When the washing is com-
plete, compressed air is applied to the filter which
forces out the remaining water. The bottom of
the filters are then opened and the char, contain-
ing about 20% water, drops to the floor below.
As the wet char leaves the filter, it is carried
by a moving belt and dumped into large cast iron
hoppers which lead to the dryer below. Here it
passes through mechanical dryers which prepare
the char to be dumped into the kiln relatively free
of moisture. The dryers are made of a number of
thin, hollow pipes, heated from the exhaust gases
of the kilns below. When the bone char passes
between these pipes the moisture is removed and
the char dropped into the kilns.
The kilns are large square boxes of brick ar-
ranged linearly along a strong supporting iron
structure. On each side of the brick boxes are Figure 2.8 Process
P 73
large pipes, usually about twelve inches wide,
called retorts. These retorts extend into the brick
boxes to a central corridor between the kilns,
known as the furnace. The furnace connects the
kilns together and runs the entire length of the
structure, which extends about sixteen feet. In-
tense fires are maintained in the furnace and cir-
culate around the retorts, keeping them red hot.
The upper retorts feed the mechanical dryers on
the above floor and the lower retorts lead to the
cooling pipes below. As the char is fed through
the retorts it becomes heated to around 900 de-
grees Fahrenheit and the organic matter it ab-
sorbed from the sugar liquid is changed into car-
bon. The char now regains its filtration properties
and this process makes the char almost as good
as new, or as the term goes, revived. Each kiln
has a capacity to revived about 60,000 pounds of
bone char a day.
If the char in this red hot state was exposed
suddenly to air, it would quickly be reduced to
ashes. Therefore, a cooling process is needed to
return the char to its solid form. When it leaves
the kilns it is drawn into cooling pipes which re-
duce their diameter down to four and a half inches
in section. This allows for only a small amount of
char to escape at a time, allowing it be dispensed
from the pipes at the exact right time it has
cooled. This process reduced the char from about
900 degrees to around 200 degrees, with the heat
being taken to the dryer above. When the char
leaves the cooling pipes it is only around 180 de-
grees. It is then carried by chain bucket elevators
to the top of the char house to be loaded into the
filters to restart the filtration process.
Char filtration differs between refineries but
the average time it takes for filling, settling, run-
ning the liquor through, sweetening off, washing,
applying air, and emptying the filters is usually
between seventy-two to eighty-six hours. Using
eighty-six as a base and applying holidays and
maintenance shutdowns, this process is completed
approximately eighty-one times a year.
P 74
Each time the char is handled a certain per-
cent of its mass is lost. It is estimated that origi-
nal char put into filters will last from five to six
years before being lost completely as dust. Ap-
proximately one pound of char is required for
every pound of sugar melted. The char is only in
contact with the sugar liquor for twenty-four
hours out of the eighty-six hour process. A sugar
refinery which handles two million pounds of
sugar a day should have a capacity to handle six
million pounds of char. This requires a large and
costly plant to run, giving the char house its im-
portance and dominance within the refinery.

P 75
Ch
ar
Ho
use

P 76
Figure 2.9 Process Schematic
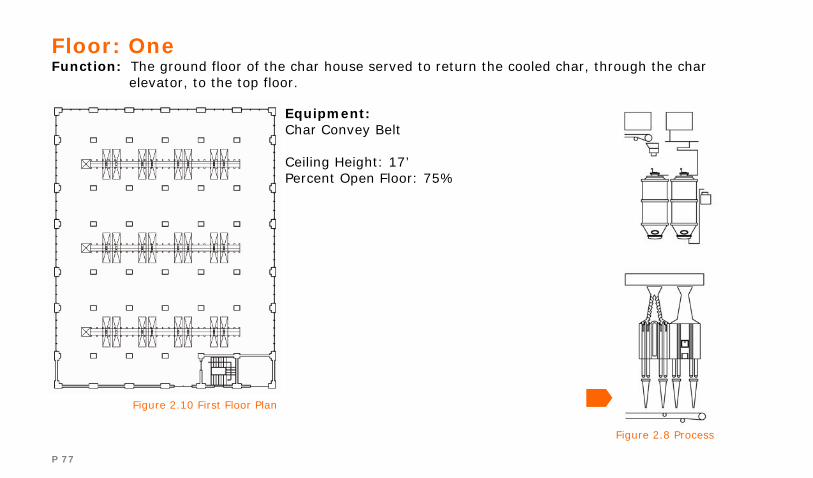
P 77
Equipment: Char Convey Belt Ceiling Height: 17’ Percent Open Floor: 75%
Floor: One Function: The ground floor of the char house served to return the cooled char, through the char
elevator, to the top floor.
Figure 2.10 First Floor Plan
Figure 2.8 Process

P 78
Equipment: Kilns Exhaust Stacks Ceiling Height: 12’ Percent Open Floor: 20%
Floor: Two Function: The second floor contains the kilns. It was on this floor which the char would be
heated and revived before dropping to the cooling pipes below.
Figure 2.8 Process
Figure 2.11 Second Floor Plan
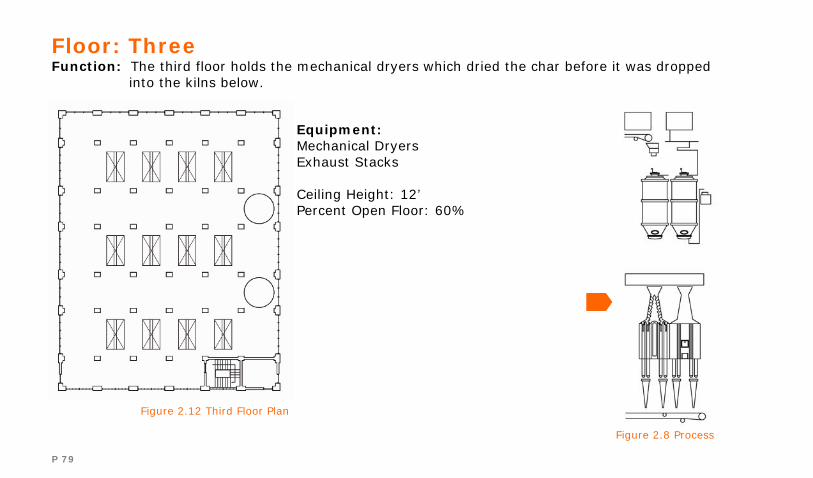
P 79
Equipment: Mechanical Dryers Exhaust Stacks Ceiling Height: 12’ Percent Open Floor: 60%
Floor: Three Function: The third floor holds the mechanical dryers which dried the char before it was dropped
into the kilns below.
Figure 2.8 Process
Figure 2.12 Third Floor Plan
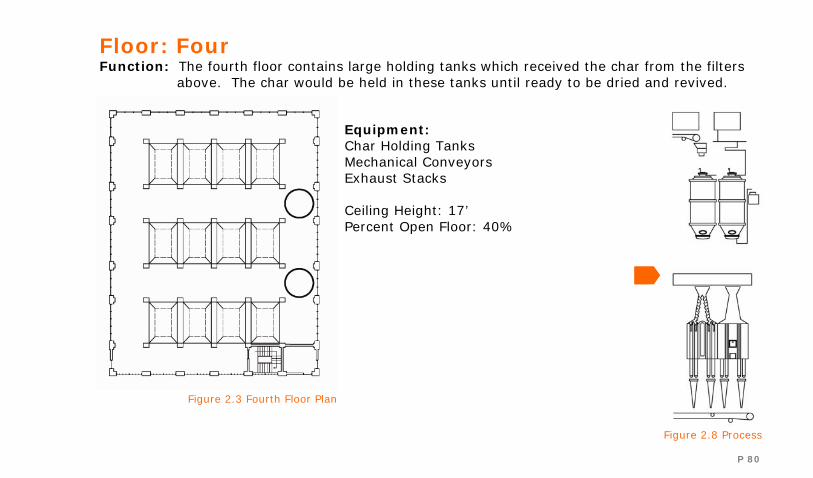
P 80
Equipment: Char Holding Tanks Mechanical Conveyors Exhaust Stacks Ceiling Height: 17’ Percent Open Floor: 40%
Floor: Four Function: The fourth floor contains large holding tanks which received the char from the filters
above. The char would be held in these tanks until ready to be dried and revived.
Figure 2.8 Process
Figure 2.3 Fourth Floor Plan
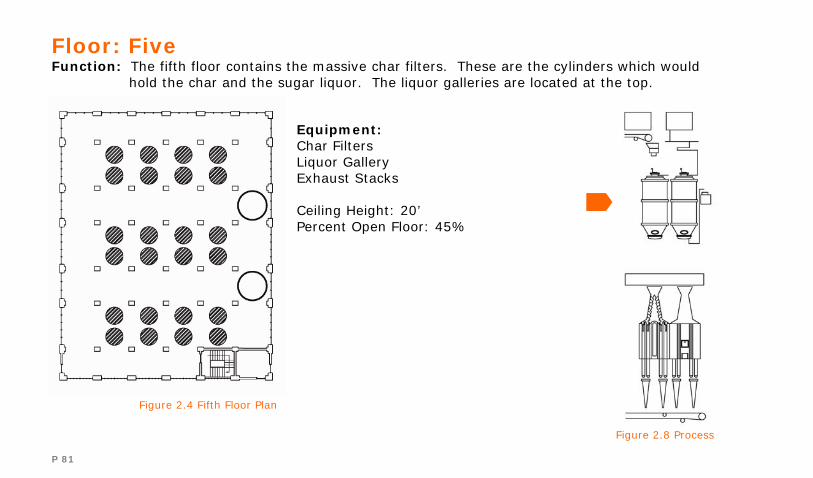
P 81
Equipment: Char Filters Liquor Gallery Exhaust Stacks Ceiling Height: 20’ Percent Open Floor: 45%
Floor: Five Function: The fifth floor contains the massive char filters. These are the cylinders which would
hold the char and the sugar liquor. The liquor galleries are located at the top.
Figure 2.8 Process
Figure 2.4 Fifth Floor Plan
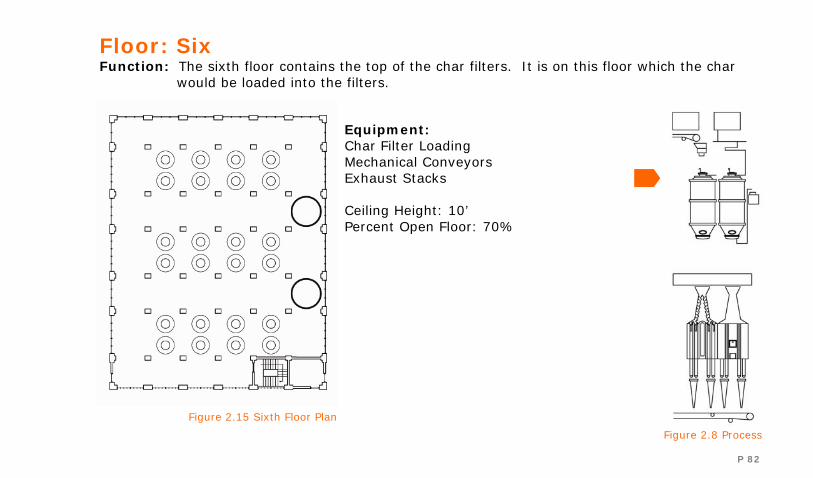
P 82
Equipment: Char Filter Loading Mechanical Conveyors Exhaust Stacks Ceiling Height: 10’ Percent Open Floor: 70%
Floor: Six Function: The sixth floor contains the top of the char filters. It is on this floor which the char
would be loaded into the filters.
Figure 2.8 Process
Figure 2.15 Sixth Floor Plan

P 83
Equipment: Mechanical Conveyors Exhaust Stacks Ceiling Height: 12’ Percent Open Floor: 75%
Floor: Seven Function: The seventh floor was the floor which the char would be sorted to be dropped into the
filters below.
Figure 2.8 Process
Figure 2.16 Seventh Floor Plan
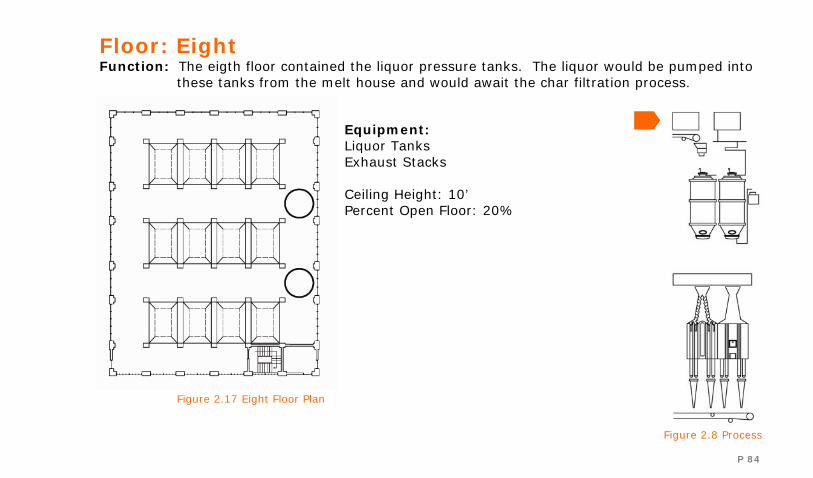
P 84
Equipment: Liquor Tanks Exhaust Stacks Ceiling Height: 10’ Percent Open Floor: 20%
Floor: Eight Function: The eigth floor contained the liquor pressure tanks. The liquor would be pumped into
these tanks from the melt house and would await the char filtration process.
Figure 2.8 Process
Figure 2.17 Eight Floor Plan
P 85
Mission Statement
To adopt a historic structure, utilizing preservation and sustainable design concepts, to create a
facility which provides for a historic sense of place while also serving as a venue to express and
experience art for the residents of Sugar Land Texas.
P 86
Goal Summery Goal: The facility should be able to provide space for a multitude of events of various scales, size, and con-
figuration during different times of building occupancy and use.
Goal: The facility should provide a modern, durable, and updatable environment through the use of materi-als and the spatial adaption of existing spaces.
Goal: The facility should preserve the historic appearance of the Char House as it appeared in 1930.
Goal: The facility should capitalize on the ability to mix historical materials, forms, and construction with contemporary additions and functions.
Goal: The facility should engage a response from users through an incorporation of the historic sense of place and the implementation of sustainable design strategies.
Goal: The interior spaces should provide a clean, comfortable, and healthy environment by implementing sustainable design strategies and provide a comfortable temperature year round.
Goal: The facility should reuse existing material.
Goal: The project should be approached with a holistically sustainable design strategy focusing on responsi-ble energy consumption and utilizing materials which are environmentally sustainable or already pre-sent on the site.
Goal: The facility should provide a highly visible, integrated, and interesting circulation system for all users of the facility.
Goal: The building should provide for large, visible, and clean areas of group interaction without compromis-ing a sense of privacy and building intimacy.
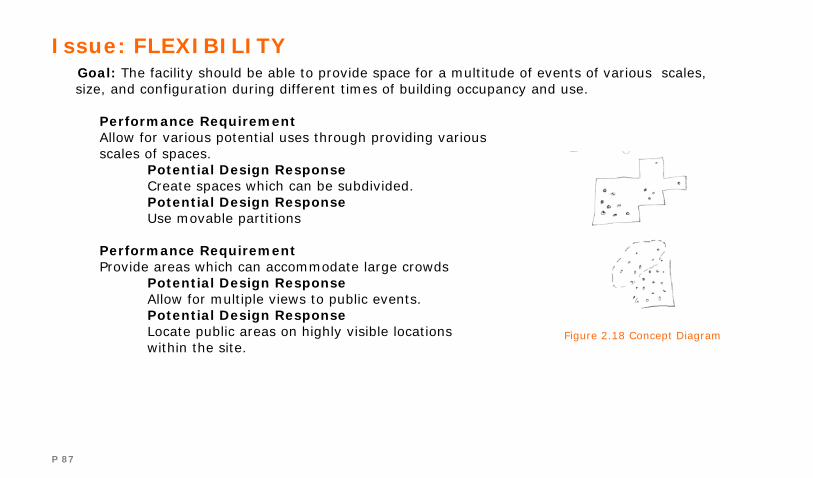
P 87
Issue: FLEXIBILITY
Goal: The facility should be able to provide space for a multitude of events of various scales, size, and configuration during different times of building occupancy and use.
Performance Requirement Allow for various potential uses through providing various scales of spaces. Potential Design Response Create spaces which can be subdivided. Potential Design Response Use movable partitions Performance Requirement Provide areas which can accommodate large crowds Potential Design Response Allow for multiple views to public events. Potential Design Response Locate public areas on highly visible locations within the site.
Figure 2.18 Concept Diagram
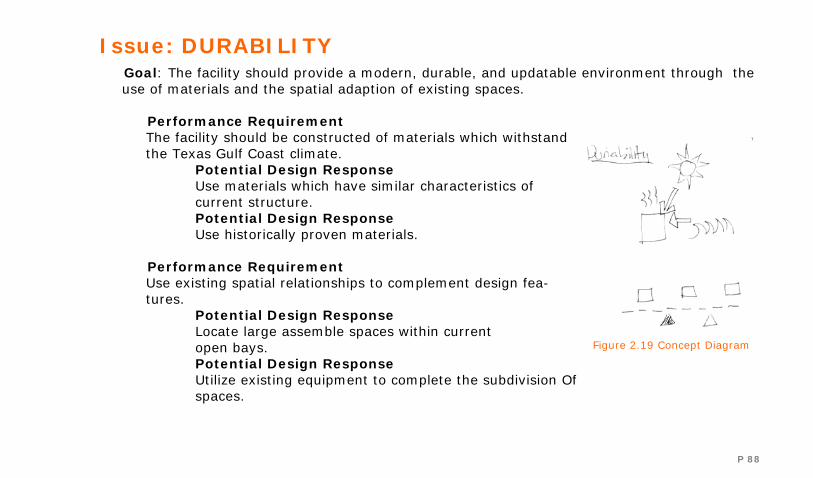
P 88
Issue: DURABILITY
Goal: The facility should provide a modern, durable, and updatable environment through the use of materials and the spatial adaption of existing spaces.
Performance Requirement The facility should be constructed of materials which withstand the Texas Gulf Coast climate. Potential Design Response Use materials which have similar characteristics of current structure. Potential Design Response Use historically proven materials. Performance Requirement Use existing spatial relationships to complement design fea-tures. Potential Design Response Locate large assemble spaces within current open bays. Potential Design Response Utilize existing equipment to complete the subdivision Of spaces.
Figure 2.19 Concept Diagram
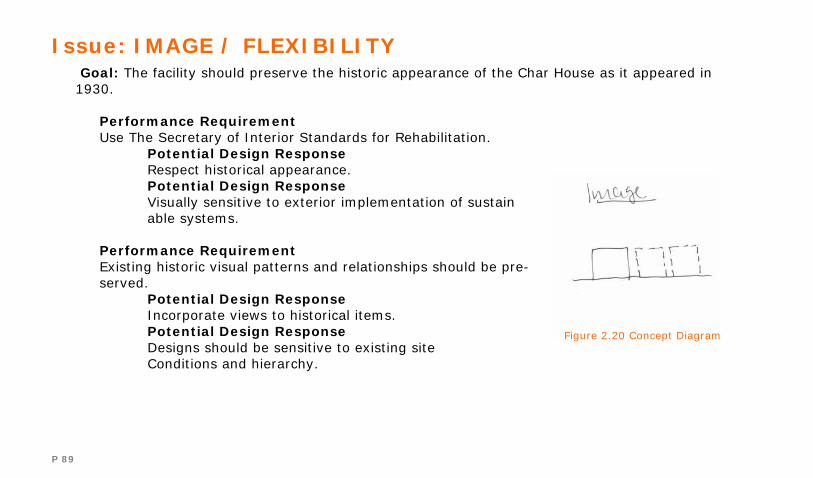
P 89
Issue: IMAGE / FLEXIBILITY
Goal: The facility should preserve the historic appearance of the Char House as it appeared in 1930.
Performance Requirement Use The Secretary of Interior Standards for Rehabilitation. Potential Design Response Respect historical appearance. Potential Design Response Visually sensitive to exterior implementation of sustain able systems. Performance Requirement Existing historic visual patterns and relationships should be pre-served. Potential Design Response Incorporate views to historical items. Potential Design Response Designs should be sensitive to existing site Conditions and hierarchy.
Figure 2.20 Concept Diagram
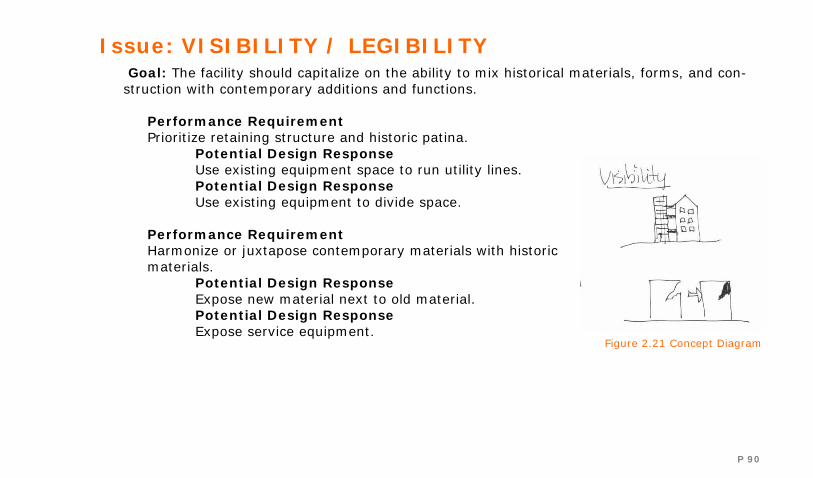
P 90
Issue: VISIBILITY / LEGIBILITY
Goal: The facility should capitalize on the ability to mix historical materials, forms, and con-struction with contemporary additions and functions.
Performance Requirement Prioritize retaining structure and historic patina. Potential Design Response Use existing equipment space to run utility lines. Potential Design Response Use existing equipment to divide space. Performance Requirement Harmonize or juxtapose contemporary materials with historic materials. Potential Design Response Expose new material next to old material. Potential Design Response Expose service equipment.
Figure 2.21 Concept Diagram

P 91
Issue: MOOD / AMBIENCE / OLFACTORY
Goal: The facility should engage a response from users through an incorporation of the his-toric sense of place and the implementation of sustainable design strategies.
Performance Requirement The facility should engage the senses with the inclusion of natu-ral features. Potential Design Response Allow for operable windows. Potential Design Response Have indoor gardens Performance Requirement The facility should encourage the exploration of historical con-tent. Potential Design Response Include historical information markers within the Char House Potential Design Response Decentralize historic materials through out the facility.
Figure 2.22 Concept Diagram

P 92
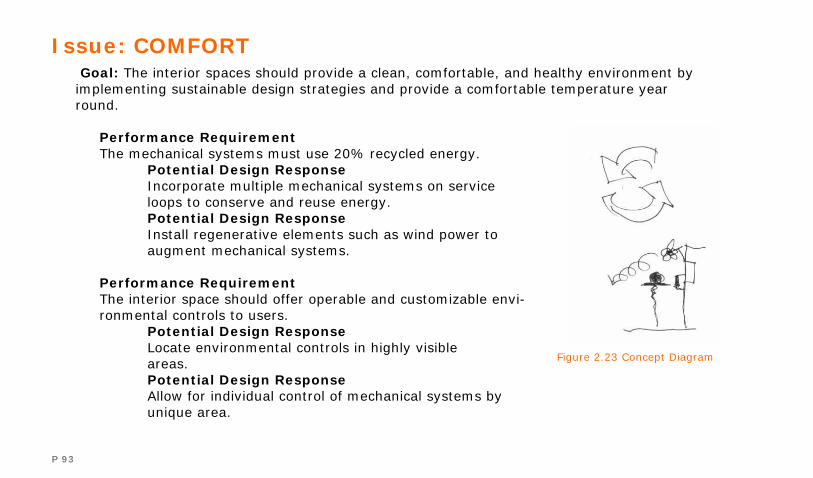
P 93
Issue: COMFORT
Goal: The interior spaces should provide a clean, comfortable, and healthy environment by implementing sustainable design strategies and provide a comfortable temperature year round.
Performance Requirement The mechanical systems must use 20% recycled energy. Potential Design Response Incorporate multiple mechanical systems on service loops to conserve and reuse energy. Potential Design Response Install regenerative elements such as wind power to augment mechanical systems. Performance Requirement The interior space should offer operable and customizable envi-ronmental controls to users. Potential Design Response Locate environmental controls in highly visible areas. Potential Design Response Allow for individual control of mechanical systems by unique area.
Figure 2.23 Concept Diagram
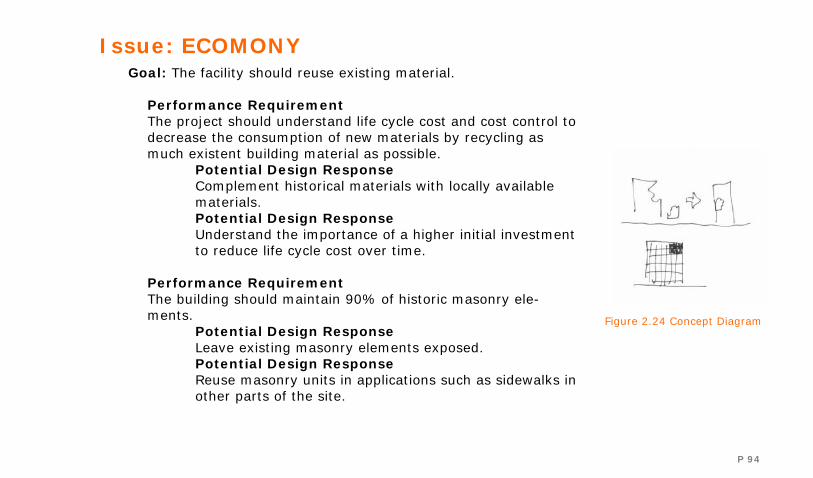
P 94
Issue: ECOMONY
Goal: The facility should reuse existing material.
Performance Requirement The project should understand life cycle cost and cost control to decrease the consumption of new materials by recycling as much existent building material as possible. Potential Design Response Complement historical materials with locally available materials. Potential Design Response Understand the importance of a higher initial investment to reduce life cycle cost over time. Performance Requirement The building should maintain 90% of historic masonry ele-ments. Potential Design Response Leave existing masonry elements exposed. Potential Design Response Reuse masonry units in applications such as sidewalks in other parts of the site.
Figure 2.24 Concept Diagram
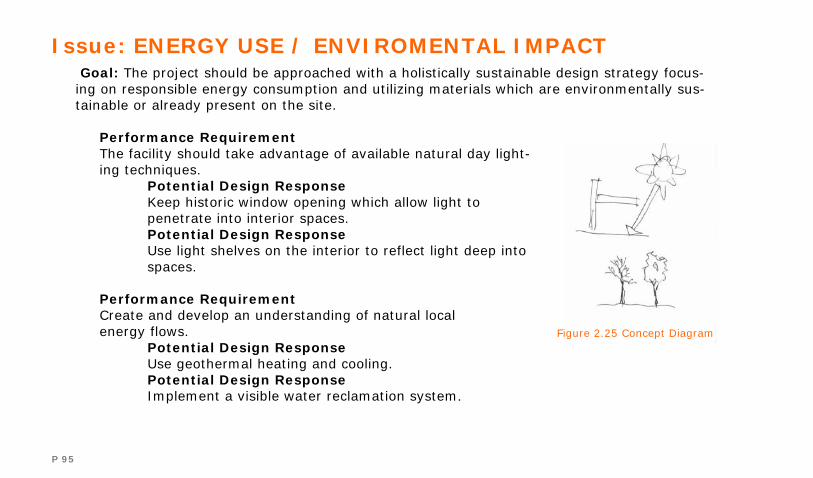
P 95
Issue: ENERGY USE / ENVIROMENTAL IMPACT
Goal: The project should be approached with a holistically sustainable design strategy focus-ing on responsible energy consumption and utilizing materials which are environmentally sus-tainable or already present on the site.
Performance Requirement The facility should take advantage of available natural day light-ing techniques. Potential Design Response Keep historic window opening which allow light to penetrate into interior spaces. Potential Design Response Use light shelves on the interior to reflect light deep into spaces. Performance Requirement Create and develop an understanding of natural local energy flows. Potential Design Response Use geothermal heating and cooling. Potential Design Response Implement a visible water reclamation system.
Figure 2.25 Concept Diagram

P 96
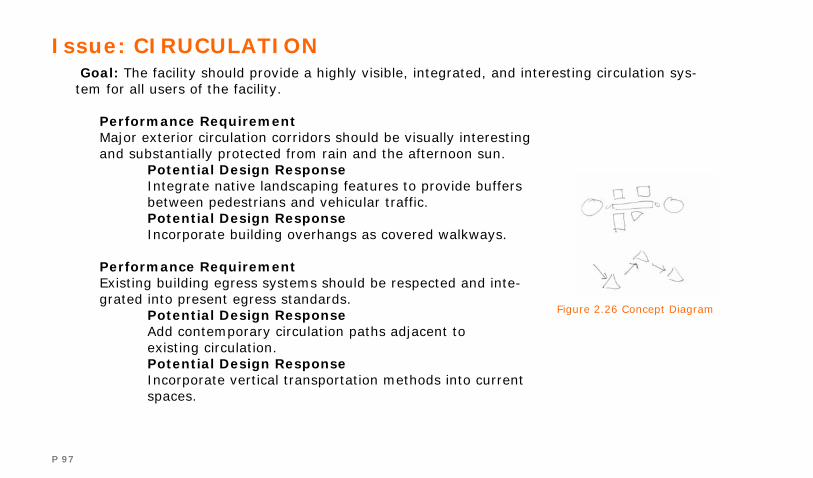
P 97
Issue: CIRUCULATION
Goal: The facility should provide a highly visible, integrated, and interesting circulation sys-tem for all users of the facility.
Performance Requirement Major exterior circulation corridors should be visually interesting and substantially protected from rain and the afternoon sun. Potential Design Response Integrate native landscaping features to provide buffers between pedestrians and vehicular traffic. Potential Design Response Incorporate building overhangs as covered walkways. Performance Requirement Existing building egress systems should be respected and inte-grated into present egress standards. Potential Design Response Add contemporary circulation paths adjacent to existing circulation. Potential Design Response Incorporate vertical transportation methods into current spaces.
Figure 2.26 Concept Diagram
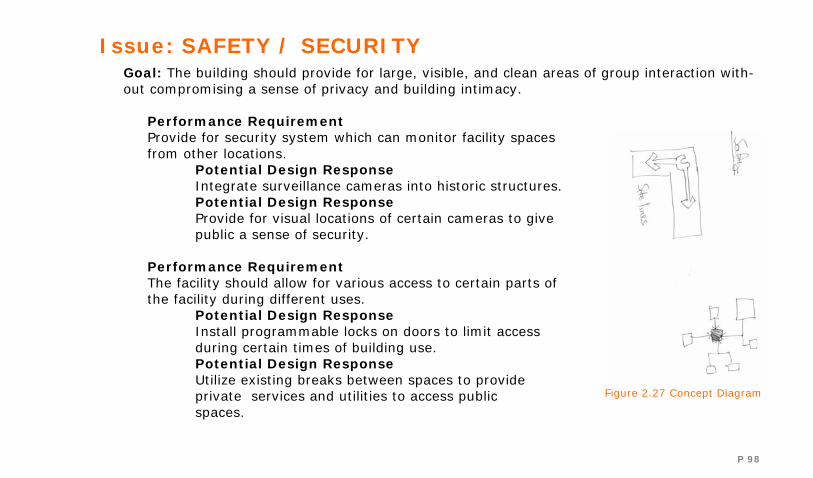
P 98
Issue: SAFETY / SECURITY
Goal: The building should provide for large, visible, and clean areas of group interaction with-out compromising a sense of privacy and building intimacy.
Performance Requirement Provide for security system which can monitor facility spaces from other locations. Potential Design Response Integrate surveillance cameras into historic structures. Potential Design Response Provide for visual locations of certain cameras to give public a sense of security. Performance Requirement The facility should allow for various access to certain parts of the facility during different uses. Potential Design Response Install programmable locks on doors to limit access during certain times of building use. Potential Design Response Utilize existing breaks between spaces to provide private services and utilities to access public spaces.
Figure 2.27 Concept Diagram
P 99
Lobby The primary entry point for the facility. It will serve as the first contact and organization for experiencing the facility as well as providing informational services and a securities. Activities Entry and Egress Performance Requirements Allow for Perceived Security of Public Spaces.
1. Function as Central Gathering Space 2. Provide Information Services to Artist and Museum Staff 3. Location of Restroom Facilities 4. Respond to both Pedestrian and Vehicular Traffic
Users: 1,00 Sq Ft / (Code Required 7’ Per Person) = 150 Users Suggested Response to Average of 50 All Users, Artist, and Museum Staff Equipment Information Kiosk, Central Desk Spatial Requirements 1,000 sq feet

P 100
Figure 2.28 Relationship Diagram

P 101
Café The café should serve as a primary social gathering place in which all users may interact. Activities Food Service Performance Requirements
1. Provide Indoor and Outdoor Dinning Areas (emphasis on indoor due to climate) 2. Restrict Direct Light and Provide Multiple Lighting Scenarios to Create Ambiance 3. Allow for After Hours Use (security and entrance) 4. Bar Area with Big Screen Television
Users 1,300 Sq Ft / (Code Required 13’ Per Person) = 100 Users All Users, Artist, and Museum Staff Equipment Movable furniture Cashier Audio and Visual Entertainment Systems Space Requirements 1,300 Sq Ft
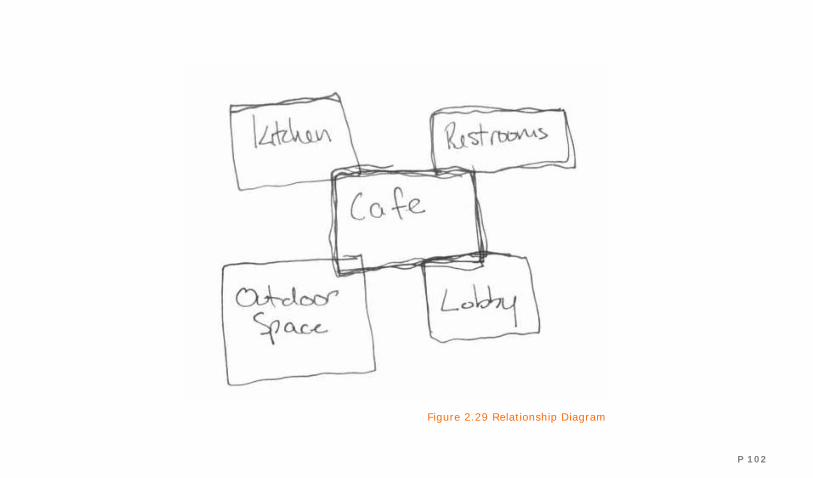
P 102
Figure 2.29 Relationship Diagram

P 103
Café [kitchen] The café is intended to be strong social experience of the facility and must be able to provide the services to assist catered events as well as prepare meals. Activity Food Preparation Spatial Requirements
1. Café Service Functions (Record Keeping, Accounting) 2. Storage Space (food)
Users 1,000 Sq Ft / (Code Requirement 200’ ) = 3 Users Cooks, Wait Staff Equipment Refrigerator and Freezer Unites Cooking and Cleaning Equipment Garbage Collection Access Space Requirements 1,000 sq ft
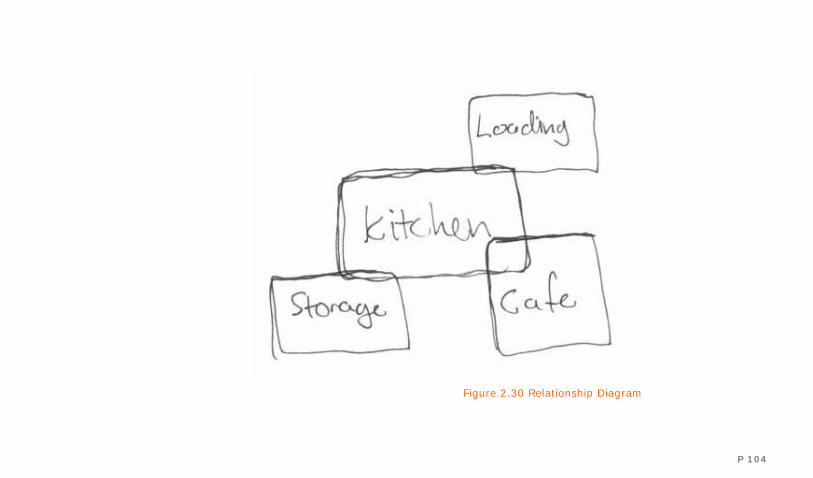
P 104
Figure 2.30 Relationship Diagram

P 105
Auditorium The auditorium should host gatherings for numerous functions, primarily audio and presentation functions. Activities Meetings, Lectures, Presentation Performance Requirements
1. Audio and Visual Capabilities 2. Blend Natural Lighting with Controlled Lighting (Direct verse Ambient) 3. Service Openings (8’) 4. Acoustical / Visual Construction Techniques 5. Support Multiple Power Requirements (Use verse Idle, Appendix D) 6. Location Adjacent to Lobby (Ease of Circulation) 7. Fixed Seating
Users 1,000 Sq Ft / (Code Requirement 8’ Fixed Seating) = 125 Users Equipment Projector Equipment, Audio Equipment, Fixed Seating Space Requirements 1,000 sq feet
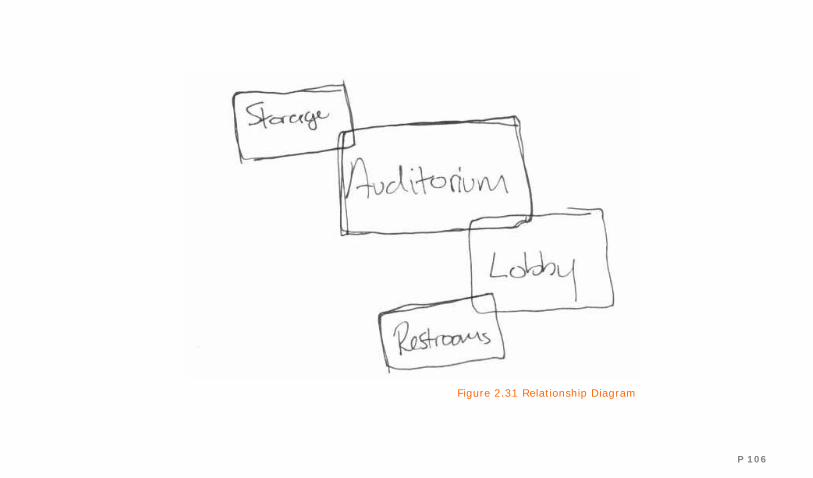
P 106
Figure 2.31 Relationship Diagram

P 107
Black Box Theater The black theater should create a space in which performances, exhibits by the artist, or concerts can be performed. The theater should be able to support various assembly sizes. Activities Concerts, Exhibits, Performances Spatial Requirements
1. Acoustical Construction 2. Clear Stage Area 3. Audio and Visual support Booth 4. Flexible Seating and Spatial Set Up 5. Multiple Viewing Arrangements 6. Proximity to Large Exterior Space
Users 2,000 Sq Ft / (Code Requirement 10’ Movable Seating) = 200 Users Equipment Audio and Visual Equipment Movable Partitions Spatial Requirements 2,000 sq ft

P 108
Figure 2.32 Relationship Diagram
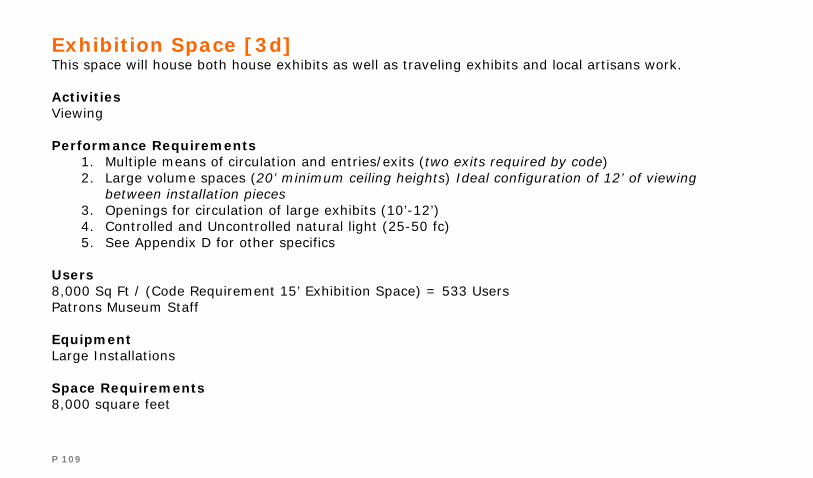
P 109
Exhibition Space [3d] This space will house both house exhibits as well as traveling exhibits and local artisans work. Activities Viewing Performance Requirements
1. Multiple means of circulation and entries/exits (two exits required by code) 2. Large volume spaces (20’ minimum ceiling heights) Ideal configuration of 12’ of viewing
between installation pieces 3. Openings for circulation of large exhibits (10’-12’) 4. Controlled and Uncontrolled natural light (25-50 fc) 5. See Appendix D for other specifics
Users 8,000 Sq Ft / (Code Requirement 15’ Exhibition Space) = 533 Users Patrons Museum Staff Equipment Large Installations Space Requirements 8,000 square feet

P 110
Figure 2.33 Relationship Diagram

P 111
Exhibition Space [2d] Contain smaller spaces of exhibits as well as hosting traveling spectacles. Primarily concerned with two dimensional objects which need to be exhibited in controlled environments. Activity Viewing Performance Requirements
1. Multiple Circulations on fixed paths 2. At least 10’ ceilings (heights appropriate to width) 3. proper viewing distances (4’ with 40° field of view) 4. Controlled light (15-30 fc, Optimum from above) 5. Large openings for installing installations (8’ minimum) 6. climate control (70° with 50% humidity) 7. See Appendix D for other specifics
Users 4,000 Sq Ft / (Code Requirement 7’ Concentrated Use Exhibition Space) = 570 Users Patrons and Museum Staff Equipment Movable partitions Space Requirements 4,000 sq ft
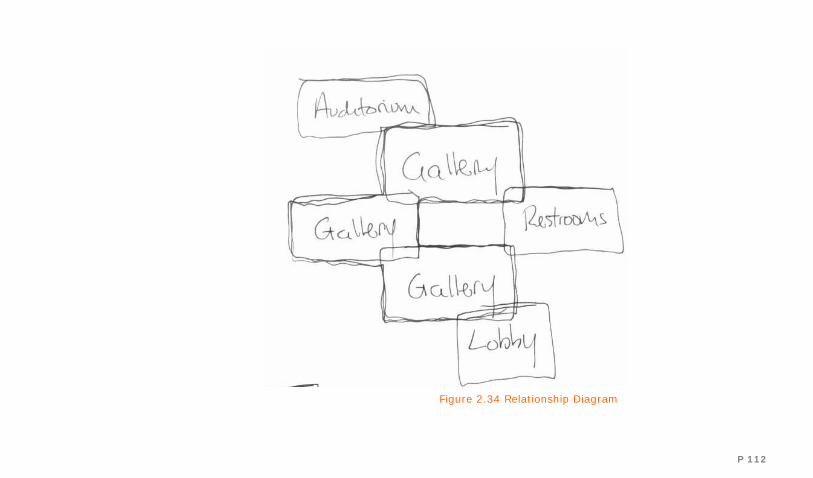
P 112
Figure 2.34 Relationship Diagram
P 113
Exhibition Storage The space will be needed to serve the local exhibits as well as serve a secure deposit of traveling collections. The space will provide for museum installation construction as well as offer a storage and service of the exhibits while at the museum. Activity Storage and Construction of Installations Performance Requirements
1. No natural lighting requirements (Accommodate for no natural light required by some ex-hibits)
2. Climate Control (60° with 50% humidity) 3. Service opening adjacent to exhibits loading entries and service drop off 4. Security of private space
Users 1,000 Sq Ft / (Code Requirement 300’) = 3 Users Museum Staff Equipment Construction Equipment, Secure Storage Space Requirement 1,000 sq ft
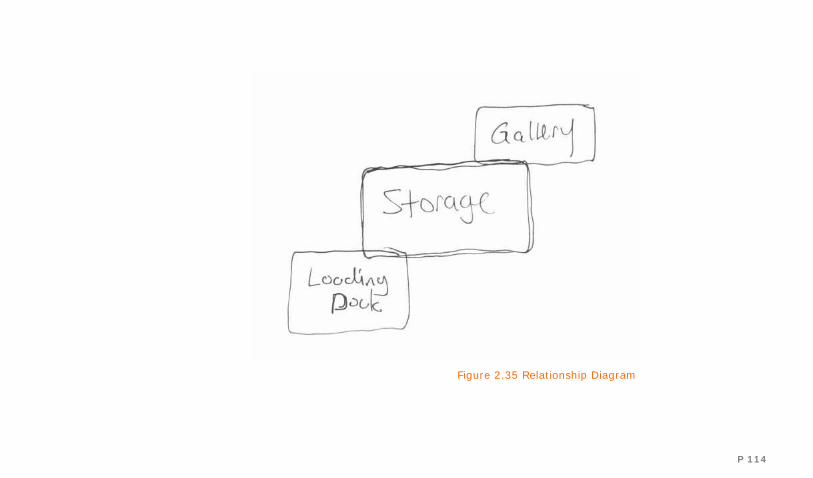
P 114
Figure 2.35 Relationship Diagram

P 115
Museum Administration Offices Housing the staff and service portions of the museum. Activities Office Use Performance Requirements
1. Open workspaces with enclosed offices 2. Natural Lighting and Artificial lightening balance 3. Connection to public spaces and installations
Users 500 Sq Ft / (Code Requirement 100’) = 5 Users Equipment Security Observation Desk Workstations Space Requirement 500 sq ft
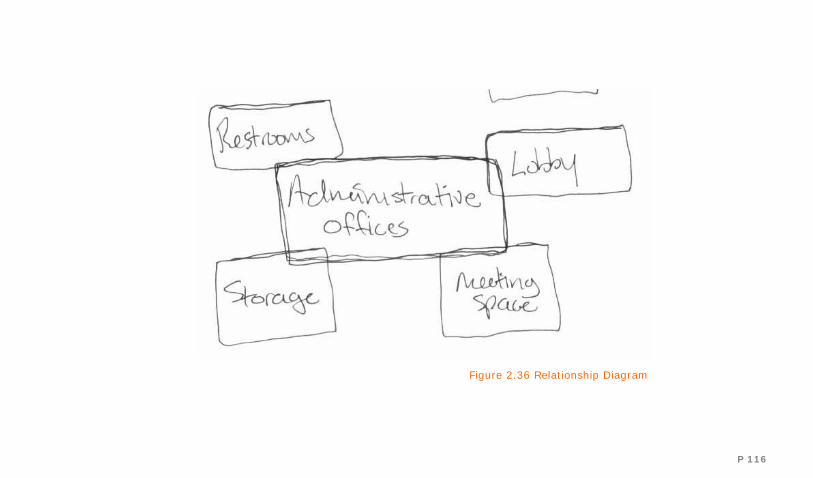
P 116
Figure 2.36 Relationship Diagram
P 117
Roof Garden Intended to both provide the facility with ecological responsibility as well as a connection between the outside and inside. Activities Exhibit Space, Community Space Spatial Requirements
1. Understanding of local plant and wildlife 2. Function for building heating and cooling 3. Water Harvesting
Users 2,000 Sq Ft / (Recommended 100’) = 20 Users Patrons, Museum Staff Space Requirements 2,000 sq ft
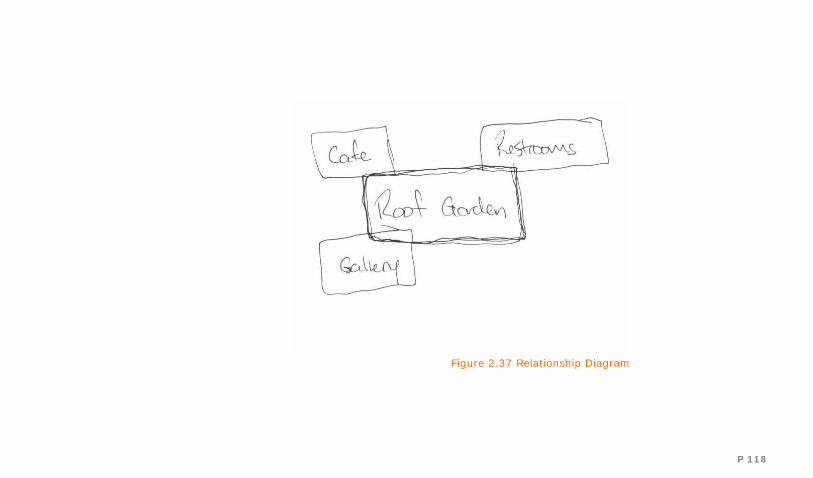
P 118
Figure 2.37 Relationship Diagram

P 119
CASE STUDY Mass Moca Bruner / Cott North Adams, Massachusetts
Vacant for ten years, a nineteenth-century
industrial complex in northwestern Massachusetts
has been give a new life as a museum/arts center.
The focal point of the 13 acre site is the Mass
MoCa. Originally built for Arnold Printworks, a
cotton fabric company, the complex was used
form 1940 to 1985 by the Sprague Electric Com-
pany. As it was the primary source of employ-
ment in North Adams. The complex is located
close to Williams College and Tanglewood and it
became the focus of a contemporary art museum.
The 160,000 square foot museum opened in
1999, however, 40,000 of that is office space for
project viability.
As visitors enter the courtyard they encounter
building 3, which was cut down to its foundation
walls to become an outdoor gallery. This is also
the cemetery of the abby serving as a reflecting
pool for the clock tower, a centerpiece of the com-
plex. The lobby occupies the entire first floor in
building 10. The performing arts theater building,
building 11, is a multifunctional, state of the art,
Figure 2.38 MOCA Courtyard

P 120
black box theater, which can be organized as a
650-seat conventional stage or for performance
in the round, or for video cinema screening.
Figure 2.40 MOCA Floor Plan
Figure 2.39 MOCA Interior Spaces
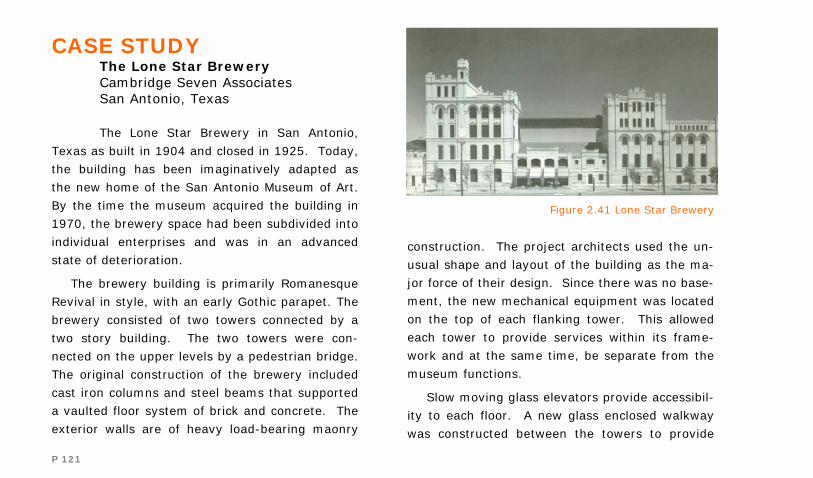
P 121
CASE STUDY The Lone Star Brewery Cambridge Seven Associates San Antonio, Texas
The Lone Star Brewery in San Antonio,
Texas as built in 1904 and closed in 1925. Today,
the building has been imaginatively adapted as
the new home of the San Antonio Museum of Art.
By the time the museum acquired the building in
1970, the brewery space had been subdivided into
individual enterprises and was in an advanced
state of deterioration.
The brewery building is primarily Romanesque
Revival in style, with an early Gothic parapet. The
brewery consisted of two towers connected by a
two story building. The two towers were con-
nected on the upper levels by a pedestrian bridge.
The original construction of the brewery included
cast iron columns and steel beams that supported
a vaulted floor system of brick and concrete. The
exterior walls are of heavy load-bearing maonry
construction. The project architects used the un-
usual shape and layout of the building as the ma-
jor force of their design. Since there was no base-
ment, the new mechanical equipment was located
on the top of each flanking tower. This allowed
each tower to provide services within its frame-
work and at the same time, be separate from the
museum functions.
Slow moving glass elevators provide accessibil-
ity to each floor. A new glass enclosed walkway
was constructed between the towers to provide
Figure 2.41 Lone Star Brewery
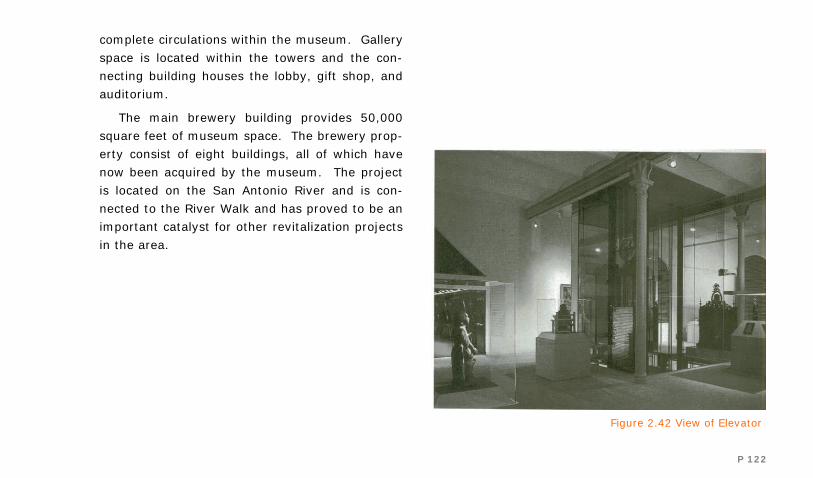
P 122
complete circulations within the museum. Gallery
space is located within the towers and the con-
necting building houses the lobby, gift shop, and
auditorium.
The main brewery building provides 50,000
square feet of museum space. The brewery prop-
erty consist of eight buildings, all of which have
now been acquired by the museum. The project
is located on the San Antonio River and is con-
nected to the River Walk and has proved to be an
important catalyst for other revitalization projects
in the area.
Figure 2.42 View of Elevator
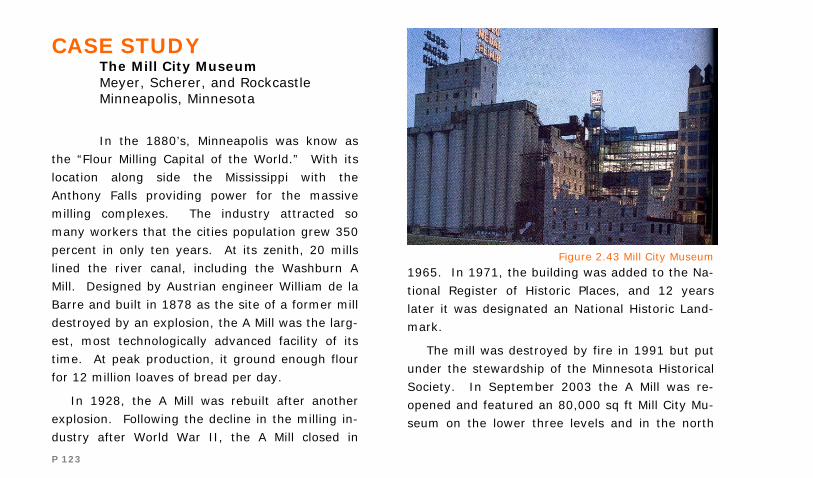
P 123
CASE STUDY The Mill City Museum Meyer, Scherer, and Rockcastle Minneapolis, Minnesota
In the 1880’s, Minneapolis was know as
the “Flour Milling Capital of the World.” With its
location along side the Mississippi with the
Anthony Falls providing power for the massive
milling complexes. The industry attracted so
many workers that the cities population grew 350
percent in only ten years. At its zenith, 20 mills
lined the river canal, including the Washburn A
Mill. Designed by Austrian engineer William de la
Barre and built in 1878 as the site of a former mill
destroyed by an explosion, the A Mill was the larg-
est, most technologically advanced facility of its
time. At peak production, it ground enough flour
for 12 million loaves of bread per day.
In 1928, the A Mill was rebuilt after another
explosion. Following the decline in the milling in-
dustry after World War II, the A Mill closed in
1965. In 1971, the building was added to the Na-
tional Register of Historic Places, and 12 years
later it was designated an National Historic Land-
mark.
The mill was destroyed by fire in 1991 but put
under the stewardship of the Minnesota Historical
Society. In September 2003 the A Mill was re-
opened and featured an 80,000 sq ft Mill City Mu-
seum on the lower three levels and in the north
Figure 2.43 Mill City Museum
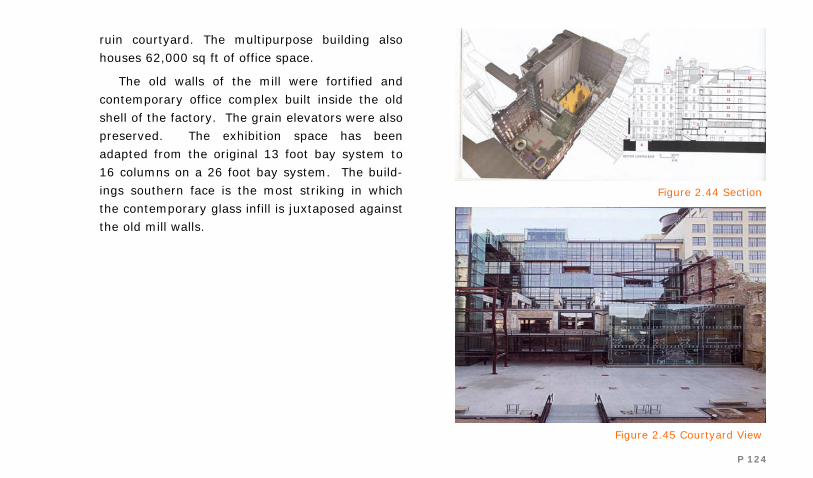
P 124
ruin courtyard. The multipurpose building also
houses 62,000 sq ft of office space.
The old walls of the mill were fortified and
contemporary office complex built inside the old
shell of the factory. The grain elevators were also
preserved. The exhibition space has been
adapted from the original 13 foot bay system to
16 columns on a 26 foot bay system. The build-
ings southern face is the most striking in which
the contemporary glass infill is juxtaposed against
the old mill walls.
Figure 2.45 Courtyard View
Figure 2.44 Section

P 125
List of Figures [2.x]
Figure 2.1 Sugar Bowl Plate (Strong, 3) Figure 2.2 Venetian Sugar Factory (Aykroyd, 34) Figure 2.3 Primitive Sugar Mill (Hook, 45) Figure 2.4 Mill Showing Boiling Pans (Hook, 55) Figure 2.5 Sugar Consumption Production (Strong, 45) Figure 2.6 Mill Showing Cane Extraction (Rolph, 143) Figure 2.7 Char Filter Process (Author) Figure 2.8 Char Filter Drawing Process (Hook, 243) Figure 2.9 Process Schematics (Author) Figure 2.10 First Floor Char House (Author) Figure 2.11 Second Floor Char House (Author) Figure 2.12 Third Floor Char House (Author) Figure 2.13 Fourth Floor Char House (Author) Figure 2.14 Fifth Floor Char House (Author) Figure 2.15 Sixth Floor Char House (Author) Figure 2.16 Seventh Floor Char House (Author) Figure 2.17 Eight Floor Char House (Author) Figure 2.18 Concept Diagram (Author) Figure 2.19 Concept Diagram (Author) Figure 2.20 Concept Diagram (Author) Figure 2.21 Concept Diagram (Author) Figure 2.22 Concept Diagram (Author) Figure 2.23 Concept Diagram (Author) Figure 2.24 Concept Diagram (Author) Figure 2.25 Concept Diagram (Author) Figure 2.26 Concept Diagram (Author) Figure 2.27 Concept Diagram (Author)
Figure 2.28 Relationship Diagram (Author) Figure 2.29 Relationship Diagram (Author) Figure 2.30 Relationship Diagram (Author) Figure 2.31 Relationship Diagram (Author) Figure 2.32 Relationship Diagram (Author) Figure 2.33 Relationship Diagram (Author) Figure 2.34 Relationship Diagram (Author) Figure 2.35 Relationship Diagram (Author) Figure 2.36 Relationship Diagram (Author) Figure 2.37 Relationship Diagram (Author) Figure 2.38 Mass MOCA Perspective (Strong, 34) Figure 2.39 Mass MOCA Interior (Strong, 34) Figure 2.40 Mass MOCA Section (Strong, 34) Figure 2.41 Lone Star Brewery (Strong, 45) Figure 2.42 Lone Stare Brewery Interior (Strong, 45) Figure 2.43 Mill City Museum (Strong, 66) Figure 2.44 Mill City Museum (Strong, 66) Figure 2.45 Mill City Museum (Strong, 66)
P 126
Works Cited [FACILITY]
Strong, L A G. The Story of Sugar. London: Chiswick Press, 1954. Rolph, George M. Something About Sugar: Its History, Growth, Manufacture. San Francisco: Taylor, 1917. Aykroyd, W R. The Story of Sugar. Chicago: Quadragle Books, 1967. Strong, L A G. The Story of Sugar. London: Chiswick Press, 1954. Hook, Andrew Van. Sugar: Its Production, Technology, and Uses. New York: The Ronald Press Company, 1949.

P 127
Spatial Summery Public Space [sq ft] (Users) Lobby 1,000 (150)
Auditorium 1,000 (125) Audio/Visual 150 (2) Café 1,300 (100) Kitchen 1,000 (3) Black Box Theater 2,000 (200) Roof Garden 2,000 (20)
Exhibition [sq ft] (Users) 2D (High Volume) 8,000 (533) 3D (Low Volume) 4,000 (570) Storage 1,000 (3) Service [sq ft] (Users) Office 500 (5) Restroom (male) 360 (10) Restroom (female) 450 (15) Janitorial 200 (2) Water Collection 500 (1) Fire Protection 75 (1)
[sq ft] Total Net 21,510 [60/40 Ratio] Circulation 22% 6,625 Mechanical 7.5% 2,259 Wall/Structure 8% 2,410 Bathrooms 1.5% 452 Service 1% 302 Total [40%] 8,604 Total Gross 30,114 [sq ft] (Users) Parking 2,500 (225 Existing Spaces) Loading Dock 250 (3) Target Number of Users: 525 Max: 700
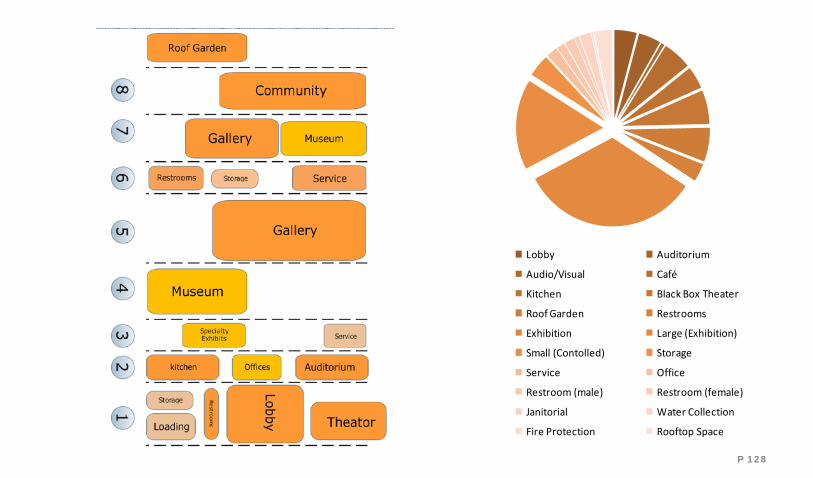
P 128
Lobby Auditorium
Audio/Visual Café
Kitchen Black Box Theater
Roof Garden Restrooms
Exhibition Large (Exhibition)
Small (Contolled) Storage
Service Office
Restroom (male) Restroom (female)
Janitorial Water Collection
Fire Protection Rooftop Space

P 129
CO
NTEX
T

P 130
The Spanish Tejas
In 1519, Alonso Alvarez de Pineda of Spain was
the first to map the Texas coast. After this initial
mapping the first main exploration was by Cabeza
de Vaca in 1528. After only a few years more
than ninety Spanish and French explorers had
established over twenty five missions and forts in
the Texas coastal area. In 1718 the Spanish built
the fort of San Antonio de Bexar and by 1772 San
Antonio was serving as the seat of the Spanish
government. It was in February of 1822 when
the first of Stephen F Austin’s colonist arrived.
The original colonist, called the Old Three Hun-
dred, mistook the Brazos River for the Colorado
River and set up a makeshift camp, which they
named Fort on the Bend. This would be the origi-
nation of Fort Bend County Texas, located on a
bend in the Brazos River. Stephen F Austin nego-
tiated a revised colonization act with the newly
independent Mexican government in 1823. Each
family would be granted a league, which is 4,428
acres, for ranching and a labor, which is 177
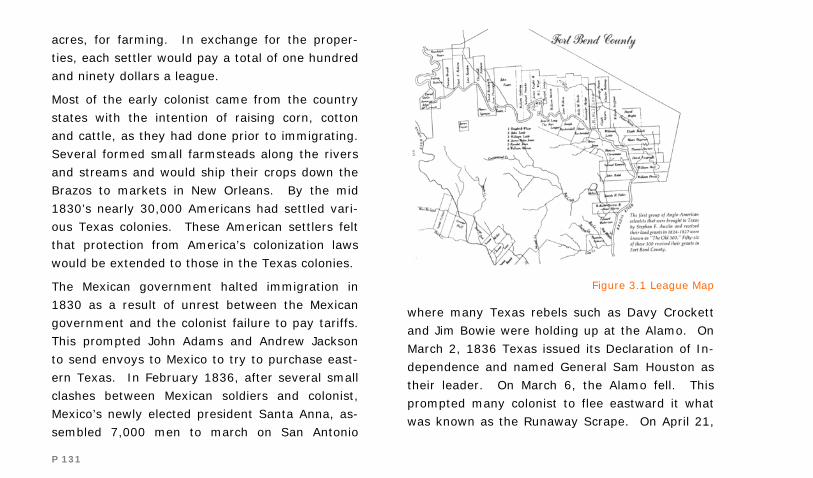
P 131
acres, for farming. In exchange for the proper-
ties, each settler would pay a total of one hundred
and ninety dollars a league.
Most of the early colonist came from the country
states with the intention of raising corn, cotton
and cattle, as they had done prior to immigrating.
Several formed small farmsteads along the rivers
and streams and would ship their crops down the
Brazos to markets in New Orleans. By the mid
1830’s nearly 30,000 Americans had settled vari-
ous Texas colonies. These American settlers felt
that protection from America’s colonization laws
would be extended to those in the Texas colonies.
The Mexican government halted immigration in
1830 as a result of unrest between the Mexican
government and the colonist failure to pay tariffs.
This prompted John Adams and Andrew Jackson
to send envoys to Mexico to try to purchase east-
ern Texas. In February 1836, after several small
clashes between Mexican soldiers and colonist,
Mexico’s newly elected president Santa Anna, as-
sembled 7,000 men to march on San Antonio
where many Texas rebels such as Davy Crockett
and Jim Bowie were holding up at the Alamo. On
March 2, 1836 Texas issued its Declaration of In-
dependence and named General Sam Houston as
their leader. On March 6, the Alamo fell. This
prompted many colonist to flee eastward it what
was known as the Runaway Scrape. On April 21,
Figure 3.1 League Map
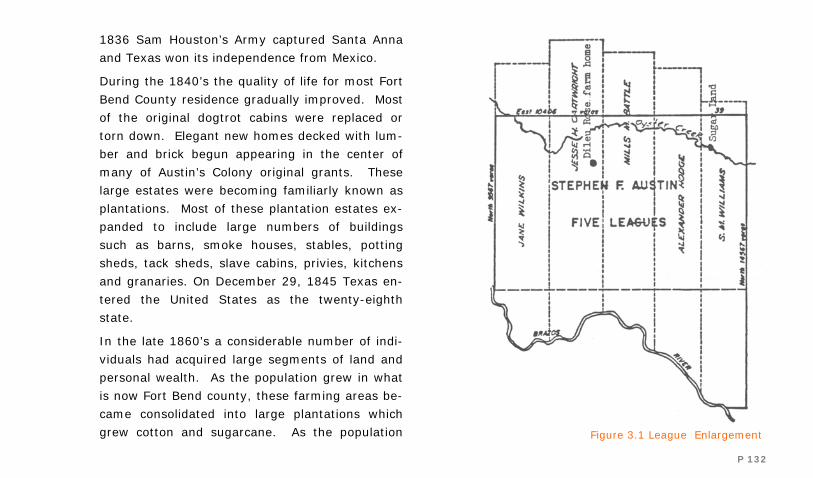
P 132
1836 Sam Houston’s Army captured Santa Anna
and Texas won its independence from Mexico.
During the 1840’s the quality of life for most Fort
Bend County residence gradually improved. Most
of the original dogtrot cabins were replaced or
torn down. Elegant new homes decked with lum-
ber and brick begun appearing in the center of
many of Austin’s Colony original grants. These
large estates were becoming familiarly known as
plantations. Most of these plantation estates ex-
panded to include large numbers of buildings
such as barns, smoke houses, stables, potting
sheds, tack sheds, slave cabins, privies, kitchens
and granaries. On December 29, 1845 Texas en-
tered the United States as the twenty-eighth
state.
In the late 1860’s a considerable number of indi-
viduals had acquired large segments of land and
personal wealth. As the population grew in what
is now Fort Bend county, these farming areas be-
came consolidated into large plantations which
grew cotton and sugarcane. As the population Figure 3.1 League Enlargement

P 133
further increased Fort Bend, Matagorda, and
Wharton counties became known as the Sugar
Bowl of Texas. These large plantations will even-
tually become combined to form the Imperial
Sugar Factory and eventually the town of Sugar
Land Texas.
The Birth of the Imperial Sugar Company
The Imperial Sugar Company is the oldest existing
business in the state of Texas. While officially
consolidated as a private company in 1905, it has
operated on the same site since 1843. It predates
the founding of the City of Sugar Land, Fort Bend
County and was in operation before Texas was
admitted into the United States.
The history of the company begins in the 1840’s
when Samuel May Williams became the owner of
the Oakland Plantation. Samuel May Williams
served as secretary to Stephen F Austin and was
provided a league of land on April 11, 1828. He
found several different species of oak trees on the
4,428 acre parcel of land, which resulted in him
naming it the Oakland Plantation. Williams was
the first to plant sugar cane in 1840 and by 1843
the Oakland Plantation was successfully growing
sugarcane. The Williams sugar crop and the sur-
rounding area produced enough to justify the
building of a commercial raw sugar mill on the
property. In 1845 a crude horse powered sugar
mill was constructed on a bend in Oyster Creek.
The original building was nothing more than a
simple shed housing large cast iron kettles and
fire grates. The processed sugar was shipped
down the Brazos River to the Galveston market.
In 1853 W J Kyle and Benjamin Terry bought the
S M Williams Plantation and named the property
Sugar Land. Terry and Kyle would oversee the
construction of the thirty-five mile Buffalo Bayou
Brazos and Colorado railway from Harrisburg to
Richmond, which was the first railway built in
Texas. The railroad was originally to run from
Stafford to Richmond but Terry and Kyle lured it
to run though Sugar Land by giving land for the
right away, creating a bend in the line which still
exist today. The railroad put Sugar Land on the
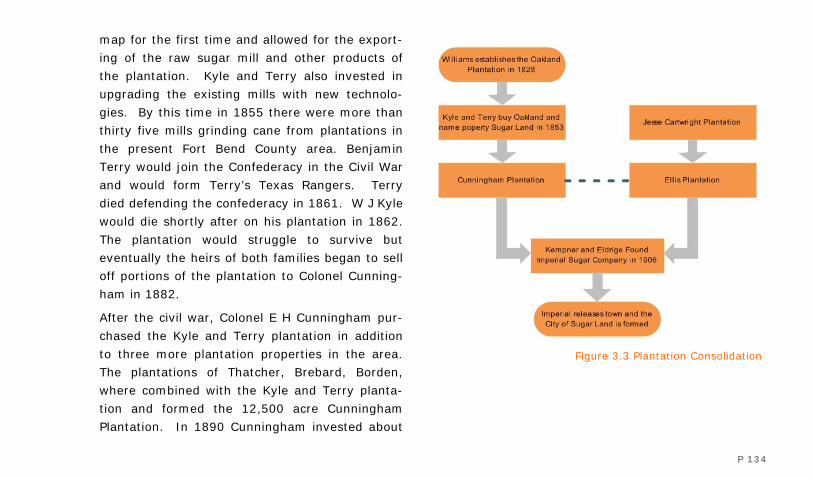
P 134
map for the first time and allowed for the export-
ing of the raw sugar mill and other products of
the plantation. Kyle and Terry also invested in
upgrading the existing mills with new technolo-
gies. By this time in 1855 there were more than
thirty five mills grinding cane from plantations in
the present Fort Bend County area. Benjamin
Terry would join the Confederacy in the Civil War
and would form Terry’s Texas Rangers. Terry
died defending the confederacy in 1861. W J Kyle
would die shortly after on his plantation in 1862.
The plantation would struggle to survive but
eventually the heirs of both families began to sell
off portions of the plantation to Colonel Cunning-
ham in 1882.
After the civil war, Colonel E H Cunningham pur-
chased the Kyle and Terry plantation in addition
to three more plantation properties in the area.
The plantations of Thatcher, Brebard, Borden,
where combined with the Kyle and Terry planta-
tion and formed the 12,500 acre Cunningham
Plantation. In 1890 Cunningham invested about
Figure 3.3 Plantation Consolidation

P 135
one million dollars to build a paper mill, new build-
ings, homes for his workers, as well as add new
machinery to the sugar refinery, which he hoped
would become the finest in the southern states.
He installed a large pumping station on the Brazos
River to pump water into Oyster Creek, which
served as a means of adequate cooling water for
the sugar mill year round.
In 1879 Cunningham leased convicts for five years
from the State of Texas to help cultivate the local
sugar cane crops. He entered in a partnership
with Littleberry Ambrose Ellis, owner of the nearby
sugar mill, to start convict farming. In addition to
the convict labor, they would also extended the
partnership to join their properties. Since the
Cunningham property could not process all of the
sugar available, they built a new 600 ton raw
sugar mill in 1883 on the Ellis property and named
the mill the Imperial mill. This would prove suc-
cessful at first, but the contract would be dis-
solved with Ellis retaining the new mill and Cun-
ningham his original 12,500 which included the
town of Sugar Land. Convict labor was stopped
for sugar refining in 1914 and parts of the Ellis
Plantation property were sold to state of Texas,
which is still operated as a prison farm today.
The availability of the Ellis and Cunningham mills
caused many local farmers to increase their crops
and send the cane to the area. Cunningham was
determined to be the largest and most modern
sugar refinery in the state and started to invest
heavily in creating the most modern mill in the
south. In 1896 Cunningham constructed a cane
sugar refinery in Sugar Land which was to manu-
facture 100 000 pounds of sugar a day. The refin-
ery was built next to the Cunningham Raw Sugar
Mill, some fifty yards north of the Galveston Har-
risburg and San Antonio railroad tracks. This lo-
cation put it squarely on top of the foundations of
parts of the old Williams raw sugar mill built in
1843. In 1899 Cunningham would complete a
new boiling house which stood three stories high
and was a 100 ft wide by 150 ft long. However, it
was destroyed by fire December 30, 1899 and
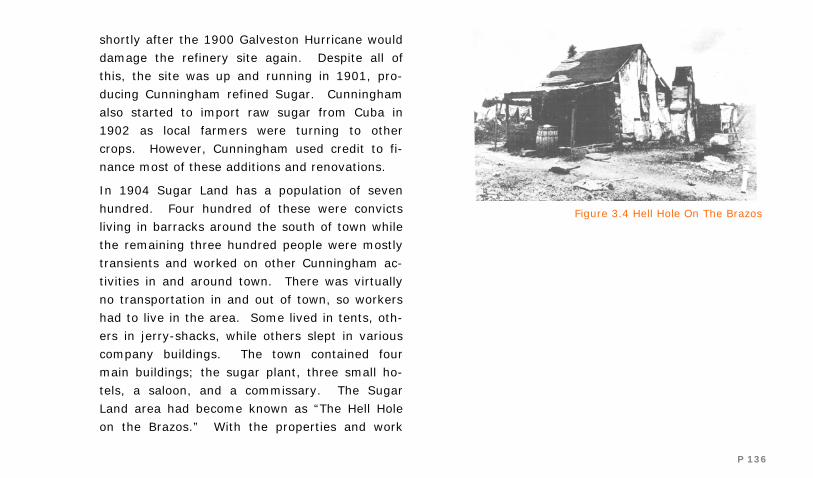
P 136
shortly after the 1900 Galveston Hurricane would
damage the refinery site again. Despite all of
this, the site was up and running in 1901, pro-
ducing Cunningham refined Sugar. Cunningham
also started to import raw sugar from Cuba in
1902 as local farmers were turning to other
crops. However, Cunningham used credit to fi-
nance most of these additions and renovations.
In 1904 Sugar Land has a population of seven
hundred. Four hundred of these were convicts
living in barracks around the south of town while
the remaining three hundred people were mostly
transients and worked on other Cunningham ac-
tivities in and around town. There was virtually
no transportation in and out of town, so workers
had to live in the area. Some lived in tents, oth-
ers in jerry-shacks, while others slept in various
company buildings. The town contained four
main buildings; the sugar plant, three small ho-
tels, a saloon, and a commissary. The Sugar
Land area had become known as “The Hell Hole
on the Brazos.” With the properties and work
Figure 3.4 Hell Hole On The Brazos
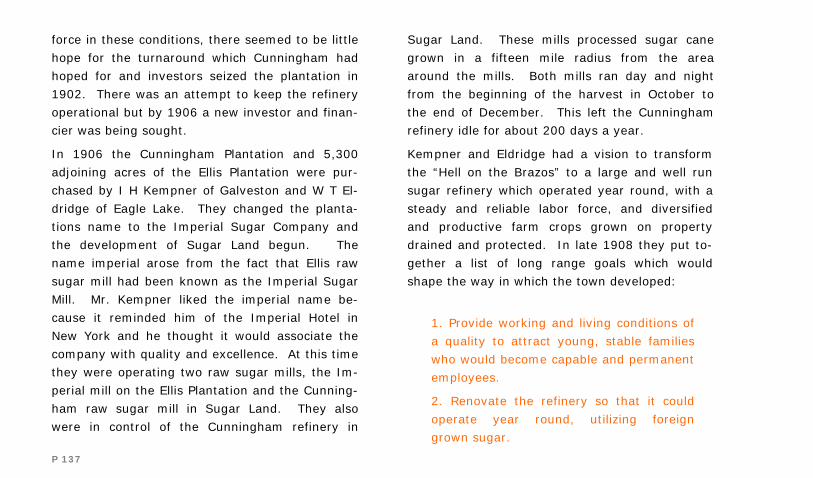
P 137
force in these conditions, there seemed to be little
hope for the turnaround which Cunningham had
hoped for and investors seized the plantation in
1902. There was an attempt to keep the refinery
operational but by 1906 a new investor and finan-
cier was being sought.
In 1906 the Cunningham Plantation and 5,300
adjoining acres of the Ellis Plantation were pur-
chased by I H Kempner of Galveston and W T El-
dridge of Eagle Lake. They changed the planta-
tions name to the Imperial Sugar Company and
the development of Sugar Land begun. The
name imperial arose from the fact that Ellis raw
sugar mill had been known as the Imperial Sugar
Mill. Mr. Kempner liked the imperial name be-
cause it reminded him of the Imperial Hotel in
New York and he thought it would associate the
company with quality and excellence. At this time
they were operating two raw sugar mills, the Im-
perial mill on the Ellis Plantation and the Cunning-
ham raw sugar mill in Sugar Land. They also
were in control of the Cunningham refinery in
Sugar Land. These mills processed sugar cane
grown in a fifteen mile radius from the area
around the mills. Both mills ran day and night
from the beginning of the harvest in October to
the end of December. This left the Cunningham
refinery idle for about 200 days a year.
Kempner and Eldridge had a vision to transform
the “Hell on the Brazos” to a large and well run
sugar refinery which operated year round, with a
steady and reliable labor force, and diversified
and productive farm crops grown on property
drained and protected. In late 1908 they put to-
gether a list of long range goals which would
shape the way in which the town developed:
1. Provide working and living conditions of
a quality to attract young, stable families
who would become capable and permanent
employees.
2. Renovate the refinery so that it could
operate year round, utilizing foreign
grown sugar.
P 138
3. Drain and level the farm and grazing
lands and provide a system of levees to
protect lands against flooding, enable irri-
gation of crops, and provide lakes for stor-
age of water near the refinery.
4. Attract sufficient farming and industrial
activities to Sugar Land to further diversify
the income of the community.
The Company Town
To attract dependable, family type workers,
Kempner and Eldridge set first priority to the fi-
nancing and constructing of the town and its fa-
cilities in order to bring in and keep a work force
of permanent employees. Eldridge had experi-
ence managing company towns and quickly com-
piled the resources needed to revive the towns
infrastructure. The company town primarily at-
tracted a stable population of Germans and
Czechs from central Texas. In 1908 the company
opened the Imperial State Bank, added a paper
P 139
mill, feed mill, a cotton gin and various retail
stores. The town filled as fast as new houses
could be built. The first major expansion of com-
pany house were the east side of Oyster Creek,
across the river from the refinery. The company
houses were maintained by company employees.
The occupants of the homes were encouraged to
plant trees, shrubs, and flowers to beautify their
properties. As the town grew, new stores and
services would open up, all governed and owned
by the Imperial Mercantile Company.
Although the first priority of the partnership was
the homes, stores, and town site, Eldridge and
Kempner proceeded to improve the farm lands
and the refinery as soon as the labor became
available. The most obvious problem was the
flooding of the Brazos River, which in 1913 came
all the way to Sugar Land. Kempner and Eldridge
set about a plan of building levees and dams as
well as leveling the land along Oyster Creek and
also created new lakes to hold water for both the
refinery and irrigation. Work started in 1913 and
was finished by 1929. By 1917 there were 400
houses completed and a population of 1,200 in-
cluding tenant farmers and the town was as self-
sufficient as it could be.
While the town infrastructure was being success-
fully constructed, Kempner and Eldridge set about
updating the mills and refinery. Unfortunately,
under Cunningham, the cleaning and maintenance
work which should have been done after the mills
and the refinery were finished processing the
crops had been inadequate for years. The build-
ings were on solid concrete foundations and the
heavy timber construction was in good condition,
as well as the outside of the corrugated iron build-
ings, but the equipment and machinery were
badly run down. In 1908 Eldridge hired a number
of experienced and capable sugar technologies,
mechanics, managers, and foremen, mostly from
the Louisiana mills and refiners. While the early
group brought to Sugar Land had been German,
these technicians were most French. By 1910
they were able to operate the refinery ten and a

P 140
half months. In 1907 the capacity of the town
had been 500,000 pounds per day. By 1910 they
had increased this to 750,000 pounds, with most
of the sugar cane coming from Cuba. In 1911,
the refinery, which was still under the Cunning-
ham name, was leased to the Imperial Sugar
Company for a period of ten years. The brand
name was changed to Imperial, and the logo con-
tained the royal crown, similar to the one which
Mr. Kempner had seen on the stationary of the
Imperial Hotel in New York. During the grinding
season of 1914, the Imperial raw sugar mill on
the old Ellis Plantation burned to the ground and
was never replaced.
Since about 1910, with the impending removal of
cheap convict labor and the infestation of sugar
crops, the production of raw sugar in the United
States started to quickly decline. For years the
federal government had repeatedly placed and
repealed tariffs on imported raw sugar, which
started to force United States growers to compete
with cheaper off-shore sugar growers. Other
Figure 3.5 Downtown Sugar Land 1910
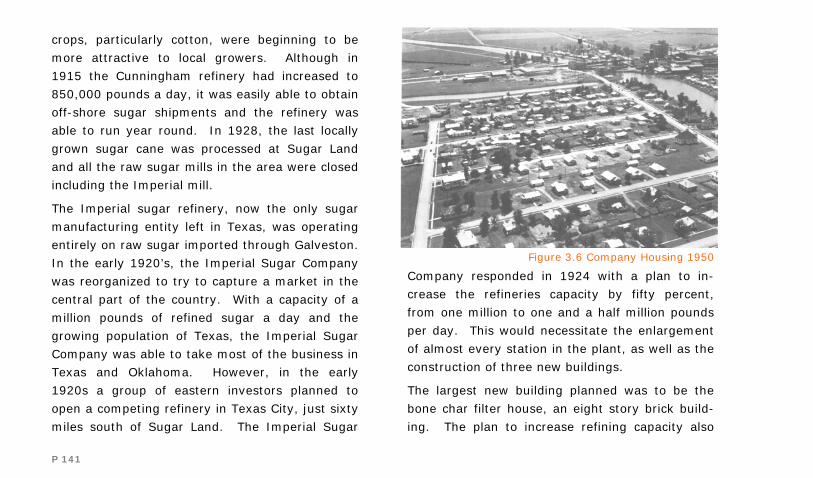
P 141
crops, particularly cotton, were beginning to be
more attractive to local growers. Although in
1915 the Cunningham refinery had increased to
850,000 pounds a day, it was easily able to obtain
off-shore sugar shipments and the refinery was
able to run year round. In 1928, the last locally
grown sugar cane was processed at Sugar Land
and all the raw sugar mills in the area were closed
including the Imperial mill.
The Imperial sugar refinery, now the only sugar
manufacturing entity left in Texas, was operating
entirely on raw sugar imported through Galveston.
In the early 1920’s, the Imperial Sugar Company
was reorganized to try to capture a market in the
central part of the country. With a capacity of a
million pounds of refined sugar a day and the
growing population of Texas, the Imperial Sugar
Company was able to take most of the business in
Texas and Oklahoma. However, in the early
1920s a group of eastern investors planned to
open a competing refinery in Texas City, just sixty
miles south of Sugar Land. The Imperial Sugar
Company responded in 1924 with a plan to in-
crease the refineries capacity by fifty percent,
from one million to one and a half million pounds
per day. This would necessitate the enlargement
of almost every station in the plant, as well as the
construction of three new buildings.
The largest new building planned was to be the
bone char filter house, an eight story brick build-
ing. The plan to increase refining capacity also
Figure 3.6 Company Housing 1950
P 142
required a large, fireproof, brick warehouse for
storing refined sugar, and a new five story build-
ing for additional boiling pans. These improve-
ments would cost an estimated 1.5 million dollars
and be implemented over three years. By the
end of 1924, the company had completed the
75,000 square foot refined sugar warehouse. The
warehouse could hold up to seven days of output,
which allowed for great flexibility in both produc-
tion and marketing. In 1926 the company com-
pleted work on the new char house, which is a
large filtration plant that removes colors and im-
purities from raw sugar. The new char house re-
placed an older and less efficient unit built by
Cunningham in 1900. The new building was an
eight story steel and brick construction containing
thirty-two vertical cylindrical cast iron tanks, each
larger than a railroad tank car. These cylinders
are filled with bone char. The sugar liquid is then
introduced through the filters until it runs clear,
then it is sent to the pan house. The lower floors
contained furnaces to revitalize the bone char.
P 143
This process would provide a much higher quality
of refined sugar and reduce cost, as well as in-
crease the refineries production level by fifty per-
cent. The char house would be the largest build-
ing built in Fort Bend County for the next fifty
years and is a landmark which can be seen from
miles away. It was in continuous operation, com-
peting with modern refineries, until the refineries
closed in 2002. The char house ran with an out-
put of four million pounds a day. It cost around a
million dollars in 1926 and represented the faith
and determination which Kempner and Eldridge
had in the future of the company.
In 1925 the Texas Sugar Refinery opened in Texas
City. The refinery was plagued by problems and
only had a capacity of 1,300,000 of bone char,
compared with the planned 1,500,000 pounds of
the Imperial Sugar Refinery. The Texas Sugar
Refinery was able to load the raw sugar directly
into the factory, which gave it cost advantage
over Imperial. However, the factory was not well
designed and had a terrible problem with its fresh
water supply. The factory was closed several
times to try to reorganize, but was out of business
by 1935.
In the 1930’s an important change in the packag-
ing and marketing of refined sugar took place.
Historically, refined sugar was packaged at the
refinery in barrels, then transferred to one hun-
dred pound cotton bags for shipment in carloads
to wholesalers. The wholesalers then delivered
the bags to retail grocers. The retail grocer then
dumped the sugar into a large barrel and meas-
ured out the amount the consumer wished to buy.
As retail stores became larger, this method proved
impractical. In 1926, Imperial responded and be-
gin packing sugar at the refinery in two, five, ten,
twenty-five, fifty and one hundred pound cotton
bags. Each of these bags had the Imperial logo
and for the first time brand selling of sugar to the
consumer occurred.
In 1927, Imperial completed the major parts of its
expansion plan with the construction of an addi-
tional pan house for boiling sugar syrups. This
P 144
was a five story steel and concrete structure and
cost $250,000. In addition to the increased out-
put of 1,500,000 pounds per day, it was an im-
portant contributor to the program of cost reduc-
tion. Also a two lane paved road replaced the old
gravel, crushed shell and mud roads between
Sugar Land, Houston, and Richmond. This dimin-
ished the isolation of Sugar Land and many busi-
nesses which had been necessary in a self-
sufficient community were no longer needed and
many began to leave in the early 1930’s.
During the depression years the Imperial Sugar
company suffered several setbacks. A venture to
convert the old Sealy Mattress Company plant
into a fig-processing facility failed and cost the
company two million dollars, which almost put the
company out of business. In 1932 the problems
being created by the depression were beginning
to show and sugar consumption was declining.
The company was unable to secure credit for raw
sugar purchases to avoid shut downs at the plant.
There were many three day work weeks and oc-
P 145
casionally the refinery would sit idle for as long as
two weeks. However, with all of these difficult
times, the Kempner family was determined to
keep the Imperial Sugar Company operating at a
level which would keep the town functioning.
During these difficult years, there was an attempt
to create more jobs by brining in outside business.
In 1930 the company made land available for a
building to house Visco Products Company. A lo-
cal chemist in the Imperial Sugar laboratory had,
along with two other chemist, patented a process
to use sodium aluminate in the manufacturing of
oil well drilling mud and proposed to set up a
manufacturing plant in Sugar Land. The company
was acquired by Nalco Corporation in 1956 and
today employs 460 people on forty acres next to
the Sugar Refinery. In 1936 the company per-
suaded the Marshall Canning Company of Mar-
shalltwon, Iowa, to move one of its food process-
ing plants to Sugar Land. This plant processed
fuits, meats, and vegetables, and was attracted
by the opportunity of contracting with locally
grown produce, the availability of the Texas Fig
Plant facilities, formally the Sealy Mattress Com-
pany, and access by rail to and truck to the south-
west market.
The 1930’s had seen a marked increase of the
influence of the United States government on the
sugar industry, with the passage of the Jones
Constigan Amendment to the Agricultural Adjust-
ment Act in 1934. This would be the beginning of
legislation and controls from Washington which
would impact the United States sugar industry
until the present. Planned to protect the income
of domestic beet and cane growers, ensuing legis-
lation using such tactics as tariffs, acreage con-
trols, and price flooring would complicate the op-
eration of cane sugar refineries and eventually
lead to the closing of several in the 1980’s.
When World War II started in September 1939, a
massive increase in speculation occurred in the
sugar market due to the war. As the war intensi-
fied and spread into the pacific in 1941, the beet
sugar fields in Europe were being destroyed as
P 146
well as the cane sugar fields in the pacific and
German submarines were beginning to threaten
ocean traffic in the Atlantic. In early 1942, the
marketing and importing quotas of raw sugar
cane under the Sugar Act were suspended. For
the first time the rationing of sugar on the na-
tional level occurred and was run by the Office of
Price Administration and Department of Agricul-
ture and would impact every person in the United
States from the wholesaler to retailer, industrial
user, hotel, restraint, and any institution using or
dealing with sugar.
One wartime regulation which particularly im-
pacted the refinery was the “zoning” restrictions
placed on sugar refineries in the United States.
This zoning restrictions resulted from the wartime
shortage of rail cars. The government considered
closing all but the major sugar refineries in the
country, with the Imperial Refinery to be closed.
However, a new plan of zoning regulations di-
vided the country into larger zones, with Imperial
being the exclusive supplier to Texas. This result
P 147
was that for five years, from 1942 to 1947, Impe-
rial sugar was the only sugar on the shelves of
every grocery store in Texas and Oklahoma and
would have far reaching effects on Imperial’s post
-war marketing and success.
The year 1942 also marked another significant
change in the way sugar was packaged, as the
industry changed from cotton bags to paper. Al-
though subject to more breaking during handling
and shipping, paper bags lent themselves to high-
speed mechanical filling and sealing and solved
many of the problems during wartime shortage of
labor. Paper was less expensive and cotton was
in high demand because of the war, so the transi-
tion was fairly rapid.
The short work weeks of the 1930’s were replaced
by twelve to sixteen hour days and the sugar re-
finery would run for six consecutive weeks, seven
days a week, until a maintenance shutdown was
required. Even while being rationed, America
would need to become the sugar bowl for many
allied countries. The eleven million men and
women it the armed forces consumed more sugar
than they had as civilians and civilians back home
consumed their entire ration of sugar, even if it
was more than they usually consumed. It was
fortunate that an adequate supply of raw sugar
existed in Cuba as well as enough vessels in the
Caribbean to deliver it to the United States.
Maintenance of the refinery buildings and equip-
ment became a very serious problem during the
war. Running twenty-four hours a day, seven
days a week, for as much at six weeks, mainte-
nance took place usually only in emergency situa-
tions. Machinery and parts, copper and steel,
rubber and leather, even concrete and lumber
could only be priority issued by the government
and as a result many sugar refineries were badly
in need of rebuilding in the late 1940’s. When the
war was over, many veterans returned to Sugar
Land and life began to return to its prewar state.
In 1945 Kempner became the sole owner of the
Imperial Sugar Company.
P 148
The City of Sugar Land
Physically, the old company town had remained
unchanged since 1925 and the population was
just over 2,000. However, prior to the end of the
war, there had been plans to completely overhaul
the refining properties and the plans for new ma-
terials had been filed before the closing of the
war so that the most critical requirements could
be delivered as quickly as possible. The rebuild-
ing was complicated by the fact that a train load
of raw sugar arrived at the refinery daily from
Galveston and 2.5 million pounds of refined sugar
was being shipped to customers daily. The mod-
ernization of the facility had to be done in such
way as not to interrupt the refinery, which was
running sixteen hours days from five to seven
days a week. This would require that some of the
processes would have to be rerouted around new
constructions and then incorporated into the new
buildings. This program of bypassing, tearing
down, and rebuilding continued for six years. The
regulatory zoning was lifted in 1947 and

P 149
competition returned in Texas. However, with the
current advertising campaign and the sole distrib-
uting of Imperial Sugar during the war, the com-
pany was able to maintain 90% of the market.
In 1950 Sugar Land was still a sleepy little com-
pany town, centering around the Imperial Sugar
refinery which dominated the flat coastal land-
scape. In 1950 sugar sales exceeded five million
hundredweight for the first time and the refineries
capacity had been increased to 2.8 million pounds
per day. The plant was operating sixteen-hours
per day on eight two-hour shifts and employed
420 people, almost all living in Sugar Land. Im-
perial’s sales had increased past the capacity of
the refinery and overtime operations was costly.
The solution was to run the refinery on three eight
hour shifts daily. However, this would necessitate
the hiring of an additional one hundred workers to
work the additional third shift. The program of
modernizing the refinery on such a scale made it
impractical for the addition of company homes.
Herbert Kempner’s solution was, for the first time,
to make available property in the town for em-
ployees to build homes. Sites were offered to em-
ployees who could start immediately on the con-
struction of their new homes. Prices for the sties
were low, from $500 to $2,500 per lot, with added
incentives that twenty-five percent of the cost of
the lot would be refunded to all employees who
could move out of their company houses in their
new homes by December 31, 1950. This sparked
a massive housing boom and by the end of the
year the company was able to offer the vacated
houses to enough new employees to work the
third shift. Imperial had no trouble finding new
workers because the rental rates of these homes
were low and they were maintained in excellent
shape.
In 1950, attention was turned to modernizing the
office and retail spaces the company owned. The
general store and various other retail establish-
ments had been located on the north side of High-
way 90-A in two and three story corrugated iron
buildings. In December 1952 a new modern of-
P 150
fice and shopping center was built on the south
side the highway. Of the five hundred company
homes owned at the time, two hundred were sub-
standard dwellings, mostly located on the north
side of the factory grounds called the quarters.
The old one bedroom houses were torn down and
new modern two and three bedroom houses were
built. These houses were then offered to employ-
ees at attractive rates. Next, Sugar Land Indus-
tries dredged out a system of lakes and water-
ways and sold three hundred waterfront proper-
ties. Located just south of Highway 90-A, the
development was named Venetian Estates. The
company also opened a thousand acres industrial
office park and light commercial area.
By the mid 1950’s the Southwest Freeway was
approaching from Houston. Houston was one of
the countries fastest growing cities and the city
limits were pushing closer and closer to Sugar
Land. By then it was becoming completely im-
practical for the companies to extend the type of
subsidized city services to employees as well as

P 151
citizens who had no connection with the company.
There was an expanding need for more police and
fire protection as well as other services such as
garbage collection. In 1958 the Imperial Sugar
Companies and Sugar Land Industries joined in
petitioning the state for a city charter. The com-
panies then began to ready the city to be turned
over to the public.
In 1959 the city was officially granted it charter.
Transition from a company town to a city charter
posed a number of problems, but the Imperial
Sugar Company and Sugar Land Industries, with
the Mayor and City Council, worked closely to
make the transition as smooth as possible. The
newly incorporated city of Sugar Land had no
money and the Imperial Sugar Company ad-
vanced funds until the first tax revenue was col-
lected. All of the cities and roads the company
owned were dedicated to the city and revenue
bonds were issued to buy the companies water
and sewer system. The city gradually took control
of other company services, such as garbage col-
lection and fire and police protection. By the mid
1960’s the city of Sugar Land had the foundation
in place to become the vibrant modern day city
that it is.

P 152

P 153
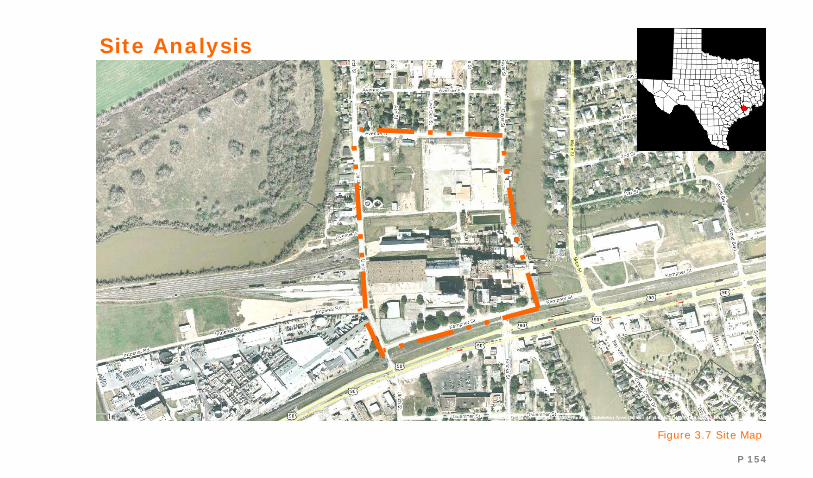
P 154
Site Analysis
Figure 3.7 Site Map
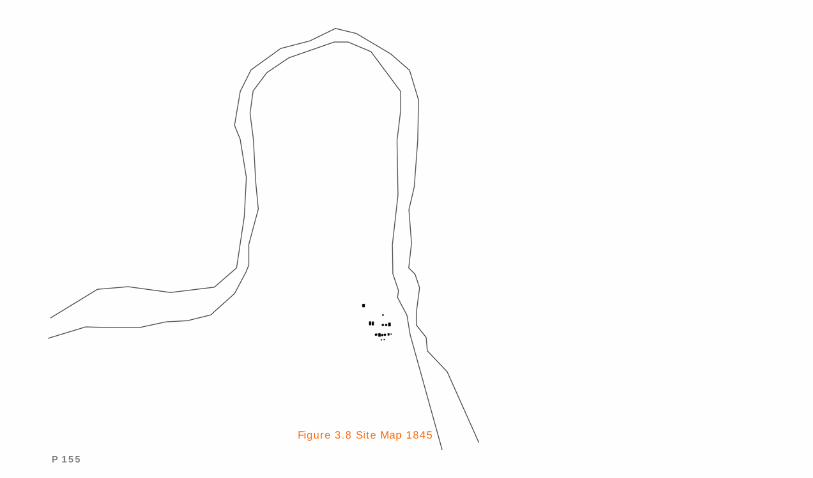
P 155
Figure 3.8 Site Map 1845
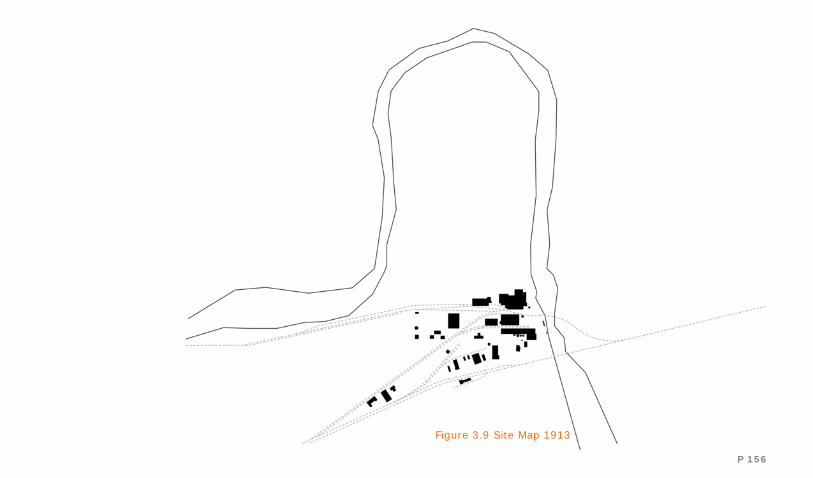
P 156
Figure 3.9 Site Map 1913
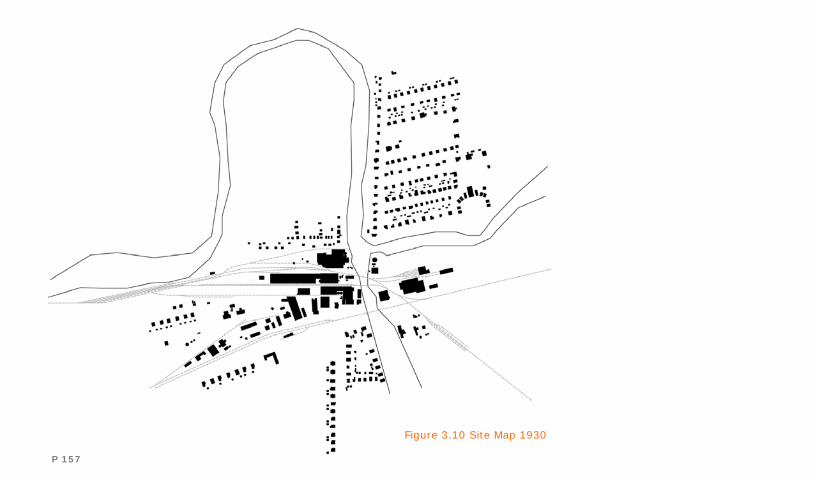
P 157
Figure 3.10 Site Map 1930
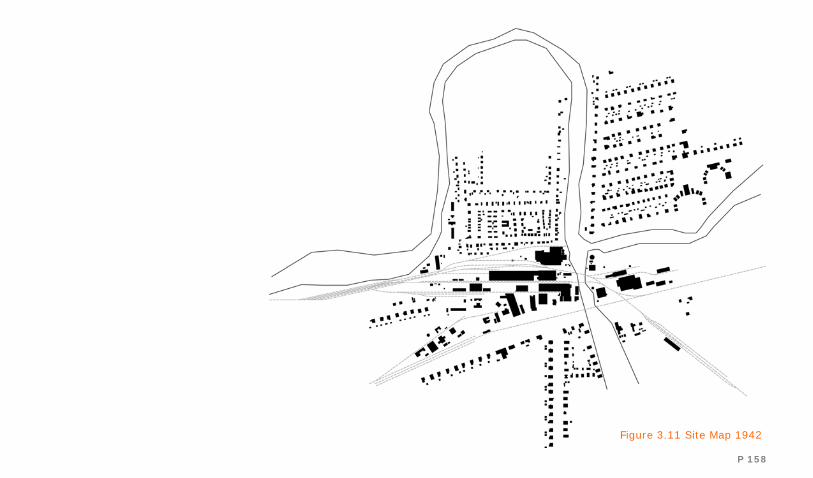
P 158
Figure 3.11 Site Map 1942
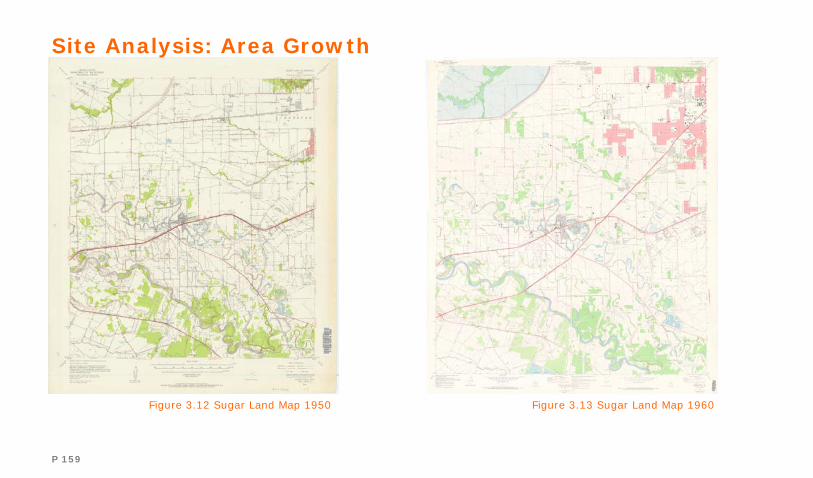
P 159
Site Analysis: Area Growth
Figure 3.12 Sugar Land Map 1950 Figure 3.13 Sugar Land Map 1960
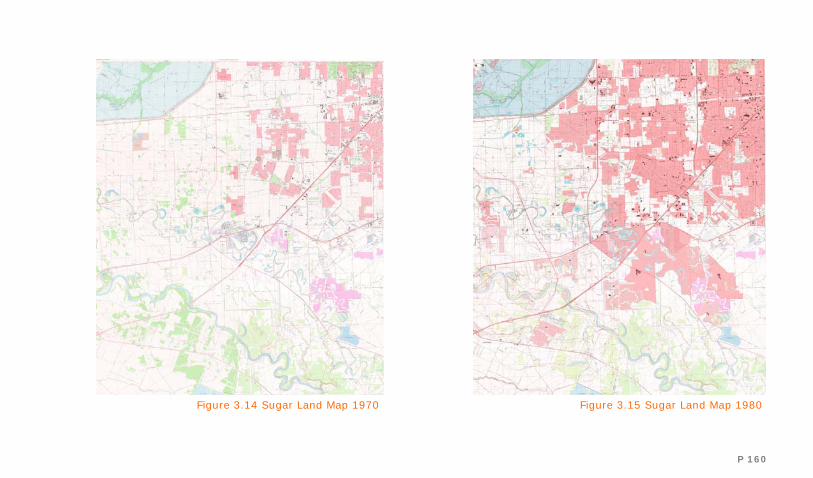
P 160
Figure 3.14 Sugar Land Map 1970 Figure 3.15 Sugar Land Map 1980
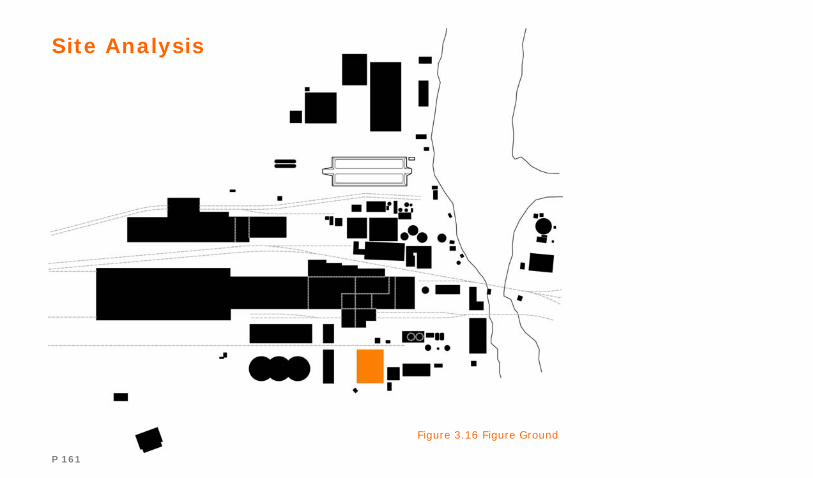
P 161
Figure 3.16 Figure Ground
Site Analysis
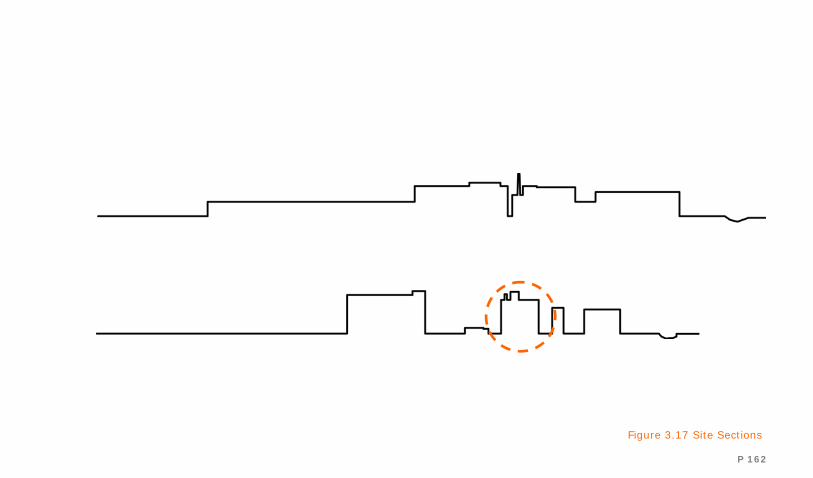
P 162
Figure 3.17 Site Sections
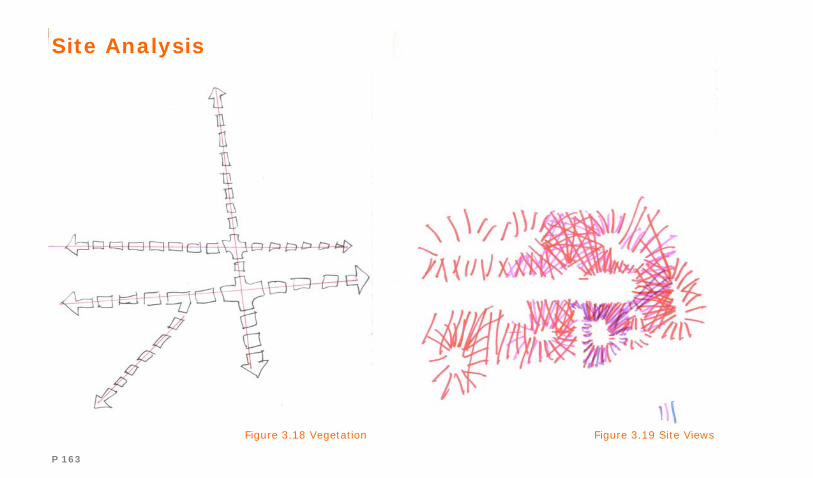
P 163
Site Analysis
Figure 3.18 Vegetation Figure 3.19 Site Views

P 164
Figure 3.20 Movement Figure 3.21 Drainage
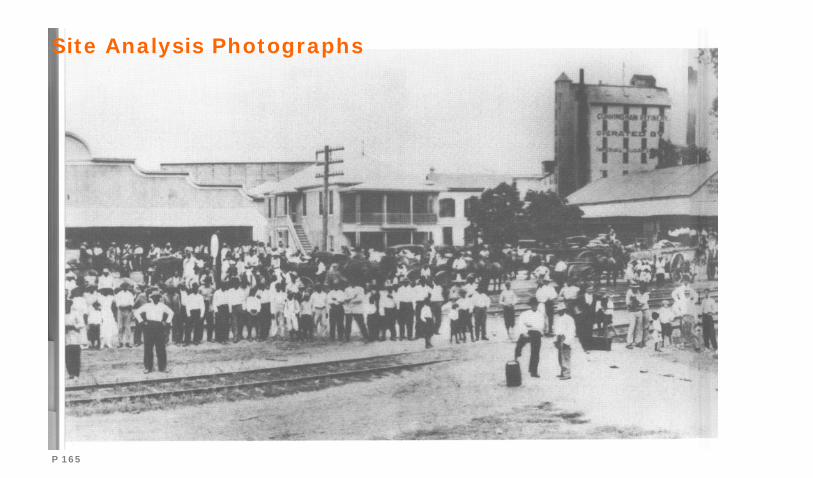
P 165
Site Analysis Photographs
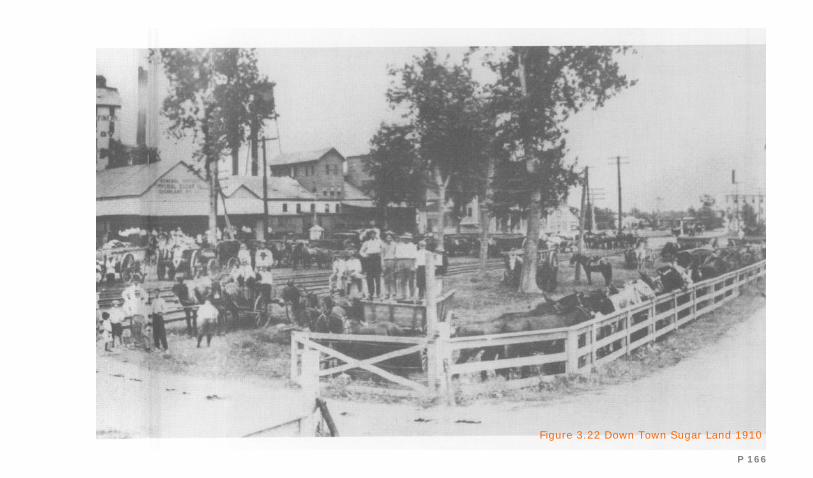
P 166
Figure 3.22 Down Town Sugar Land 1910
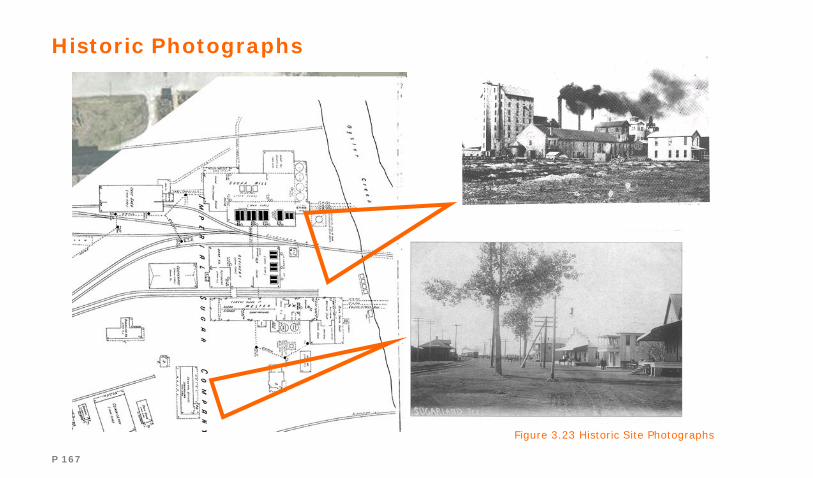
P 167
Historic Photographs
Figure 3.23 Historic Site Photographs
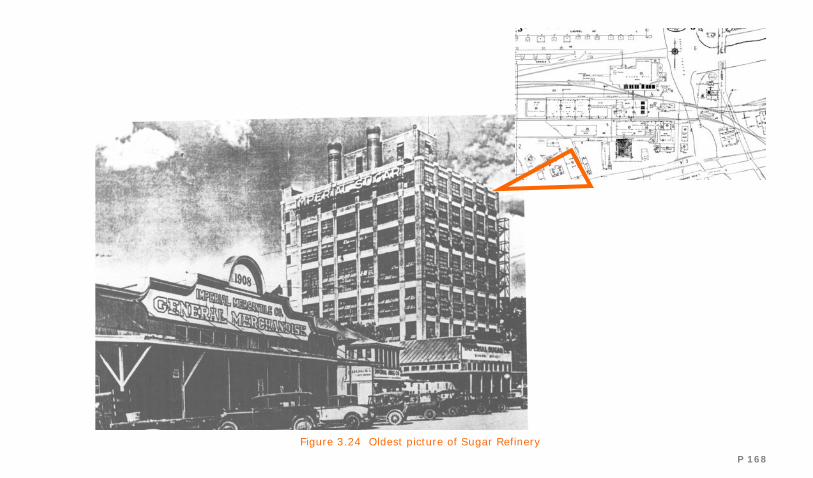
P 168
Figure 3.24 Oldest picture of Sugar Refinery
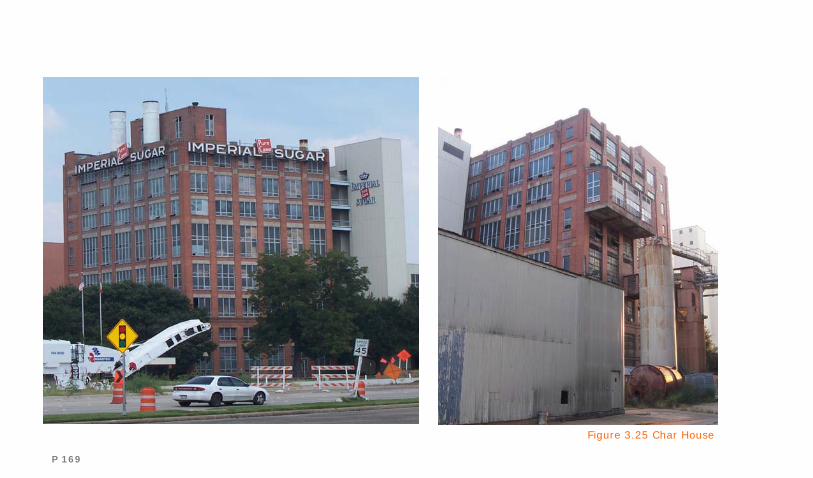
P 169
Figure 3.25 Char House
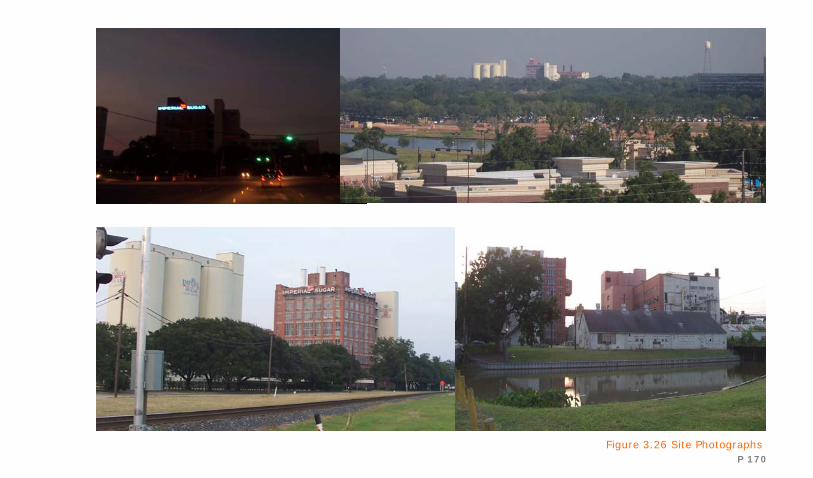
P 170
Figure 3.26 Site Photographs
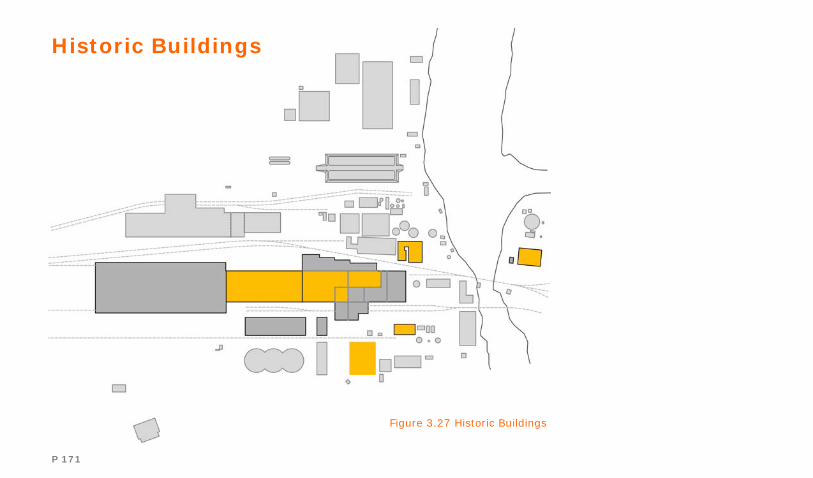
P 171
Historic Buildings
Figure 3.27 Historic Buildings
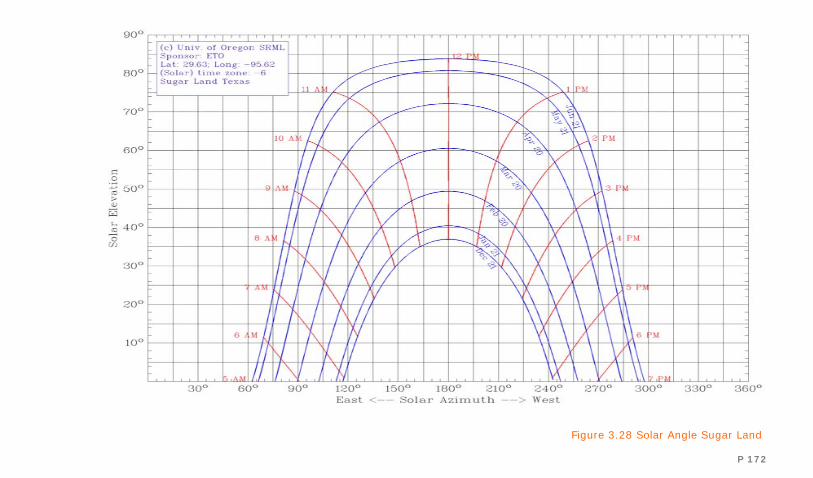
P 172
Figure 3.28 Solar Angle Sugar Land
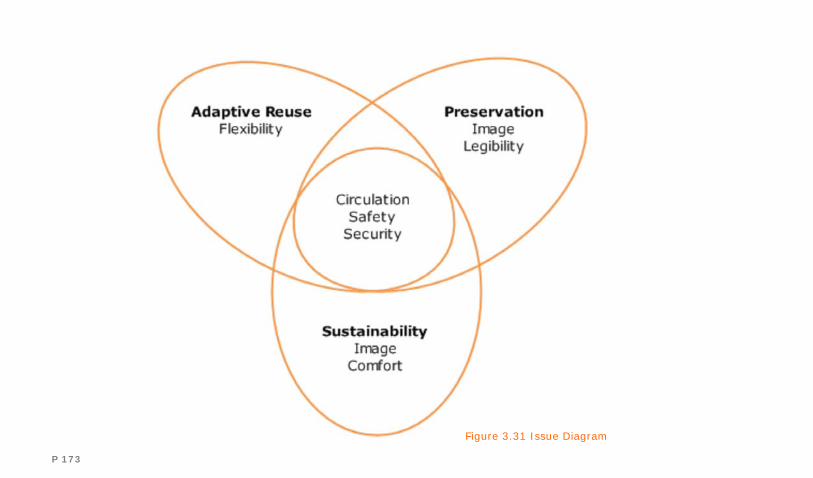
P 173
Figure 3.31 Issue Diagram

P 174
Contextual Syntheses The site should address the issues of flexibility, image, legibility, comfort, circulation, safety, and security.
The site should be addressed in the existing industrial context in which it operated. The Char House should
be integrated to become a catalyst for redevelopment and should allow for further expansion, access, and
circulation within the site. The historic characteristics of the site, such as massing, building layout, and ma-
terials should be the base for the implementation of sustainable design features. These features should be
both integrated into the site as well as form a visible association with the environmental responsibility they
represent. It is in a successful palimpsest of the past with present technology which will provide for a pleas-
ant experience to the visitors. The site should be integrated into the building as much as possible and should
make a good first impression to the visitor.
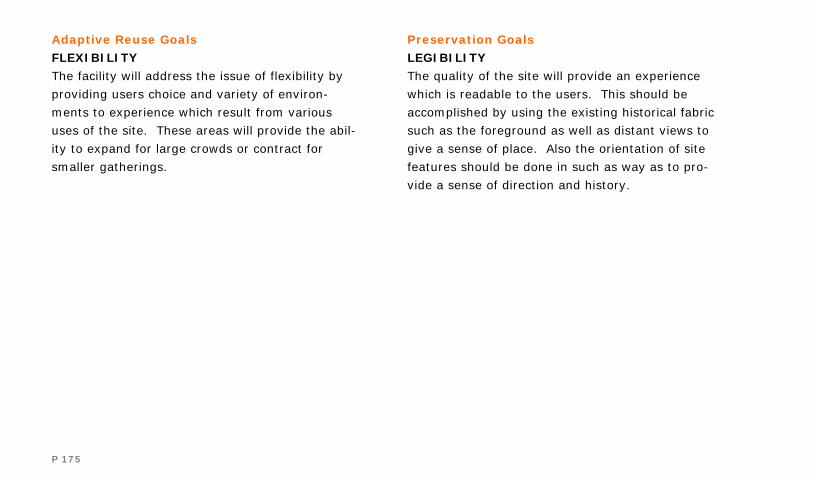
P 175
Adaptive Reuse Goals
FLEXIBILITY
The facility will address the issue of flexibility by
providing users choice and variety of environ-
ments to experience which result from various
uses of the site. These areas will provide the abil-
ity to expand for large crowds or contract for
smaller gatherings.
Preservation Goals
LEGIBILITY
The quality of the site will provide an experience
which is readable to the users. This should be
accomplished by using the existing historical fabric
such as the foreground as well as distant views to
give a sense of place. Also the orientation of site
features should be done in such as way as to pro-
vide a sense of direction and history.

P 176
Sustainability Goals
COMFORT
The site will provide ease and enjoyment to the
users by offering appropriate shapes, colors,
meaning, light levels of experience. These re-
sponses should incorporate the historical fabric.
IMAGE
The site synthesis will address how the complex is
interpreted by the users by varying in both iden-
tity and message. It will do this by using different
ordering and hierarchical elements to provide
symbolism, above all offering a visible and acces-
sible integration of sustainable design features.
Adaptive Reuse+Preservation+Sustainability
CIRCULATION
The site should offer access and integration of
both vehicular and pedestrian traffic for various
events during different time of use.
SAFETY
Safety should be visible throughout the site. The
site features should not present an harmful envi-
ronment and should be accessible to all ages.
SECURITY
Security should be a priority by offering highly
visible, well lit spaces throughout the site. These
spaces should eliminate conditions which could
lead to vandalism.

P 177
CASE STUDY Seagram Museum Barton Myers Associates Waterloo, Ontario
The museum is located on the site of
the distillery built in 1887 by Joseph E Sea-
gram. The approach adapted by Barton Myers is
not one of total conservation in a spirit of histori-
cal reconstitution; instead, they have provided a
group of constructions featuring a subtle geomet-
ric arrangement of old and new buildings. Priority
has been given to the museum spaces, and the
architectural choices have been made in the light
of this; there are three types of visitor routes de-
pending upon the amount of time the visitor
spends in the museum.
Just like 19th century industrial constructions
where machines and their shelters were created
together and by the same designer, the buildings
and the objects on display are intimately related.
One of the highlights of the museum is the ware- Figure 3.34 Restaurant Space
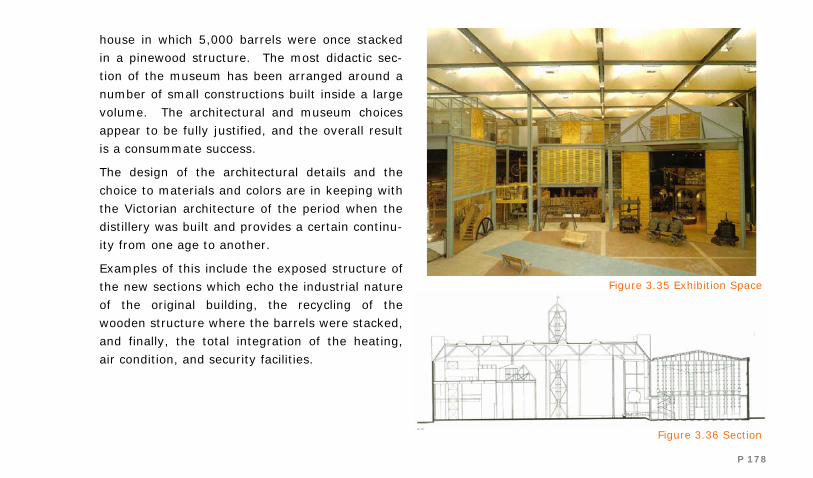
P 178
house in which 5,000 barrels were once stacked
in a pinewood structure. The most didactic sec-
tion of the museum has been arranged around a
number of small constructions built inside a large
volume. The architectural and museum choices
appear to be fully justified, and the overall result
is a consummate success.
The design of the architectural details and the
choice to materials and colors are in keeping with
the Victorian architecture of the period when the
distillery was built and provides a certain continu-
ity from one age to another.
Examples of this include the exposed structure of
the new sections which echo the industrial nature
of the original building, the recycling of the
wooden structure where the barrels were stacked,
and finally, the total integration of the heating,
air condition, and security facilities.
Figure 3.35 Exhibition Space
Figure 3.36 Section
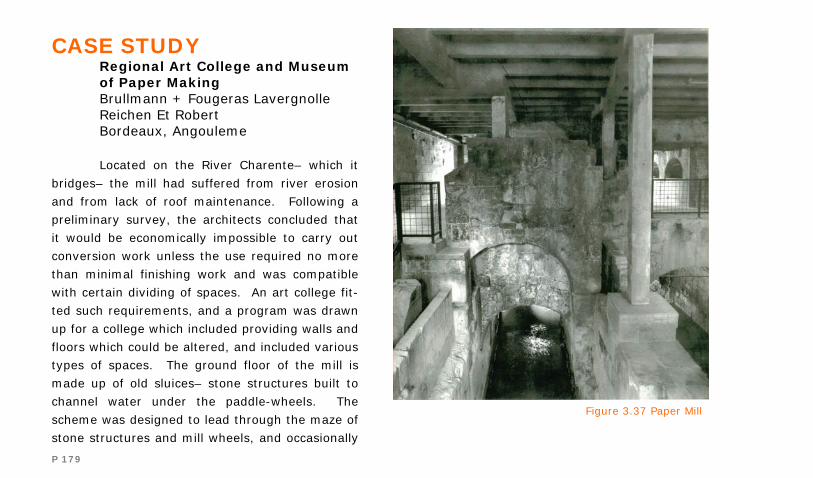
P 179
CASE STUDY Regional Art College and Museum of Paper Making Brullmann + Fougeras Lavergnolle Reichen Et Robert Bordeaux, Angouleme
Located on the River Charente– which it
bridges– the mill had suffered from river erosion
and from lack of roof maintenance. Following a
preliminary survey, the architects concluded that
it would be economically impossible to carry out
conversion work unless the use required no more
than minimal finishing work and was compatible
with certain dividing of spaces. An art college fit-
ted such requirements, and a program was drawn
up for a college which included providing walls and
floors which could be altered, and included various
types of spaces. The ground floor of the mill is
made up of old sluices– stone structures built to
channel water under the paddle-wheels. The
scheme was designed to lead through the maze of
stone structures and mill wheels, and occasionally
Figure 3.37 Paper Mill
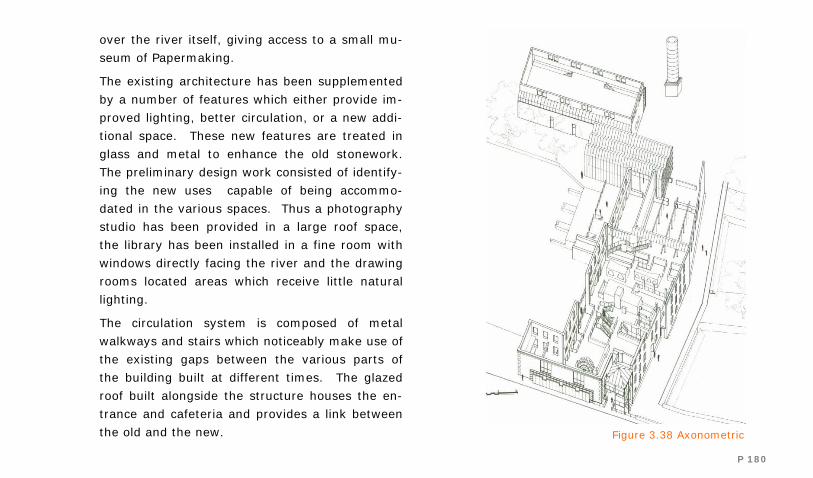
P 180
over the river itself, giving access to a small mu-
seum of Papermaking.
The existing architecture has been supplemented
by a number of features which either provide im-
proved lighting, better circulation, or a new addi-
tional space. These new features are treated in
glass and metal to enhance the old stonework.
The preliminary design work consisted of identify-
ing the new uses capable of being accommo-
dated in the various spaces. Thus a photography
studio has been provided in a large roof space,
the library has been installed in a fine room with
windows directly facing the river and the drawing
rooms located areas which receive little natural
lighting.
The circulation system is composed of metal
walkways and stairs which noticeably make use of
the existing gaps between the various parts of
the building built at different times. The glazed
roof built alongside the structure houses the en-
trance and cafeteria and provides a link between
the old and the new. Figure 3.38 Axonometric

P 181
Figures
Figure 3.1 League Map (Sharon, 12) Figure 3.2 League Map Close Up (Sharon, 12) Figure 3.3 Plantation Consolidation (Author) Figure 3.4 Hell Hole On Brazos (Sharon, 23) Figure 3.5 Downtown Sugar Land (Sharon, 43) Figure 3.6 Company Housing (Armstrong, 23) Figure 3.7 Site Map (Author( Figure 3.8 Site 1845 (Author) Figure 3.9 Site 1913 (Author) Figure 3.0 Site 1930 (Author) Figure 3.11 Site 1932 (Author) Figure 3.12 Site 1950 (Author) Figure 3.13 Site 1960 (Author) Figure 3.14 Site 1970 (Author) Figure 3.15 Site 1990 (Author) Figure 3.16 Figure Ground (Author) Figure 3.17 Site Sections (Author) Figure 3.18 Vegetation (Author) Figure 3.19 Views (Author) Figure 3.20 Movement (Author) Figure 3.21 Drainage (Author) Figure 3.22 Downtown Sugar Land 1910 (Armstrong, 14) Figure 3.23 Historic Photographs (Armstrong, 45,67) Figure 3.24 Oldest Known Picture (Armstrong, 34) Figure 3.25 Char House (Author) Figure 3.26 Site Photographs (Author) Figure 3.27 Historic Buildings (Author)
Figure 3.28 Solar Angles (Hook, 23) Figure 3.29 Sugar Land Soil (Hook, 34) Figure 3.30 Climate Data (Hook, 23) Figure 3.31 Census Data (Hook, 23) Figure 3.32 Concept Diagram (Author) Figure 3.33 Concept Diagram (Author) Figure 3.34 Seagram's Brewery (Strong, 34) Figure 3.35 Seagram’s Brewery (Strong, 35) Figure 3.36 Seagram’s Brewery (Strong, 35) Figure 3.37 Paper Mill Interior (Strong, 45) Figure 3.38 Paper Mill (Strong, 45)
P 182
Works Cited [FACILITY] Armstrong, R.M. Sugar Land Texas and the Imperial Sugar Company. Houston: D. Armstrong Co, 1991. Aykroyd, W R. The Story of Sugar. Chicago: Quadragle Books, 1967. Strong, L A G. The Story of Sugar. London: Chiswick Press, 1954. Hill, Roger W. Holly Sugar Corporation: The First 90 Years. New York: The Newcomen Society of the United States, 1994. Hook, Andrew Van. Sugar: Its Production, Technology, and Uses. New York: The Ronald Press Company, 1949. Mosteadi, Arian. New Houses in Old Buildings. Barcelona: Broto & Minguet, 1999. Rolph, George M. Something About Sugar: Its History, Growth, Manufacture. San Francisco: Taylor, 1917. Smeallie-Smith. New Construction for Older Buildings: A Design Sourcebook for Architects. New York: Wiley & Sons, 1990. Wallingford, Sharon. Fort Bend County Texas: A Pictorial History. Sugar Land: Fort Bend Publishing Group, 1996.

P 183
Pro
cess
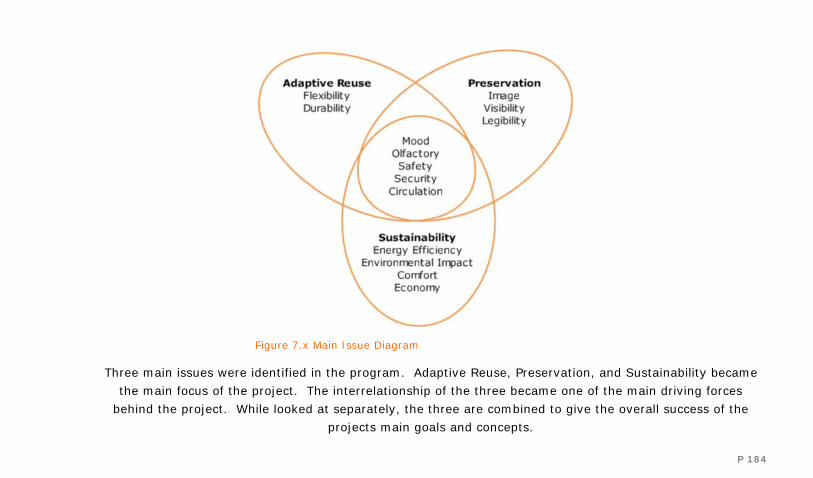
P 184
Three main issues were identified in the program. Adaptive Reuse, Preservation, and Sustainability became
the main focus of the project. The interrelationship of the three became one of the main driving forces
behind the project. While looked at separately, the three are combined to give the overall success of the
projects main goals and concepts.
Figure 7.x Main Issue Diagram
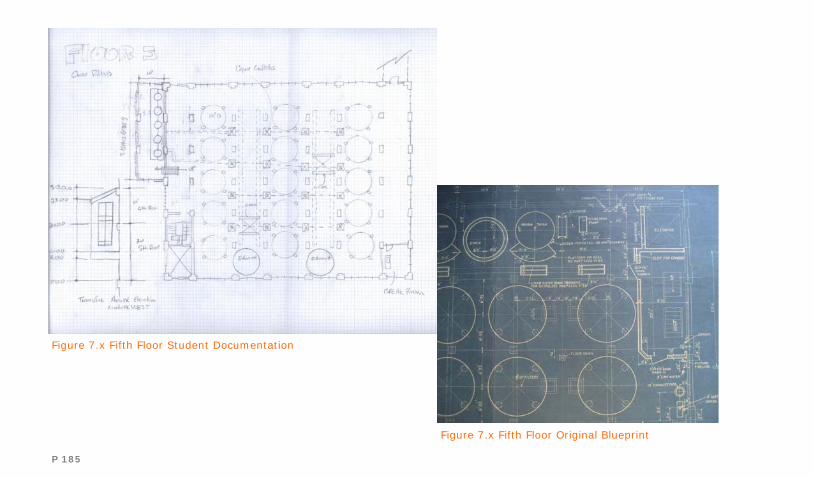
P 185
Figure 7.x Fifth Floor Student Documentation
Figure 7.x Fifth Floor Original Blueprint

P 186
Preservation
Preservation was the main focus of the project in
the beginning of the research. Many techniques
were implemented throughout the design proc-
ess. The first preservation techniques centered
on documenting the main Char House building in
the factory complex. This was done early on in
which photography and measurements were
taken of the building and surrounding factory site.
The next step was a creation of a set of measured
drawings from the data that was collected. The
site was then visited again and the measured
drawings were compared as well as more photo-
graphs taken. In this site visit the archive of the
Imperial Sugar Factory was accessed and several
historic photographs and documents were found.
Also, a set of the original blueprints was re-
corded. In this completion, a set of drawings was
finalized to use as a bases for the design as well
as several important historical features identified.
Figure 7.x Documenting Char House
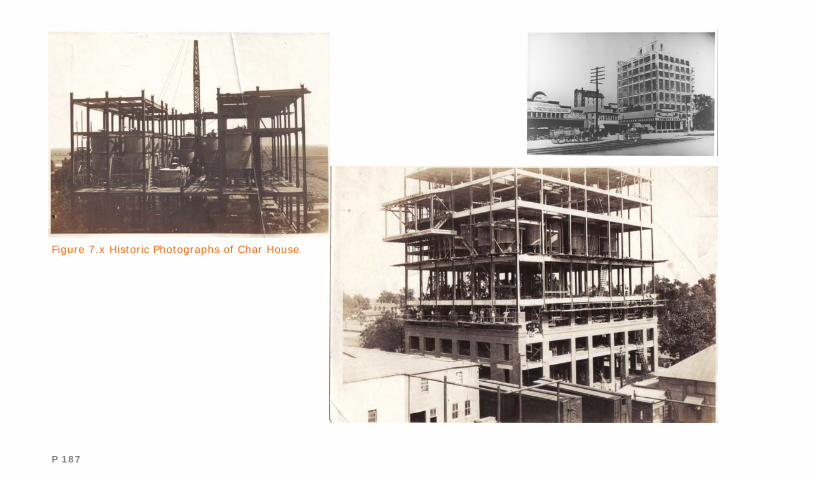
P 187
Figure 7.x Historic Photographs of Char House
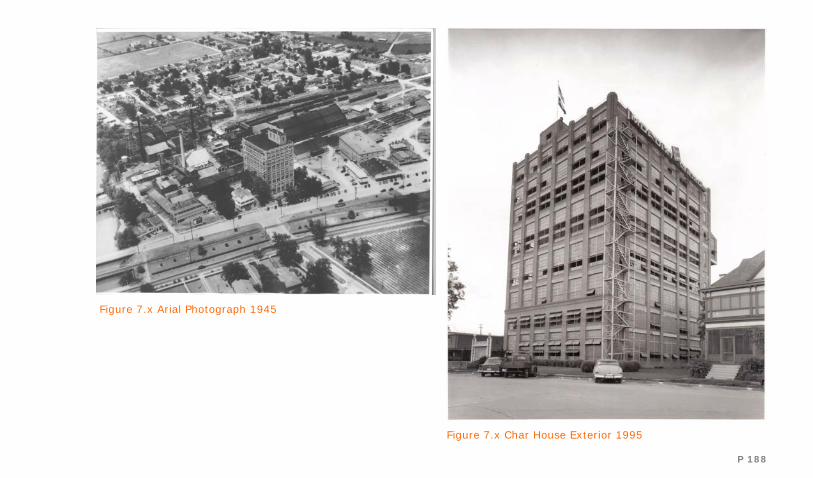
P 188
Figure 7.x Arial Photograph 1945
Figure 7.x Char House Exterior 1995

P 189
Figure 2.9 Process Schematic
P 190
Adaptive Reuse
Once the preservation aspects of the project were
completed, a schematic design process was en-
gaged centering around important featured iden-
tified within the historical context. The program
research indicated several spaces were needed
for a variety of uses. The two main program-
matic issues were identified as providing space
for a museum and an artistic venue. The pro-
grammatic need was then looked at in conjunc-
tion with the current existing spatial layout of the
building and correlations between the spaces and
functions were determined.
The spatial layout of the lower floors of the Char
House became suitable for the museum program
requirements. In placing the museum within
these floors the concept between the function of
the Char and the purification of the sugar was
reinforced. The museum becomes the overall
program of the building, becoming the main func-
tion of the building. The artistic studios were
placed on the sixth and seventh floor. This spa-
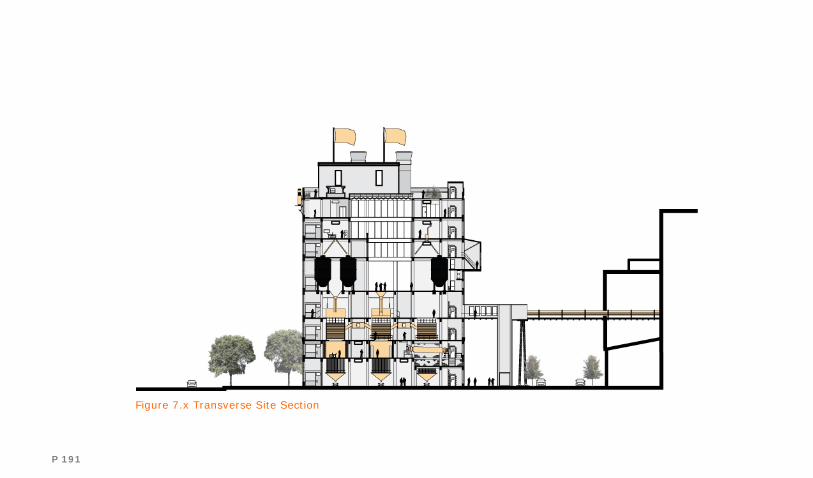
P 191
Figure 7.x Transverse Site Section
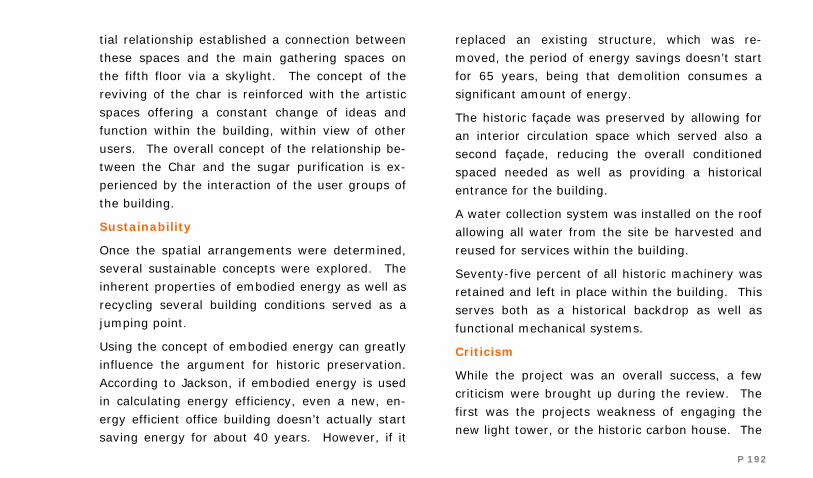
P 192
tial relationship established a connection between
these spaces and the main gathering spaces on
the fifth floor via a skylight. The concept of the
reviving of the char is reinforced with the artistic
spaces offering a constant change of ideas and
function within the building, within view of other
users. The overall concept of the relationship be-
tween the Char and the sugar purification is ex-
perienced by the interaction of the user groups of
the building.
Sustainability
Once the spatial arrangements were determined,
several sustainable concepts were explored. The
inherent properties of embodied energy as well as
recycling several building conditions served as a
jumping point.
Using the concept of embodied energy can greatly
influence the argument for historic preservation.
According to Jackson, if embodied energy is used
in calculating energy efficiency, even a new, en-
ergy efficient office building doesn’t actually start
saving energy for about 40 years. However, if it
replaced an existing structure, which was re-
moved, the period of energy savings doesn’t start
for 65 years, being that demolition consumes a
significant amount of energy.
The historic façade was preserved by allowing for
an interior circulation space which served also a
second façade, reducing the overall conditioned
spaced needed as well as providing a historical
entrance for the building.
A water collection system was installed on the roof
allowing all water from the site be harvested and
reused for services within the building.
Seventy-five percent of all historic machinery was
retained and left in place within the building. This
serves both as a historical backdrop as well as
functional mechanical systems.
Criticism
While the project was an overall success, a few
criticism were brought up during the review. The
first was the projects weakness of engaging the
new light tower, or the historic carbon house. The
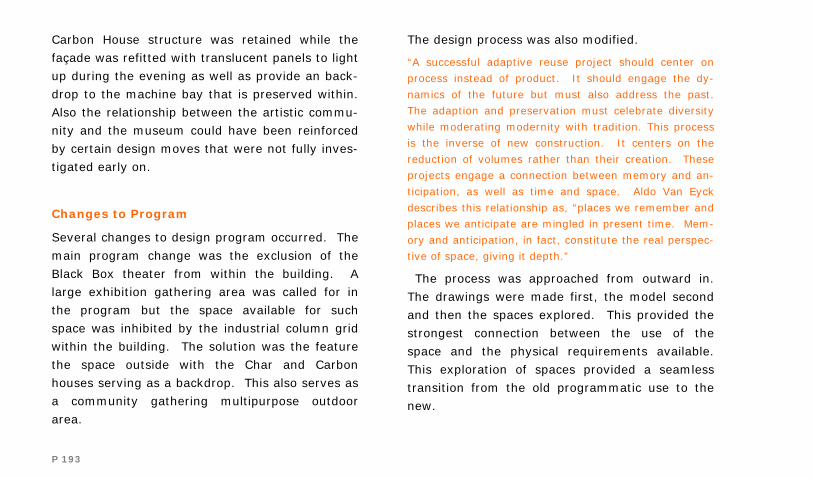
P 193
Carbon House structure was retained while the
façade was refitted with translucent panels to light
up during the evening as well as provide an back-
drop to the machine bay that is preserved within.
Also the relationship between the artistic commu-
nity and the museum could have been reinforced
by certain design moves that were not fully inves-
tigated early on.
Changes to Program
Several changes to design program occurred. The
main program change was the exclusion of the
Black Box theater from within the building. A
large exhibition gathering area was called for in
the program but the space available for such
space was inhibited by the industrial column grid
within the building. The solution was the feature
the space outside with the Char and Carbon
houses serving as a backdrop. This also serves as
a community gathering multipurpose outdoor
area.
The design process was also modified.
“A successful adaptive reuse project should center on
process instead of product. It should engage the dy-
namics of the future but must also address the past.
The adaption and preservation must celebrate diversity
while moderating modernity with tradition. This process
is the inverse of new construction. It centers on the
reduction of volumes rather than their creation. These
projects engage a connection between memory and an-
ticipation, as well as time and space. Aldo Van Eyck
describes this relationship as, “places we remember and
places we anticipate are mingled in present time. Mem-
ory and anticipation, in fact, constitute the real perspec-
tive of space, giving it depth.”
The process was approached from outward in.
The drawings were made first, the model second
and then the spaces explored. This provided the
strongest connection between the use of the
space and the physical requirements available.
This exploration of spaces provided a seamless
transition from the old programmatic use to the
new.
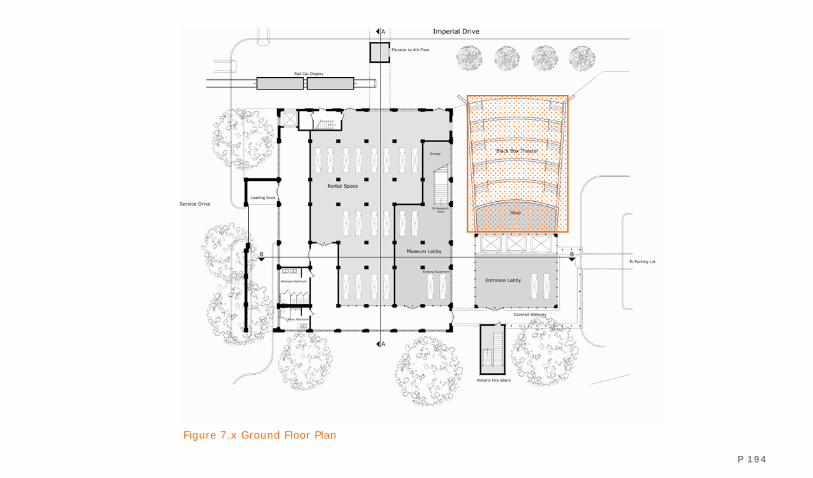
P 194
Figure 7.x Ground Floor Plan

P 195
Resp
on
se

P 196
The conceptual basis of the design is formed be-
tween the relationships of the two processes
which took place inside the building. The Char
House itself was part of a larger process, with the
building being commissioned to fulfill one specific
step. Within the Char House two processes oc-
curred: one the purification of the sugar and two,
the revival of the bone char used in the purifica-
tion. The processes were defined as vertical and
horizontal. The revival of the bone char took
place horizontally, as the procedure is gravity fed.
The purification of the sugar takes place horizon-
tally, as the sugar arrived from the Pan House on
the fourth floor and then the purified sugar was
then taken to the adjacent Carbon House.
This interaction served as a departing point for
both the museum program and the artist spaces.
The museum is a vertical process, a series of ex-
hibits experienced in succession. The artist
spaces lend themselves to a vertical process;
they purify the experience through rapid replen-
ishment and exploration of ideas. These spaces Figure 2.7 Char Filter Process
P 197
are likened to the purification of the sugar in the
overall refining process.
A hierarchy of spaces is established through the
adherence to the previous process, the museum
with the working horizontal and the artist spaces
with the reviving vertical. The user can have mul-
tiple experiences, depending on the path taken
through the building. The fifth floor, which serves
to join the two spaces, serves a gathering and
service space. This floor shares both the end of
the museum as well as offering transparency to
the above floor via a skylight. This allow for the
upper floors to visually share the activities of this
floor. This becomes the main floor for the new
program, which was historically the floor in which
the two processes would meet, and the sugar
would become purified.
The main controlling factor of the design resided
in the characteristics of the existing spaces. The
industrial process served as the base for the de-
sign. The established spatial qualities were exam-
ined and then modified, creating voids and new
uses. There were several historically identified
aspects of the process which served as a guide to
examine the spaces. These historic characteristics
dictated to a large degree the extent into which
the spaces were modified. Historically important
spaces were preserved while other characteristics
lent themselves to modification. The south bay’s
of filters were preserved in their entirety to pro-
vide the historical sense of place and function of
the original building.
The most compelling aspects of the design or
adaptive reuse projects in general, is the juxtapo-
sition of new and old. While this impact is best
expressed within the tectonic material aspect, the
process can also serve as a guide. The massing of
the Carbon House against the Char House offers a
dramatic experience. The materials gain even
more purity when opposed by another which high-
lights the difference, not only in construction, but
in use. This is further enhanced by the massive
amounts of new construction which make up the
urban fabric of Sugar Land. The resulting experi-

P 198
ence proves that industrial architecture can be
examined away from original intent and create a
place both rich in history as well as provide a
contemporary reuse.
Figure 7.x 1935 Sanborn Map
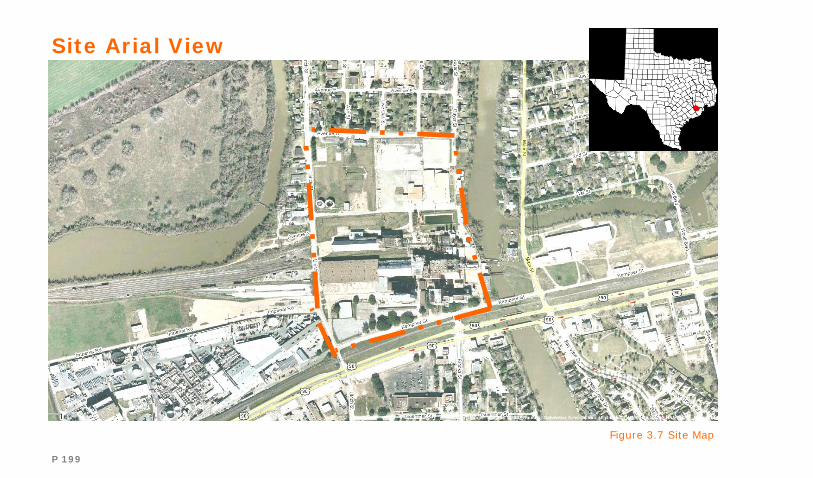
P 199
Site Arial View
Figure 3.7 Site Map

P 200
Figure 7.x Site Study Model
Figure 7.x Sanborn Map 1955
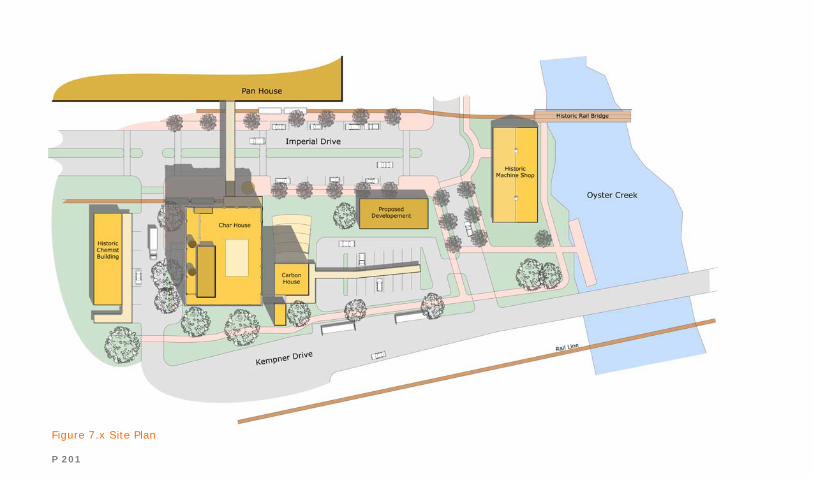
P 201
Figure 7.x Site Plan
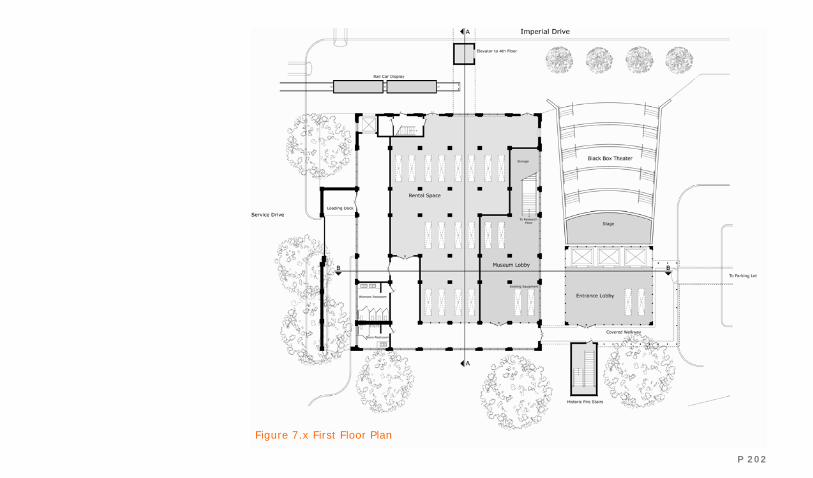
P 202
Figure 7.x First Floor Plan
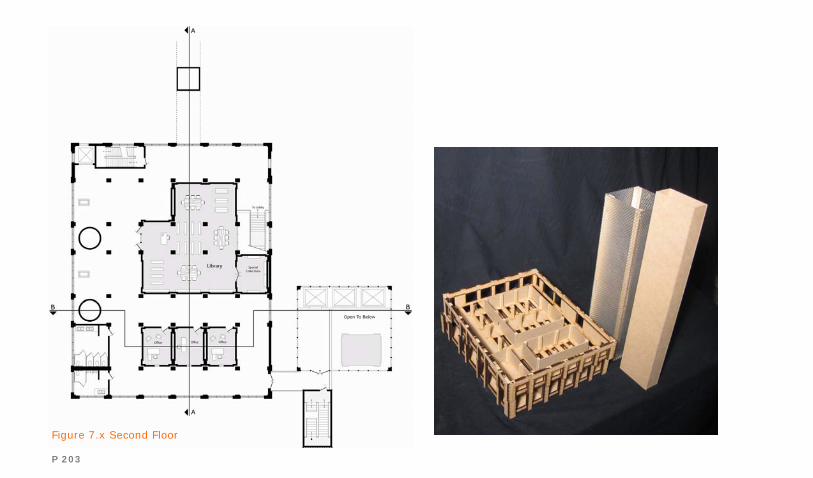
P 203
Figure 7.x Second Floor

P 204
Figure 7.x Third Floor
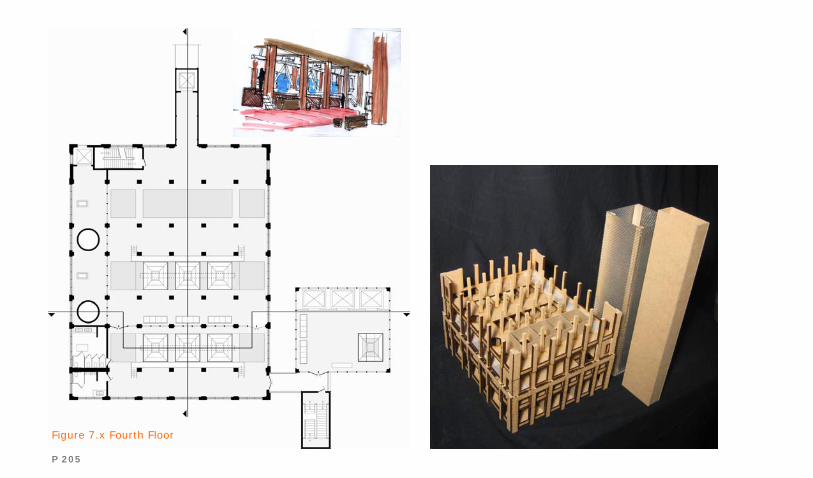
P 205
Figure 7.x Fourth Floor
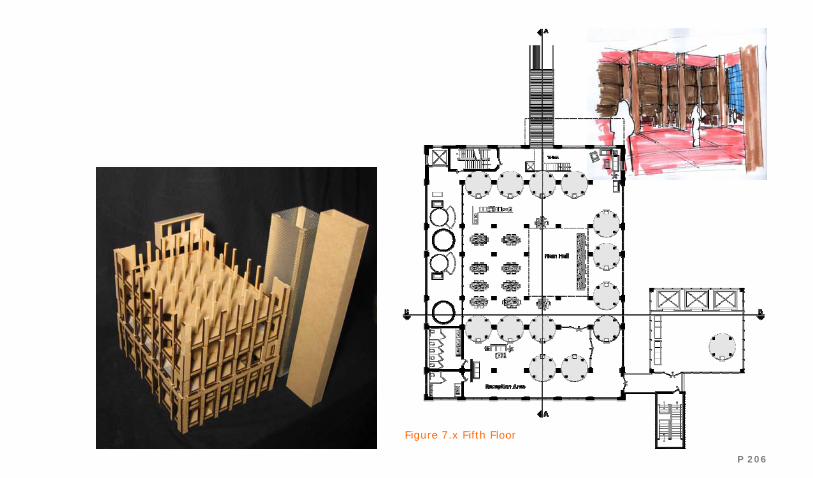
P 206
Figure 7.x Fifth Floor
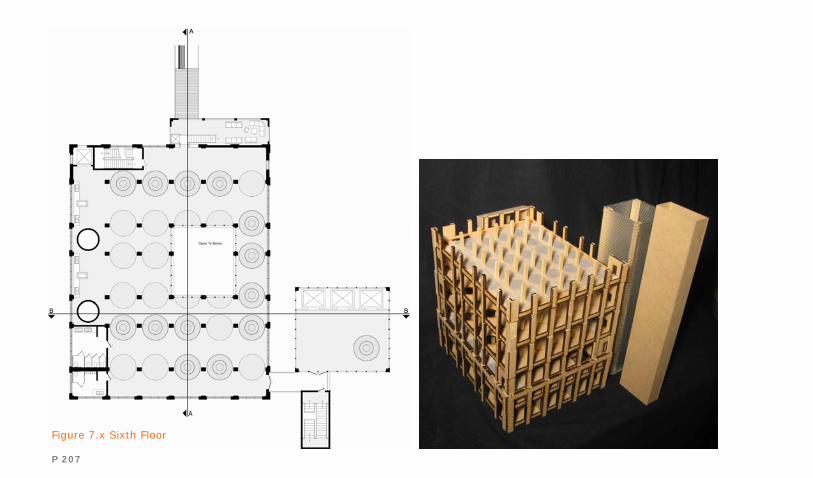
P 207
Figure 7.x Sixth Floor
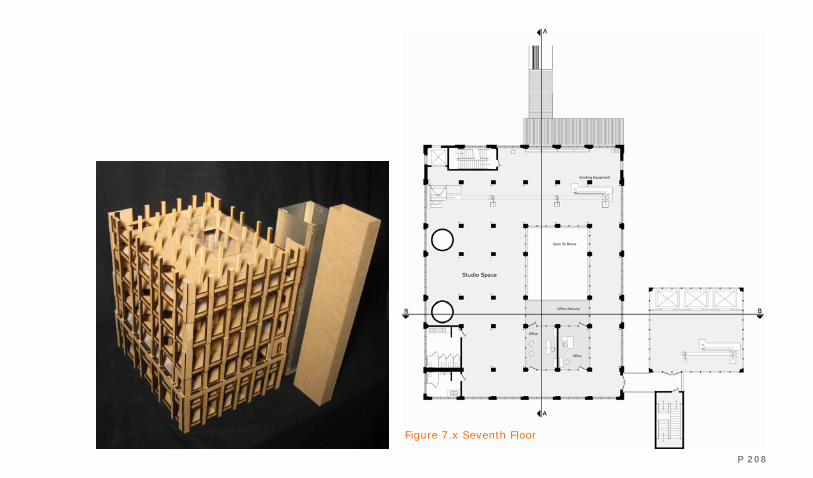
P 208
Figure 7.x Seventh Floor
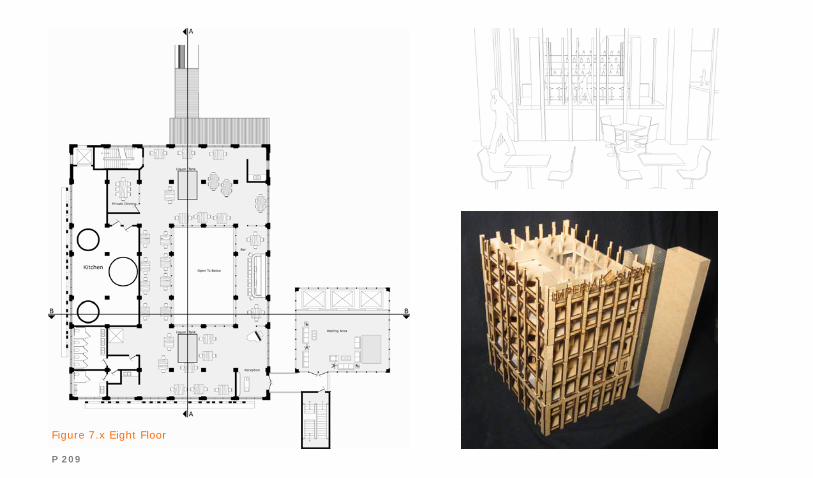
P 209
Figure 7.x Eight Floor
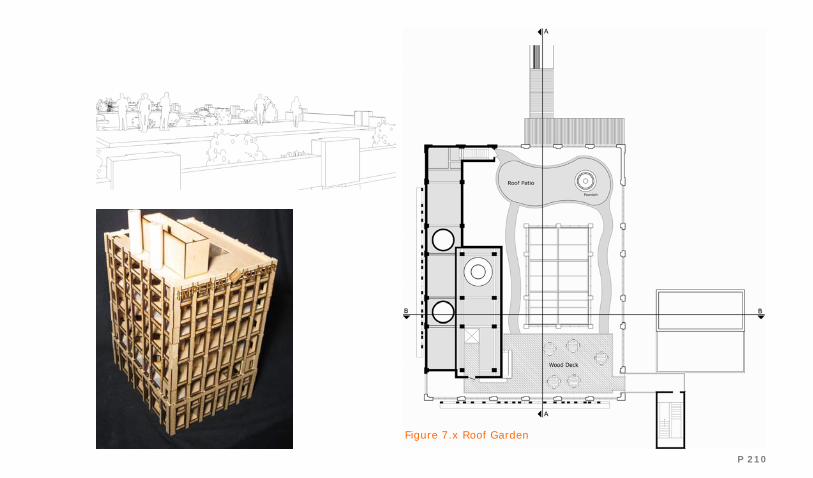
P 210
Figure 7.x Roof Garden
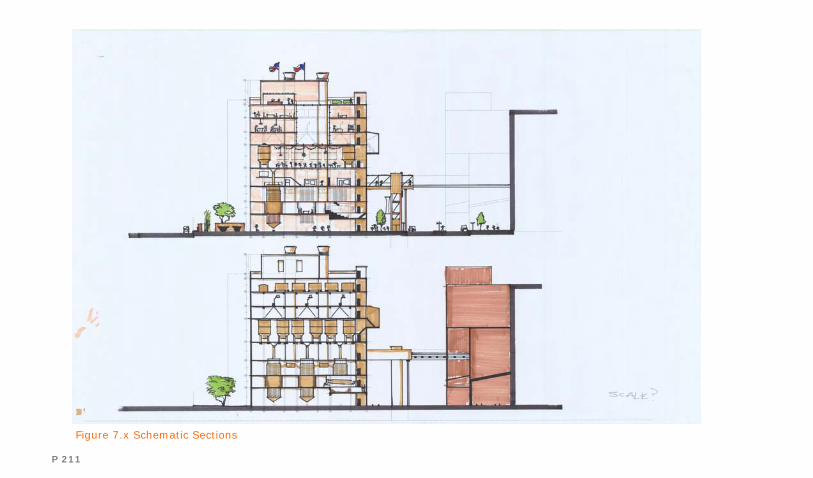
P 211
Figure 7.x Schematic Sections
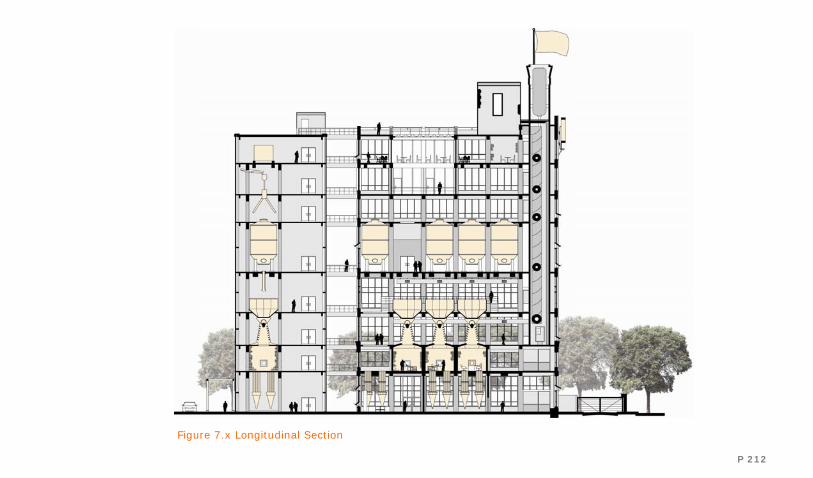
P 212
Figure 7.x Longitudinal Section

P 213
Figure 7.x Exterior Perspective
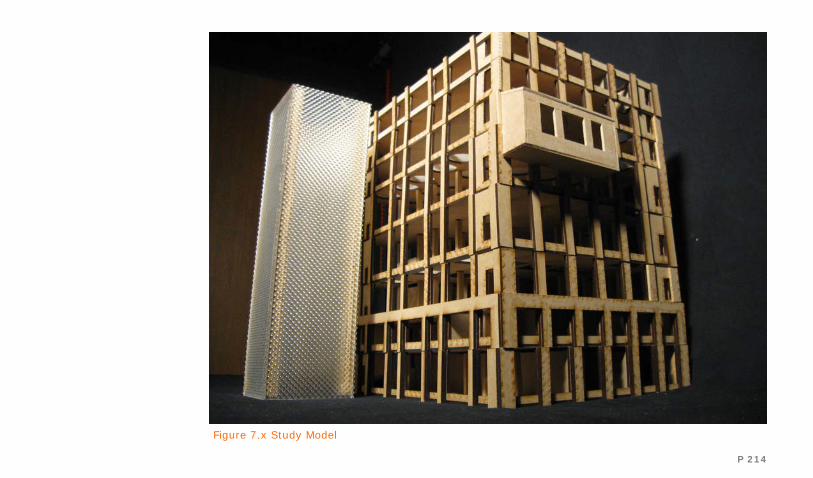
P 214
Figure 7.x Study Model
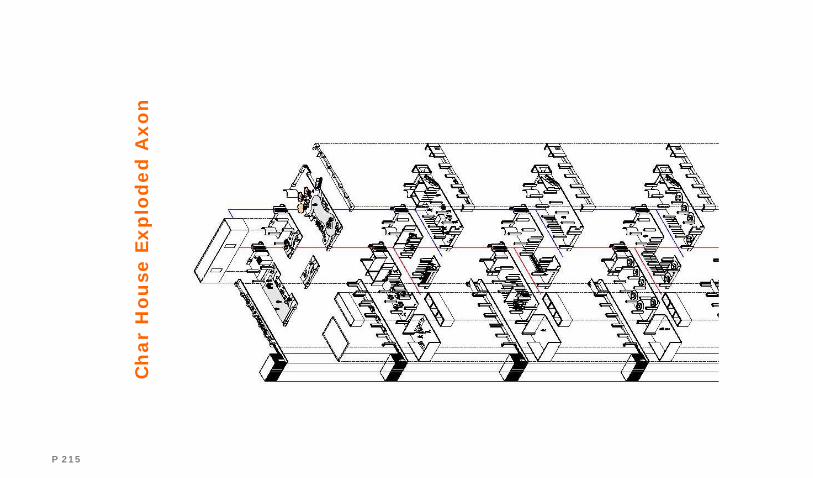
P 215
Ch
ar
Ho
use
Exp
lod
ed
Axo
n
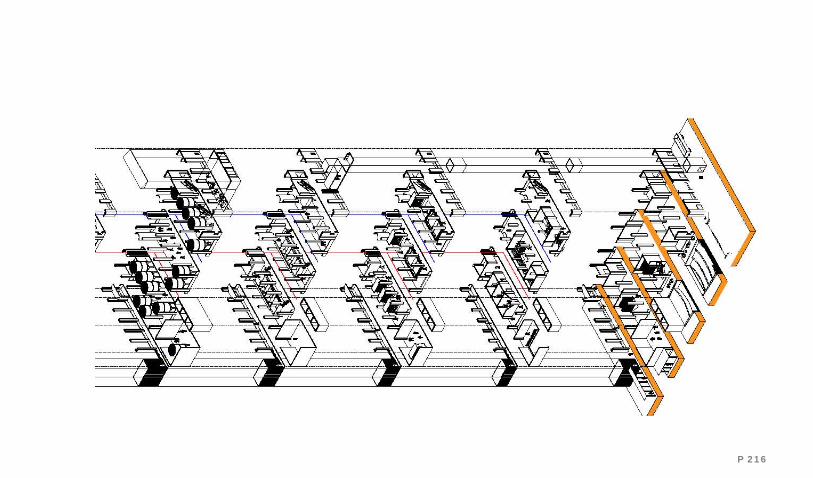
P 216
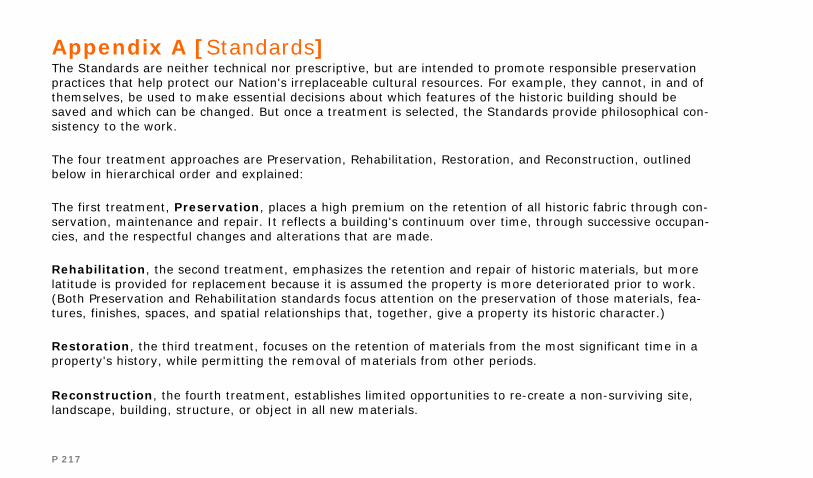
P 217
Appendix A [Standards] The Standards are neither technical nor prescriptive, but are intended to promote responsible preservation practices that help protect our Nation's irreplaceable cultural resources. For example, they cannot, in and of themselves, be used to make essential decisions about which features of the historic building should be saved and which can be changed. But once a treatment is selected, the Standards provide philosophical con-sistency to the work.
The four treatment approaches are Preservation, Rehabilitation, Restoration, and Reconstruction, outlined below in hierarchical order and explained:
The first treatment, Preservation, places a high premium on the retention of all historic fabric through con-servation, maintenance and repair. It reflects a building's continuum over time, through successive occupan-cies, and the respectful changes and alterations that are made.
Rehabilitation, the second treatment, emphasizes the retention and repair of historic materials, but more latitude is provided for replacement because it is assumed the property is more deteriorated prior to work. (Both Preservation and Rehabilitation standards focus attention on the preservation of those materials, fea-tures, finishes, spaces, and spatial relationships that, together, give a property its historic character.)
Restoration, the third treatment, focuses on the retention of materials from the most significant time in a property's history, while permitting the removal of materials from other periods.
Reconstruction, the fourth treatment, establishes limited opportunities to re-create a non-surviving site, landscape, building, structure, or object in all new materials.

P 218
[Standards For Preservation]
1. A property will be used as it was historically, or be given a new use that maximizes the retention of dis-tinctive materials, features, spaces, and spatial relationships. Where a treatment and use have not been identified, a property will be protected and, if necessary, stabilized until additional work may be undertaken. 2. The historic character of a property will be retained and preserved. The replacement of intact or repairable historic materials or alteration of features, spaces, and spatial relationships that characterize a property will be avoided. 3. Each property will be recognized as a physical record of its time, place, and use. Work needed to stabilize, consolidate, and conserve existing historic materials and features will be physically and visually compatible, identifiable upon close inspection, and properly documented for future research. 4. Changes to a property that have acquired historic significance in their own right will be retained and pre-served. 5. Distinctive materials, features, finishes, and construction techniques or examples of craftsmanship that characterize a property will be preserved. 6. The existing condition of historic features will be evaluated to determine the appropriate level of interven-tion needed. Where the severity of deterioration requires repair or limited replacement of a distinctive fea-ture, the new material will match the old in composition, design, color, and texture. 7. Chemical or physical treatments, if appropriate, will be undertaken using the gentlest means possible. Treatments that cause damage to historic materials will not be used.
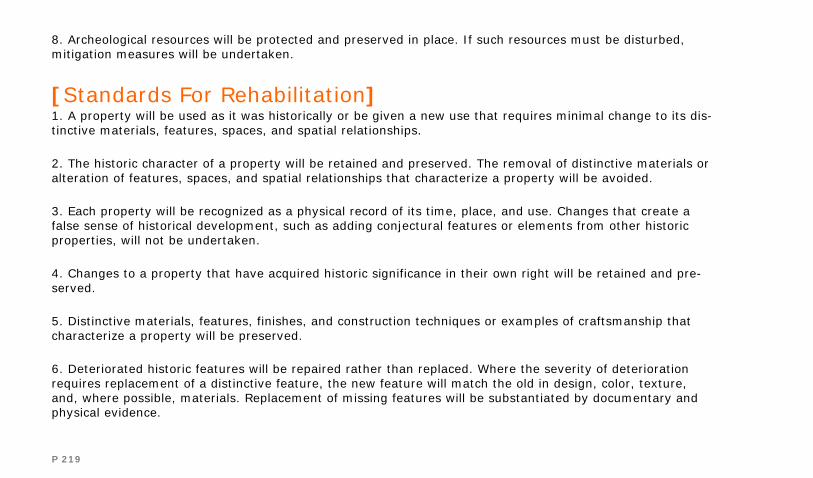
P 219
8. Archeological resources will be protected and preserved in place. If such resources must be disturbed, mitigation measures will be undertaken.
[Standards For Rehabilitation] 1. A property will be used as it was historically or be given a new use that requires minimal change to its dis-tinctive materials, features, spaces, and spatial relationships.
2. The historic character of a property will be retained and preserved. The removal of distinctive materials or alteration of features, spaces, and spatial relationships that characterize a property will be avoided.
3. Each property will be recognized as a physical record of its time, place, and use. Changes that create a false sense of historical development, such as adding conjectural features or elements from other historic properties, will not be undertaken.
4. Changes to a property that have acquired historic significance in their own right will be retained and pre-served.
5. Distinctive materials, features, finishes, and construction techniques or examples of craftsmanship that characterize a property will be preserved.
6. Deteriorated historic features will be repaired rather than replaced. Where the severity of deterioration requires replacement of a distinctive feature, the new feature will match the old in design, color, texture, and, where possible, materials. Replacement of missing features will be substantiated by documentary and physical evidence.
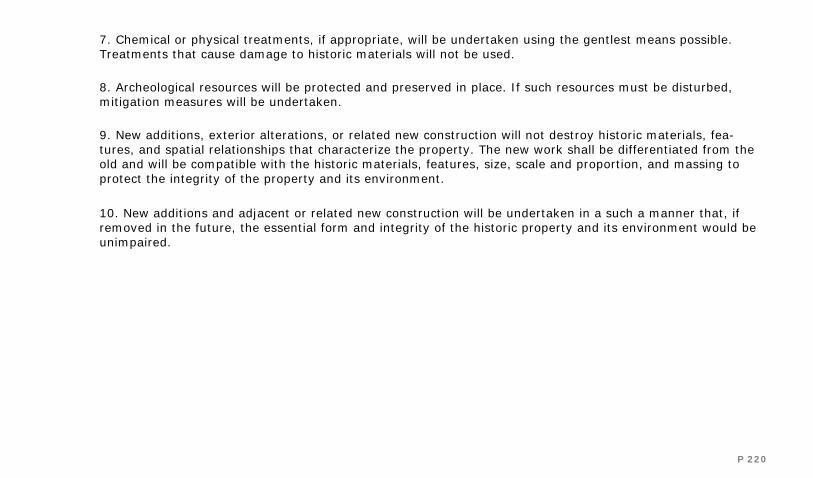
P 220
7. Chemical or physical treatments, if appropriate, will be undertaken using the gentlest means possible. Treatments that cause damage to historic materials will not be used.
8. Archeological resources will be protected and preserved in place. If such resources must be disturbed, mitigation measures will be undertaken.
9. New additions, exterior alterations, or related new construction will not destroy historic materials, fea-tures, and spatial relationships that characterize the property. The new work shall be differentiated from the old and will be compatible with the historic materials, features, size, scale and proportion, and massing to protect the integrity of the property and its environment.
10. New additions and adjacent or related new construction will be undertaken in a such a manner that, if removed in the future, the essential form and integrity of the historic property and its environment would be unimpaired.
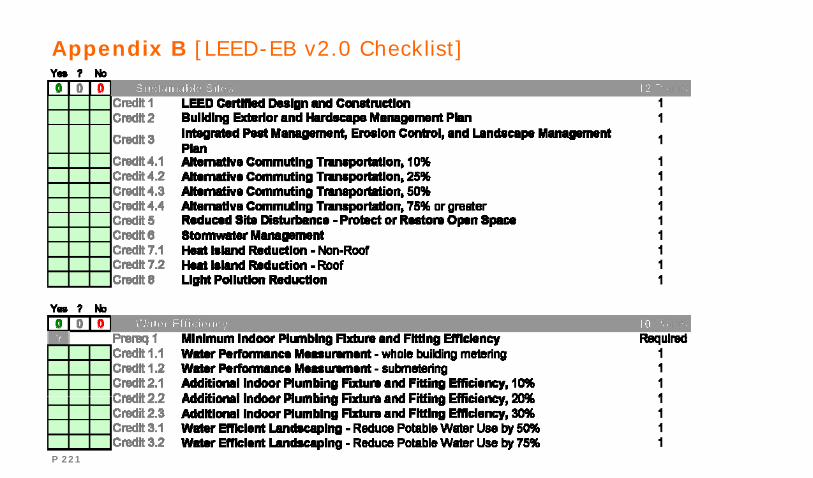
P 221
Appendix B [LEED-EB v2.0 Checklist]

P 222
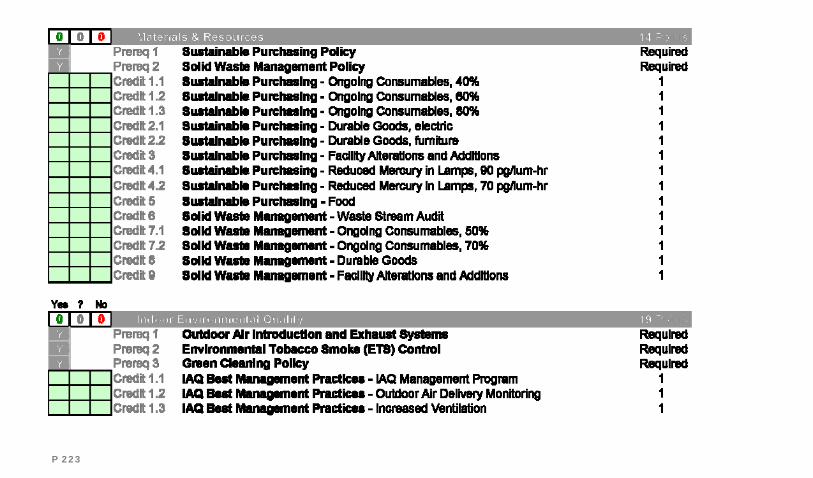
P 223
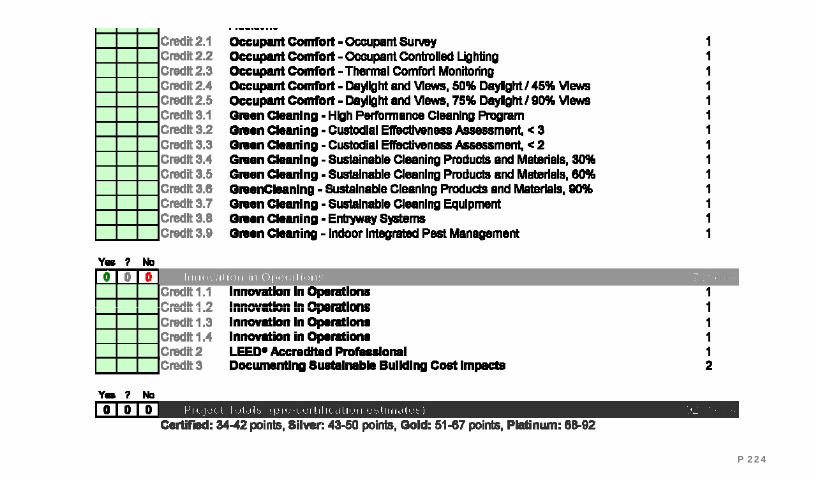
P 224
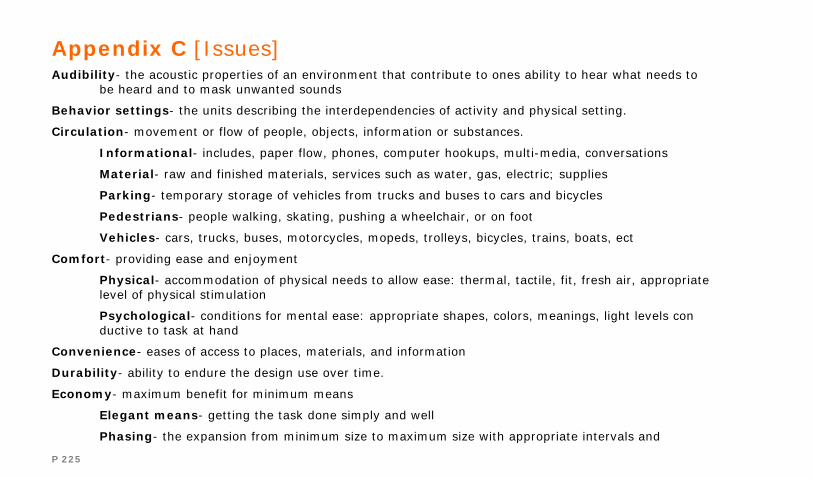
P 225
Appendix C [Issues]
Audibility- the acoustic properties of an environment that contribute to ones ability to hear what needs to be heard and to mask unwanted sounds
Behavior settings- the units describing the interdependencies of activity and physical setting.
Circulation- movement or flow of people, objects, information or substances.
Informational- includes, paper flow, phones, computer hookups, multi-media, conversations
Material- raw and finished materials, services such as water, gas, electric; supplies
Parking- temporary storage of vehicles from trucks and buses to cars and bicycles
Pedestrians- people walking, skating, pushing a wheelchair, or on foot
Vehicles- cars, trucks, buses, motorcycles, mopeds, trolleys, bicycles, trains, boats, ect
Comfort- providing ease and enjoyment
Physical- accommodation of physical needs to allow ease: thermal, tactile, fit, fresh air, appropriate level of physical stimulation
Psychological- conditions for mental ease: appropriate shapes, colors, meanings, light levels con ductive to task at hand
Convenience- eases of access to places, materials, and information
Durability- ability to endure the design use over time.
Economy- maximum benefit for minimum means
Elegant means- getting the task done simply and well
Phasing- the expansion from minimum size to maximum size with appropriate intervals and

P 226
functions
Quality- attribute or degree of excellence required for success
Energy Efficiency- amount and/or percentage of available energy that is used
Flexibility- ability to change
Adaptability- ability to change from one use to another
Choice/Variety- ability to interpret use
Expansion/Contraction- ability to enlarge or shrink a space with ease
Multi-use- ability to use an environment in different ways at different times
Image- how a place looks and is interpreted by the observer; visual impression
Identity- how a place is recognized visually
Message- what a place is trying to say to its users
Ordering/Proportion- recognizable visual patterns and relationships
Status/Hierarchy- the communicated value or importance of a place or person occupying a place
Symbolism- the meaning or representation to be communicated
Interaction- mutual action and interchange: social, academic, team work
Group Participation- groups of people engaged in a common activity
Social- friendly interchange for its own sake
Legibility- quality of the environment as readable
Layering- foreground, midground, and distant view giving a sense of what is near and what is far
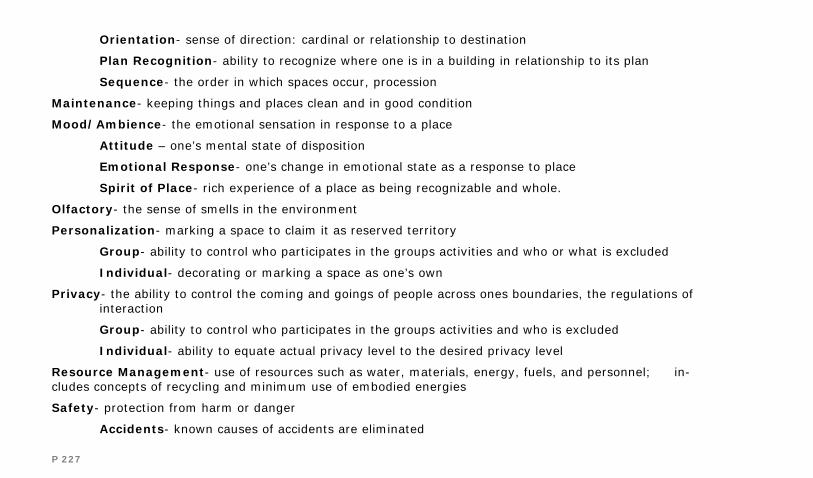
P 227
Orientation- sense of direction: cardinal or relationship to destination
Plan Recognition- ability to recognize where one is in a building in relationship to its plan
Sequence- the order in which spaces occur, procession
Maintenance- keeping things and places clean and in good condition
Mood/Ambience- the emotional sensation in response to a place
Attitude – one’s mental state of disposition
Emotional Response- one’s change in emotional state as a response to place
Spirit of Place- rich experience of a place as being recognizable and whole.
Olfactory- the sense of smells in the environment
Personalization- marking a space to claim it as reserved territory
Group- ability to control who participates in the groups activities and who or what is excluded
Individual- decorating or marking a space as one’s own
Privacy- the ability to control the coming and goings of people across ones boundaries, the regulations of interaction
Group- ability to control who participates in the groups activities and who is excluded
Individual- ability to equate actual privacy level to the desired privacy level
Resource Management- use of resources such as water, materials, energy, fuels, and personnel; in-cludes concepts of recycling and minimum use of embodied energies
Safety- protection from harm or danger
Accidents- known causes of accidents are eliminated
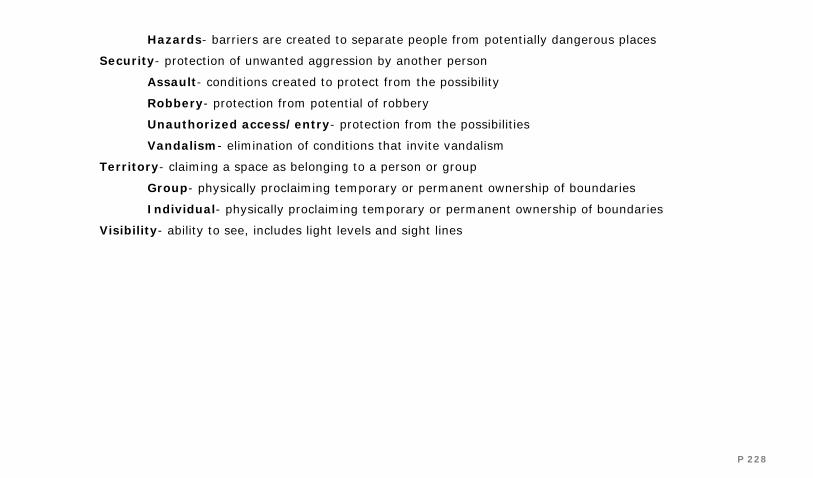
P 228
Hazards- barriers are created to separate people from potentially dangerous places
Security- protection of unwanted aggression by another person
Assault- conditions created to protect from the possibility
Robbery- protection from potential of robbery
Unauthorized access/entry- protection from the possibilities
Vandalism- elimination of conditions that invite vandalism
Territory- claiming a space as belonging to a person or group
Group- physically proclaiming temporary or permanent ownership of boundaries
Individual- physically proclaiming temporary or permanent ownership of boundaries
Visibility- ability to see, includes light levels and sight lines
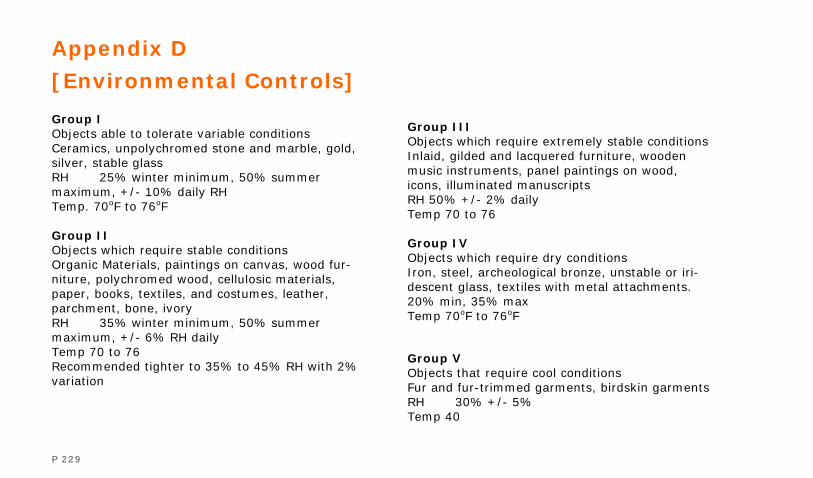
P 229
Appendix D
[Environmental Controls] Group I Objects able to tolerate variable conditions Ceramics, unpolychromed stone and marble, gold, silver, stable glass RH 25% winter minimum, 50% summer maximum, +/- 10% daily RH Temp. 70oF to 76oF Group II Objects which require stable conditions Organic Materials, paintings on canvas, wood fur-niture, polychromed wood, cellulosic materials, paper, books, textiles, and costumes, leather, parchment, bone, ivory RH 35% winter minimum, 50% summer maximum, +/- 6% RH daily Temp 70 to 76 Recommended tighter to 35% to 45% RH with 2% variation
Group III Objects which require extremely stable conditions Inlaid, gilded and lacquered furniture, wooden music instruments, panel paintings on wood, icons, illuminated manuscripts RH 50% +/- 2% daily Temp 70 to 76 Group IV Objects which require dry conditions Iron, steel, archeological bronze, unstable or iri-descent glass, textiles with metal attachments. 20% min, 35% max Temp 70oF to 76oF
Group V Objects that require cool conditions Fur and fur-trimmed garments, birdskin garments RH 30% +/- 5% Temp 40

P 230
[Lighting] 3:1 ration is enough to attract attention, 10:1 will accentuate 1 foot candle = 10 lux Group 1 Objects especially sensitive to light Textiles, costumes, watercolors, tapestries, prints and drawings, manuscripts, miniatures, distem-per, gouache, dyed leather, wallpaper, natural-history exhibits, botanical specimens, fur, feathers Max illuminance: 5 footcandles (50 lux) Ultraviolet Radiation: 75 microwatts/lumen
Group 2 Objects less sensitive to light Oil paintings, tempera paintings, undyed leathers, horn, bone and ivory, oriental lacquer Max illumination 20 footcandles ( 200 Lux ) Ultraviolet radiation 75 microwatts/lumen
Group 3 Objects insensitive to light Metal, stone, glass, ceramics, jewelry, enamel Max illumination: 30 footcandles ( 300 lux ) Ultraviolet radiation: 75 microwatts/lumen Range of 30 footcandles can be adaptive to main-tain easy transition between galleries
Rules Two dimensional exhibits lit from 60 degrees of horizontal surface Three dimensional exhibits light from 45 degrees of horizontal surface
Electric loads : Shop 220 volts