me 322: instrumentation lecture 9 february 6, 2015 professor miles greiner lab 4 and 5, beam in...
TRANSCRIPT

ME 322: InstrumentationLecture 9
February 6, 2015
Professor Miles Greiner
Lab 4 and 5, beam in bending, Elastic modulus calculation

Announcements/Reminders
• HW 3 Due Monday • Add L4PP problem
• Midterm 1, February 20, 2015 (two weeks)• Service Learning Extra Credit (tomorrow)
– Probably too late to sign up now– If you signed-up but don’t show-up, you will loose 1%
• If you must cancel please inform Ms. Davis , 682-7741, [email protected]

Lab 4: Calculate Beam Density
• Measure and estimate 95%-confidence-level uncertainties of
• Best estimate
• Power product? (yes or no)– Fill in blank – If all the , then ?
• How to find with ?
W
L
T
LT

Beam Length, LT
• Measure using a ruler or tape measure– In L4PP, ruler’s smallest increment is 1/16 inch
• Uncertainty is 1/32 inch (half smallest increment)
– In Lab 4 – depends on the ruler you are issued • May be different
• Assume the confidence-level for this uncertainty is 99.7% (3s)– The uncertainty with a 68% (1s) confidence level
• (1/3)(1/32) inch
– The uncertainty with a 95% (2s) confidence level• (2/3)(1/32) = 1/48 inch
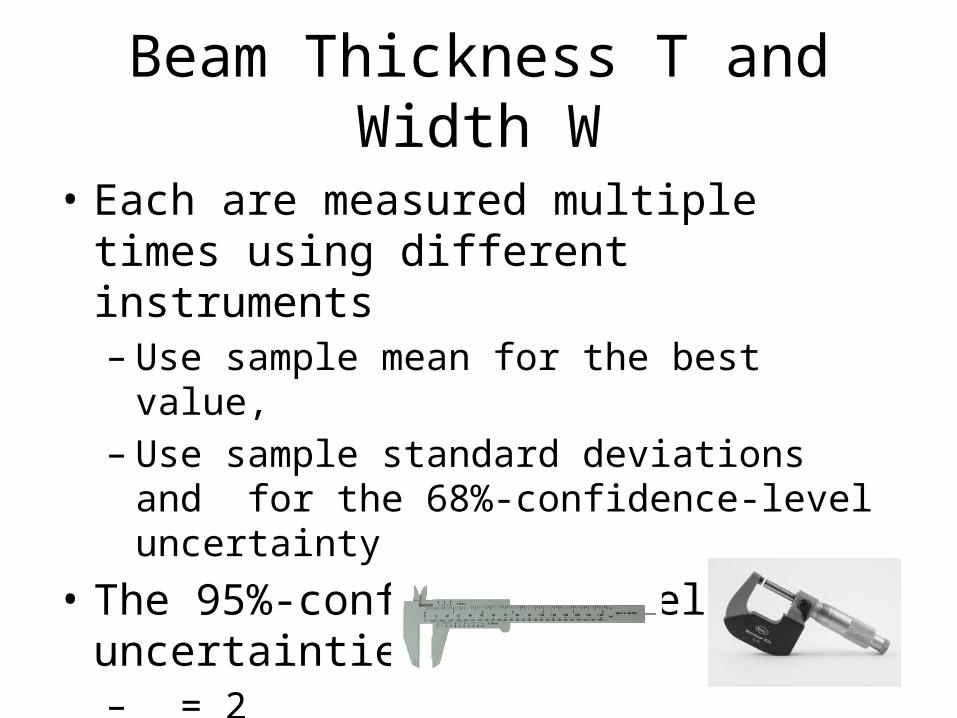
Beam Thickness T and Width W
• Each are measured multiple times using different instruments – Use sample mean for the best value, – Use sample standard deviations and for the 68%-
confidence-level uncertainty
• The 95%-confidence-level uncertainties are– = 2– = 2

Best Estimate Uncertainty
Confidence
Level
95%-Confidence Level Uncertainty
95%-Confidence Level Fractional
Uncertainty
Uncertainty Found From
Width, W [in]
0.9944 0.0012 0.68 0.0025 0.0025 Multiple Measurement
Thickness, T [in]
0.1862 0.0007 0.68 0.0013 0.007 Multiple Measurement
Length, L [in]
11 0.0313 0.997 0.0208 0.0019 Smallest Instrumental Increment
Total Length, LT [in] 25.125 0.0313 0.997 0.0208 0.0008 Smallest Instrumental
Increment
Gage Resistance,
R [Ω]120.2 0.1 0.997 0.0667 0.0006 Manufacture
Specified Value
Gage Factor 2.08 (1%)0.02 0.68 0.04 0.02 Manufacture
Specified Value
Mass, m [g]
207.4 0.1 0.95 0.1 0.0005 Smallest Instrumental Increment
Table 3 Aluminum Beam Measurements and Uncertainties

Show how to measure densities and uncertainties
*Bergman, T.L., Adrienne, S.L., Incropera, F.P., and Dewitt, D.P., 2011: Fundamentals of Heat and Mass Transfer. 7th ed. Wiley. 1048 pp.
The cited aluminum density is within the 95%-confidence level interval of the measured value, but the cited steel density is not within that interval for its measure value.
Aluminum SteelCalculated Density
[kg/m3] 2720 794895%-Confidence-
Level Interval [kg/m3] 21 60Cited Density*
[kg/m3] 2702 7854

Lab 5 Measure Elastic Modulus of Steel and Aluminum Beams (week after next)
• Incorporate top and bottom gages into a half bridge of a Strain Indicator– Power supply, Wheatstone bridge connections, voltmeter, scaled output
• Measure micro-strain for a range of end weights• Knowing geometry, and strain versus weight, find Elastic Modulus E of
steel and aluminum beams• Compare to textbook values

Set-Up
• Wire gages into positions 3 and 2 of a half bridge– e2 = -e3
• Adjust R4 so make V0I ~ 0
W
L
T
Strain IndicatormeR
SINPUT ≠ SREAL
From Manufacturer, i.e. 2.07 ± 1%
R3
e3
e2 = -e3

Procedure
• Record meR for a range of beam end-masses, m
• Fit to a straight line meR,Fit = a m + b
• Slope a = fn(E, T, W, L, SREAL/ SINPUT =1)
meFit = 921.3[mm/(m*kg)]m - 2.1283[mm/m]
-200
0
200
400
600
800
1000
0 0.2 0.4 0.6 0.8 1 1.2
Mic
rost
rain
Rea
din
g m
e R[m
m/m
]
Mass, m [kg]
E1E2 < E1
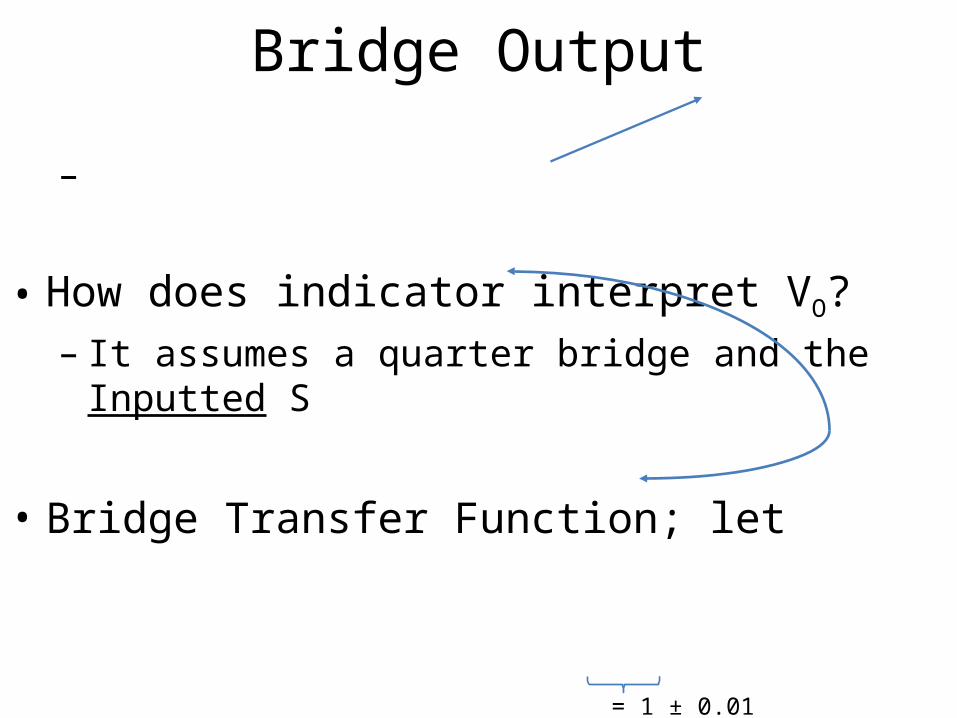
Bridge Output
–
• How does indicator interpret VO?– It assumes a quarter bridge and the Inputted S
• Bridge Transfer Function; let
= 1 ± 0.01

How to relate μεR to m, L, T, W, and E?
• Bending Stress: – M = bending moment = FL = mgL– Beam cross-section moment of inertia
• Rectangle:
• Measure strain at upper surface at y = T/2• Strain:
Neutral Axis
σ
y
m W
L
T
g

meFit = 921.3[mm/(m*kg)]m - 2.1283[mm/m]
-200
0
200
400
600
800
1000
0 0.2 0.4 0.6 0.8 1 1.2
Mic
ros
trai
n R
ead
ing
me R
[mm
/m]
Mass, m [kg]
Indicated Reading
– Units
• Best estimate of modulus, E
– = best estimate of measured or calculated value
Slope, a
Calculate value and uncertainty of E
• Is this a Power Product? (yes or no?)
– Fill in blank (FIB)• Find 95% (2σ) confidence level uncertainty
in E– Find ?% confidence level (? σ) uncertainties in
each input value

Strain Gage Factor Uncertainty
• In L5PP, manufacturer states• S = 2.08 ± 1% (pS not given)
– In Lab 4 and 5, the values of and wS may be different!
• In L5PP and Lab 5, assume pS = 68% (1 )s– So assume the 95%-confidence-level uncertainty is twice
the manufacturer stated uncertainty
• S = 2.08 ± 2% (95%) = 2.08 ± .04 (95%)• So (95%)

L, Between Gage and Mass Centers
• Measure using a ruler– In L5PP, ruler’s smallest increment is 1/16 inch
• Uncertainty is 1/32 inch (half smallest increment)
– Lab 5 – depends on the ruler you are issued • may be different
• Assume the confidence-level for this uncertainty is 99.7% (3s)– The uncertainty with a 68% (1s) confidence level
• (1/3)(1/32) inch
– The uncertainty with a 95% (2s) confidence level• (2/3)(1/32) = 1/48 inch

Beam Thickness T and Width W
• Each are measured multiple times using different instruments – Use sample mean for the best value, – Use sample standard deviations and for the 68%-
confidence-level uncertainty
• The 95%-confidence-level uncertainties are– = 2– = 2

Uncertainty of the Slope, a
• Fit data to yFit = ax + b using least-squares method
• Uncertainty in a and b increases with standard error of the estimate (scatter of date from line)–
meFit = 921.3[mm/(m*kg)]m - 2.1283[mm/m]
-200
0
200
400
600
800
1000
0 0.2 0.4 0.6 0.8 1 1.2
Mic
rost
rain
Rea
din
g m
e R[m
m/m
]
Mass, m [kg]
𝑠𝑦 , 𝑥

Uncertainty of Slope and Intercept“it can be shown”
• = (68%)• = (68%)
– Not in the textbook
• wa = ?sa (95%)
• Show how to calculate this next time


Plot result and fit to a line meR,Fit = a m + b
• Last lecture we found:
– where
meFit = 921.3[mm/(m*kg)]m - 2.1283[mm/m]
-200
0
200
400
600
800
1000
0 0.2 0.4 0.6 0.8 1 1.2
Mic
rost
rain
Rea
din
g m
e R[m
m/m
]
Mass, m [kg]

Propagation of Uncertainty• A calculation based on uncertain inputs
– R = fn(x1, x2, x3, …, xn)
• For each input xi find (measure, calculate) the best estimate for its value , its uncertainty with a certainty-level (probability) of pi –
– Note: pi increases with wi
• The best estimate for the results is:– …, )
• Find the confidence interval for the result–
• Find
𝑥

Statistical Analysis Shows
• In this expression– Confidence-level for all the wi’s, pi (i = 1, 2,…, n) must
be the same
– Confidence level of wR,Likely, pR = pi is the same at the wi’s
– All errors must be uncorrelated • Not biased by the same calibration error

General Power Product Uncertainty
• where a and ei are constants
• The likely fractional uncertainty in the result is– – Square of fractional error in the result is the sum of the
squares of fractional errors in inputs, multiplied by their exponent.
• The maximum fractional uncertainty in the result is– (100%)– We don’t use maximum errors much in this class

Lab 5 Measure Elastic Modulus of Steel and Aluminum Beams (week after next)
• Incorporate top and bottom gages into a half bridge of a Strain Indicator
• Record micro-strain reading for a range of end weights

Will everyone in the class get the same value as
• A textbook?• Each other?• Why not?
– Different samples have different moduli– Experimental errors in measuring lengths and masses
(due to calibration errors and imprecision)
• How can we estimate the uncertainty in (wE) from uncertainties in (wL), (wT), (wW), (wS), and (wa)?– How do we even find these uncertainties?