meadinbss through hbsbamch o0np-920358--1 … · of operation, designer/contractor ... the...
TRANSCRIPT
O0NP-920358--1MEADINBSS THROUGH HBSBAMCH
TI93 005401
LNG PLANTS IN THE U.S. AND ABROAD
byChristopher F. BlazekRichard T. Biederman
Paper Presented at
Society of Automotive Engineers
Liquefied Natural Gas TOPTEC Conference
Orlando, Florida
March 10 -11,1992
INSTITUTE OF GAS TECHNOLOGY
3424 South State Street - Chicago, Illinois 60616
. -..i./'.Oixi -•>-• THiS DOCUMENT tfi U^U'V
I G T
LNG Plants in the U.S. and Abroad
Presented at the
Society of Automotive Engineers
Liquefied Natural Gas TOPTEC Conference
March 10-11,1992
Orlando, Florida
by Christopher F. Blazek and Richard T. Biederman
Institute of Gas Technology
Abstract
The Institute of Gas Technology recently conducted a comprehensive survey of LNG
production and storage facilities in North America. This survey was performed as part of IGT's LNG
Observer newsletter which covers both domestic and international LNG news, reports on LNG related
economics and statistics, and routinely conducts interviews with key industry leaders. In addition to
providing consulting services to the LNG industry, IGT has co-sponsored the International
Conference on Liquefied Natural Gas for the part 20 years.
The objective of this paper is to present a summary of our recent survey results as well as
provide an overview of world LNG trade. This information is important in assessing the potential
near term availability of LNG for transportation applications. The IGT LNG Survey appraised the
capacity and current market activity of LNG peak shaving, satellite storage, and import receiving
facilities in the United States and Canada. Information was requested from facilities on three main
topics: liquefaction, storage, and regasification. Additional questions were posed regarding the year
of operation, designer/contractor for liquefaction cycle and storage, source of LNG (for storage-only
facilities), plans for expansion, and level of interest in providing LNG as a vehicle fuel. The IGT
LNG Survey has to date received information on 56 LNG peak shaving facilities, 28 satellite storage
facilities, and 4 LNG import receiving terminals.
LNG Production: A Historical Perspective
During the 1850's Kelvin and Joule discovered that gases experience temperature changes
during throttling. This discovery led the way to the production of cryogenic fluids (cryogenic is
defined as less than -100 °C). Faraday is reported to have first liquefied methane about 1855 during
the same period that he experimented with the liquefaction of air and its constituents, as well as
hydrogen. The first attempt to exploit LNG appears to belong to Russia. Around 1935 the
I N S T I T U T E O F G A S T E C H N O L O G Y

Ukrainian authorities decided to utilize the natural gas discovered in the south of the country, near
the Sea of Azov. The area, located a great distance from the oil wells of the North Caucases, lacked
fuel for transportation. The idea of using LNG for agricultural machinery evolved. Experimental
work was started at Kharkov and Dnyepropetrosk; a LNG storage tank was built and experiments
were conducted with methane carburetors to test the use of LNG on tractors. The liquefaction plant
employed an ethylene-methane cascade with power consumption of about 450 hp/10 ft of natural
gas liquefied.
At approximately the same time, the first plant for separating helium from natural gas was
constructed in Amarillo, Texas by the U.S. Bureau of Mines. The process involved liquifying
methane on a large scale, separating the helium, revaporizing the methane and then passing it into a
pipeline for fuel gas distribution. This process provided pipeline operators with the prospect of
liquefaction as a method for large-scale peak-load storage.
The first large-scale use of liquefaction by the gas industry, prior to World War II, was the
peak-shaving plant constructed in 1941 by the East Ohio Gas Co. in Cleveland, Ohio. The disastrous
loss of this plant in 1944 (200 fatalities) delayed further consideration of similar installations for some
years. The cause of this loss was the failure of one of the LNG storage tanks and lack of adequate
containment. This problem has been corrected for all modern LNG plants.
The next liquefaction and storage plant for peak-shaving was designed and the components
largely fabricated by Dresser Industries of Dallas, Texas for use in Russia under the Land-Lease Act.
In 1947, the liquefaction plant components were delivered to a site near Moscow, but before the plant
could be erected or the storage tanks delivered, the Land-Lease Act was terminated. The
liquefaction plant construction was then completed by Russian engineers who also designed and built
the LNG storage tanks. The designs resembled those devised by Dresser Industries.
The Dresser/Russian liquefier, similar in design and capacity to the East Ohio Gas Co. facility,
was not commissioned until 1954 and then operated on an experimental basis for 2 years due to
limited liquid storage capacity. During this period, work involving LNG as a motor fuel was initiated
and a prototype converted vehicle proved so successful that a decision was made to convert a fleet of
100 vehicles.
The second major development in the growth of LNG technology was the decision by the
British Gas Council in 1963 to transport LNG from Algeria to England to help meet the energy needs
of their growing economy. The first commercial cargo of LNG arrived at Canvey Island in the UK
from Algeria on October 12, 1964 on the Methane Princess. The basic idea was proved sound; better
materials of construction, new storage methods and safer handling techniques contributed to the
success of this concept. The demonstrated feasibility of ocean transport of LNG spawned a host of
similar projects that benefited other areas of the world to a far greater extent than first anticipated.
N S T I T U T E O F G A S T E C H N O L O G Y

U.S. LNG Peak Shaving Plants
Based on the technology advances of the early 60's a rapid growth in the LNG industry
occurred during tne next decade (1968 to 1978). During this periou over 50 LNG peak shaving
facilities were constructed in North America alone, and nearly 70 worldwide. In the United States,
LNG plants were constructed primarily for peak shaving operations. Peak shaving is a method used
by local gas distribution companies to supplement pipeline supplied natural gas. Peak shaving
generally supplies a limited amount of gas during short term extreme cold weather periods. This
method has proven to be an attractive alternative to increasing natural gas transmission line capacities
to meet peak seasonal demand. In addition, the availability of alternative supply options offer the
utilities a degree of operating flexibility. These LNG liquefaction plants may also serve satellite LNG
storage facilities. These satellite storage plants assist in gas distribution during peak shaving periods.
Other peak shaving methods available to the utilities include propane/air peak shaving and synthetic
natural gas (SNG) peak shaving. SNG was primarily produced by the partial oxidation of naphtha.
Currently LNG peak shaving accounts for nearly 85% of all peak shaving sendout in the U.S. while
propane/air is the chief alternative. SNG peak shaving is presently used only in Hawaii.
The liquefaction of natural gas is a mature industry in the U.S. Periodically, the Institute of
Gas Technology surveys existing North American LNG facilities as a means of monitoring the
industry. Recently IGT updated its LNG Survey. This survey appraised the capacity and current
market activity of LNG peak shaving, satellite storage, and import receiving facilities in the United
States and Canada. Information was requested from facilities on three main topics: liquefaction,
storage, and regasification. Additional questions were posed regarding the year of operation,
designer/contractor for liquefaction cycle and storage, source of LNG (for storage-only facilities),
plans for expansion, and level of interest in providing LNG as a vehicle fuel.
Survey Results
The IGT LNG Survey contains information on all 56 LNG peak shaving facilities, 28 satellite
storage facilities, and 4 LNG import receiving terminals in the U.S. and Canada. In some cases,
recent information was provided available and data reported is replicated from IGT's previous 1989
survey. In addition, the survey contains information on a number of facilities that are not currently
operating; reasons for shutdown include mechanical maintenance, lack of demand for LNG peak
shaving, and expansion/retrofitting. As can be seen in Figure 1, the average first year of operation for
LNG facilities in the survey was 1973. The range of years of construction extend from 1965 to 1991.
Among peak shaving plants in the U.S. with on-site liquefaction equipment, the type of
liquefaction cycle was found to be the following: 41% of facilities use mixed refrigerant cascade
(MRC) or mixed refrigerant liquefier (MRL), 31% reported expander-type liquefiers, 15% use
cascade or modified cascade, and 6% reported "other" liquefaction cycles such as integrated cascade
3
I N S T I T U T E O F G A S T E C H N O L O G Y
refrigeration or dual Joule-Thompson (J.T). A number of facilities reported having more than one
type of liquefaction cycle currently in use. Major liquefaction process designers include Chicago
Bridge & Iron (CBI) with a 30% market share, Air Liquide (16%) and Pritchard (14%), while storage
contractors were CBI with a 60% share and Pittsburgh-Des Moines (PDM) with a 34% share.•2
Peak shaving facilities in the U.S. operated by utilities range in size from 13,395 Nm /day
(inlet natural gas capacity) for a singe train dual J-T cycle unit to 388,455 Nrn /day (gas) for a single
train mixed refrigerant cycle. As shown in Figure 2, the typical facility in the U.S. has a liquefaction
production capacity between 35 and 1,196 Nm /day (liquid). The LNG facility with the largest
liquefaction capacity is operated by the Philadelphia Gas Co. These facilities typically include gas
purification equipment, liquefaction trains, storage tanks, vaporizers, and boil-off recovery.
Due to the cryogenic conditions required for LNG production (-260 °F) a number of natural
gas constituents may solidify, causing fouling and plugging problems. These constituents are removed
prior to liquefaction using a number of techniques. For instance, a molecular sieve synthetic zeolite
adsorbent dehydrator would be used to lower the dew point of the incoming gas to between -100 and -
150 °F. Although water and carbon dioxide are the primary constituents which must be removed
from natural gas, other unwanted compounds that may be present must also be removed. These
include glycol, amines, oxygen, methanol, heavy straight chain hydrocarbons, hydrogen sulfide and
odorants. A representative range of design inlet natural gas composition is presented in Table 1. As
can be seen the most stringent requirements are for oxygen and the heavier hydrocarbons (butane +).
Other major constituents such as carbon dioxide and water are removed in the gas conditioning
operation. The composition of the final LNG output is therefore markedly different from the inlet
natural gas composition. Table 2 presents a typical LNG composition produced by a LNG peak
shaving facility. As can be seen the LNG consists primarily of methane and ethane. The remaining
constituents are heavier hydrocarbons and traces of nitrogen.
Plant utilization for surveyed facilities was classified into two groups: liquefaction equipment
utilization and regasification facility utilization. The overall utilization rate for liquefaction
equipment was estimated to be 86% among facilities that operated in 1990 (facilities not operating in
1990 were excluded from the averaging calculation). Utilization rate for regasification equipment
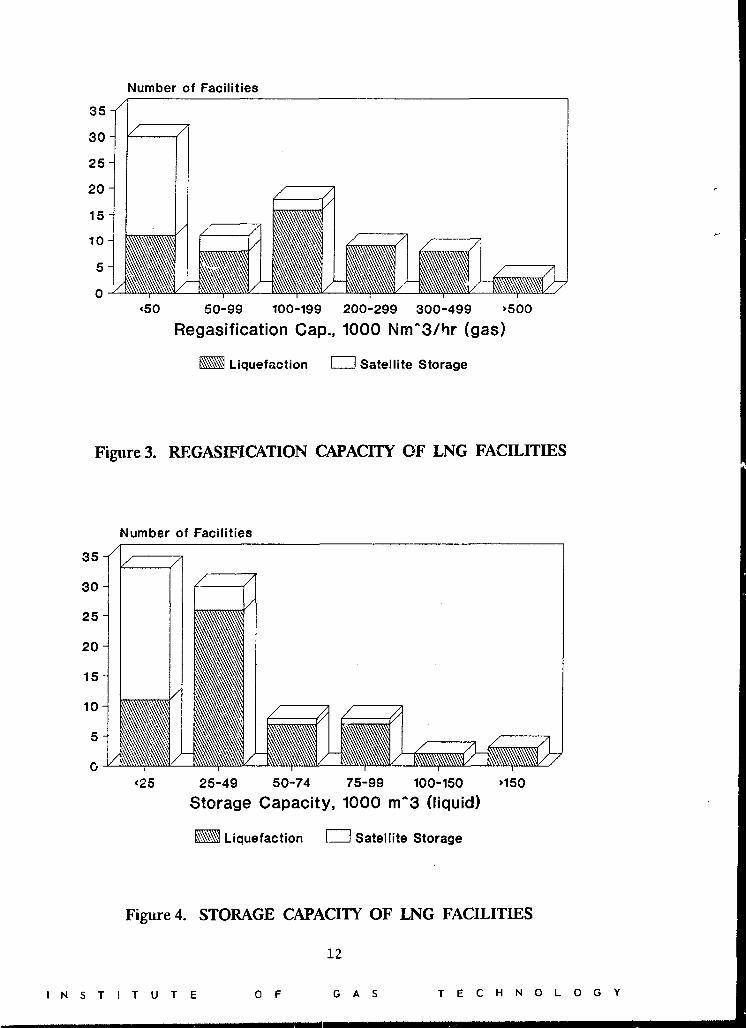
was 51% among facilities operating in 1990. As presented in Figure 3, regasification capacity ranges•2 o
from as low as 4,020 Nm /hr to 637,200 Nm /hr. As would be expected most of the satellite facilities
have regasification capacities below 50,000 Nm /hr while the liquefaction plant regasification capacity
is distributed across the entire range. Regasification capability is provided by direct-fired, submerged,
shell and tube, or other type of regasifier. Typically, multiple regasifiers are installed at each facility
to meet demand surges and to provide redundancy in the event of failure.
I N S T I T U T E O F G A S T E C H N O L O G Y

Table 1. Range of Inlet Gas Compositions for Peak Shaving LNG Plants.
(Composition presented as volume % unless noted otherwise)
ComponentMethaneEthanePropaneIso-butaneN-butaneN-pentaneHexaneWaterNitrogenOxygenCarbon DioxideTotal Sulfur
Range81.3 - 97.52.0 - 7.00.27 - 3.00.03 - 0.320.01 - 0.250.01 - 0.900.02-0.17
3.5 - 20 #/MMcf0.26 -10.00 -10 ppm0.47 -1.50
0 -1.2 #/MMcf
Table 2. Typical Peak Shaving Plant LNG Composition.
Component Volume %
MethaneEthanePropaneIso-butaneN-butaneIso-pentaneN-pentaneHexane +Nitrogen
95.34.10.430.040.040.010.010.050.02
LNG for the regasification operation is supplied from on-site storage, both at liquefaction
plants and satellite storage facilities. As presented in Figure 4, on-site storage capacity ranges from
209 vcr at the smallest satellite facility to 186,086 mJ at the largest liquefaction facility and nearly
300,000 m at the largest U.S. import receiving terminal at Lake Charles, LA. As would be expected,
the satellite facilities have the least amount of storage.
Among LNG satellite storage facilities the average distance from the source of LNG was 150
miles. However, one respondent indicated an LNG shipping distance of 1050 miles. LNG
transporters are semi-trailer cargo haulers and are regulated by a number of agencies. They are
frameless trailers with a sub-frame for the running gear with a bolted 5th-wheel plate. The LNG tank
design is based on cryogenic technology used to transport liquefied gases such as nitrogen, oxygen,
hydrogen, etc. The tanks are jacketed vessels with an ASME coded inner pressure vessel. The
jacketed casing provides vacuum and insulation- and structural support for the trailer (similar to the
design of LNG storage tanks). The cryogenic inner vessel is fabricated from stainless steel, nine
percent nickel steel, or aluminum alloys. These materials exhibit the required minimum impact
5
I N S T I T U T E O F G A S T E C H N O L O G Y

strength at sub-zero temperatures. For safety in handling the LNG, air-operated shut-off valves are
used in combination with manual valves on all liquid lines. Insulated tank trucks are covered by a
number of standards including CGA-341.
LNG transporters range in size from 6,000 to 12,500 U.S. gallon capacity. LNG transport by
road has matured and has a good safety record with millions of miles and no fatalities. As an
example, in 1982 Distrigas operated 68 trailers of double-tank construction with evacuated perlite
insulation. The trailers were constructed by Process Engineering, J. Russel Engineering Works,
Ryan Ind. and Lox Equipment Co. These trailers transported on average 206.64 million gallons of
LNG an average of 1 million miles per year with over 18,900 average loadings per year.
Satellite storage facilities can be either field erected or shop fabricated as presented in
Figure 5. Smaller storage facilities are shop fabricated using one or several tanks with LNG
capacities of 190 to 209 m . Larger storage tanks are field erected and range from 1,590 to 95,500 m
liquid volume. Shop Fabricated LNG storage tanks which would be installed at fleet sites would
typically be of the jacketed type with an ASME coded inner pressure vessel. The jacket provides
vacuum and insulation along with structural support and isolation of the cryogenic inner vessel. LNG
tanks range in the size from 5.68 m to 209 m capacity. Smaller tanks are designed for operating
pressures of up to 150 psi. This higher operating pressure eliminates the need for sendout pumps
and boil-off compressors.
Materials of construction for the tank are selected on the basis of service temperature,
operating conditions and economics. The jacket casing may be fabricated from low carbon steel that
conforms to ASME pressure vessel specifications. Piping is usually stainless steel for both inside and
outside connections to the tank. Valves are also stainless steel and all liquid lines must have safety
shut-off actuators for local and remote control. Larger field erected metal tanks have been
constructed with capacities of up to 200,000 m . These types of tanks would be used at satellite,
peak-shaving and base load facilities.
Regasification units are typically operated well below capacity; this reflects a large installed
capacity which is designed to provide peak shaving operators with the ability to meet very large surges
in gas demand. These surges typically occur during the heating season and are weather dependant.
Liquefaction equipment, on the other hand, typically operates more than six months of the year and is
not designed to meet brief surges in demand. Storage operations are usually managed to be full at
the start of the heating season and near depletion by spring. During warm winters it is not
uncommon to see no utilization of the LNG peak shaving facility. As shown in Figure 6, yearly
sendout plant day utilization for the total U.S. can range from 400 to nearly 750 days per year. The
average for each individual plant, however is typically near 10 sendout plant days per year with only a
few operators reporting average yearly plant utilizations of more than 20 sendout days. Individual
I N S T I T U T E O F G A S T E C H N O L O G Y

plants reported yearly sendout days for the period of 1984 to 1989 ranging from 0 to 200 days per
year.
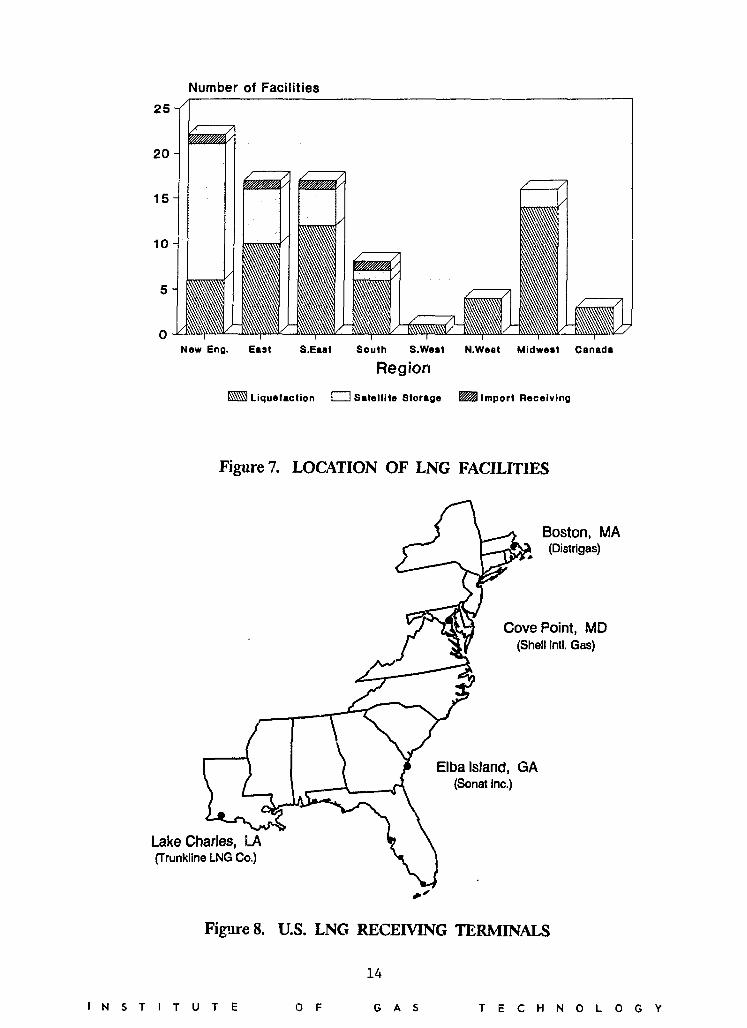
As presented in Figure 7, many of the LNG facilities surveyed are located along the east coast
of the U.S. Furthermore, a majority of the satellite storage facilities are located in the New England
States. The next largest concentration of LNG facilities is in the Midwest, followed by the South with
only a handful of facilities in the West and Canada. The best opportunity for large scale availability
of LNG is from the 4 LNG receiving terminals located operated by Distrigas in Boston,
Columbia/Shell at Cove Point, MD., Sonat at Elba Island, GA., and by Trunkline LNG in Lake
Charles, LA. as shown in Figure 8. Table 3 presents a summary of the annual volume, storage and
regasification capacity of these facilities. As can be seen, the combined projected maximum annual
LNG capacity of these four facilities is over 15 million cubic meters.
Table 3. U.S. Import/Receiving Terminals
Company & LNG Source SL StoragePlant Site Annual Vol., m- Capacity, m-
Regasificatjpn Year ofCapacity, m-/hr Operation
Columbia LNG/Shell Oil Co.
Cove Point, MD.
DistrigasEverett, MA.
Southern EnergyElba Island, GA
Trunkline LNGLake Charles, LA
Algeria4,250,000
(projected)
Algeria2,000,000
(maximum)
N/A
Algeria6,900,000
(maximum)
238,500
154,850
189,000
286,113
1,180,000
315,000
637,000
825,000
1977
1971
1977
1982
Based on the LNG production capacity of the existing peak shaving plants surveyed, the
availability of LNG for the transportation market appears limited. Given a typical plant with a•7
250 m /day LNG production capacity and assuming that roughly 50% of this capacity could be
diverted to the transportation fuels market, the facility would only be capable of providing the
equivalent of just over 20,000 gallons of gasoline on a daily basis. This certainly could sustain a large
heavy duty vehicle fleet or several demonstration programs. However, large LNG market expansion
could not be supported by existing perk shaving plants. Furthermore, very few LNG facilities in our
survey reported having any near term plans for expansion. In fact, many of the plants, especially the
import receiving terminals were idle during much of the 1980's. Most expansion plans involve
installing additional vaporizers or pumps to enhance sendout reliability, or expanding regasification
piping. No large-scale facility expansions involving additional liquefaction capacity are currently
underway. On a brighter note, many respondents to IGT's survey indicated a great interest in7
I N S T I T U T E 0 F G A S T E C H N O L O G Y

providing LNG to vehicle refueling stations. This desire was particularly strong among large, under-
utilized facility operators. While most respondents were somewhat skeptical about prospects for a
significant LNG vehicle fuel market in the near future, several are already involved in demonstration
projects or are actively marketing to fleet operators in their service territory. Some respondents
believe that the vehicle fuel market is the only significant expansion opportunity on the horizon for
LNG. Areas of possible market penetration include transit buses, class 7 and 8 trucks, locomotives,
and ferries.
Activity has picked up recently for LNG import receiving terminals. Both the Trunkline
LNG and Distrigas LNG receiving terminals are in operation. Deliveries of Algerian LNG may
eventually resume to the mothballed terminal at Cove Point, Maryland, which received its last cargo
in 1980. This terminal is owned by Columbia Gas Systems, Inc., and the Shell Oil Co. However,
Columbia has announced its intention to get out of the LNG business, following its filing for
bankruptcy protection. Shell has an option to purchase the remaining shares and is currently
renegotiating its agreement to import 4 million cubic meters of LNG from Algeria, originally
scheduled to begin in 1993. After the LNG is regasified it could be marketed to pipelines,
distribution companies, and large industrial users. Three major interstate pipelines connect with the
terminal: Columbia Gas Systems, Transcontinental Gas Pipe Line, and Consolidated Natural Gas. A
fourth receiving terminal, Southern Energy's facility on Elba Island, Georgia, remains closed.
However, discussions are underway to possibly reopen this facility by 1994 to service the expansion of
Florida Gas Transmission Co.'s proposed pipeline expansion into Florida.
In addition to the contiguous U.S. LNG facilities, an LNG production facility is located in
Kenai, Alaska. This facility, operated by Phillips-Marathon, produces approximately 1 million metric
tons per year of LNG for export to Negishi, Japan. A second Alaskan LNG production facility is
currently in the planning stage. This facility, by Yukon Pacific Corp., will export Alaska's North
Slope natural gas via the planned Trans-Alaska Gas System (TAGS) to Anderson Bay where it will be
liquefied for export to Pacific Rim countries.
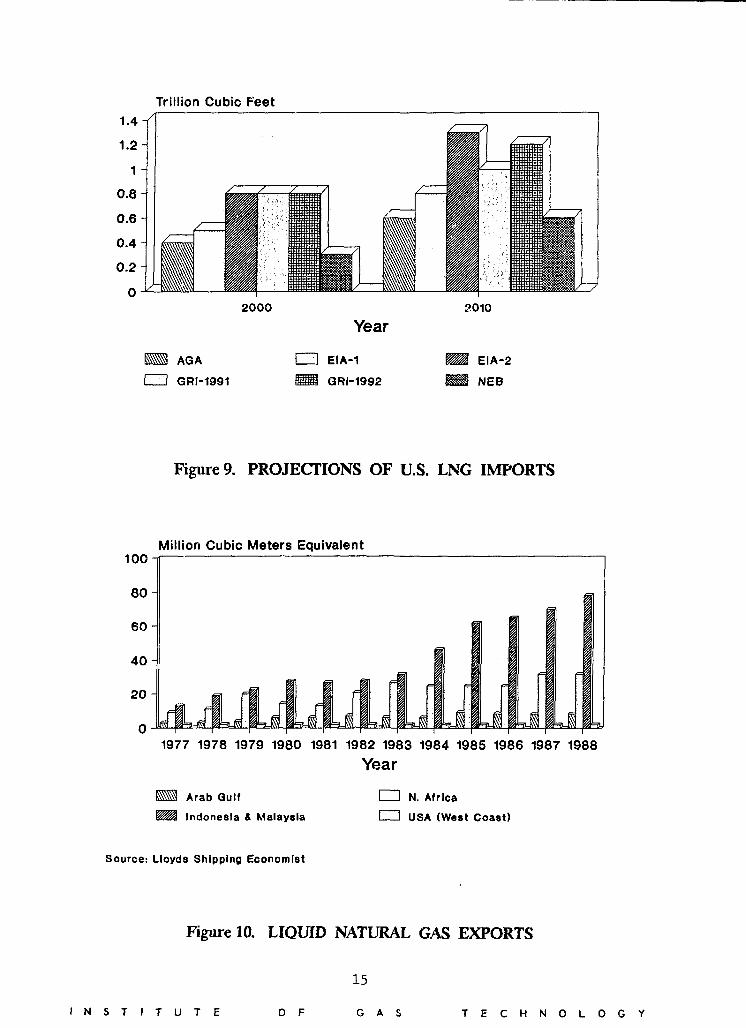
In general the future market growth for LNG in the U.S. looks bright. As presented in
Figure 9, LNG utilization in the U.S. is projected to increase dramatically over the next two decades.
Forecasts of LNG imports have been prepared by the American Gas Association, US Energy
Information Administration, Gas Research Institute, and the National Energy Board of Canada.
These estimates are compared here for two years: 2000 and 2010. The US EIA projects the largest
level of LNG imports - 0.8 and 1.3 trillion cubic feet (TCF) in 2000 and 2010, respectively. This is an
increase from z previous EIA projection of 0.5 and 0.8 TCF. The Gas Research Institute, in their
1992 forecast, is projecting 0.8 and 1.2 TCF. This represents an increase from their 1991 forecast of
0.8 and 1.0 TCF. GRI's new projections are based upon a belief that average city gate prices for
LNG will rise from $2.31 per million Btu in 1990 to $3.44 by 2000 and $4.87 by 2010. GRI further
8
I N S T I T U T E O F G A S T E C H N O L O G Y

believes that an LNG price of $3.50 per million Btu represents a threshold, and that when this price is
exceeded LNG capacity expansion will become feasible. The National Energy Board of Canada
anticipates more modest growth of LNG imports, to .3 and .6 TCF in 2000 and 2010, respectively.
NEB cites factors such as LNG import capacity constraints and a lack of deepwater ports suitable for
new LNG receiving terminals. Furthermore, NEB believes that exporting nations will not build
additional facilities if LNG prices are below 80% of crude oil prices. Forecasts by the American Gas
Association are below GRI's but slightly above NEB's, with LNG imports projected to be .4 and .6
TCF in 2000 and 2010, respectively.
International LNG Trade
There are currently 17 operational base-load LNG plants in the world. Table 4 summarizes
the international LNG trade that these plants supported in 1990. As can be seen, the four largest
LNG exporting countries (Indonesia, Algeria, Malaysia, and Brunei) account for neaily 86% of the
world's LNG export production. In terms of importing countries, Japan dominates the demand for
LNG with nearly two-thirds of the world market followed by France, a distant second. The United
States accounted for only 2% of the world production and 3.35% of the world demand. Total
production/demand in 1990 was 53.019 million metric tons. This represents a 13% growth from 1989.
This growth is related to the start-up of contracts between Pertamina and the Chinese Petroleum
Corp. of Taiwan, which received 12 cargos in 1990; the first complete year for exports from Australia
to Japan; and the first full year of the Sonotrach-Trunkline project. Furthermore, this growth
occurred despite the end of three projects: deliveries from Algeria (Arzew) to France (Le Havre),
spot sales by Algeria to Japan, and export from Libya to Italy.
Table 4. 1990 International LNG Trade (million metric tons)
Exporting CountryIndonesiaAlgeriaMalaysiaBruneiAustraliaAbu DhabiUnited StatesLibya
Production20.35213.9866.2645.2172.9052.2911.0570.947
%
38.3926.3811.819.845.484.321.991.79
Importing CountryJapanFranceSpainBelgiumKoreaUnited StatesTaiwanUnited KingdomItaly
Demand35.0836.8643.3182.9232.2811.7750.7720.0360.017
%
66.1712.956.265.514.303.351.360.070.03
As can be seen in Figure 10, world wide LNG exports have increased steadily since 1977.
Indonesia and Malaysia represent the largest growth in production and exports. Figure 11 presents
LNG import statistics for the same period. As would be expected, Japan dominated the demand
growth in this period.
N S T I T U T E 0 F G A S T E C H N O L O G Y

The delivered cost for LNG can vary significantly depending on the contract terms, competing
energy prices, shipping distance and quantity delivered. Figure 12 presents the historical cost of LNG
imported to Japan, the largest market, relative to world crude oil prices. This figure indicates that
LNG prices have closely tracked crude oil prices from 1975 to 1988. October 1991 prices in the
Asian LNG market varied from $3.21 to $3.74/mmBtu. These prices represent a gradual decline in
LNG prices which tracked the reduction in world crude prices during 1991.
Figure 13 presents the supply/demand conditions for LNG tankers during the period of 1980
to 1988, and shows that tanker capacity exceeded demand. Of the 65 LNG tankers available during
that period, 10 were laid-up during part or all of the period. Currently there are 71 LNG tankers
with 19 new tankers on order. New tanker orders have recently been placed by Japan to meet future
LNG demand in that country. New vessels coming on-line have a capacity of 125,000 m or larger
and a speed of approximately 20 knots. Older vessels are typically declassified after 25 years of
service
International trade of LNG is projected to increase significantly during the next two decades
as shown in Figure 14. The environmental benefits and availability of natural gas are expected to
drive market growth. In addition, the growing diversity of LNG supply sources should ensure long-
term stability in the international market. Western Europe, Japan, and the U.S. represent the largest
growth markets. While Algeria and Indonesia are dominant in international export markets (as
shown in Table 4), countries such as Nigeria, Papua New Guinea, China, Qatar, Norway, and
Venezuela are expected to play an increasing role in meeting the projected future demand for LNG.
Growth of the international LNG market is currently constrained by shipping capacity rather than by
liquefaction capacity or demand. However the cost of new liquefaction facilities (up to $2 billion
dollars each) as well as new tankers (around $250 million each) may also constrain supply. This is a
particular problem for the United States due to the shipping distance involved from major exporting
nations.
In terms of natural gas supply for LNG facilities, Figures 15 and 16 show that sufficient world
wide natural gas reserves exist to meet long term demand. World proven reserves amounted to over
4,200 TCF in 1990. This is divided between Western Europe with nearly 2,000 TCF (including the
former U.S.S.R.), the Mideast with over 1,300 TCF, and North America with nearly 350 TCF. In
comparison, the U.S. natural gas demand in 1991 was roughly 19 TCF. World wide natural gas
resources are currently so abundant that considerable quantities of gas are currently reinjected,
vented or flared. As presented in Figure 16, nearly 11.8 TCF were reinjected, vented or flared during
1990. Reinjection rates are high in the U.S. (Alaska), Algeria, Indonesia, Canada and Norway.
Nearly 1.4 TCF was flared or vented in Russia and Nigeria alone.
10
I N S T I T U T E O F G A S T E C H N O L O G Y

Number of Facilities20 -f
1 5 -
1 0 -
5 -
1965 1967 1969 1971 1973 '975 1977 1979 1981 1983 1985 1987 1989 1991
Year of Original Construction
i Liquefaction CD SiUlllto Storig* ^ I m p o r t Receiving
Figure 1. YEAR OF CONSTRUCTION FOR LNG FACILITIES
Number of Facilities
25
20
15
1 0 -
5 -
<100 100-299 300-499 500-699 700-1000 >1000
Liquefaction Capacity, m"3/day (liquid)
Figure 2. LIQUEFACTION CAPACITY OF LNG FACILITIES
11
N S T I T U T E 0 F G A S T E C H N O L O G Y
Number of Facilities
<50 50-99 100-199 200-299 300-499 >500
Regasification Cap., 1000 NirT3/hr (gas)
Liquefaction ! Satellite Storage
Figure 3. REGASIFICATION CAPACITY OF LNG FACILITIES
Number of Facilities
<25 25-49 50-74 75-99 100-150 >150
Storage Capacity, 1000 rrr3 (liquid)
SSM Liquefaction I j Satellite Storage
Figure 4. STORAGE CAPACITY OF LNG FACILITIES
12
I N S T I T U T E 0 F G A S T E C H N O L O G Y

Number of Facilities Storage Capacity, 1000 m"3
Field Erected
Number of Facilities
Shop Fabricated
Storage Capacity
500
400
Figure 5. TYPE OF STORAGE AT LNG SATELLITE STORAGE FACILITIES
or\f\BOO
600
400
200
Liquefaction Plant
-
-
t
Days
"•-+'
i
Gas
*
Sendout, Bcf
-
~ ; -.
-
-
1984/85 1985/86 1986/87 1987/88Heating Season - Years
Liq. Plant Days Gas Sendout, Bcf
Source: G.F. Stelntnetz
16
.14
12
10
8
6
4
2
1988/89
Figure 6. LNG PEAKSHAVING ACTIVITY IN THE U.S.
13
I N S T I T U T E 0 F G A S T E C H N O L O G Y
Number of Facilities
New Eng. East S.East Souih S.West N.Weat Midwest Canada
Region
Liquefaction I I Satellile Storage W2& Import Receiving
Figure 7. LOCATION OF LNG FACILITIES
Lake Charles, LA(Trunkline LNG Co.)
Boston, MA(Distrigas)
Cove Point, MD(Shell Intl. Gas)
Elba Island, GA(Sonat Inc.)
Figure 8. U.S. LNG RECEIVING TERMINALS
14
I N S T I T U T E 0 F G A S T E C H N O L O G Y
Trillion Cubic Feet
2000 2010
1 1 AGA
CUD GRI-1991
Year
CZ3 EIA-1
GRI-1992
EIA-2
NEB
Figure 9. PROJECTIONS OF U.S. LNG IMPORTS
100-Million Cubic Meters Equivalent
1977 1978 1979 1980 1981 1982 1983 1984 1985 1986 1987 1988
Year
Arab Gulf
Indonesia 4 Malaysia
IZIl N. Africa
EZ3 USA (West Coast)
Source: Lloyds Shipping Economist
Figure 10. LIQUID NATURAL GAS EXPORTS
I N S T I T U T E 0 F
15
G A S T E C H N O L O G Y

80
60
40
2 0 -
Million Cubic Meters Equivalent
=M_
§
Ii I
1S77 1978 1979 1980 1981 1982 1983 1984 1985 1986 1987 1988Year
USA I I Europe Japan
Source: Lloyds Shipping Economist
Figure 11. LIQUID NATURAL GAS IMPORTS
$/MMBtu
1975 1976 1977 1978 1979 1980 1981 1982 1983 1984 1985 1986 1987 1988
LNG (Japan) + Crude Oil (IEA)
Source: BP Statistical Review, 1988
Figure 12. HISTORICAL LNG / CRUDE OIL PRICING
16
I N S T I T U T E 0 F G A S T E C H N O L O G Y

Million Cubic Meters Equivalent
Supply " Demand
Source: Lloyds Shipping Economist
1987 1988
Figure 13. LNG CARRIER SUPPLY / DEMAND
Million Tons of LNG160
140
120-
100-
80-
60
40
20 H
79
62
I
103
74
115
81
1996-L 1986-H 2000-L SOOO-H SOOG-L 2006-H
Year, Low/High EstimateKSSj.pin CDs. Kor** Mother CZHw. Europ*
Source: Shell International Gas
130
88
2010-L 2010-H
Figure 14. WORLD LNG DEMAND FORECAST
I N S T I T U T E O F
17
G A S T E C H N O L O G Y

Billion SCF3000-
2500-
2000-
1500-
1000
500
IJ I
N.America S.America Europe Africa Mideast Far E i ' - Oceania
RegionES3ReinJected C3 Vented * Flared
Source: IQT Energy Statistics 1991
Figure 15. WORLD NATURAL GAS USED FORREINJECTION OR VENTED & FLARED
Trillion Cubic Feet (TCF)
2000-f
1500-
1000-
500-
Current Annual US Consumption • 19 TCF
N.America S.America Europe Africa Midaaat
RegionSource: Oil & Qas Journal
Far Eaal Oceania
Figure 16. WORLD PROVED NATURAL GAS RESERVES
18
I N S T I T U T E O F G A S T E C H N O L O G Y

Terminology and Conversion Factors
ScfINm3
McfMMcf
MMcf/dBcfTcflMT/y
(Gasoline)Gal Equiv.
= Standard Cubic Foot= Normal Cubic Meter= 35.31 Standard Cubic Feet= 264.2 Gallons of LNG= 0.431 Metric Tons of LNG= 21,830 Scf of Natural Gas= Thousand Cubic Feet= Million Cubic Feet= 0.0283 Million Cubic Meters= Million Cubic Feet per Day= Billion Cubic Feet= Trillion Cubic Feet= Million Tonnes (metric tons) per Year= 1.35 Billion Cubic Meters per Year= 52.9 Billion Cubic Feet per Year
= 1.4 Gallons of LNG
1 Therm115.7 Scf of Natural Gas0.858 Gallons LNG (1034 Btu/Scf gas)
I N S T I T U T E 0 F
19
G A S T E C H N O L O G Y