mean annual runoff in the upper ohio river basin, 1941 - usgs
TRANSCRIPT
Mean Annual Runoff in the Upper Ohio River Basin, 1941-70, and its Historical Variation
By ROBERT M. BEALL
GEOLOGICAL SURVEY WATER-SUPPLY 2042
UNITED STATES GOVERNMENT PRINTING OFFICE, WASHINGTON : 1978
UNITED STATES DEPARTMENT OF THE INTERIOR
CECIL D. ANDRUS, Secretary
GEOLOGICAL SURVEY
V. E. McKelvey, Director
Library of Congress Cataloging in Publication DataBeall, Robert M.Mean annual runoff in the upper Ohio River basin, 1941-70, and its historicalvariation. (Geological Survey water-supply paper; 2042)Bibliography: p.Supt. of Docs. no.: 119.13 :2042I. Runoff Ohio River watershed. I. Title.II. Series: United States. Geological Survey. Water-supply paper; 2042. GB991.03B4 551.4'98 76-608217
For sale by Superintendent of Documents, U.S. Government Printing Office Washington, D.C. 20402
Stock Number 024-001-03032-2
CONTENTS
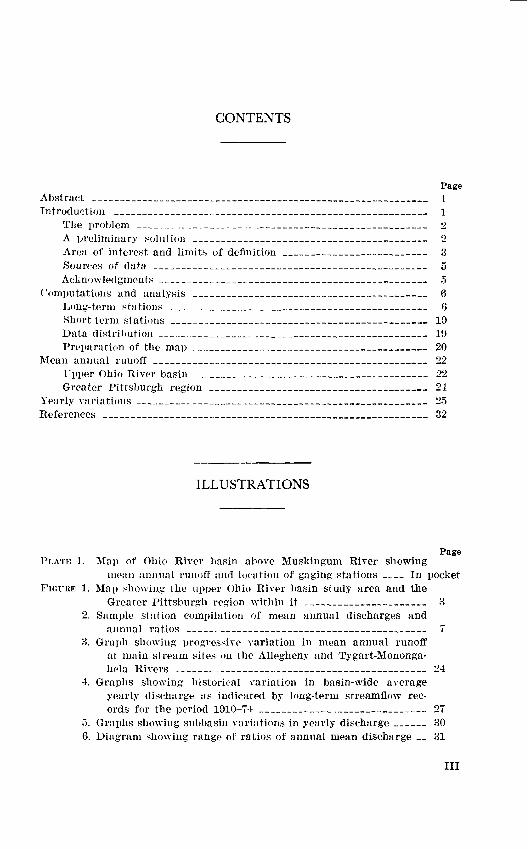
PageAbstract _________________ ___ _____________ 1Introduction _________________________________ 1
The problem _____________________________________ 2A preliminary solution _______________________ _ 2Area of interest and limits of definition ______________ 3Sources of data ________________________________ 5Acknowledgments ___________________ __ _ 5
Computations and analysis _______________ _ 6Long-term stations _______________ __ 6Short-term stations ________________________________ 19Data distribution _____________________________ 19Preparation of the map _______________________ _ 20
Mean annual runoff _________________________________ 22Upper Ohio River basin _______________________ 22Greater Pittsburgh region _______________________ _ 24
Yearly variations ___________________________________ 25References _______________________________________ 32
ILLUSTRATIONS
Page PLATE 1. Map of Ohio River basin above Muskingum River showing
mean annual runoff and location of gaging stations __ In pocket FIGURE 1. Map showing the upper Ohio River basin study area and the
Greater Pittsburgh region within it ______________ 32. Sample station compilation of mean annual discharges and
annual ratios ______________ ____ _ 73. Graph showing progressive variation in mean annual runoff
at main stream sites on the Allegheny and Tygart-Mononga- hela Rivers _______ ___ _ _ 24
4. Graphs showing historical variation in basin-wide average yearly discharge as indicated by long-term streamflow rec ords for the period 1910-74 _____________________ 27
5. Graphs showing subbasin variations in yearly discharge ____ 306. Diagram showing range of ratios of annual mean discharge _ 31
III
IV CONTEXTS
TABLES
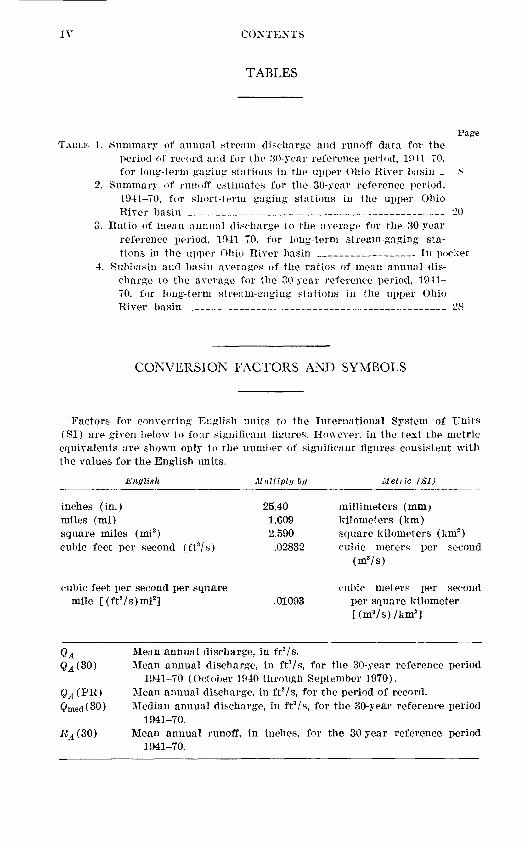
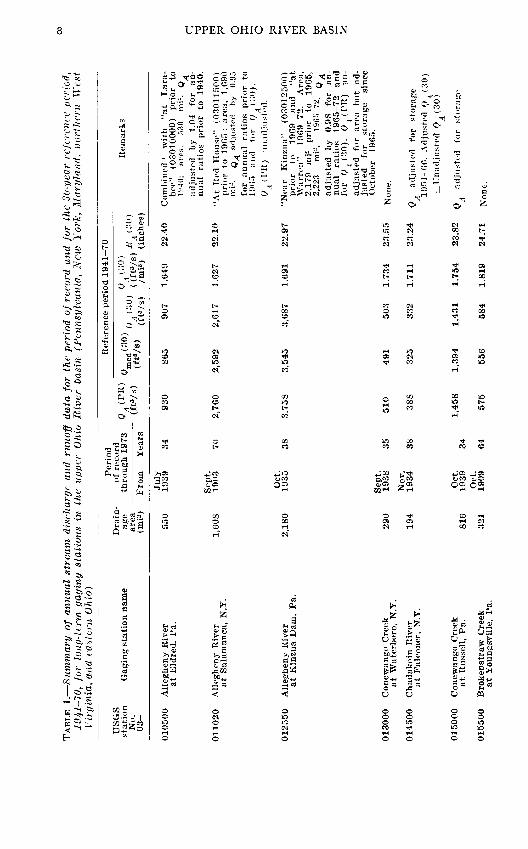
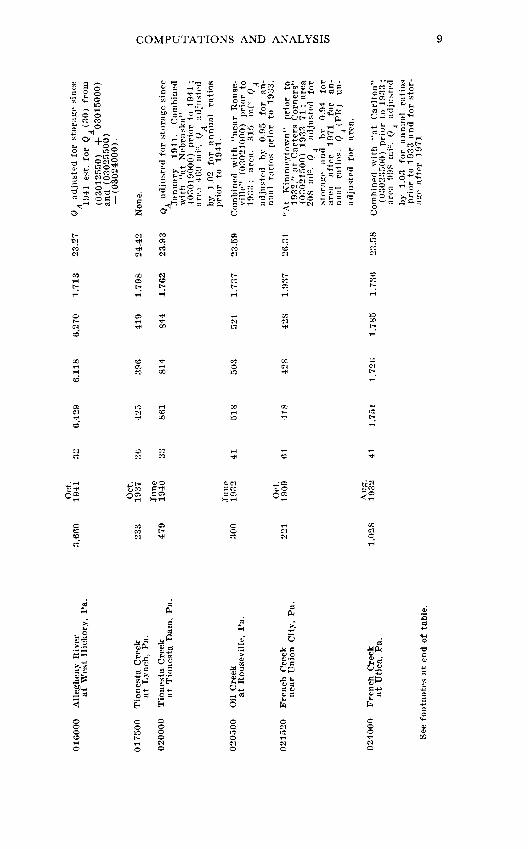
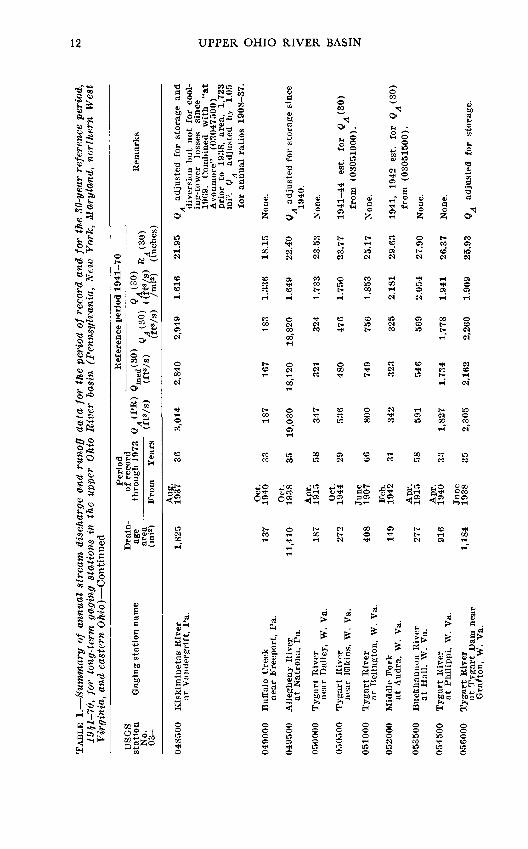
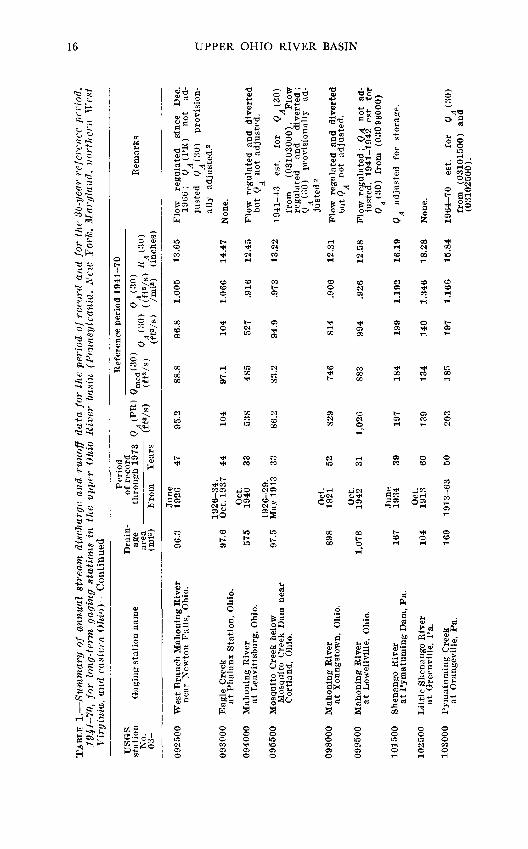
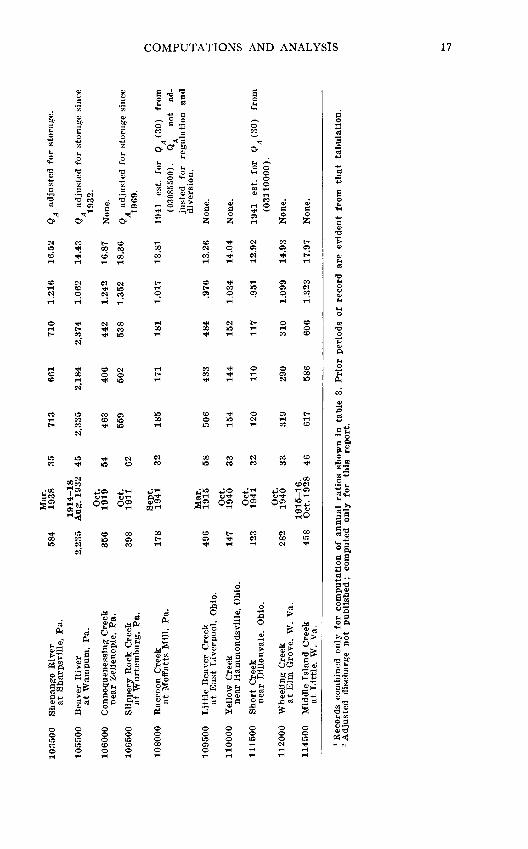
PageTABLE 1. Summary of annual stream discharge and runoff data for the
period of record and for the .30-year reference period, 1041-70, for long-term gaging stations in the upper Ohio River basin _ S
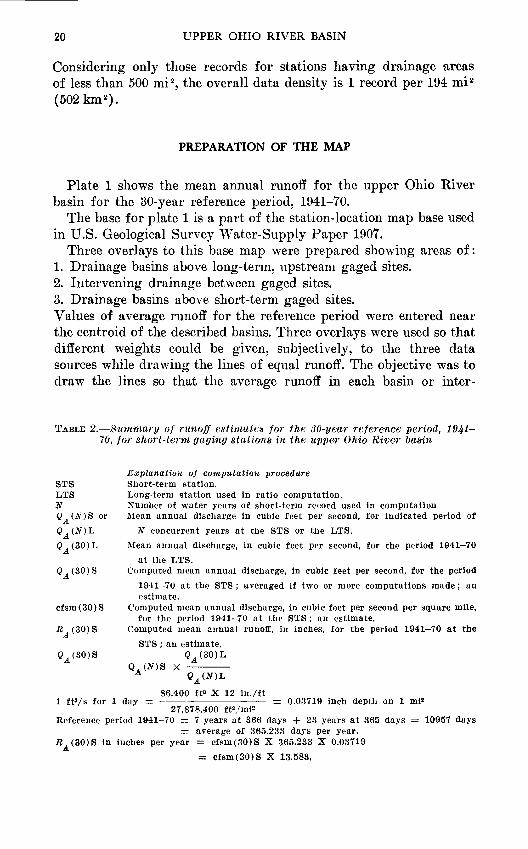
2. Summary of runoff estimates for the 30-year reference period, 1941-70, for short-term gaging stations in the upper Ohio River basin ______________________________ 20
3. Ratio of mean annual discharge to the average for the 30-year reference period, 1941-70. for long-term stream-gaging sta tions in the upper Ohio River basin ___________. Tn pocket
4. Subbasin and basin averages of the ratios of mean animal dis charge to the average for the 30-year reference period, 1941- 70. for long-term stream-gaging stations in the upper Ohio River basin _______________________________ 28
CONVERSION FACTORS AND SYMBOLS
Factors for converting English units to the International System of Units (SI) are given below to four significant figures. However, in the text the metric equivalents are shown only to the number of significant figures consistent with the values for the English units.
English Multiply by Metric (SI)
inches (in.) miles (mi) square miles (mi2 ) cubic feet per second (ft3/s)
25.40 1.609 2.590
.02832
millimeters (mm; kilometers (km) square kilometers (km2 ) cubic meters per second
cubic feet per second per square cubic meters per second mile [(ftVs)mi2 ] .01093 per square kilometer
[(mVs)/km2 ]
QA Mean annual discharge, in ftVs,QA (30) Mean annual discharge, in ftVs, for the 30-year reference period
1941-70 (October 1940 through September 1970).QA (PR) Mean annual discharge, in ftVs, for the period of record. Qmed(30) Median annual discharge, in ft3 /s, for the 30-year reference period
1941-70. RA (30) Mean annual runoff, in inches, for the 30-year reference period
1941-70.
MEAN ANNUAL RUNOFF IN THE
UPPER OHIO RIVER BASIN, 1941-70,
AND ITS HISTORICAL VARIATION
By ROBERT M. BEALL
ABSTRACT
A map of the Ohio River basin above the Muskingum River shows patterns of mean annual runoff for the new climatologic and hydrologic reference period, 1941-70, and provides an up-to-dnte, consistent basis for consideration of this streamflow characteristic. The primary data base consisted of 98 long-term gaging-station records collected within this 27,300-square-mile (70,700-square- kilometer) headwater area of the Ohio River basin. Supplemental information was derived from 83 short-term records.
Mean annual runoff is at a regional minimum of less than 12 inches (300 mil limeters) in an area extending from the northern West Virginia panhandle to the headwaters of the Mahoning River in Ohio. Mean annual runoff of more than 32 inches (810 millimeters) occurs in parts of the upper Cheat River basin in West Virginia. The zone of high runoff trends northeastward along the west ern slopes of the Allegheny Mountains; magnitudes diminish to about 25 inches (630 millimeters) at the eastern basin boundary near Ebensburg, Pa. Runoff of this magnitude occurs also in a band across the upper Allegheny River basin in Pennsylvania.
Ratios of mean annual discharge to the 30-year reference-period average were computed for each year of record for all long-term gaging stations. Annual discharges have ranged from about 30 percent to 200 percent of the 30-year mean. Graphed summaries of the annual ratios document the relative duration and magnitude of wet and dry periods during the past 65 years in the upper Ohio River basin.
INTRODUCTION
Mean annual runoff is the average flow of a stream during a par-
NOTE. Throughout this report, years should be understood to mean water years (October 1 through September 30), the annual period for which gaging- station records are customarily published.
1

2 UPPER OHIO RIVER BASIN
ticular period of years; its long-term value closely approximates the amount of streamflow potentially available for development. As such, it is a useful quantitative measure of an indispensable, renew able resource. Unlike a static mineral resource, runoff is always in a state of flux, varying principally in response to temporal and areal changes in precipitation and temperature. Climatically induced variations are influenced by the effects of topography, geology, vege tation, and, to a lesser degree, man's modification of the land.
The mean annual runoff of an area is a common and fundamental numeric, descriptive; element. Xeecled values are generally extra polated from or referenced to published data for the period of record at some conveniently located gaging station; they may or may not include a specification of the period and the area of representation.
THE PROBLEM
Many streamflow records are available for the upper Ohio River basin, but their periods of record are largely noncoincident; further more, available information cannot always be applied readily to a particular site or area of interest. Existing maps showing patterns of runoff are too small in size and too large in runoff-value intervals to be of use except for determining gross estimates for large basins or areas.
The credibility of the quantification in all resource appraisals in creases with the number of data values used in the assessment, until some point of diminishing return is reached in terms of the value of or necessity for the improved information. The irregular, cyclic occurrence of wet and dry years is such that a specific time frame is desirable when considering this dynamic resource.
A PRELIMINARY SOLUTION
The principal purpose of this study is to produce a reasonably detailed but preliminary map of mean annual runoff for the upper Ohio River basin, representing conditions during an appropriate reference period 1941-70. This is the reference period presently used by the Environmental Data Service and National Weather Service, National Oceanic and Atmospheric Administration, for re porting of climatological-standard-normal temperature and precipi tation data, and by the U.S. Geological Survey in its monthly analy ses of nationwide streamflow and ground-water conditions. The 30- year reference period is a useful standard but has no particular hy-

INTRODUCTION 3
drologic significance, as it is representative of recent experience but does not necessarily occupy a significant position in some climatic cycle.
AREA OF INTEREST AND LIMITS OF DEFINITION
The initial area of interest for definition of mean-runoff character -
82'
42
l^iyr^'jf^^HL.o A^ ~ *i ^nv-w n H 1^*0 l -j"<;i J5 vy n I \-f _, Via.^^ \ s
.- Upper Ohio River basin___ (as defined herein)
' Greater Pittsburgh reoion
Base from U S Geological Survey Appalachian Region 1967
FIGURE 1. The upper Ohio River basin study area and the Greater Pittsburghregion within it.

4 UPPER OHIO RIVER BASIN
istics was the Greater Pittsburgh region' for present purposes de fined as including the six southwestern Pennsylvania counties of Allegheny, Armstrong, Beaver. Butler, Washington, and Westmore- land an area of about 4.500 mi- (11,650 km 2 ). See figure 1.
The principal rivers of this region are Allegheny, Kiskiminetas, Monongahela, Youghiogheny, Beaver, and Ohio. All of these rivers have been gaged at sites within the region for many years, and documentation of the varying quantity of water available in these major arteries has been beneficial in innumerable ways. However, these large rivers are exlraregional in origin, and their records do not define the pattern of runoff originating within the Greater Pitts burgh region. Continuous daily discharge records of streams whose drainage are wholly within the region have been collected at 14 gage sites, half of which are no longer in operation or which have been established in recent 3^ears.
Improved definition of runoff in the Greater Pittsburgh region can be achieved by using streamflow records for contiguous areas in the dala analysis. To this end. the upper Ohio River basin was adopted as the study area. The upper Ohio River basin referred to here includes all of the, basin area upstream from the Muskingum River basin in Ohio and the Little Kanawha River basin in West Virginia. This area is shown also in figure 1. This part of the Ohio River system comprises an area of about 27,300 mi 2 (70,700 km 2 ) in parts of Maryland, New York, Ohio, Pennsylvania, and West Virginia.
The extension of the study area was considerably greater than that required for examination of the six-county region. However, the map and data are expected to be useful for other studies. The ex tended study area approximates the area of responsibility of the Pittsburgh District, U.S. Army Corps of Engineers; and the Pitts burgh River Forecast Center, National Weather Service. The distri bution of drainage areas among the several states and principal sub- basins is as follows:
Drainage-area subdivision
Ohio
ATew York
Total
Allegheny
!t.7G5
_ __ _ 1,983
11,748
, in square miles
Subbasin
Monongahela
2,654 " 4,305
-425
7,384
Ohio
3,023 2 1,620 ' 3,525
2 8,168
Upper Ohio River basin *
15,442 2 5,925 " 3,525
2 425 1,983
2 27,300
1 As defined in text above. - Approximate.

INTRODUCTION 5
The Ohio subbasin, as used herein, consists of all of the area tributary to the Ohio River from Pittsburgh. Pa., to Marietta, Ohio. The principal tributary within the subbasin is Beaver River.
SOURCES OF DATA
Annual discharge records were obtained from the following re ports :
F.S. Geological Survey, 1957. Compilation of records of surface waters of the United States through September 1950: part 3-A, Ohio River basin except Cumberland and Tennessee River basins: U.S. Geol. Survey Water-Supply Paper 1305, 652 p.
, 1904, Compilation of records of surface waters of the United States, October 1950 to September 1960: part 3-A. Ohio River basin except Cumber land and Tennessee River basins: F.S. Geol. Survey Water-Supply Paper 1725, 560 p.
-, 1971, Surface water supply of the United States 1961-05: part 3, volume1, Ohio River basin above Kanawha River: F.S. Geol. Survey Water-Supply Paper 1907, 621 p.
-, 1966-7-1, Water resources data for (state), part 1, Surface water records : annual reports published for year indicated by district offices of the Water Resources Division in Maryland, New York, Ohio, Pennsylvania, and West Virginia.
These reports should be consulted to obtain detailed information about the gaging stations for which data have been used in this study. Such information includes location, drainage area, period of record, type and history of gages, extremes of discharge, general re marks, and notations of revisions of previously published records.
Additional records of stage and (or) discharge are collected by the U.S. Army Corps of Engineers and by the National Weather Service at a few sites in the region. These unpublished records were not ob tained for the study, because most document the discharge of prin cipal streams at points intermediate to those published in the reports noted above. Most of these record sites have been catalogued by the U.S. Geological Survey, Office of Water Data Coordination (1973).
ACKNOWLEDGMENTS
A study such as this is founded on the efforts of generations of hydrographers and hydraulic engineers who measured the streams, maintained the gaging stations, and prepared the data for publi cation. Many records were collected before 1932 by the (then) Penn sylvania Department of Forests and Waters. Similarly, a number of records were obtained between 1921 and 1942 b}7 the West Virginia

6 UPPER OHIO RIVER BASIN
Power and Transmission Company. Most data-collection activity by the Geological Survey has been accomplished through financial co operation with state and local agencies and in collaboration with the U.S. Army Corps of Engineers.
Reservoir records used to adjust annual-runoff data were provided by the Corps of Engineers, private companies, and public agencies that operate storage facilities.
The present study effort was made possible by the valued assist ance of Pauline F. Silsley, U.S. Geological Survey, who performed or checked many of the, data compilations and computations.
COMPUTATIONS AND ANALYSIS
LONG-TERM STATIONS
A few gaging stations in the upper Ohio region have been main tained continuously since the early 1900's. However, the 1030's and 1940's were periods of considerable expansion in the stream-gaging program here, as well as nationwide. Many of the stations established during that time are still in operation, because of the varied and continued use of the data. The resultant data accumulations are the primary source of information for preparation of the map of mean annual runoff for the 1041-70 reference period.
A sample compilation of annual discharge data for one station, taken from the reports previously listed, is shown in figure 2. Mean and median annual discharges for the 30-year reference period were computed from these data. The results of similar computations for 08 long-term stations are listed in table 1. To complete computations for the reference period, the mean annual discharge was divided by (he drainage area above the gaging station (column headed QA (3Q) (ftVs)/mi 2 ), and that unit discharge was multiplied by the factor 13.583* to obtain the equivalent runoff (7^30) in inches. The sum mary of station information in table 1 includes drainage area, period of record, and mean annual discharge for that period.
The natural flow regimen of many streams has been altered by con struction and operation of storage reservoirs and by diversion of water for various purposes. The six principal rivers in the Greater Pittsburgh region, as well as many tributaries throughout the upper Ohio River basin, are so altered. Reservoir operations usually follow an annual cycle such that year-to-year difference in year-end storages
Derivation of this factor is shown on the explanation for table 2.

COMPUTATIONS AND ANALYSIS
UNITED STATES DEPARTMENT OF THE INTERIOR
GEOLOGICAL SURVEYMean annual discharges for period of record and annual ratios to the average for -....the 30-year reference period 1941-70: 03010500 Allegheny River at Eldredj pa.+
Water
Year
1921
1925
1930
1935
1940
QA (
Obs.
678
732
1010
1100
918
894
582
768
767
530
710
806
1031
894
668
913
it*/*)Adj.
for d.a.
705
761
1050
1144
955
930
605
799
798
551
738
838
1072
930
695
fetio to 1941-70 average
0.78
.84
1.16
1.26
1.05
1.03
.67
.88
.88
.61
.81
.92
1.18
1.03
.77
1.01
2Q
Water
Year
1941
1945
1950
1955
1960
1965
1970
A 4 1-70
QA
(ft3/s
634
1159
1361
713
1278
1101
1089
957
703
905
1298
1104
878
730
677
1284
822
812
906
978
789
631
683
852
669
768
651
959
704
916
27,211
907
Rado to 1941-70 average
0.70
1.28
1.50
.79
1.41
1.21
1.20
1.06
.78
1.00
1.43
1.22
.97
.80
.75
1.42
.91
.90
1.00
1.08
.87
.70
.75
.94
.74
.85
.94
1.06
.78
1.01
Water
Year
1971
1975
QA
ft3/s)
971
1475
1048
1150
tatLo to 1941-70 average
1.07
1.63
1.16
1.27
-
-
QAmed(30) 865
with "at Urabee" (03010000) prior to 1940; QA djuated by drainage area
FIGURE 2. Sample station compilation of mean annual discharges and annualratios.
TAB
LE 1
. Sum
mary
of
an
nu
al
stre
am
dis
char
ge a
nd r
unoff
data
for
the
peri
od o
f re
cord
an
d f
or
the
30-y
ear
refe
renc
e pe
riod
, 19
Jfl-
lU,
for
long
-ter
m g
agin
g st
ati
ons
in
the
uppe
r O
hio
Riv
er
basi
n (P
enn
sylv
an
ia,
New
Y
ork,
Ma
ryla
nd
, no
rthe
rn
Wes
t V
irg
inia
, an
d ea
ster
n O
hio)
US
GS
stat
ion
N
o.O
S-
0105
00
0110
20
0125
50
Gag
ing
stat
ion
nam
e
All
eghe
ny R
iver
at E
ldre
d, P
a.
All
eghe
ny R
iver
at S
alam
anca
, N
.Y.
All
eghe
ny R
iver
Dra
in
age
fl-TG
O.
(mi"
)
550
1,60
8
2,18
0
Per
iod
of r
<;co
rdth
rough 1
973
Fro
m
July
1939
Sep
t.19
03
Oct
.19
35
Yea
rs
34 70 38
Ref
eren
ce p
erio
d 1941 7
0
- (ftV
s)
Jfr
t/B
) V
A(
'M)
(ftV
s)
930
865
907
2,76
0 2,
592
2,61
7
3,75
8 3,
545
3,68
7
((ft
Vs)
K
A<<-
'°)
/mi2
) (i
nch
es)
1.64
9 22
.40
1.62
7 22
.10
1.69
1 22
.97
Rem
arks
Com
bine
d1
wit
h
"at
Lar
a-be
e"
(030
1000
0)
pri
or
to11
140:
ar
ea,
530
mi-
. Q
adju
sted
by
1.
04
for
an
nual
ra
tios
pri
or
to
1940
.
"At
Red
Hou
se"
(030
1150
0)pri
or
to 1
965
; ar
ea,
1,69
0m
i-.
Q .
adju
sted
by
0.95
for
annual
ra
tios
pri
or
toI!
)(i5
nn
d fo
r V
(::0
).<?
(PR
) unad
just
ed.
"Nea
r K
inzu
a"
(030
1250
0)at
Kin
zua
Dam
, P
a.
0130
00
0145
00
0150
00
0155
00
Con
ewan
go C
reek
at
Wat
erbo
ro,
N.Y
.
Cha
dako
in R
iver
at
Fal
cone
r, N
.Y.
Con
ewan
go C
reek
at
Rus
sell
, P
a.
Bro
ken
stra
w C
reek
at
You
ngsv
ille
, P
a.
290
194
816
321
Sept
. 1938
Nov.
1934
Oct.
19
39Oc
t.
1909
35 38 34 64
510
388
1,45
8
575
491
325
1,39
4
556
503
332
1,431
584
1.734
1.71
1
1.75
4
1.819
23.5
5
23.2
4
23.8
2
24,71
pri
or
to
1969
an
d "a
t W
arre
n"
1969
-72.
A
rea,
2,
179
mi=
p
rio
r to
19
65,
2,22
3 m
i-,
19G
5-72
. Q
adju
sted
by
0.
9S
for
an
nual
ra
tio
s 19
65-7
2 an
d fo
r Q
^ (3
0).
P4
(PR
) un
ad
just
ed
for
area
bu
t ad
ju
sted
fo
r st
orag
e si
nce
Oct
ober
19
65.
No
ne. ad
just
ed
for
stora
ge
1051
-66.
A
djus
ted
Q
(30)
=U
nad
just
ed Q
, (
30)
A
adju
sted
fo
r st
ora
ge
O
W CO I H
1
Non
e.
COMPUTATIONS AND ANALYSIS
8 a£ 8 -g ,7g g g-S-^ew £-*££ SBC«*i if si! K:S s&?.::::|§s ||«, sf a «^s^tg£g1%.°. I .11^1 1|SSS =0 |«r ^ 0> +o - H 2«- S =§^oE l-Cos'g - go g S-S^i 5 «^ c, | S r,S«2s|§ ^-^S3 SS ^cg5'5 |PS c7 So-* 7 ^o_ ^ Pi ^ T, S-yo
ti-f t)M C-f SCOO05 OOi O> SC5V rH V rH l-j rH I- rH
gw SdiOJ5^O cj O ed -H o3 a) : H H O £
Up OS* M £P

TAB
LE 1
. Sum
mary
of
annu
al s
trea
m d
isch
arge
and
runoff
da
ta f
or
the
peri
od o
f re
cord
and
fo
r th
e 30
-yea
r re
fere
nce
per
iod,
19
J^1-
10,
for
long
-ter
m g
agin
g st
ati
ons
in
the
uppe
r O
hio
Riv
er
basi
n (P
enn
sylv
an
ia,
New
Y
ork
, M
ary
lan
d,
no
rth
ern
W
est
Vir
gin
ia,
and
east
ern
Oh
io)
Con
tinu
ed
US
GS
stat
ion
No.
O
S-
025000
025500
028500
029500
030500
031500
032500
034000
034500
036000
Gag
ing
sta
tio
n n
ame
Sugar
Cre
ekat
Sugar
cree
k,
Pa.
All
egh
eny
Riv
erat
Fra
nkli
n,
Pa.
Cla
rio
n R
iver
at .
Toh
nson
burg
, P
a.
Cla
rio
n R
iver
at
Coo
ksbu
rg,
Pa.
Cla
rio
n R
iver
nea
r P
iney
, P
a.
All
eghen
y R
iver
at
Par
ker
, P
a.
Red
ban
k C
reek
at
St.
C
har
les,
P
a.
Mah
on
ing
Cre
ekat
Punxsu
taw
ney
, P
a.
Lit
tle M
ahonin
g C
reek
at
McC
orm
ick,
P
a.
Mah
on
ing
Cre
ek
Dra
in
age
area
-
(mi2
)
166
5,98
2
204
807
951
7,67
1
528
158
87.4
344
Per
iod
of
reco
rd
thro
ugh 1
973
QA
<PR
Fro
m
Aug
.19
32
Oct
.19
14
Oct
.19
45
Oct
.19
38
Oct
.19
44
Oct
.19
32
Oct
.19
18
Oct
.19
38
Oct
.19
39
Aug
. 19
38
Yea
rs
41 59 28 35 29 41 55 35 34 35
266
10
,28
0
371
1,41
4
1,7
09
13,0
50
847
265
148
577
Ref
eren
ce p
erio
d 1
941 7
0
> O
med
<3°)
Q
(30)
1
(£tV
S)
(fV
/s)
252
9,97
0
351
1,36
2
1,60
7
12,6
80
798
254
132
541
267
10,3
90 364
1,39
7
1,65
7
13,1
10
833
261
145
569
1 (ff
tvs)
-*V
3°)
/mi2
) (i
nch
es
1.60
8
1.73
7
1.78
4
1.73
1
1.74
2
1.70
9
1.57
8
1.65
2
1.65
9
1.65
4
21.8
4
23
.59
24.2
3
23.5
1
23
.66
23.2
1
21.4
3
22.4
4
22.5
3
22.4
7
Rem
arks
)
Non
e.
Q
adju
sted
fo
r st
ora
ge
aft
er
1940
.
Q
adju
sted
for
sto
rag
e si
nce
1952
. 19
41-4
5 es
t.
for
Q
(30
) fr
om
(0
3017500)
and
(03
029000).
Q
adju
sted
for
sto
rag
e si
nce
A 1952
.
Q
adju
sted
fo
r st
ora
ge.
19
41
-45
es
t.
for
6^(3
0)
from
(0
3029500)
and
(03031000).
Q
adju
sted
for
stora
ge
since
1941
.
Non
e.
Non
e.
Non
e.
Q
adju
sted
for
sto
rag
e si
nce
(^ *"d TJ M O ffi 0 5 .«.-< w ^ w C/2 2
19
41
.

COMPUTATIONS AND ANALYSIS 11
o bo jj J; o u a _g _g "O .9 ~
2 n a> « o>o o w« <H a -a
HI +J ~ C3 S CO 4J-S
a « «c CC - M-p £ C os.
s §i: I § Il fe o|| ! c _ a o . s s J if* s! !gi 1 § 1 1 1 I I g I2 5 5" S el" £ |? £ | £ c | £ £ ! S
fsfi|s fe ^iifl;^l ? sli i|i^rH ^^^ ^^ O- rtorH ^-00- _-O ,_ O - ^. ^ ,
OOO1 O» O-O'rnO'O'O'
03 o 05 2 < m S 05 S° C S °S °r
BS *a pf£ fco I* _ a
.1.1 £ si ^ ^ d ^ ^II «S ^ * P S* M 5l og S|«S £ 0- 2§ ^^ go .g-g us ag 5^ 55>,3 °« ^o gp g- "g ^ ^c c^ a^
IB H is ?l ?i II p is is |!Its §s | S ^ s^ |? js g- I- I-quo S SOMO^^I
TABL
E 1.
Sum
mar
y of
ann
ual
stre
am d
isch
arge
and
run
off
da
ta f
or
the
peri
od o
f re
cord
and
fo
r th
e 30
-yea
r re
fere
nce
peri
od,
1941
-70,
for
lon
g-te
rm g
agin
g st
atio
ns i
n th
e up
per
Ohi
o R
iver
bas
in
(Pen
nsyl
vani
a, N
ew Y
ork,
Mar
ylan
d, n
orth
ern
Wes
t V
irgi
nia,
and
eas
tern
Ohi
o) C
onti
nued
US
GS
st
ati
on
No.
0
3-
048500
049000
049500
050000
050500
051000
052000
053500
054500
056000
Gag
ing
sta
tio
n n
ame
Kis
kim
inet
as R
iver
at
Van
der
gri
ft,
Pa.
Buff
alo C
reek
nea
r F
reep
ort
, P
a.
All
eghen
y R
iver
at
Nat
rona,
Pa.
Tygar
t R
iver
nea
r D
aile
y,
W.
Va.
Ty
gar
t R
iver
nea
r JG
lkin
s, W
. V
a.
Ty
gart
Riv
erat
Bel
ing
ton
, W
. V
a.
Mid
dle
Fo
rk
at
Audra
, W
. V
a.
Buck
han
no
n R
iver
at
Hal
l,
W.
Va.
Tygar
t R
iver
at
Ph
ilip
pi,
W
. V
a.
Ty
gart
Riv
er
at
Tv
crar
t D
am n
ear
Dra
in
age
are
a -
(mi"
)
1,82
5
137
11
,41
0
187
272
408
149
277
916
1,18
4
Per
iod
o
f re
cord
thro
ugh 1
973
QA
(PR
.
Fro
m
Aug
.19
37
Oct
.19
40
Oct
.19
38
Ap
r.19
15
Oct
.19
44
June
1907
Feb
.19
42
Ap
r.19
15
Ap
r.19
40
June
1938
Ref
eren
ce p
erio
d 1
94
1-7
0
) Q
med
(30
Yea
rs
uw
s|
("/s
)
36 33 35 58 29 06 31 58 3.'!
35
3,01
4
187
19,0
30
347
536
800
342
591
1,8
27
2,3
05
2,8
40
167
18
,12
0
321
480
749
323
546
1,73
4
2,1
62
(«V
s)
2,94
9
183
18,8
20 324
476
756
325
569
1,77
8
2,26
0
«?A
(30
)( (f
tVs)
/m
i*)
1.6
16
1.33
6
1.64
9
1.7
33
1.7
50
1.8
53
2.18
1
2.05
-1
1.9
41
1.90
9
RA
(3Q
) R
emar
ks
(inch
es)
21
.95
18
.15
22.4
X)
23
.53
23.7
7
25.1
7
29.6
3
27
.90
26.3
7
25
.93
Q
adju
sted
fo
r st
ora
ge
and
div
ersi
on
b
ut
not
for
cool
in
g-t
ow
er
loss
es
since
1909
. C
om
bin
ed
wit
h
"at
Av
on
mo
re"
(03
04
75
00
)pri
or
to
1938
, ar
ea,
1,7
23
mi-
. Q
ad
just
ed
by
1.05
for
annual
rati
os
1908-3
7.
Non
e.
Q
adju
sted
for
sto
rag
e si
nce
1940
.
Non
e.
1941-4
4
est.
fo
r 0
^(3
0)
fro
m
(03
051000).
Non
e.
1941
, 19
42
est.
fo
r Q
(3
0)
fro
m
(03
051500).
Non
e.
Non
e.
Q
adju
sted
fo
r st
ora
ge.
O p W VI
Gra
fto
n,
W.
Va.

§ §
COMPUTATIONS AND ANALYSIS 13
- £
rH 00
o oi
2?M .K_ .O .N^'w w£ WrF* t-w
I O CM i 4-»O ^ rH OJ Oi gCO 4J®} rH Cl ^JO
^ W5 ££ QOS <J OS O . ^OS O^" ^ ' O^
^2 22 2c ^ 2.5'
ci
Fork River Butcherville. W.
*j . ,£ cs^
05 ^^
Fork River Clarksburg. W. T
*j j_.^ cj
^
ci
Fork River Enterprise, W. V
*j _^^ID a^
C3 ^> >
ilo Creek
Barrackville, W. ingahela River
Lock 15, Hoult, i
"+J °4J
's * o dK S
^
1^JQ
ci
Hendricks, W. Vswater River Davis, W. Va.
,_. "Pi -M a a a
S
ci
o C"
;H M Cj
^ 4-12 s33
ci
t River
ar Parsons. W. V
d 01a? £
O
>
t River
Rowlesburg. W.
rt -MA ""
O
Sandy Creek
Rockville. W. Va
^-CJDS
S
ci
|lc ?Jino;'§
i i _^j p^3 " ^
Q
>ngahela River Greensboro, Pa.
^H 4»i"

TABL
E 1.
Sum
mar
y of
ann
ual
stre
am
dis
char
ge a
nd r
unof
f 19
41-7
0, f
or
long
-ter
m g
agin
g st
atio
ns i
n t
he u
pper
Ohi
o V
irgi
nia,
and
eas
tern
Oh
io)
Con
tinu
ed
da
ta f
or
the
peri
od o
f re
cord
and
for
the
30-
year
ref
eren
ce p
erio
d,
Riv
er b
asin
(P
enns
ylva
nia,
New
Yor
k, M
aryl
and,
nor
ther
n W
est
US
GS
st
ati
on
No.
0
3-
073000
074500
075000
075500
076500
077500
078500
079000
080000
081000
082500
Gag
ing s
tati
on
nam
e
So
uth
Fork
Ten
mil
e C
reek
Jeff
erso
n,
Pa.
Red
stone
Cre
ekat
Wal
ters
burg
, P
a.
Monong
ahel
a R
iver
at
Char
lero
i, P
a.
Yo
ug
hio
ghen
y R
iver
nea
r O
akla
nd
, M
d.
Yo
ug
hio
ghen
y R
iver
at
Fri
end
svil
le,
Md.
Yo
ug
hio
ghen
y R
iver
at
Youghio
ghen
yR
iver
Dam
, P
a.
Big
Pin
ey R
un
nea
r S
alis
bury
, P
a.
Cas
selm
an R
iver
at
Mar
kle
ton,
Pa.
Lau
rel
Hil
l C
reek
at
Urs
ina,
Pa.
Yo
ug
hio
gh
eny
Riv
er
belo
w C
onfl
uenc
e, P
a.
Yo
ug
hio
ghen
y R
iver
at
Connel
lsvil
lp.
Pn.
Dra
in
age
area
(m
i")
180
73.7
5,21
3
134
295
436
24.5
382
121
1,02
9
1,32
6
Per
iod
of
reco
rd
thro
ugh 1
97?
Fro
m
Oct
.19
31
Oct
.19
42
Oct
.19
33
Aug
.19
41
189
8-1
904.
Oct
. 19
40
Oct
.19
39
June
19
32
-S
ept.
19
70
Oct
.19
20
Oct
.19
18
June
1940
July
1908
Yea
rs
42 31 40 32 39 34 38 53 55 33 65
Ref
eren
ce p
erio
d 1
94
1-7
0
5 C
^(P
R)
3 (f
t»/s
)
196
97.2
8,9
14
289
636
852
37.1
649
264
1,9
49
2,5
33
1 °<sC
174
88.2
8,48
4
282
594
811
35.3
648
260
1,80
7
2,4
76
0/3
0)
(ftV
s)
190
94.3
8,72
2
281
592
829
36.7
635
259
1,89
2
2,49
3
<?/3
0)
( (tm
i»S)
1.05
6
1.2
80
1.6
73
2.0
97
2.0
07
1.90
1
1.4
98
1.66
2
2.1
40
1.8
39
1.8
80
RA
(30
) R
emar
ks
(inch
es)
14.3
4
17.3
9
22
.72
28.4
8
27
.26
25
.82
20.3
5
22.5
7
29
.07
24.9
8
25
.54
Non
e.
1941
, 19
42
est.
fo
r Q
/30)
fro
m
(03
070500)
and
(0307200
0).
Q
adju
sted
fo
r st
ora
ge.
A
1941
es
t.
for
Q/3
0)
fro
m
(0307650
0).
Q
adju
sted
for
stora
ge
since
19
40.
Q
adju
sted
fo
r st
ora
ge.
Non
e.
Non
e.
Non
e.
Q
adju
sted
fo
r st
ora
ge.
Q ,
adju
sted
for
stora
ge
since
d 5 w 7s O 3 o ^ w w J> HH
2
1925
.

COMPUTATIONS AND ANALYSIS 15
"~ S
* 00 !£> ttCOM ^ M
rH OO " O5
« Oo
ts ®s41 °6§ -o o
HIo'
£ M -8^
l«g»-
0>
« S
73 O KC'S fo«r ^
wli +J2 *55 *>£ Mhr3^^ CJ C^ PJ ^i t; M I5® O* O 05 O 05 ^O
*Hi-l r-l w r-l W r1 r-lrH °S <|S
! 2 4^°H" oCO « O 05; Q. ^IH 3 05 Q05
3 5O a
an
M «.^£ HOU ^_i2^ o
.c >
0 S
II
£5) 3 « .
££ >'? asS S 3 01 « _,~ O KM H -
^* d "^ rt 'Si
J| V,Coi>H a s H
TAB
LE 1
. N
um
ma
ry o
f a
nn
ua
l st
ream
dis
char
ge a
nd r
unoff
19
41-1
/0,
for
long
-ter
m g
affi
ng s
tati
ons
in t
he
uppe
r O
hio
Vir
gin
ia,
and
east
ern O
hio
) C
onti
nued
data
for
the
peri
od o
f re
cord
an
d f
or
the
30-y
ear
refe
rence
per
iod.
R
iver
bas
in
(Pen
nsy
lvania
, N
eiv
Yo
rk,
Ma
ryla
nd
, n
ort
her
n
Wes
t
US
GS
st
atio
n
No.
O
S-
0925
00
0930
00
0940
00
0955
00
0980
00
0995
00
1015
00
1025
00
Gag
ing
stat
ion
nam
e
Wes
t B
ranch
Mah
onin
g R
iver
near
New
ton
Fal
ls,
Ohi
o.
Eag
le C
reek
at
Ph
alan
x S
tati
on,
Ohi
o.
Mah
onin
g R
iver
at
Lea
vit
tsburg
, O
hio.
Mos
quit
o C
reek
bel
ow
Mos
quit
o C
reek
Dam
nea
rC
ortl
and,
Ohi
o.
Mah
onin
g R
iver
at
You
ngst
own,
O
hio.
Mah
onin
g R
iver
at
Low
ellv
ille
, O
hio.
She
nang
o R
iver
at
Pym
atum
ing D
am,
Pa.
Lit
tle
She
nang
o R
iver
Dra
in
age
area
-
(mi"
)
96.3
97.6
575
97.5
898
1,07
3
167
104
Per
iod
of r
ecor
d th
rough 1
973
Fro
m
Yea
rs
June
1926
1926
-34.
Oct
. 19
37
Oct
.19
40
1926
-29.
May
194
3
Oct
.19
21
Oct
.19
42
.Tun
e19
34
Oct
.19
13
47 44 33 33 52 31 39 60
Ref
eren
ce p
erio
d 19
41-7
0
Q
(PR
)(ft'/ 8
)
95.2
104
538
86.2
829
1,02
6
197
139
<?m
ed<
30>
(ft
3/ 8
)
88.8
97.1
485
83.2
746
883
184
134
(ft3
/a)
96.8
104
527
94.9
814
994
199
140
((ft
Vs)
/m
i*)
1.00
5
1.06
6
.916
.973
.906
.926
1.19
2
1.34
6
R
( 30
) (i
nche
s)
13.6
5
14.4
7
12.4
5
13.2
2
12.3
1
12.5
8
16.1
9
18.2
8
Rem
arks
Flo
w
regula
ted
sinc
e D
ec.
1966
; Q
(P
R)
not
ad-
Aju
sted
Q
(30)
pr
ovis
ion
ally
ad
just
ed.2
Non
e.
Flo
w
reg
ula
ted
an
d div
erte
d
but
Q
no
t ad
just
ed.
-i
1941
-43
est.
fo
r Q
,(3
0)
from
(0
3103
000)
. F
low
reg
ula
ted
an
d d
iver
ted
;f,
(30)
pro
vis
ional
ly
ad
just
ed.2
Flo
w
regula
ted
and
div
erte
dbu
t Q
. no
t ad
just
ed.
Flo
w
regula
ted ;
QA
no
t ad
- iu
sted
. 19
41-1
942
pst
for
<?,
(30)
from
(0
3098
000)
4
Q ,
adju
sted
fo
r st
ora
ge.
A
Non
e.at
Gre
envi
lle,
Pa.
1030
00
Py
mat
um
ing C
reek
at O
rang
evil
le,
Pa.
169
1913
-63
5020
319
64-7
0 es
t.
for
6^(
from
(0
3101
500)
an
d
(031
0250
0).
W
COMPUTATIONS AND ANALYSIS 17
a>Mdt-iOX
1*O
da>cc S dej
*! O
CMtoOrH
0rHNrH
0I-lt-
I-lww
OSrHt-
IO OS
00 CO
S
3!00to
Shenango River
at Sharpsville, Pa.
o§COo
a> o.S'co
a>Mei1*Occ>HO
da>cc
JrH"d coeS Ci^ rt
0
CO * *rH
CMWq i-i
*t-coN"
*00rHof
toCCCO
N
in *
_-N00 coV 05 .«~ )rH yj C
*3toCONN
Beaver River
at Wampum, Pa.
0o inin0
a>
o fc
t~00<PrH
N *Ni-i
N * *
ceo *
CO<£>Tt*
Tt*IA
;oi.irH>2
<0to05
Connoquenessing Creek near Zelienople, Pa.
oo otoo
a> oS'S
a>Mdt-iO
ho<H
da>cc
r-l O5"d oei O5
O
o05oo'TH
Nto05 rH
00OSto
CM0to
atoto
N<£>
jJrH w rH0«
00OSOS
Slippery Rock Creek at Wurtemburg, Pa.
^totoo
a -a g0 8) »t, eS
<H
S O~ S °0 B Bco ^
TJ <So -or Mh
0 X U, <H 0 O
0 <Hjj 1Oca « -d a> g a>
« "SrH O r-cs -r^rH
rH00COrH
l~i-l
qrH
rH00rH
rHl-i-l
1O00rH
NCO
i%Q)O3
02 "-1
00t-rH
Raccoon Creek
at Moffatts Mill. Pa.
o
00o
S o'cobO)
- § irl CV 0
fc
OCNCO
0t-01
Tt*00Tt*
OSCOTt*
tooin
00to
lltoO5Tt*
Little Beaver Creek
0otoOS0
d
at East Liverpool, Oh
o> sofc
Tt*
q *
Tt*COqrH
NinrH
*Tt*rH
-ftorH
OS 05
tj® H0* C
t- *TH
_O
3o
Yellow Creek
near Hammondsville, <
o§orH
So h<H
0CO
"«0h *-*o o
<H O. o
M 0
« sOS
rH O
OrH
NO5oi
rHin°?
t-rHrH
OrHi-l
ONrH
NOS
Ji-lJ S^2
CONi-l
Short Creek
near Dillonvale, Ohio
otorHI-l
a>ao fc
COq *
OSOSqrH
0I-lOS
0OSN
OrHCO
OS OS
"£ *°2
N00N
Wheeling Creek
at Elm Grove, W. Va
o
NrH
a> So»
i~O5l>
OSNCO rH
toOce
o00IA
t-rHto
toTt*
.00CONrHOJi".
SI00toTt*
^ .a> r-2^o . d^ e d a>
I-H-M
*3 -d+j"2==!
§oo toTt*I-l
a_O
«"3Aes+J
S3A
So£
ea> d>o>
?fHCJ
dhou a> t-i
<M O
CC"Oo
1h o'E
CH
CO
a>Sd
*i^2o A co"Aan-> o
|s« >>11g-d
<4-i"ti °aag0 0+3 w«* ..g-sS ACO
rds combined only for c( sted discharge not publi
o sf '!->D-d«<)r( c-j

18 UPPER OHIO RIVER BASIN
are small in comparison with total annual flows. Monthly and annual streamflow-data summaries for most stations significantly affected by storage or diversion are adjusted for those effects. Adjusted rather than observed annual data were used where available and have been noted under Remarks in table 1. No adjustments were made for evaporation from reservoirs or other losses.
Reference-period data were complete for 80 of the 98 listed stations. The remainder had records beginning in the 1940's or were discon tinued prior to 1970 after a long period of operation. Annual dis charges for the missing years were estimated from logarithmic re gressions with concurrent annual data from nearby stations. The estimated periods, most of which were less than 5 years, are noted in station remarks.
The long-term stations are identified on plate 1. Detailed location descriptions are in the reports previously listed in the section on "Sources of Data." For illustrative convenience and for conforma tion with a subbasion designation system adopted by the Common wealth of Pennsylvania, subdivisions of the Allegheny River basin are shown on plate 1 and limits of the Pennsylvania subbasins are noted.
Parts of plate 1 of Water-Supply Paper 1907 were used, after some modification, as the base for location of gaging stations. A few erroneously drawn stream segments and mislocated station symbols were corrected, and some station symbols were added. The map scale of 1:1,000,000 appears to be appropriate in relation to the density of data available for analysis.
Many of the larger streams of the area are gaged at two or more sites. The primary data selected for map preparation were the run off values calculated for the gaged sites farthest upstream. A total of 53 of the 98 long-term records met this requirement. Because the basins represented occupy 40 percent of the study area, this data base was considered more than adequate for defining lines of equal annual runoff.
Data summaries for the remaining 45 long-term stations provided a secondary data base. After subtracting the flow at one or more up stream stations from that at a downstream station, runoff for inter vening areas was computed. These data are subject to considerable error because they commonly represent a difference between com paratively large quantities that inherently are subject to some errors of measurement; consequently, they were not included in this report. However, the information was useful in developing or confirming the runoff patterns in ungaged tributary areas, particularly in the main stream valleys.

COMPUTATIONS AND ANALYSIS 19
SHORT-TERM STATIONS
Streamflow records have been collected at many sites for relatively short periods where stations are no longer operated. Many other sta tions have been established relatively recently. Records for a total of 83 such stations were used in this study. They are identified on plate 1 and are considered to be a tertiary data source. Because many of these records are for gages on small drainages, they are useful in defining the areal variation in runoff within the long-term-staiion basins, most of which are of comparatively large areas. A few rec ords of significant length, not coincident with the present reference period, were analysed in the same manner as short-term stations.
Runoff values for the period of record at the short-term stations were adjusted to represent the 1941-70 reference period by means of a factor expressing the ratio of reference-period discharge to short- term-period discharge at a nearby long-term station. The computa tion procedure is detailed at the head of table 2, which shows the summary results of calculations for the 83 short-term stations. This adjustment to the 30-year reference period should not be confused with the adjustment for storage or diversion described earlier.
A few intervening-area runoff computations were made from the adjusted short-term-station data or from a combination of long- and short-term data. Including those mentioned previously, a total of 48 such computations were made, providing supplemental information for a total area of about 11,700 mi 2 (30,300 km 2 ), or 43 percent of the upper Ohio River basin.
DATA DISTRIBUTION
A summary of the numbers of available records by drainage-area category and by major subbasins of the study area is given in the following table:
Distribution of records
Subbasin
Long term > 1000 mi2 (2590 kma ) __ Long term 500-1000 mi2 _____Long term < 500 mi2 (1295 kma ) ___
Total long term
Short term > 1000 mi2 __ ____Short term 500-1000 mi2 _____ __Short term < 500 mi2 __ _
Total records _ _
Allegheny
10 6
20
36
2 1
28
31
67
Monongahela
9 4
23
36
1 0
29
30
66
Ohio
3 3
20
26
0 1
21
22
48
Upper Ohio River basin
22 13 63
98
3 2
78
83
181
20 UPPER OHIO RIVER BASIN
Considering only those records for stations having drainage areas of less than 500 mi 2 , the overall data density is 1 record per 194 mi 2 (502km 2 ).
PREPARATION OF THE MAP
Plate 1 shows the mean annual runoff for the upper Ohio River basin for the 30-year reference period, 1941-70.
The base for plate 1 is a part of the station-location map base used in U.S. Geological Survey Water-Supply Paper 1907.
Three overlays to this base map were prepared showing areas of:1. Drainage basins above long-term, upstream gaged sites.2. Intervening drainage between gaged sites.3. Drainage basins above short-term gaged sites. Values of average runoff for the reference period were entered near the centroid of the described basins. Three overlays were used so that different weights could be given, subjectively, to the three data sources while drawing the lines of equal runoff. The objective was to draw the lines so that the average runoff in each basin or inter-
TABLE 2. Summary of runoff estimates for the 30-year reference period, 70, for short-term gaging stations in the upper Ohio River basin
Explanation of computation procedure STS Short-term station.LTS Long-term station used in ratio computation. N Number of water years of short-term record used in computation Q (N)S or Mean annual discharge in cubic feet per second, for indicated period of
Q (N)'L N concurrent years at the STS or the LTS.
Q (30)L Mean annual discharge, in cubic feet per second, for the period 1941-70
at the LTS. Q (30)S Computed mean annual discharge, in cubic feet per second, for the period
1941-70 at the STS ; averaged if two or more computations made; anestimate.
cfsm(30)S Computed mean annual discharge, in cubic feet per second per square mile,for the period 1941-70 at the STS ; an estimate.
R (30) S Computed mean annual runoff, in inches, for the period 1941-70 at the
STS ; an estimate.
X<? A (30)S <M30)L
86,400 ft" X 12 in./ft 1 ft3/s for 1 day == r= 0.03719 inch depth on 1 mi*
27,878,400 ft?/mi« Reference period 1941-70 = 7 years at 366 days + 23 years at 365 days = 10957 days
average of 365.233 days per year. R (30)S in inches per year = cfsm(30)S X 365.233 X 0.03719
= cfsm(30)S X 13.583,

COMPUTATIONS AND ANALYSIS 21
TABLE 2. Nummary of runoff estimates for the 30-year reference period, 1941- 70, for short-term gaaing stations in the upper Ohio River basin Continued
usesStationNo.03-
Drainagearea(mi*)
Numberof yearsrecord
RA (3Q)(inches)
Allegheny
008000011000011800012000015280
016500017000021700022000023000
025200026500027500028000029400
031000031950032000033000033500
037000037500039200039500042000
042200042250042280042500044500049800
7.7913746.4
17112.8
12885.33.60
59790.2
5.697.84
73.263.012.6
1,2467.38
4588,389
22.1
67.630.03.68
244192
7.3650.459.5
17113.05.78
81787
11
55
138
28
922252014
1210274
4593
21
1346
222
11
21.323.220.825.724.1
24.423.128.425.621.0
19.924.324.526.220.5
24.321.120.823.028.2
20.320.021.219.924.1
23.423.621.521.326.215.1
USGSStationNo.03-
Drainagearea(mi*)
Numberof yearsrecord
#A (30)(inches)
Monongahela
050800050900051500052500054000
057500058000059500000000060100
060500062400062500063500063600
064000064500065500066500067000
069880071000072590072840074000
074300076600078000OS2200084500
29.22.86
12214.56.19
25.710284.6
.29
.92
8.3210.963.2
366.57
46.34158.717.9140
12.21,354
16.313333.1
3.8048.962.59.27
55.9
55
27274
15272775
188
2324
22223
6311059
79
231232
26.837.730.423.619.4
20.921.218.818.521.1
18.620.921.525.518.1
25.028.829.439.931.2
30.829.614.712.315.3
22.321.724.426.916.8
Ohio
086100087000088000088500092090
093500096000097500098500101000
102950
15.617.433.2
17521.8
32.313884.366.39.34
96.7
69
1088
814192821
8
14.013.312.212.314.8
10.811.511.611.814.9
15.7
104500104580104760105000
106300109000111150113700114000
114650115400
79213.02.26
228
51.26.19
10.34.97
134
4.21210
22755
1016134
15
415
14.718.218.817.4
17.911.611.914.915.2
16.216.0
vening area would conform to the plotted value. Full weight was given to data for the long-term sites. In some cases, little or no weight could be given to anomalous values for intervening areas or for runoff estimates for very short-term stations. These amounted to about 25 percent of the data points of these two source classes.
Major topographic features of the region were given some weight in shaping the general pattern of runoff interpreted from the plotted
22 UPPER OHIO RIVER BASIN
values. Runoff patterns are tenuously denned at the boundary of the upper Ohio River basin, because records beyond that boundary were not used in the analysis.
A map of a dynamic resource is subject to revision. The present map for the 1941-70 reference period should be expected to be dif ferent in detail, if not in general pattern, from maps for earlier reference periods, such as 1921-45 (Langbein and others, 1949) or 1931-60 (Busby, 1966). However, the present definition did not exist for earlier periods when significantly fewer long-term records were available for analysis. Mean annual runoff for the 1941-70 reference period, as defined by plate 1, conforms to recorded or computed run off data within 1 inch (25 mm) at more than 80 percent of the data points used.
This map is considered a preliminary version owing to the fact that it is subject to modification when additional factors are con sidered. A more detailed method of analysis was used by Rantz (1974) in constructing a map of mean annual runoff in the San Francisco Bay region.
MEAN ANNUAL RUNOFF
UPPER OHIO RIVER BASIN
The distribution of runoff depicted on plate 1 is primarily a func tion of the pattern of long-term precipitation distribution, although that is but one of several influential factors. The effects of climate, geology, topography, size of area, and vegetation were discussed by Langbein and others (1949) in a report accompanying a map of annual runoff in the United States for the 1921-45 reference period. Langbein's map was updated by Busby (1966) to the reference period 1931-60.
The combined effects of topography and prevailing storm direc tion are evident in the runoff gradients found along the southeastern side of the basin, which includes the upper reaches of the Kiskimi- nclas. Ymighioghony. ("heal, and Tygart Rivers. Here both the mean and variability of annual runoff are at their regional maxima. Mean annual runoff exceeds 32 inches (810 mm) in parts of the upper Cheat River basin, but it decreases to about 18 inches (460 mm) in lower tributary basins.
The effects of topography are reflected also by a gradual increase in mean annual runoff in a northeastward direction across the north-

MEAN ANNUAL RUNOFF 23
west side of the basin. From a regional minimum of less than 12 inches (300 mm) in an area extending from the northern West Vir ginia panhandle to the headwaters of the Mahoning River basin, runoff increases in a northeasterly direction, to about 25 inches (630 mm) across the upper Allegheny River basin from French Creek to East Branch Clarion River. The character of bedrock and regolith changes also in this direction; the changes in properties may have a significant bearing on the distribution of runoff.
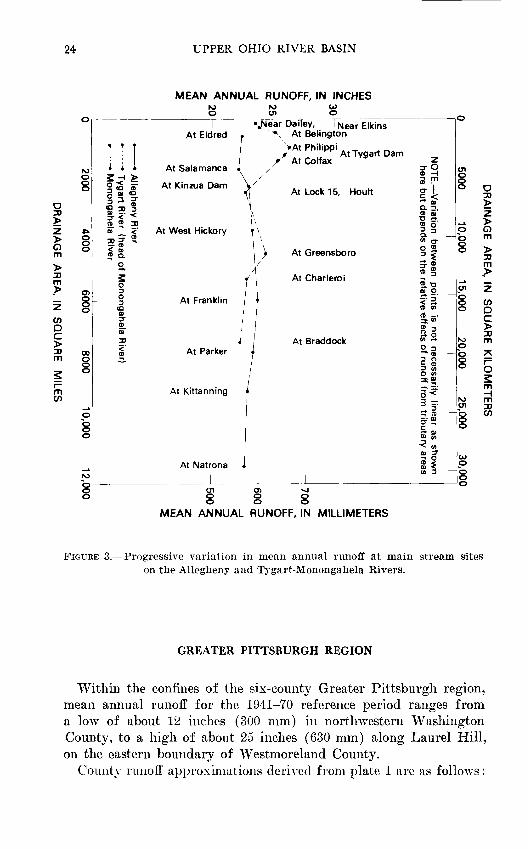
Mean annual runoff at sites on the larger rivers can be determined best bty reference to data in table 1 if the site or reach wliere infor mation is required is reasonably close to a gage location. If inter polation or extrapolation is required, appropriate weighted allow ance must be made for the effect of intervening areas where runoff may differ markedly from that of the basin upstream. For example, mean annual runoff at the mouth of the Allegheny River at Pitts burgh might be estimated at about 0.2 inch (5 mm) less than that at Natrona (22.4 inches, 569 mm) on the basis of about 16 inches (410 mm) of runoff produced from 338 mi 2 (875 km 2 ) of tributary area downstream from Natrona.
The cumulative and progressive effect of changes caused by the relative influence of tributary runoff is illustrated in figure 3, which shows an average annual runoff at successive long-term gaged sites on the Allegheny and Monongahela Rivers.
To estimate the mean annual runoff from smaller rivers or streams, sketch the basin in question on plate 1. If coincident long-term run off data are available, use the information from table 1, modified as described above for disparity in areas between the gaged basin and the basin in question. If short-term runoff data or no information are available for a basin of interest, sketch the basin on plate 1 and approximate the runoff value by areal weighting with respect to the lines of equal mean annual runoff.
County boundaries or geographic locations can be sketched on plate 1 by light-table transfer of that information from the 1:1,000,- 000 version of the U.S. Geological Survey state base map.
An estimate of the annual runoff for a particular geographic area, when determined from a generalized map such as that presented in plate 1, should not be used with greater precision than the nearest inch (25 mm). The nearest 2 inches (50 mm) probably is a more realistic limit in the southeastern part of the basin, where areal variability is greatest. As will be shown later, the runoff during individual years in any long period for which a mean is determined may range from as little as 30 percent of the mean to as much as 200 percent of the mean.
24 UPPER OHIO RIVER BASIN
MEAN ANNUAL RUNOFF, IN INCHES
O3)
>3J
COD
> 3)m
mCO
l_>
roo8
£k
80
0>
o
CD
8o
_ fco
8o
ro "o _
| «JMear Dailey, I Nea r ElkinsAt Eldred . ~V At Belington
T f T *At Philippi . ^ _ : x At Tygart Dam ! \ / AtCorfax z
* * At Salamanca 1 / 3-0
f £ I AtKinzuaDam \ /X * " ~ = a c *1 At Lock 1 5, Hoult ? , § 3 3- \ 5. <<° 3( 5 1 0- .5- <' * f § 2-CD ® 3D b « 6'b7 < p At West Hickory \\ = =
- 3( 3- ® \ & o- "I5' * \ O CD Q. 1> At Greensboro 3 <
~* s. ] / ^ *2 f At Charleroi - 3 o I 2,-a3 09 O
§ At Franklin f £ 2."(Q CD (A09 'I nSi ; I;00 So3» J At Braddock » -*S At Parker I ° i - / ? ° / c CB/ 3 in
1 O 0)
At Kittanning g1 ^« _
3^ CB
|?
09 §>
"^ 0)
5J oAt Natrona < £ $
0) 3
(Jlo o o
.^
po oo
Ol
8o
rop oo o
ro01oo0
COo8̂̂
O Ul O) vjo o o o
o o o
O3»
^Z
0m
3)m
ZCODC
31m^FO
mm31CO
MEAN ANNUAL RUNOFF, IN MILLIMETERS
FIGURE 3. Progressive variation in mean annual runoff at main stream sites on the Allegheny and Tygart-Monongahela Rivers.
GREATER PITTSBURGH REGION
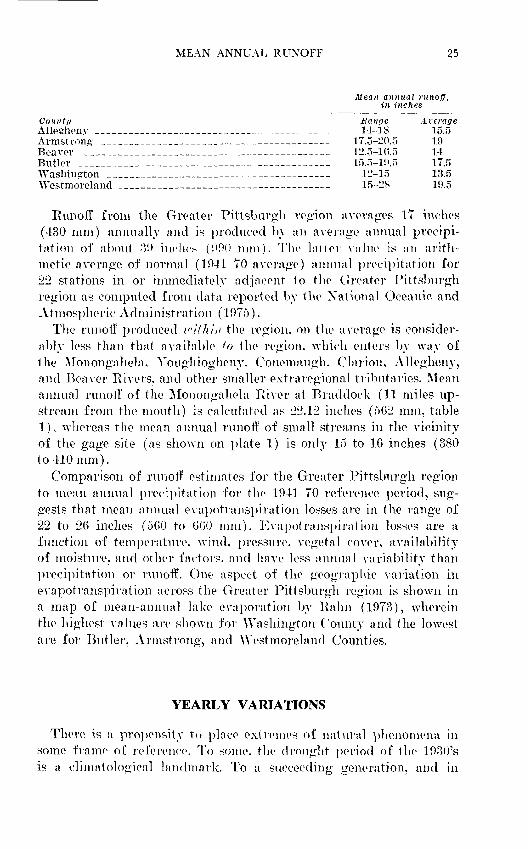
Within the confines of the six-county Greater Pittsburgh region, mean annual runoff for the 1941-70 reference period ranges from a low of about 12 inches (300 mm) in northwestern Washington County, to a high of about 25 inches (630 mm) along Laurel Hill, on the eastern boundary of Westmoreland County.
County runoff approximations derived from plate 1 are as follows:
MEAN ANNUAL RUNOFF 25
Mean annual runoff, in inches
County Allegheny
ButlerWashingtonWestmoreland
Range 14-18
. _ _ 17.5-20.5__ -_ _ 12.5-16.5
15.5-10.512-1515-28
A verage 15.5191417.513.519.5
Runoff from the Greater Pittsburgh region averages IT inches (430 mm) annually and is produced by an average annual precipi tation of about ;>9 inches (990 mm). The latter value is an arith metic average of normal (19-11-70 average) annual precipitation for 22 stations in or immediately adjacent to the Greater Pittsburgh region as computed from data reported by the Xational Oceanic and Atmospheric Administration (1975).
The runoff produced within the region, on the average is consider ably less than that available to the region, which enters by way of the Monongahela. Youghiogheny, Conemaugh. Clarion, Allegheny, and Beaver Rivers, and other smaller extraregional tributaries. Mean annual runoff of the Monongahola River at Braddock (11 miles up stream from the mouth) is calculated as 22.12 inches (5G2 mm, table 1). whereas the mean annual runoff of small streams in the vicinity of the gage site (as shown on plate 1) is only 15 to 16 inches (380 to 410mm).
Comparison of runoff estimates for the Greater Pittsburgh region to mean annual precipitation for the 1941-70 reference period, sug gests that mean annual evapotranspiration losses are in the range of 22 to 26 inches (560 to 660 mm). Evapotranspiration losses are a function of temperature, wind, pressure, vegetal cover, availability of moisture, and other factors, and have less annual variability than precipitation or runoff. One aspect of the geographic variation in evapotranspiration across the Greater Pittsburgh region is shown in a map of mean-annual lake evaporation by Rahn (1973), wherein the highest values are shown for Washington County and the lowest are for Butler, Armstrong, and Westmoreland Counties.
YEARLY VARIATIONS
There is a propensity to place extremes of natural phenomena in some frame of reference. To some, the drought period of the 19.30's is a climatological landmark. To a succeeding generation, and in

26 UPPER OHIO RIVER BASIN
some areas, the dry mid-1960's is a more clearly remembered time. Wet years generally result from the accumulated effect of many individual storm events that are less well remembered.
To place each water year in perspective for the upper Ohio River basin, ratios of annual mean discharge to the average for the 30- year reference period (1941-70) were computed as illustrated in figure "2. These ratios have been compiled in table 3 (in pocket) for each year of record for all long-term stations. They might be termed modular or normalized values of discharge or annual runoff, for they are percentages of average divided by 100. For example, the 1.19 ratio for the 1973 water year at station 1145 means that the dis charge for that year was 119 percent of the 1941-70 average.
In order to extend the series of annual ratios, annual mean dis charges for former gage sites on some streams were adjusted by a drainage-area ratio to approximate discharge of the drainage area at the current site. Eecords thus combined were noted in remarks on table 1.
The ratios for many individual years, particularly the drier years, are remarkably consistent over a considerable part of the basin, Avhich gives evidence to the relative climatic homogeneity of the region.
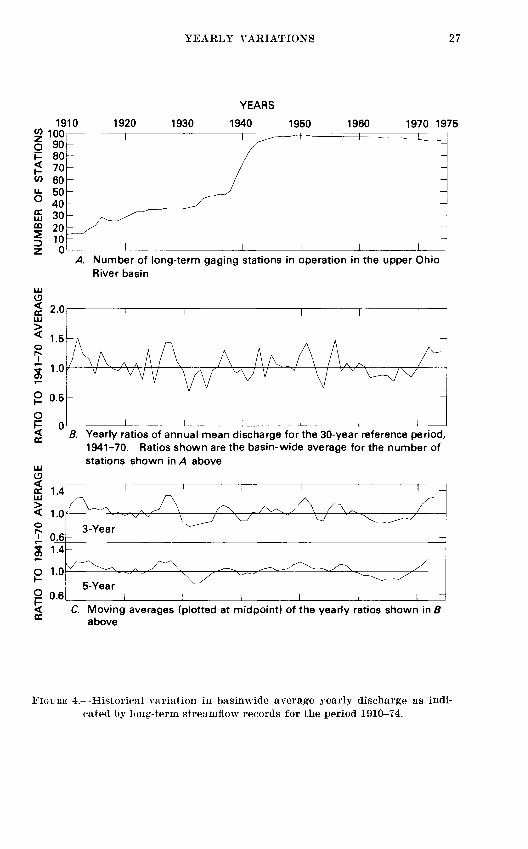
Observations of stage and discharge were made at a few sites in the basin before the turn of the century. Systematic and continuous collection of records having some semblance of basin wide coverage began in about 1910. Figure 4J shows the historic variation in number of stations in operation, considering only those stations which were continued in operation for more than about 25 years.
The basinwide average of the annual ratios for all stations in oper ation after 1910 is shown in figure 4/7. The sequence of average yearly ratios for the four principal subdivisions of the upper Ohio River basin is illustrated in figure 5 by plotting data given in table 4. Busby (1963) showed similar graphs of yearly variations in run off for nine regions of the conterminous United States for the period 1931-60.
Two drought periods are evident in the record since 1910, that of the early 1930's and that of the mid-1960's. The duration and in tensity of the deviation from average during those periods is demon strated in figure \C by 3- and 5-year moving averages of the data shown in figure 47?. The parly 1010's. late 192ffs, and early 1950's show up here as sustained wet periods. The 1950's would have been a prominent wet period were it not for much-below-average runoff in 1954. After beginning near average, the 1970's have been years of
YEARLY VARIATIONS 27
YEARS
1920 1930 1940 1950 1960 1970 1975
A. Number of long-term gaging stations in operation in the upper Ohio River basin
2.0
1.5
1.0'
0.5
B. Yearly ratios of annual mean discharge for the 30-year reference period, 1941-70. Ratios shown are the basin-wide average for the number of stations shown in A above
DC LLJ
$
O
i Po
1.4
1.0
0.6
1.0
0.6
_ l l I i I I _
3-Year ^^
^_ , y~\ _ _^/^,^ X "5-Year
^ i i i i i iC. Moving averages (plotted at midpoint) of the yearly ratios shown in B
above
FIGURE 4. Historical variation in basinwide average yearly discharge as indi cated by long-term streamflow records for the period 1910-74.

TABL
E 4
. Su
bbas
in a
nd
basi
n av
erag
es
of t
he r
atio
s of
mea
n an
nual
dis
char
ge
to
the
aver
age
for
the
30-y
ear
refe
renc
e pe
riod
19
^1-1
0 fo
r lo
ng-t
erm
str
eam
-gag
ing
stat
ions
in
the
uppe
r O
hio
Riv
er b
asin
(P
enns
ylva
nia,
New
Yor
k, M
aryl
and,
nor
ther
n W
est
Vir
gini
a, a
nd e
aste
rn O
hio)
[Num
bers
se
t in
ita
lic
indic
ate
num
ber
of r
ecor
ds u
sed
to
deri
ve
the
subb
asin
av
erag
e (A
v).
UA
: U
pper
All
eghe
ny R
iver
sub
basl
n ;
CL
A:
Cen
tral
an
d
Low
er
All
eghe
ny
Riv
er
sub
bas
ins;
M
on.:
M
onon
gahe
la
Riv
er
subb
asin
; O
hio:
O
hio
Riv
er
trib
uta
ry
area
fr
om
Pit
tsburg
h
to
Mar
iett
a;
Ba
si
n :
The
27,
300
mi2
upp
er
Ohi
o R
iver
bas
in
up
stre
am
from
M
uski
ngum
R
iver
]
UA j
CLA
Ohio
UA
CLA
Mon.
Ohio
Basin
*Av
#Av
#Av Av
1 f
Av
Av
#Av
*Av
#Av
lv
1899,
1900,
1901
1,1, 1
1.55
, .97,
1.35
___ 1.
55,
.97,
1.35 1920
___
6 ___
0.78
6
___
1.16
___
10
___
1.27
___
6 ___
1.03
___
28
___
1.09
1902
I 1.35
1 1.35
1921
7 0.84
6 .92
12 .8
4 6 .94
31 .8
7
1903
1 1.78
1 1.78
1922
6 0.89
6 1.03
H 1.18
7 1.07
S3 1.08
1904
1 1.28
1.96
2 1.12
1923
6 0.69
6 .7
9 Ik .8
7 7 .70
SS .7
9
1905
1 0.86
2 1.00
3.95
1924
~ 0.94
6 1.34
15 1.38
7 1.
45
35 1.30
1906
0.82
1.88
2.85
1925
7 0.70
6 .64
15 .7
2 7 .76
55 .7
1
1907
1 1.09
1 1.12
2 1.10
1926
0.96
6 .99
15 1.18
7 1.
20
55 1.10
1908
i in
3 1.39
3 1.39
7 1.38
1927
1.25
6 1.38
IS 1.45
10
1.50
56 1.41
1909
2 1.01
5.92
S.7
4
8.87
1928
1.28
6 1.57
IS 1.23
10 1.58
56 1.40
1910
6 n 09
4.86
*.93
n.91
1929
1.14
5 .93
IS .9
2 11
1.32
56 1.09
1911
1.16
4 1.01
5 1.13
15 1.
11
1930
0.96
5 .8
3 IS
.78
11 1.05
36 .93
1912
1.33
4 1.60
5 1.55
1 1.64
15 1.50
1931
0.61
5 .58
IS .6
9 J2
.46
37 .58
1913
5 1.31
4 1.22
5 1.06
1 1.36
15 1.20
1932
0.86
5 .7
6 14
.92
J2.88
38 .87
1914
5 1.04
5 1.11
6 1.14
5 1.22
19 1.12
1933
9 0.73
6 .96
16 1.14
IS .9
0 44
.96
1915
6 0.87
5.88
6.82
4 .94
2J.87
1934
9 0.63
6 .69
18 .7
4 IS
.45
46 .63
1916
6 1 21
5 1.35
111.26
6 1.24
281.27
1935
9 0.75
7 .98
J8 1.12
IS
.83
47 .95
1917
6 1.06
5 1.00
101.11
5.9
2261.
04
1936
11 0.91
6 1.06
18 1.13
IS .9
7 48 1.02
1918
6 0.93
5.9
39 1.04
5 .98
25.9
8
1937
11 1.23
6 1.41
J8 1.19
IS 1.44
48 1.30
1919
6 0.92
6.9
610
.90
*«,
26.92
1938
It 1.06
7 1.06
18 1.08
14 1.16
51 1.09
HU s~ 0 HH O & N-l < w & g c/a HH 2

UA #
Av ___
CLA #
Av
Mon. #
____
Av ___
Ohio #
___
Av ____
Basin # ___
Av ___
UA #
Av ____
CLA #
Av ___
Mon. #
____
Av ___
Ohio #
____
Av ___
Basin # ___
Av __
__
1939
IS0.82
IS.79
22.9
815
.94
63.90
1958
150.92
20.9
8361.19
26 1.08
971.08
1940
Ik 1.02
18.93
24.99
15.98
71.98
1959
151.
0720
.92
36.75
26 1.19
97.95
1941
Ik 0.74
19.79
SO.82
20.76
83.7
8
1960
151.
13201.
11361.
0126 1.
14971.08
1942
15 0.98
19.88
32.86
24.94
90.90
1961
150.83
20.98
36 1.18
26.90
971.
01
1943
151.
42191.
32341.
29251.
3693 1.
34
1962
150.69
20.83
36.99
26.70
97.83
1944
15 0.83
19.82
34.88
26.71
94.81
1963
150.
7320
.78
361.
0526
.68
97.85
1945
15 1.13
201.
25351.32
26 1.07
96 1.21
1964
150.89
20.94
36.88
25.85
96.88
1946
151.07
21 1.09
35.96
26 1.08
97 1.04
1965
150.90
20.85
S6.87
25.84
96.86
1947
151.
2521
.97
35.76
26 1.19
971.00
1966
150.93
20.86
36.67
25.77
96.78
1948
15 0.97
SI 1.02
351.12
26.88
971.01
1967
15 1.02
20.98
361.08
25.92
9,6 1.01
1949
15 0.81
21.90
361.09
26.90
98.96
1968
151.
0220
.90
55.90
25.88
95.91
1950
15 1.14
SI 1.12
36 1.29
26 1.26
981.22
1969
15 1.08
20.76
35.74
25.88
95.84
1951
15 1.32
Zl1.48
S6 1.31
261.50
98 1.40
1970
15 0.98
201.
10351.
0025
.92
95.99
1952
151.15
201.20
361.05
26 1.38
971.
19
1971
151.12
201.26
341.20
25 1.11
941.
18
1953
15 0.90
20.95
36.84
26 . .74
97.85
1972
151.36
201.43
341.40
24 1.21
931.35
1954
15 0.79
20.70
36.63
26.62
97.67
1973
151.13
201.22
341.26
24 1.36
931.25
1955
15 0.95
201.14
361.19
26 1.20
971.14
1974
15 1.10
201.
26341.
28241.
35931.
26
1956
1957
15
151.
46
0.94
20
201.50
.89
36
361.33
.95
26
261.
67
.96
97
971.48
.94
1975
___
___
___
__ _
___
M H w t* M .^ hf. s 0 CO

30 UPPER OHIO RIVER BASIN
Reference period
1.7
1.4
1.0
- UPPER ALLEGHENY RIVER SUBBASIN (Upstream from Clarion River)
A/\ r\ A A^A A /\
60.4L
14 15 15 15
CENTRAL AND LOWER ALLEGHENY RIVER SUBBASINS
21 20 20
- MONONGAHELA RIVER SUBBASIN
OHIO SUBBASIN (Tributary area from Pittsburgh to Marietta)
1910 1920 1930 1940 1950 1960 1970 1975
NOTE Numbers at decade points are the number oflong-term gaging station records used.
FIGURE 5. Subbasin variations in yearly discharge.
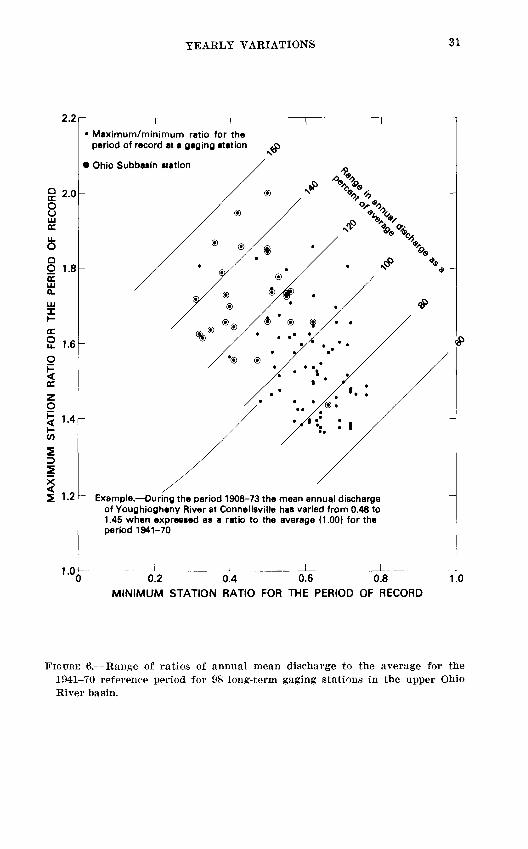
YEARLY VARIATIONS 31
2.2
2.0
1.8
1.6
1.4-
5 1.2
1.0
Maximum/minimum ratio for the period of record at a gaging station
1 Ohio Subbasin station
Example. During the period 1908-73 the mean annual discharge of Youghiogheny River at Connellsville has varied from 0.48 to 1.45 when expressed as a ratio to the average (1.00) for the period 1941-70
0.2 0.4 0.6 0.8 MINIMUM STATION RATIO FOR THE PERIOD OF RECORD
1.0
FIGURE 6. Range of ratios of annual mean discharge to the average for the 1941-70 reference period for 98 long-term gaging stations in the upper Ohio River basin.

32 UPPER OHIO RIVER BASIN
above-normal runoff in the upper Ohio River basin (fig. 4Z?). The sequence of basimvide averages shows that 107'J was a moderately high runoff year; partly the result of "extra" runoff generated by Tropical Storm Agnes in June. Records for selected index stations indicate that above-normal runoff has persisted through the 1975 water year (U.S. Geological Survey and others, 1975, p. 20).
The cyclic trends of moving averages (fig. 46/ ) are interesting, but the^ ,-lould not be considered as a forecasting mechanism.
Annual mean discharge differs considerably from year to year, as amply demonstrated by data for individual stations. Within table 3, ratios indicate a total range from about 30 percent of average (sta tion 0980 in 1934) to 200 percent of average (station 0855 in 1928). Distribution of the range in ratios for individual stations is sum marized in figure 6.
In general, total annual variability is greatest in Ohio River tributary basins below Pittsburgh, but there is no evident correlative characteristic. The range in ratios is least among some sites that seem to reflect attenuating effects of reservoir storage or large drain age area, but this observation is not consistently demonstrable.
REFERENCES
Busby, M. W., 1963 Yearly variations in runoff for the conterminous United States, 1931-60: U.S. Geol. Survey Water-Supply Paper 1G69-S, 49 p.
, 1966, Annual runoff in the conterminous United States: U.S. Geol. Sur vey Hydrol. Inv. Atlas HA-212.
Langbein, W. B. and other, 1949, Annual runoff in the United States: U.S. Geol. Survey Circ. 52, 14 p.
Rahn, J. J., 1973, Pan and lake evaporation in Pennsylvania: Institute for Re search on Land and Water Resources Inf. Rept. 69, The Pennsylvania State University, 23 p.
Rantz, S. E., 1974, Mean annual runoff in the San Francisco Bay region, Cali fornia, 1931-70: U.S. Geol. Survey Misc. Field Studies Map MF-613, 2 sheets, 24 p.
U.S. Geological Survey, 1973, Catalog of information on water data, Water Re sources Region 05 (Ohio), edition 1972: Office of Water Data Coordination rept, 213 p.
U.S. Geological Survey, and Canada Dept. of the Environment, 1975, Water re sources review, September 1975: U.S. Geol. Survey monthly release, 20 p.
(U.S.) National Oceanic and Atmospheric Administration, 1975, Climatological data, Pennsylvania, annual summary 1974: Environmental Data Service, Asheville, N.C., v. 79, no. 13, 15 p.
&U.S. Government Printing Office: 1977 240-961/160

WATER-SUPPLY PAPER 2042 PLATE 1
78C
41
/PENNSYLVANIA
39°
79C
20 30 40 50 MILES
1 I I I 0 5 10 20 30 40 50 KILOMETERS
EXPLANATION
A0145 Long-term station
^0960 Short-term station
^1005 Other stations for which data are given in WSP 1305 or 1907
0485 Stations for which records have been combined
Lines of equal mean annual runoff, in inches, for ref- 26 26 erence period 1941-70. Interval 2 inches. (1 inch=
25.4 millimeters).
" " ̂ Upper Ohio River basin boundary
Greater Pittsburgh region boundary
~" Subbasin boundary
1 £ Pennsylvania subbasin number; applies only to part within state
Abbreviated station numbers are shown; Part prefix (03) and suffix zeros omitted. Complete form: 03010500.
Base compiled, with some modification, from River Basin Maps, IACWR. Subcommittee on Hydrology
INTERIOR GEOLOGICAL SURVEY. RESIGN. VA. 1977-G76312
MAP OF OHIO RIVER BASIN ABOVE MUSKINGUM RIVER SHOWING MEAN ANNUAL RUNOFFAND LOCATION OF GAGING STATIONS