mean-scatterer spacing estimates with spectral correlation
TRANSCRIPT
Mean-scatterer spacing estimates with spectral correlation Tomy Varghese and Kevin D. Donohue Department of Electrical Engineering, University of Kentucky, Lexington, Kentucky 40503
(Received 31 August 1993; revised 11 May 1994; accepted 20 July 1994)
An ultrasonic backscattered signal from material comprised of quasiperiodic scatterers exhibit redundancy over both its phase and magnitude spectra. This paper addresses the problem of estimating mean-scatterer spacing from the backscattered ultrasound signal using spectral redundancy characterized by the spectral autocorrelation (SAC) function. Mean-scatterer spacing estimates are compared for techniques that use the cepstmm and the SAC function. A-scan models consist of a collection of regular scatterers with Gamma distributed spacings embedded in diffuse scatterers with uniform distributed spacings. The model accounts for attenuation by convolving the frequency dependent scattering centers with a time-varying system response. Simulation results indicate that SAC-based estimates converge more reliably over smaller amounts of data than cepstrum-based estimates. A major reason for the performance advantage is the use of phase information by the SAC function, while the cepstrum uses a phaseless power spectral density that is directly affected by the system response and the presence of diffuse scattering (speckle). An example of estimating the mean-scatterer spacing in liver tissue also is presented.
PACS numbers: 43.60.Cg, 43.80.Cs
INTRODUCTION
Ultrasonic backscattered signals from biological tissue contain information regarding resolvable scatterer structures. The information, however, is corrupted by echoes from dif- fuse (unresolvable) scatterers. • This paper examines charac- terizing tissue microstructure variations with the spectral cor- relation components of the backscattered signal. The spectral autocorrelation (SAC) function provides an estimate of the mean-scatterer spacing that uses phase information to reduce the degradation caused by the system effects and the pres- ence of diffuse scatterers. 2-7 It has been shown that increas-
ing regularity of the scatterer spacing gives rise to well- defined local maxima among the correlation components in the SAC function. 4'5 This paper demonstrates superior per- formance for spectral correlation methods over methods that simply use the power spectral density (PSD).
The mean-scatterer spacing parameter has been pro- posed for tissue characterization. Fellingham and Sommer 8 used mean-scatterer spacing to differentiate between normal and cirrhotic liver. Their algorithm was based on the detec- tion of spectral peaks in the PSD. The cepstrum was initially used for tissue characterization by Kuc 9 in order to reduce the system effects in the PSD. Performance comparisons be- tween cepstral methods for detecting the mean scatterer spacing m showed that the AR model performs better than FI•T methods for smaller gate lengths. Wagner et al. n'•2 pro- posed the use of three scatterer features to classify tissue architecture: the mean-scatterer spacing, the ratio of specular to diffuse scatterer intensities, and the fractional standard deviation in the specular scatterers. Intensity (squared enve- lope) images were used to estimate the individual contribu- tions of diffuse and regular scattering to the overall intensity. The scatterer spacing was estimated from the power spec- trum of the intensity by a weighted thresholding procedure.
This work models soft tissue as an acoustic medium
containing two types of scatterers. The first component is the diffuse scatterers, which are uniformly distributed through- out the tissue and are of a sufficient number to generate an echo signal with circular Gaussian statistics. TM The second class of scatterers have regularity associated with them and contribute to the specular echoes in the backscattered ultra- sound signal. This paper models the spacings between these regular scatterers with a Gamma distribution. The Gamma distribution provides a flexible method for simulating para- metric regularity in the scatterer spacing. Landini and Verrazini •3 demonstrated that both average interval spacing and the variance of the spacing could be parametrically de- scribed using a Gamma distribution. The mean and variance of the scatterer spacings were estimated from the periodicity and attenuation of the cepstral peaks. The aim of this paper is to demonstrate the advantages of using spectral redundancy in estimating the mean-scatterer spacing. This paper com- pares the estimation performance enhancement attained us- ing a spectral redundancy technique (SAC), relative to a cep- stral analysis technique using the PSD. m
A brief description of the mean-scatterer spacing estima- tors are discussed in Sec. I. Section II discusses the simula-
tion experiment and analyzes the relative merits of the tech- niques used in determining the scatterer spacing. Application of these methods to in vivo data from liver tissue is discussed
in Sec. IV. Finally, Sec. V summarizes the significance of the results obtained to tissue characterization using ultrasound.
I. THEORY
The tissue model consists of a sparse collection of ran- domly distributed, weak scattering particles that interact with
3504 d. Acoust. Soc. Am. 96 (6), December 1994 0001-4966/94/96(6)/3504/12/$6.00 ¸ 1994 Acoustical Socieb/of America 3504

the incident pulse only once (multiple scattering is assumed to be negligible). The tissue scatterers within the ultrasonic beam field can be written as
x(t)= • a•(t-•,,)+ •] v,,(t-O.). n=l n=l
(1)
window, and J represents the amount of overlap between the uth and u+lth tapered data segment (i.e., (l-l/J)X100 is the percent overlap between segments for l<-•-J<oo). Let N• and N o denote the number of regular and diffuse scatterers that contribute to the A-scan segment over the interval T. The Fourier transform of Eq. (3) with respect to r, at a given time t, can be written as
where t is a time axis (related to the distartce by the velocity of the pulse), No is the total number of diffuse scatterers, u, denotes the reflectivity of the nth diffuse scatterer, 0,• repre- sents the delay associated with the nth diffJse scattering cen- ter, N s is the total number of regular scatterers, a, denotes the reflectivity of the nth regular scatterer. and r, represents the delay associated with the nth regular scattering center.
The attenuation of the propagating ul'.rasound pulse de- pends on the scattering and absorption properties of the tis- sue. The impulse response due to the system and propagation path (to and from the scatterer field), is represented by a time varying system response function h(t,r). The impulse re- sponse changes with time due to the frequency dependent attenuation of the pulse as it propagates through the tissue. The A-scan corresponding to the scattere] field can now be written as
(Ns y(t)=• h(t,r) • a,(r-r,)
+ • v.(T- 0•) clr, (2)
where •, the variable of integration, represents the system response axis at a given time t.
For nonstationary signal analysis, the periodogram and the SAC functions are computed over small windowed seg- ments of the A-scan with a data tapering Welch window, using the Welch-Bartlett technique. is Detectability of the mean-scatterer spacing requires the presence of at least two regular scatterers within the window (i.e., T>A, where A is the mean-regular scatterer spacing and T is the window length). Adjacent overlapping data segmmts are averaged (Welch-Bartlett technique •8) to obtain the PSD and SAC function estimates from the A scan. A single windowed seg- ment is denoted by
= y r-t+uy wr(r), -•'•<r•<:• -, (3) 0, elsewhere
where Yr(') represents a tapered data se,;ment centered at t-uTIJ of finite duration T, wt(-) represents the tapered
Yr f;t-u =H(f;t) • A,(f )e
+ • V.(f )e n=l
(4)
where f is frequency, H(f ) and Y(f ) are the Fourier trans- forms of h(r) and y(r), respectively, and A•(f ) and V•(f ) denote the frequency dependent scattering strength of scat- terer a,(r) and v•(r), respectively.
A. The spectral autocorrelation function
The phase and magnitude spectrum of backscattered en- ergy from regularly spaced scatterers contains information related to the spacing mean and variance. While the PSD can be used to characterize the scatterer spacing, it relies only on the magnitude spectrum, which is directly affected by the system response and diffuse scattered energy. The SAC funi:- tion, however, uses information in the phase spectrum, which results in local maxima in the bifrequency plane where the mean contributions of the diffuse scatterer energy is zero (this is not the case for the PSD). As a result, the SAC func- tion provides a more robust estimate than the PSD for scat- terer spacing in the presence of diffuse scattering. These points are illustrated in this section by defining the SAC function and deriving a relationship between the regular and diffuse scatterer distributions and local maxima in the SAC
function.
The SAC function 2 is defined over a bJfrequency plane by
Sr(f•,f2;t) =E[Yr(f• ;t)¾•(f2;t)]
L+I Yr fi;t-u u -L2
where Yr(') is the Fourier transform of the windowed A-scan segment, and Y•-( ß ) is its complex conjugate. The approximation to the expected value is denoted by the aver- age of L +1 local segments. The relationship between the SAC function and the scatterer configurations is seen by sub- stituting in Yr(') from Eq. (4), and assuming the attenuation of the pulse over the region of interest, defined by t and L is negligible
3505 J. Acoust. Soc. Am., Vol. 96, No. 6, December 1994 T. Varghese and K. D. Donohue: Mean scatterer spacing estimates 3505

[ N; Sr(f•,f2;t)=H(f•;t)H*(f2;t)XE[ • • An(fOA•*(f2)e -j2•rff•n-f2r=)+ • • An(f•)Vm*(f2) e-j2•r(lh•n-f2ø=)
[n=l ra=l n=l ra=l
N D N S N D N D
n=l m=l n=l ra=l
Vn(f l ) Vm* (f 2)e- J2*r(11On- f 20m ) (6)
Under the assumption that the diffuse scatterer sizes and positions are uncorrelated with the regular scatterers, the ex- pected value of the summation cross-product terms between the diffuse and regular scatterers in Eq. (6) reduces to zero
Sr(fl,f2;t)
The ith scatterer position is represented by i equal intervals from the beginning of the segment. This change of variables gives a good approximation to the actual spacing when the scatterer spacing variance is small. For the extreme case where the scatterer spacing is constant, A i = A, Eq. (8) can be expressed as:
-- H(f, ;t)H* (f2 ;t)
X E • A•(fl)A•*(f2)e -12•(f•-f:•) n=l m=l
n=l m=l
V•(f•) Vm* (f2)e -j2 •r(1, 0n-I20,.) (7)
Since the diffuse scatterer sizes and positions are uncor- related with each other, cross-scatterer terms in the second summation term become zero {i.e., g[v•(fOVm*(f2) X e-J2•r(1•ø•-12ø'"))=O, tn-•n]. In addition, if the diffuse scatterer process is wide-sense stationary over the region of interest, the terms where f•f2 are also uncorrelated? Thus, Eq. (7) can be rewritten as
Sr(f•,f2;t)
=H(f • ;t)H*(f 2 ;t)
E[•=i • A,(fl)A•*(f2)e -'2'•(f'•-f2•) m=l
E[ V,(f,) V•* (f2)16(L - f2) (8)
Since the frequency components of the diffuse scatterer echo signal are uncorrelated, they contribute only to the di- agonal of the SAC function, which is the PSD of the diffuse component. Thus, the expected value of the diffuse scatterer components do not contribute to the off-diagonal compo- nents of the SAC function.
To create a variable related to the scatterer spacing, the following substitution is made
ST(fl,f2;t)
=H(f i ;t)H*(f • ;t)
E Z An(fl)Am*(f2) e-j2*ra(fln-f2m) ra=l
+ • E[Vn(f,)Vn*(f2)]B(f•-f2) ß n=l
(10)
The regular scatterer summation in Eq. (10) indicates when f•n-f2rn equals integer multiples of 1/A for all tn and n, the individual terms in the summation are in phase and local maxima occur at these points. The maxima occur both along the PSD axis, where f• =f2 = k/A, and throughout the rest of the SAC function, where f•-f2=k/A (for k =+-1,2,3;...). When the regular scatterer spacings are ran- domly (Gamma) distributed, similar local maxima occur. These maxima, however, are less pronounced for greater variance in the scatterer spacings. 6
In the cepstral approach for estimating mean-scatterer spacing, the system effect is reduced from the scatterer com- ponent by taking the logarithm of Eq. (10) (to change mul- tiplicative relationships to additive), and then applying high- pass filtering? The diffuse component, however, is not separated from the regular component in this process, since they remain together in the argument of the logarithm term. On the other hand, the spectral region of the SAC function where f• v• f2 contains no contribution from the diffuse scat- terers. Therefore, when the SAC function is computed from the data, the off-diagonal terms result in higher regular-to- diffuse scatterer signal ratio than the diagonal terms (PSD components) after sufficient averaging.
A normalization for the SAC function provides a way of minimizing the amplitude variations due the system and propagation effects. The normalization is given by
•'t
A•= w-. (9) P(f• ,f2)= S(L ,f2)/x/S(f• ,f•)S(f2,f2), (11) l
3506 d. Acoust. Soc. Am., Vol. 96, No. 6, December 1994 T. Varghese and K. D. Donohue: Mean scatterer spacing estimates 3506
where P(fl ,f2) denotes the correlation coefficient. Note the resulting diagonal of the normalized SAC function is unity. Thus, all the information regarding scatten:r spacing is in the off-diagonal components of the normalized SAC function, and amplitude variations in the spectrum due to systems ef- fects are eliminated.
Normalization was not used previously by Varghese and Donohue, 4 where the smallest scatterer spacing was deter- mined graphically by the spectral correlation peak farthest away from the PSD diagonal. In the case of very regular tissue other spectral peaks occur closer to the PSD diagonal that correspond to larger scatterer spacing'a harmonically re- lated to the smaller spacing. Due to the amplitude variation in the spectrum from the system response, spectral correla- tion peaks closer to the PSD diagonal have larger magnitudes as a result of their corresponding spectral zomponents being closer to the center of the system bandwidth. Since the nor- malization used in Eq. (11) divides the spectral correlation peak magnitude by the square root of the product of the magnitudes of its corresponding components along the PSD, the magnitude variations from the system are effectively re- moved, and correlation peaks which remain are due to the coherence in the phase information.
It should be noted that the magnitude: variations in the PSD diagonal due to the scatter spacings are also eliminated by this normalization. The phase information, however, is sufficient to generate local maxima in the bifrequency plane for detecting the scatterer spacing. Thus, normalization of the SAC function allows for consistent detections of the spectral correlation peak location irrespective of the distance from the PSD. A simple numerical algorithm can be used to detect the maximum peak in the off-diagonal components (i.e., visual inspection of the SAC function is not necessary).
Since normalization is performed in the frequency do- main and the system is band limited, useful information about the scatterer spacing is determined by the pulse width. To avoid amplifying low signal-to-noise (SNR) spectral re- gions, normalization is performed only in the region where significant energy is present in the PSD (typically the 3-6 dB region of the received signal spectrum). Spurious peaks will occur if low SNR regions are included in the normaliza- tion window (i.e., usually below the 10-dE bandwidth of the received pulse). These peaks will result in scatterer spacings being detected near or beyond the resolution limit of the system when no regular scatterer spacing is present in the tissue.
B. The power spectrum
Classical methods of estimating the power spectrum are based on the periodogram. The PSD is defined by
P•(f )=E[IYr(f;t)l 2]
--L+I •" Yr f;t-u • , (12) u=-L 2
where L + 1 is the number of segments ax eraged. The rela-
tionship between the PSD and the scatterers is obtained from Eq. (8) by substituting f• =f2=f, to obtain
Pr(f ) = H(I; t)H* (f;t)
x e •, A•(f)A•*(f)e
+ e[v(l )v2(I )] . .3)
Using the change of variables in Eq. (9), with a constant scatterer spacing Ai=A, Eq. (13) reduces to
Pr(f )=H([;t)H*(f;t)
x e )e
+ )] . 04)
We can see f[om Eq. (14), for the regular scatterers, that iff is a multiple of l/A, all the summation te•s are in ph•e and local maxima occur in the PSD. These periodic peaks in the PSD have been used directly for dete•ining the average scatterer spacing in very regular tissue. 8-m'13
C. The cepstrum
Periodicity in the PSD produces a dominant peak in the cepstrum, which is used to determine the scatterer spacing. The cepstrum is the most commonly used method to detect the scatterer spacing. The cepslrum is defined as the Fourier transform of the logarithm of the PSD. The logarithm of Eq. (14) results in
log PT(f ) = 1og[H(f;t)H*(f;t)]
+log E •] •] An( f )A•*(f )e j2•a/(n-m) rt=l m--I
+ E[V.(f )V2(f)] . (15)
•pstral processing assumes slow variations for the sys- tem response [first log te• in Eq. (15)] with respea to the variations in the regular scatterer spacing [second log te• in Eq. (15)]. As a result, the log of the system response is re- duced (using a high-pass filter) and the inverse Fourier trans- form is taken. The scatterer spacing periodicity now m•i- rests itself as pea• at integer multiples of •, with the dominant peak at 5. The dominant peak is used to determine the mean-scatterer spacing in tissue. lø Obse•e also from Eq. (15) that the PSD resulting from the diffuse scatterers adds directly to the regular scatterer component within the argu- ment of the logarithm. As a result, simple spectral filtering
3507 J. Acoust. Soc. Am., Vol. 96, No. 6, December 1994 T. Varghese and K. D. Donohue: Mean scatterer spacing estimates 3507

will not directly reduce this degradation of the cepstrum for regular scatterers.
The mean-scatterer spacing is computed from the loca- tion (At) of the dominant peak in the cepstrum estimated from the PSD. For the SAC function, the location of the dominant peak among the off-diagonal spectral components at (f•,f2), corresponds to a frequency difference (Af=f•-f2) that is used to compute the mean scatterer spacing
V 1
d= 2A-• = 5 VAt, (16) where V denotes the velocity of propagation of the ultra- sound pulse.
The finite bandwidth, of the interrogating pulse imposes limitations on the average scatterer spacing which can be resolved by the imaging system. The mean-scatterer spacing is resolved, if the correlation length of the system impulse response is shorter than the spacing between the individual scatterers. For scatterers not resolved by the system, local maxima corresponding to scatterer spacing is not observed. Simulation results for the case of unresolvable scatterers
have shown relationships between the average spectral cor- relation (average of all correlation term magnitudes in off- diagonal region) and the unresolvable scatterer density. 22 When no regularity is present in scatterers, the dominant peak tends to occur near the first off-diagonal (due to leakage from the PSD).
This section presented different methods used to detect the scatterer spacing. Cepstral techniques require high-pass filtering to reduce the system effect from the tissue signature, which involves setting a cutoff frequency for the filter. The cutoff frequency can be set to pass the minimum detectable scatterer spacing (i.e., on the order of the pulse width) or higher, if the range of scatterer spacing of interest is known. The SAC function does not require high-pass filtering, how- ever, a frequency window must be applied before normaliza- tion to ensure information is taken only from the spectral region of the imaging system. The estimation technique us- ing the SAC function detects the location of the dominant off-diagonal component, and uses this information to com- pute the scatterer spacing. Simulation results presented in the next section show the performance improvement obtained using the SAC function to detect periodicities in the presence of diffuse backscatter and varying regularity in the regular scatterers.
II. SIMULATION
A-scans with known tissue and signal parameters are simulated using Eqs. (2) and (4). The simulator parameters were chosen within the range of values reported in literature from experimental research with different types of tissue in vitro? -•7 The size of the quasiperiodic (regular) scatterers was constant for all the simulations. Scatterer sizes influence
the frequency dependence of the pulse scattering and attenu- ation for the propagating ultrasonic pulse. The scatterer size for the regular component of the scattering was chosen as 80 ttm. The Gamma function was used to describe the scatterer
distribution for regular scattering. Scatterer spacings were simulated from cases with a very irregular spacing (large standard deviation), to cases with almost deterministic spac- ings (corresponding to Gamma orders from 50-1000, re- spectively). The diffuse component was modeled using a uni- form distribution for scatterers (size 10 /zm) with the scatterer density chosen to simulate Gaussian statistics for the scatterer number (about 15-20 scatterers per resolution cell using a Poisson distribution). The absorption coefficient was chosen as 0.94-dB cm -] (corresponds to measured val- ues for liver tissue) and a diffuse-differential scattering coef- ficient of 9X 10 -4 cm -1 sr -1 for backscattering at an angle of 180 ø, measured at 3 MHz?
The pulse parameters are used to obtain the initial sys- tem response h(t) which is modified as the pulse propagates through the microstructure due to the frequency dependent attenuation. The interrogating pulse was simulated with a center frequency of 3.5 MHz and a Gaussian shaped enve- lope. The propagation velocity of the pulse through biologi- cal tissue was set at 1540 m/s. The bandwidth of the pulse should be at least I/A, in order to observe spectral peaks due to the distribution of the scatterers in the microstructure. The
simulated pulse had a 3-dB bandwidth of 1.9 MHz, which limited the minimum detectable scatterer spacing to 0.41 mm.
The regular scattering component was simulated with a scatterer spacing of 0.51 mm. A gate length (T) of 4 mm or 128 data points was used to form the PSD and the SAC function estimates. The mean-scatterer spacing was esti- mated from the FFF cepstrum. The cepstrum was filtered using a high-pass filter with cutoff frequency 1.5 MHz to reduce system effects. The scatterer spacing was also esti- mated from the location of the largest off-diagonal peak of the SAC function. The simulation was performed for regular scatterers with different spacing variances and different strengths of the diffuse component.
When estimating the SAC function, with a hopping win- dow, a phase correction factor is helpful for correcting the phase difference between regular scatterer positions and the center of the window. For regularly spaced scatterers the relative phase difference between the center of the window and the scatterer location degrade the coherent sums in the off-diagonal regions of the SAC function. When consecutive SAC functions are averaged, the phase difference between the center of the window and the scatterer location impedes the convergence of the SAC function. This error makes a significant difference when only a few regular scatterers exist over the data segment window. When the regular scatterers are more dense within the processing window, the phase dif- ference between a regular scatterer and the center of the win- dow is small, and therefore does not significantly hinder the convergence.
The phase correction factor for each tapered data seg- ment aligns the regular scatterers with the center of the win- dow. The proper phase shift is determined by the distance of any regular scatterer location to the center of the window. With the phase correction factor included, Eq. (14) can be written as
3508 d. Acoust. Soc. Am., Vol. 96, No. 6, December 1994 T. Varghese and K. D. Donohue: Mean scatterer spacing estimates 3508

9.6
5.9
5.9
7
7.7 9.6
Fr equemcy (MHz)
8.3
d.5 L. .5 6.4
Frequency (MHz)
8.3
0.15
0.12 5
• 0.1 • 0.075
'J 0.05
0.025
0.5 1.5 2
Distance
0.14
0.12
0.1
• 0.08
•0.06 cJ
O. 04
O. 02
0.5 1 1.5 2
Distance
(a) (b)
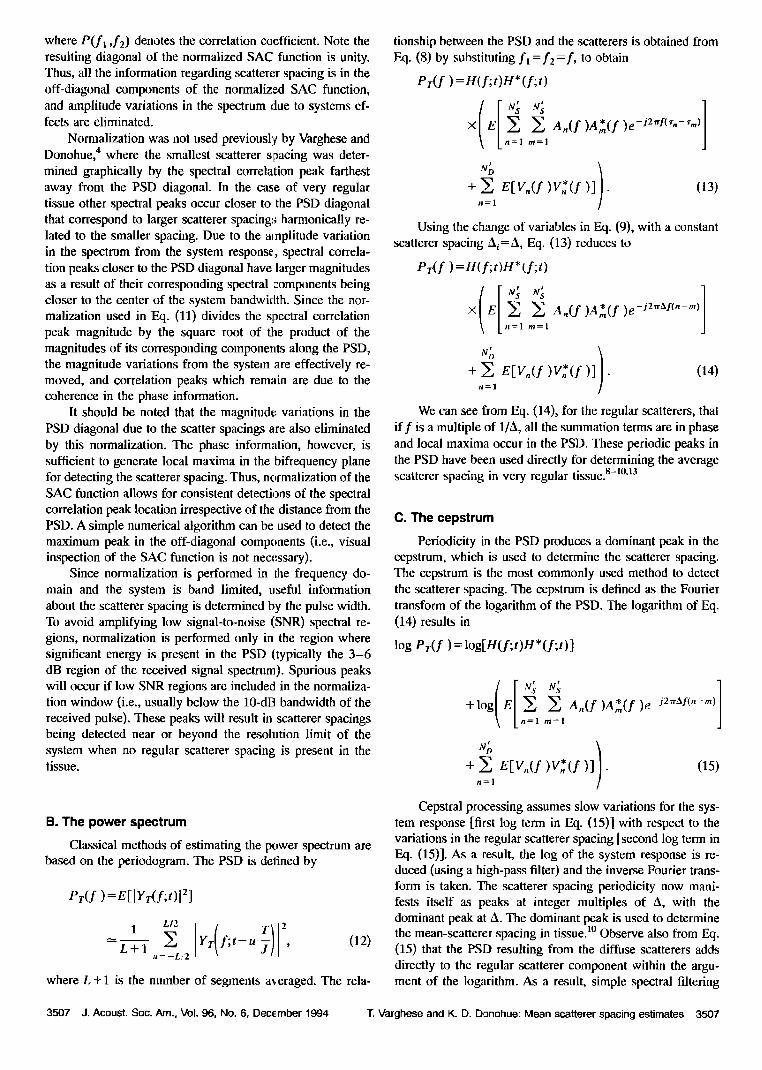
FIG. 1. Spectral autocorrelation function, and FFT cepstrum for scatterers with a 0.51 ram-mean-scatterer ,;pacing with tr=3.15%. (a) Only regular scatterers, (b) with a +3-dB-diffuse component relative to the regular scatterers.
pr( f;t_u •_) = yT( f;t_u •_)eJ2nœ(rt• ' T2), (17) where r•s represents the location of any regular scatterer, and PrO) is the phase corrected Fourier transform of the windowed A-scan segment (for practical application the maximum value within a data segment is assumed to be the location of a regular scatterer, which is used to obtain The linear phase correction hctor does not affect the location of the off-diagonal peaks, it merely aligns the window with the scatterer structure, and helps in the coherent phase addi- tion during the averaging of consecutive overlapped SAC functions. The phase corrected SAC function using Eqs. (17) and (10) can be written as
Sr(f•,f2;t)-L + 1 • Pr fl;t-u u=-L 2
(18)
Sample plots of the unnormalized SAC function and the cepstrum are presented in Fig. 1 for regular scatterers with cr=3.15% (standard deviation relative to the mean-scatterer spacing). Figure 1 (a) shows a contour plot of the SAC func- tion and the cepstrum for regular scatterers only, while Fig. l(b) shows the effect of +3 dB of the diffuse component in addition to the regular scatterers. The contour plots are thresholded to emphasize the local maxima. The light inten- sity regions are those that exceeded the threshold to indicate a local maxima. The 0.51-mm-regular scatterer spacing is easily identified in the cepstrum Fig. l(a) and (b). Note the presence of a periodicity at 1 mm, which is harmonically related to the 0.5-mm scatterer spacing. The diffuse compo- nent directly adds to the PSD, as was discussed in Eq. (15), and causes a broadening of the cepstral peaks, and an in- crease in the number of spurious peaks as seen in Fig. 1 (b). For the SAC function the mean-scatterer spacing is estimated from the location of the off-diagonal peak at (7.75, 6.24) MHz, which corresponds to Af=l.51 MHz. Substitute this value into Eq. (16) to obtain a scatterer spacing of 0.51 mm. The spectral correlation peak for the SAC function with the
3509 d. Acoust. Soc. Am., Vol. 96, No. 6, December 1994 T. Varghese and K. D. Donohue: Mean scatterer spacing estimates 3509

0.3
Number Or' Sepnents (a)
50-
0 5 10 15 20 25
0.9!
,,qo."i
•0.4- 0.3
0
Number Of Segments (b)
50-
5 tO 15 20 25 Nmnl•' O• Selmmts
ø.91 0.6
•0.5
0.3
(c)
o o 5 io 15 20 'e•' ' '
FIG. 2. Mean-scatterer spacing and the coefficient of variation for regular scatterers with spacing 0.51 mm. (a) Standard deviation 0.016 mm (3.15%), (b) standard deviation 0.051 ram (9.99%), (c) standard deviation 0.072 mm (14.14%).
diffuse component is at (4.9, 6.4) MHz, which corresponds to A f= 1.50 MHz, giving a scatterer spacing of 0.51 mm.
Monte Carlo simulations were used to compare the per- formance between the SAC and FFT cepstrum estimates of the mean-scatterer spacing. Convergence plots for the scat- terer spacing estimate used 25 independent simulated A-scans with the same tissue and signal parameters. The A-scans were generated with gamma distributed random
variables for the regular scatterer spacing. The diffuse scat- terers were uniformly distributed throughout the microstruc- ture with uniformly distributed scatterer strengths. The PSD and the SAC functions were computed using a hopping win- dow with 4-mm length, and a 50% (J--2) overlap of the tapered data segments along the A-scan. The spectrum at each window location was averaged with the previous spec- tra to obtain an estimate for the PSD and the SAC function.
3510 J. Acoust. Soc. Am., Vol. 96, No. 6, December 1994 T. Varghese and K. D. Donohue: Mean scatterer spacing estimates 3510

Both the computed mean scatterer spacing; (d) and the coef- ficient of variation (CV) of the spacing estimates are pre- sented in Figs. 2 and 3 for increasing standard deviations in the regular scatterer spacing distribution. The coefficient of variation was computed as the ratio of the standard deviation of the estimates to the mean estimate computed over the results from the 25 simulated A-scans.
Figure 2 presents the mean-scatterer spacing and the CV for only quasiperiodic scatterers (no diffuse scattering), as a function of the number of A-scan segments used. The plots show that the estimates obtained using ':he SAC function converges faster than the cepstral techniqt•e and has a lower CV. In Fig. 2(a) the SAC function meart-scatterer spacing estimate (with 0.=3.15%) converges within 6 averages (cor- responding to 14.4 mm or nearly four full data segments), while the cepstral technique converges in about 14 averages with a small bias (i.e., less than 10%). Th.: CV also reduces to 0.0% for the SAC function within 6 averages. A major source of deterioration in the performance of the cepstral technique with no noise, is due to the presence of the har- monic at i mm, whose peak dominates for some A scans.
With an increase in the standard deviation of the regular scatterer spacing, the results in Fig. 2(b) and (c) show a slower convergence to the m6an-scatterer spacing. In Fig. 2(b) the SAC function CV is within 5% after 14 averages, for d=0.50 mm with 0':=9.99%. In Fig. 2(c) the SAC function CV is within 10% with d=0.48 mm for cr=14.14%. In both
Fig. 2(b) and (c) the CV for the cepstral technique is at about 40%, with the mean-scatterer spacing ranging from 0.55 to 0.65 mm. Results in Fig. 2(b) and (c) indicate the SAC func- tion estimate is more accurate and reliable than the cepstrum.
Estimation of the scatterer spacing in the presence of strong diffuse scattering is presented in Fig. 3 with the ratio of the diffuse to regular scatterer strength :it +3 dB (i.e., +3 dB of the diffuse component is added to tlhe regular compo- nent of the A scan). Figure 3(a) to (c) show the effect of the change in the microstructure regularity ia the presence of diffuse scattering. The SAC function is able to resolve the regular scatterer spacing even in the presence of the diffuse component with no significant degradation in performance of the SAC function [compare Figs. 2(a) and 3(a)]. In the pres- ence of the diffuse component the SAC function estimate fluctuates about the true scatterer spacing,, by 0.03 mm for 0'=9.9%, and by 0.06 mm for 0'=14.14%, with the CV in- creasing to 6% and 10%, respectively [coatpare Fig. 2(b) and (c) to Fig. 3(b) and (c)].
Note the cepstral technique converges to a scatterer spacing value close to the cutoff frequency of the high-pass filter for regular scatterers with 0' between 9.9% to 14.14%. The cepstral estimates converges to this region because of the contribution of the spurious peaks at lower frequencies and the larger scatterer spacing variance, •vhich reduces the cepstral peak corresponding to the regular scatterer spacing [observe in Fig. l(b), the presence of strong spurious peaks near values below 0.51 mm]. In addition, the diffuse compo- nent adds directly to the PSD corresponding to the regular scatterer structures and causes a broadening of the cepstral peaks along with other effects due to the nonlinear operation (logarithm) on the sum of the two components. The CV in
this case reduces because the spurious peaks near the filter cutoff frequency are consistently detected. This is not an in- dication of good performance since the estimation is con- verging on the incorrect value. The diffuse component thus introduces spurious peaks in the cepstrum and reduces the contribution of the regular scatterers to the true cepstral peak. The cepstral technique in the presence of the diffuse compo- nent, converges to the true scatterer spacing only for regular scatterers with •r=3.15%.
Figure 4 illustrates the range and effectiveness of the SAC function in estimating the mean-regular scatterer spac- ing from 0.5 to 1.35 mm, with a standard deviation of 9.99%, and -3 dB of the diffuse component to regular component strength. The SAC function converges to the true value of the mean-scatterer spacings for all the spacings in Fig. 4, with the estimates converging slower as the correlation peaks form closer to the PSD. The slower convergence for larger scatterer spacings results from greater errors in the phase correction factors. Since noise is included in these scans, the maximum value in a given window will sometimes be a peak from the diffuse scatterers, and as mentioned previously, this error more significantly affects the cases when only a few scatterers are in the processing window. The CV for the SAC function estimates remains within 5%-10% for all the cases
shown, while the cepstral estimates have a CV>40%. These results along with the results in Fig. 3, show the dependence of the cepstral techniques on the high-pass filter cutoff fre- quency.
This section illustrates the estimation of the regular scat- terer spacing in the presence of the diffuse component and variation in the regularity of the scatterer distribution. The SAC function estimates perform better than the cepstral es- timates in the presence of the diffuse scattering component. The SAC function includes phase differences between the different spectral components, which in the presence of co- herent scatterers produces well-defined spectral correlation peaks. The spectral correlation peaks are relatively insensi- tive to the diffuse components since these scatterers have a random phase distribution and their contributions average out. Cepstral techniques, on the other hand, do not utilize phase information and operate on the PSD characterization of the signal, which is directly affected by the diffuse scat- tering component.
III. EXPERIMENTAL RESULTS
In this section data from in vivo scans of liver tissue are
used to illustrate the mean-scatterer spacing estimate using the SAC function and cepstral analysis. For real tissue the SAC function exhibits significant spectral correlation com- ponents due to 'the regularity in the tissue structure. B-scan images of the liver were obtained using the Ultramark 9 ul- trasound system (ATL, Bothell, WA). Liver scans were ob- tained using a transducer with a center frequency f•=3.5 MHz, 3-dB bandwidth f3 •=2.0 MHz, and a sampling fre- quency f• = 12 MHz. The received signals were low-pass fil- tered (with a cutoff frequency of 6 MHz) before being sampled to prevent aliasing.
The basic functional unit of the liver is the liver 1obule, which is a cylindrical structure several mm in length and
3511 J. Acoust. Soc. Am., Vol. 96, No. 6, Decomber 1994 T. Varghese and K. D. C, onohue: Mean scatterer spacing estimates 3511

0.91
0.3 0
(a)
5ø: l
0 õ 10 Ifi 20 25
0.9
0.3 .... 5 .... l• .... •, .... •5 .... z?," ' (b)
50-
50,
.• 20
..q -
10 • 0
(c)
FIG. 3. Mean-scatterer spacing and the coefficient of variation for regular scatterers with spacing 0.51 mm, and +3 dB of diffuse scattering present. (a) Standard deviation 0.016 mm (3.!5%), (b) standard deviation 0.051 mm (9.99%), (c) standard deviation 0.072 mm (14.14%).
0.8-2 mm in diameter. The human liver contains 50 000-
100 000 individual 1obules. The lobule is constructed around
a central vein, and is composed of hepatic plates that radiate centrifugally from the central vein-like spokes in a wheel. The hepatic plates are separated by hepatic sinusoids which link the central vein to the portal venules. Each individual lobule is separated by a septa which contains the terminal bile ducts, portal venules, and the hepatic arterioles. Each hepatic plate is usually two cells thick, with bile canaliculi
between adjacent cells, which link to the terminal bile ducts. 2ø
The SAC function and the cepstrum were obtained using the Welch-Bartlett technique with a 50% overlap of the win- dowed axial data segments of duration 10.67/as (128 sample points or an 8-mm-data segment)? A set of segments were taken from a section of the liver sector scan that corre-
sponded to a homogeneous appearance in the intensity im- age. The dimensions of the section were 16.47 mm in the
3512 J. Acoust. Soc. Am., Vol. 96, No. 6, December 1994 T. Varghese and K. D. Oonohue: Mean scatterer spacing estimates 3512

õ 10 15 20 25
(a)
•80 •-
O1 ................. •-.-' .•. -' --•. .... 0 $ 10 15 20 25
i0 15 20 25
Number Of (b)
•80
0 5 to 15 20 25
0 5 10 15 20 •$
Numl• 0• •egments (c)
o t0 15 20 25 Nu• O( S•ts
F[G. 4. Mean-scatterer spacing and the coefficient of variation for regular scatterers with standard deviation of 9.99% and -3 dB of the diffuse component. {a) Mean-scatterer spacing of 0.68 rnrn. (b) Mean-scatterer spacing of 1.02 min. (c) Mean-scatterer spacing of 1.35 min.
axial direction and 2.34 ø in the lateral direction (5 adjacent A-scans). This tissue section corresponds to an area of ap- proximately 1.64 cm axially and 0.6 cm laterally. The SAC function and cepstral estimates are presen•:ed in Fig. 5.
The normalized SAC function and the cepstrum are ob- tained by averaging 15 individual SAC functions and perio- digrams. The largest spectral correlation l:,eak at (3.18,2.43) MHz in Fig. 5(a), corresponds to a scatterer spacing of 1.02 min. Two other correlation peaks at (3.0,2.7) MHz and (3.56,2.9) MHz correspond to scatterer spacings of 2.56 and
1.16 mm, respectively. The 2.56-mm spacing is harmonically related to the 1.02-mm spacing (i.e., periodicity from scatter- ers clustered 2 at a time). Although a 2.04-ram spacing is expected in this case, there is increased error associated with this peak due to an increased (doubled) variance in the spac- ing and significance leakage from the PSD values. As a re- sult, the peak is not as sharp or as high as the one corre- sponding to the fundamental scatterer spacing. The correlation peak due to the dominant spacing is about 15.6% stronger than the peak due to the spacing of 2.56 mm, and
3513 J. Acoust. Sec. Am., Vol. 96, No. 6, December 1994 T. Varghese and K. D. Donehue: Mean scatterer spacing estimates 3513

'1
.0 2.9 3.8
Frequency (MHzl
(a)
0.07}' 0.06[
o.o{ 0.02[ 0'00[
0 1 2 • '' 4 Distance (mm)
technique is compared to the standard method of using the cepstrum to estimate the scatterer spacing. Significant perfor- mance improvements are obtained using the SAC function when compared to the cepstral technique in the presence of the diffuse scattering component. The cepstral technique also has the disadvantage of requiring a priori knowledge of the cutoff frequency to reduce the system effect from the tissue signature. The algorithm using the SAC function does not require a high-pass filter.
The mean-scanerer spacings detected by the SAC func- tion is limited by the bandwidth of the pulse and the prox- imity of the spectral correlation peaks to the PSD. The tech- nique using the SAC function cannot detect spectral peaks which are close (larger periodicities) to the main diagonal (PSD), since the spectral peak caused by the periodicity merges with the PSD due to the leakage from the finite win- dow. This problem can be mitigated in the case of the SAC function, by using larger gate lengths to detect larger period- icities. The SAC function is a robust technique that is rela- tively insensitive to presence of diffuse (unresolvable) scat- terers and the system effect. Ccpstral methods rely on the assumption that the system effect is a slowly varying com- ponent and can be reduced by high-pass filtering. However, for in vivo analysis a total separation of the system effect from the tissue signature will not be obtained because of overlying tissue and the weighting from the scatterer position within the beam profile.
ACKNOWLEDGMENTS
This material is based on work supported in part by the National Science Foundation, Grant MIP-8920602, the Na- tional Cancer Institute, and National Institutes of 1Iealth,
Grant CA52823, and by BRSGS07RR07114-23 awarded by the Biomedical Research Support Grant Program, Division of Research Resources, National Institute of Health. The au- thors would also like to thank the Division of Ultrasound at
the Thomas Jefferson University Hospital for collecting the data used in this paper.
co)
FIG. 5. (a) Spectral autocorrelation function and, (b) FFF cepstrum for liver tissue.
21.4% stronger than the peak due to the 1.16-mm spacing. The FFT cepstrum in Fig. 5(b) shows the dominant peak
due to a scatterer spacing of 1.21 mm, which is about 4.24% stronger than the next peak due to a 1.4-mm-scatterer spac- ing. Based on the convergence results of the previous sec- tion, the SAC function estimate is considered more reliable. While both estimates are close to one another, the cepstrum has more spurious peaks that compete with the dominate peak.
IV. CONCLUSION
This paper presented a quantitative method of estimating the mean-scatterer spacing using the SAC function. This
raM. E Insaria, R. F. Wagner, D. G. Brown, and T J. Hall, "Describing small-scale structure in random media using pulse-echo ultrasound," J. Acoust. Soc. Am. 87, 179-192 {1990).
2W. A. Gardner, "Exploitation of spectral redundancy in cyclostationary signals," IEEE Signal Proc. Meg. 8. 14-36 {1991}.
3K. D. Donohue and T. Varghesc, "Spectral cross-correlation for Itssue characterization," IEEE Ultrason. Symp. 2, 1049-1052 (1992}.
aT. Varghese and K. D. Donohue, "Characterizelion of lissue microstruc- ture scatterer distribution with spectral correlation," Ultrasound Imag. 15, 238-254 (1993).
ST. Varghcse, "Detection of tissue microstructure anomalies with the spec- Iral cross-correlation function: A simulation study," M.S. Ihcsi% Univer- sity of Kentucky, Lexington, KY, 19921.
aK. D. Donohue, J. M. Brcsslcr, T. Varghese, and N.M. Bilgutay, "Spectral correlation in ultrasonic pulse-echo signal processing," IEEE Trans. Ul- trason. Ferroel. Freq. Cont. UFFC-40, 330 337 {1993).
?K. D. Donohue, "Maximum-likelihood estimation of A-scan amplitudes for coherent targets in media of unresolvablc scatterers," IEEE Trans. Ultrason. Ferroel. Freq. Cont. UFI•C-39, 422-430 (19{,12).
8 L. L. Foilingham and P. G. Soremet, "UIIrasonic characlerization of tissue structure in the in vivo human liver and spleen," IEEE Trans. Sonics Ultrason. SU-31,418-428 (1984).
3514 J. Acoust. Soc. Am., Vol. 96, No. 6, December 1994 T. Varghese and K. D. Donohue: Mean scatterer spacing estimates 3514

9R. Kuc, K. Haghkerder, and M. O'Donnel, "Presence of cepstral peaks in random reflected ultrasound signal," Ultrason. Ima3. 8, 196-212 (1986).
•øK. A. Wear, R. E Wagner, M. E Insaria, and T. J. Hall, "Application of auto-regressive spectral analysis to cepstral estimalion of mean scatterer spacing," IEEE Trans. Ultrason. Ferroel. Freq. Cont. UFFC-40, 50-59 (1993).
•R. F. Wagner, M. E Insana, and D. G. Brown, "Unified approach to the detection and classification of speckle texture in diagnostic ultrasound," Opt. Eng. 25 738-742 (1986).
•2M. F. Insana, R. E Wagner, B. S. Garra, D. G. Brown, and T. H. Shawker, "Analysis of ultrasound image texture via generalized Rician statistics," Opt. Eng. 2S, 743-748 (1986).
13 L. Landini and L. Verrazzani, "Spectral characteri::ation of tissue micro- structure by ultrasound: A stochastic approach," ]EEE Trans. Ultrason. Ferroel. Freq. Cont. UFFC-37, 448-456 (1990).
•4j. G. Proakis, and D. G. Manolakis, Digital signal processing, Principles Algorithms and Applications, 2rid ed. (Macmillan, New York, 1992).
•SL. R. Romijn, J. M. Thijssen, and G. W. J. Van Beuningen, "Estimation of scatterer size from back-scattered ultrasound: A si•nulation study," IEEE
Trans. Ultrason. Ferroel. Freq. Cont. UFFC-36, 593-605 (1989). 16j. C. Barnbet, "Theoretical modeling of the acoustic scattering structure of
human liver," Acoust. Lett. 3, 114-119 (1979). 17D. Nicholas, "Ewtluation of back-scattering coefficients for excised hu-
man tissue: results, interpretation and associated measurements," Ultra- sound Med. Bio. 8, 17-28 (1982).
•sp. D. Welch, "The use of fast Fourier transforms for the estimation of power spectra: A method based on time averaging over short modified periodigrams," IEEE 'Frans. Audio Electroacoust. AU-15, 70-73 (1967).
•9A. Papoulis, Probability Random, Variables, and Stochastic Processes, 2nd ed. (McGraw-Hill, New York, 1984).
2øA. C. Guyton, Tex•I book of Medical Physiology, 4th ed. (W. B. Saunders, Philadelphia, 1971).
2•W. A. Gardner, Statistical Spectral Analysis (Prentice-Hall, Englewood Cliffs, NJ, 1988).
22 K. D. Donohue, T. Varghese, and N.M. Bilgutay, "Spectral redundancy in characterizing scatterer structures from ultrasonic echoes," Review of Prog. Quant. Nondest. Eval., edited by D. O. Thompson and D. E. Chi- menti (Plenum, New York, 1994), p. 13.
3515 J. Acoust. Soc. Am., Vol. 96, No. 6, Dec{;mber 1994 T. ¾arghese and K. D. Donohue: Mean scatterer spacing estimates 3515