measueme uceaiies ecouee uig 9-g-1 gas uie...
TRANSCRIPT

THE AMERICAN SOCIETy,OF MECHANICAL ENGINEERS345 E. 47th St, New York, N.Y. 10017
The Society shall not be Ie for statements or opinions advanced in papers or discussion at meetings of the Society or of its Divisions orSections, or printed in its publications. Discussion is printed only if the paper is published in an ASME Journal. Authorization to photocopyfor internal or personal use is granter libraries and ter users registeredwith the Copy ht Clearance Center (CCC) provideda/article or S4/page is paid to CCC„ 222 Rosewood Dr., Danvers, MA 01923. Requests for special permission or bulk reproductionshould be addressed to the ASME Technical Publishing Department
Copyright 0 1903 by ASME
MEASUREMENT UNCERTAINTIES ENCOUNTERED DURING 98-GT-1GAS TURBINE DRIVEN COMPRESSOR FIELD TESTING
Klaus BrunPrincipal Project Applications Engineer
Rainer KurzManager, Systems Analysis and Field Testing
Solar Turbines IncorporatedSan Diego, California
ABSTRACTField testing of gas turbine compressor packages requires the accurate
determination of efficiency, capacity, head, power and fuel flow insometimes less than ideal working environments. Nonetheless, field testresults have significant implication for the compressor and gas turbinemanufacturers and their customers. Economic considerations demandthat the performance and efficiency of an installation are verified toassure a project's return on investment. Thus, for the compressor and gasturbine manufacturers, as well as for the end-user, an accuratedetermination of the field performance is of vital interest. This paperdescribes an analytic method to predict the measurement uncertainty and,thus, the accuracy, of field test results for gas turbine drivencompressors. Namely, a method is presented which can be employed toverify the validity of field test performance results.
The equations governing the compressor and gas turbine performanceuncertainties are rigorously derived and results are numerically comparedto actual field test data. Typical field test measurement uncertainties arepresented for different sets of instrumentation. Test parameters thatcorrelate to the most significant influence on the performanceuncertainties are identified and suggestions are provided on how tominimize their measurement errors. The effect of different equations ofstate on the calculated performance is also discussed.
Results show that compressor efficiency uncertainties can beunacceptably high when some basic rules for accurate testing areviolated. However, by following some simple measurement rules andmaintaining commonality of the gas equations of state, the overallcompressor package performance measurement uncertainty can belimited and meaningful results can be achieved.
NOMENCLATURECP Specific heat at constant pressure
Ratio of specific heatsh
Enthalpyk
Isentropic ExponentMa Mach Number
MW
Molecular Weightp Pressure
P
PowerQ
Volumetric Flowq Fuel Heating Value
R
Gas constantp Density
T
TemperatureW
Mass Flowz
Compressibility Factor11 Efficiency
H
HeadEOS Equation of StateBWRS Benedict-Webb-Rubin-StarlingLKP
Lee-Kesler-PloeckerPR
Peng-RobinsonRK Redlich-KwongSRK
Soave-Redlich-Kwong
Subscripts amb Ambientd Dischargef FuelM Mechanicalp packages SuctionTH thermal
Superscripts isentropic
INTRODUCTIONGas turbine compressors are frequently tested after their installation
in the field to verify the manufacturer's performance predictions. Failureto meet this performance may mean stiff financial penalties to the
Presented at the International Gas Turbine & Aeroengine Congress & ExhibitionStockholm, Sweden — June 2—June 5, 1998
This paper has been accepted for publication in the Transactions of the ASMEDiscussion of it will be accepted at ASME Headquarters until September 30, 1998
Downloaded From: http://proceedings.asmedigitalcollection.asme.org/ on 08/27/2018 Terms of Use: http://www.asme.org/about-asme/terms-of-use

DISCHARGE
TEMP
DISCHARGE
PRESSURE
manufacturer as well as significant discontent on the end-user side.However, due to the non-ideal measurement conditions typicallyencountered during the field testing, uncertainties may be so significantthat a simple single performance guarantee point cannot be defined. It istherefore imperative to define an allowable measurement uncertaintyrange, acceptable to both manufacturer and end-user, prior to the fieldtest. To maintain impartiality, this uncertainty band should not be basedon empirical "experience" values, but rather on uncertainty equationsderived from the singular mathematical expressions for the gas turbinecompressor performance and from the basic instrument and sensor deviceinaccuracies.
Limited information is available in the public domain describingactual gas turbine field test measurement uncertainties. The primarysource of information employed by manufacturers and end-users are testcodes such as provided by the American Society of MechanicalEngineers (ASME), the International Organization for Standardization(ISO) and the Verein Deutscher Ingenieure (VDI). These specificationscover thermodynamic calculation methods, instruments, site preparationand the reporting of turbomachinery test results in various degrees ofdetail. ASME Power Test Codes (PTC) 10 (ASME, 1979), 19.1 (ASME,1985) and 22 (ASME, 1985), ISO 2314 (ISO, 1989), VDI 2045 (VDI,1993) and 2048 (VDI, 1978) are typical examples of these standards.
A number of researchers from both academia and industry have to avery limited degree discussed field testing errors and uncertainties. Forexample, Fozi (1995) discussed practical challenges of field performancetests. Steady state measurement conditions were shown to be critical forobtaining accurate field test results. Schmitt and Thomas (1995)compared achievable field to factory test accuracies. Results showed thatif field tests were properly conducted, comparable accuracies betweenfield and factory tests were achievable. Meier and Rhea (1982)performed compressor tests and discussed proper test practices andprocedures. Instrumentation requirements for achievement of reasonableaccuracy in field testing are defined and discussed. McRoberts (1984)reported on compressor performance tests which were conducted in thechallenging environment of an offshore platform. Finally, Klein andDraughton (1991) undertook field performance tests of a gas reinjectioncompressor-turbine train. PTC 10 class I and PTC 10 class III factory testresults were compared to field performance tests.
Thus, this paper aims to provide information for the public domainon gas turbine driven compressor field testing uncertainties. A simpleanalytic method to determine compressor and gas turbine measurementuncertainties is described. For this method a set of uncertainty equationsis rigorously derived from the physical turbomachinery performancerelations. Typical field test measurement experience errors are presentedfor different sets of instrumentation/sensors. By introducing theseexperience errors into the uncertainty equations, the total efficiency,power, and head uncertainty for a gas turbine compressor can bepredicted prior to the field test for a given operating condition. Twoactual field test examples are employed to demonstrate the viability ofthis method. Also, a number of parametric studies describing uncertaintytrends are included. Parameters are identified that most significantlyaffect the total package uncertainty. This helps the user to optimize hisfield test instrumentation selection. Finally, the effect of differentequations of state on the calculated performance is discussed.
METHODOLOGYFor the uncertainty analysis it is assumed that all measurement
parameters can be considered to be independent and that parameters haveassociated statistical bounds (such as a 95% confidence interval Au)rather than absolute limits of errors. All parameters are also assumed tohave Gaussian normal distributions around their respective mean valuessuch that the uncertainties can be properly combined using the root-square sum method (Doeblin, 1966). However, an uncertainty correctionis added for parameters which have sample sizes smaller than 30; i.e., theuncertainty is widened for individual parameters to account for aStudent-t type distribution (Brun, 1996). The total uncertainty, AF, fora given function, F = f(u,,u 2,..un) is, thus, determined from (Scarborough,1955):
( Au
of of+ Au — +...(Au ofiau, 2 a
2 (1)) U2 n aU
For this method the overall uncertainty AF has the same statisticalmeaning as the individual uncertainties Au. Namely, if Au represents a95% confidence than the result for the total uncertainty AF is also a 95%confidence interval. Note, that since it is not possible to distinguishbetween bias errors and data scatter in a field test environment, they willnot be treated independently.
Compressor Performance Equations The parameters that are measured during a centrifugal compressor
field test are (I) the compressor inlet and outlet stagnation temperature,Ts and Td, (ii) the inlet and outlet static pressure, p s and pd, and (iii) theactual inlet volume flow rate, Q (Fig. 1). Furthermore, knowledge of the
COMPRESSOR
INLET
PRESSURE
ORIFICE OR EQUIVALENT
OF =
Figure 1: Test Instrumentation for a Gas Compressor
2
Downloaded From: http://proceedings.asmedigitalcollection.asme.org/ on 08/27/2018 Terms of Use: http://www.asme.org/about-asme/terms-of-use
h* = c (T) Td c (T) Tp d d p s s
Isentropic Efficiency:
(
2R Universal) R Universal.Z 2
+ Amw . R IJniversal.Z 2 (10)
L•MW LLMW L.MW 2 )
(7 )
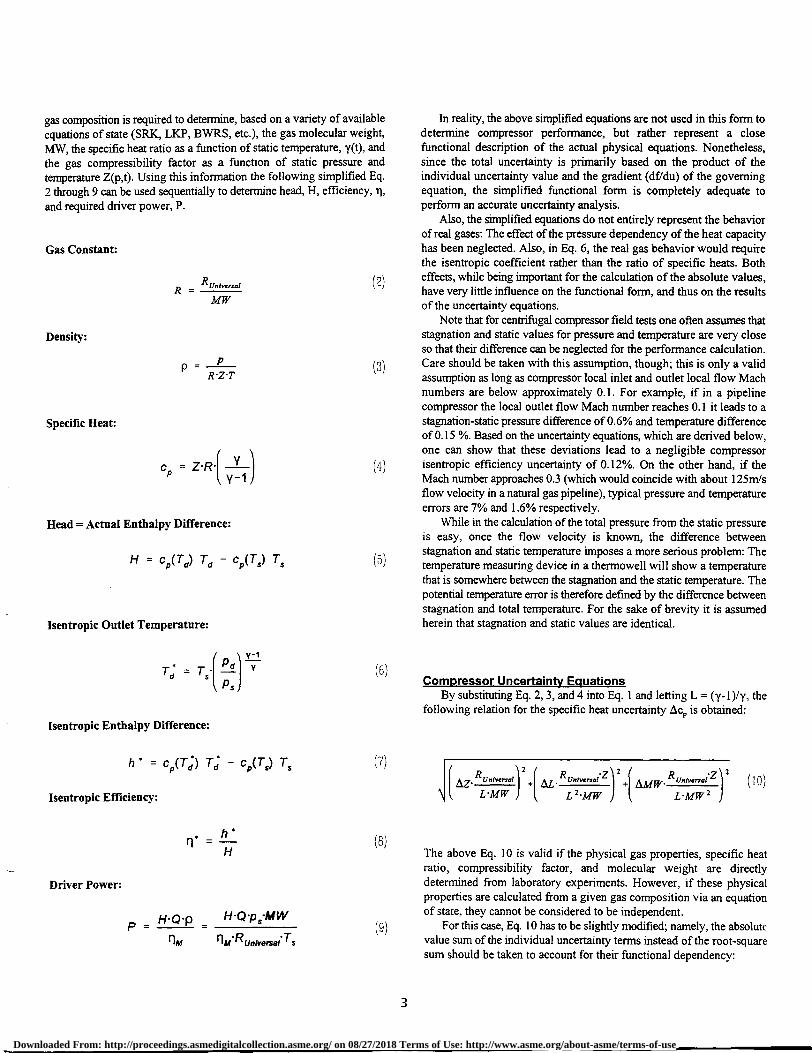
gas composition is required to determine, based on a variety of availableequations of state (SRK, LKP, BWRS, etc.), the gas molecular weight,MW, the specific heat ratio as a function of static temperature, y(t), andthe gas compressibility factor as a function of static pressure andtemperature Z(p,t). Using this information the following simplified Eq.2 through 9 can be used sequentially to determine head, H, efficiency, 1,and required driver power, P.
Gas Constant:
R - R Universal
MW
Density:
pR•Z•T
Specific Heat:
C = Z'R*( 2—)y-1
Head = Actual Enthalpy Difference:
H = Cp (Td Td c(Ts) Ts
Isentropic Outlet Temperature:
SI PS )
Ps )
Isentropic Enthalpy Difference:
In reality, the above simplified equations are not used in this form todetermine compressor performance, but rather represent a closefunctional description of the actual physical equations. Nonetheless,since the total uncertainty is primarily based on the product of theindividual uncertainty value and the gradient (df/du) of the governingequation, the simplified functional form is completely adequate toperform an accurate uncertainty analysis.
Also, the simplified equations do not entirely represent the behaviorof real gases: The effect of the pressure dependency of the heat capacityhas been neglected. Also, in Eq. 6, the real gas behavior would requirethe isentropic coefficient rather than the ratio of specific heats. Botheffects, while being important for the calculation of the absolute values,have very little influence on the functional form, and thus on the resultsof the uncertainty equations.
Note that for centrifugal compressor field tests one often assumes thatstagnation and static values for pressure and temperature are very closeso that their difference can be neglected for the performance calculation.Care should be taken with this assumption, though; this is only a validassumption as long as compressor local inlet and outlet local flow Machnumbers are below approximately 0.1. For example, if in a pipelinecompressor the local outlet flow Mach number reaches 0.1 it leads to astagnation-static pressure difference of 0.6% and temperature differenceof 0.15 %. Based on the uncertainty equations, which are derived below,one can show that these deviations lead to a negligible compressorisentropic efficiency uncertainty of 0.12%. On the other hand, if theMach number approaches 0.3 (which would coincide with about 125m/sflow velocity in a natural gas pipeline), typical pressure and temperatureerrors are 7% and 1.6% respectively.
While in the calculation of the total pressure from the static pressureis easy, once the flow velocity is known, the difference betweenstagnation and static temperature imposes a more serious problem: Thetemperature measuring device in a thermowell will show a temperaturethat is somewhere between the stagnation and the static temperature. Thepotential temperature error is therefore defined by the difference betweenstagnation and total temperature. For the sake of brevity it is assumedherein that stagnation and static values are identical.
Compressor Uncertainty Eauations By substituting Eq. 2, 3, and 4 into Eq. 1 and letting L = (y-1)/y, the
following relation for the specific heat uncertainty Ac p is obtained:
(2)
(3)
(4)
(5)
(6)
Driver Power:
h •
n+= H
P = H. Q - H.Q.Ps-MWnm riAl-R Universal. T s
(8)
(9)
The above Eq. 10 is valid if the physical gas properties, specific heatratio, compressibility factor, and molecular weight are directlydetermined from laboratory experiments. However, if these physicalproperties are calculated from a given gas composition via an equationof state, they cannot be considered to be independent.
For this case, Eq. 10 has to be slightly modified; namely, the absolutcvalue sum of the individual uncertainty terms instead of the root-squaresum should be taken to account for their functional dependency:
3
Downloaded From: http://proceedings.asmedigitalcollection.asme.org/ on 08/27/2018 Terms of Use: http://www.asme.org/about-asme/terms-of-use

AF= A ofau,
+ Au af + ...2 au,
This leads to a more conservative estimate of the uncertainty (Doeblin,1966). Furthermore, a physical property uncertainty, due to the effect ofapplying uncertainties in T and p to the non-ideal gas state equation hasto be included; i.e., since there is a measurement error in T and p, therewill be an added error in determining c p from the gas equation. Thisuncertainty is most conveniently obtained numerically by varyingtemperatures and pressures parametrically in the gas equation and, thus,determining the gradients dy/dT, dy/dp, dZ/dT, and dZ/dp indirectly.Recognizing that dy/dT = dL/dT and dy/dp = dL/dp, one can easilydetermine corrections for AZ and AL:
OL = 1I1 ^T aT (p
ap (12a)
. az)AZ = (
AT aTaz)2 `
pp ) 2 (12b)
The uncertainty in cp is also affected by the variation of the gasproperties during the duration of the test. This effect is againmathematically difficult to describe but can be easily handlednumerically using a procedure similar to the one shown above for thevariations in T and p. It is beyond the scope of this paper to list allpossible gas composition variations; however, it is important to realizethat they can strongly affect Z, L and MW. For example, if a simple gasmixture of 90% Methane and 10% Ethane has a constituency uncertaintyof 1%, then the resulting uncertainties in AMW, AZ, and AL are 0.9%,0.05%, and 0.07%, respectively.
The authors would also like to point out that the consistentapplication of the gas state equations is imperative. For identical gascompositions one finds significant physical property output differencesbetween the commonly employed gas equations of state (SRK, BWRS,and LKP). Beinecke and Luedtke (1983) noted typical differences in Zvalues of 0.5% to 1.5% when comparing the output from SRK, BWRS,and LKP for a standard pipeline application. Thus, if one compressormanufacturer employs the SRK equation and another the BWRS gasequation, predictions for identical compressors may vary significantly.Also, if the compressor measurements are being employed to verify thedriver (gas turbine) output performance, deviations of the gas equationoutput from actual physical values will lead to incorrect results for therequired power.
By substituting Eq. 10 into Eq. 5, the uncertainty of the compressorhead is determined. However, since the head uncertainty is not dependenton the absolute temperatures, but rather on the temperature difference(Td-TS), and since the specific heats (cp) for the discharge and suction arefunctionally related, the temperature difference (T d-T) should beemployed for the derivation rather than the absolute temperature values(Td,Ts).
OH = iOcp•(Td — Ts))2 + (V'd.cp Tj + (6■Ts •cp T.)
(13)
Uncertainties in the temperature T originate from the five followingmajor sources of error: (i) location: incorrect position of the thermalsensor in the gas stream, (ii) installation: wall conduction heat transfer toand from the sensor due to inadequate insulation, (iii) calibration:instrument drift, non-linearities, cold junction, and reference temperatureerrors, (iv) device: inherent accuracy limitations of the sensor device, (v)acquisition: amplifier, transmission, noise, read, and analog-digitalconversion errors.
The first three of these errors can be minimized easily in productionor laboratory test facilities. However, for field testing this is moredifficult; namely, time and cost constraints can force the test engineer toaccept field test arrangements with improperly located, installed, andcalibrated instruments. For example, a minimum of fourcircumferentially spaced pressure taps should be employed to accuratelymeasure gas pressures behind a pipe elbow. Due to the above mentionedconstrains, typically only one tap is employed in field testing. While itis often impossible to correct these problems during the short field testduration, it is still imperative to recognize them and to advise thecustomer of consequential measurement accuracy limitations. The ASMEPTC 10 (ASME, 1979) code specifies proper installation and location ofthe temperature sensors and, thus, should be used as a guideline andreference when defining field test procedures. Table 1 shows sometypical values for the above five main sources of temperaturemeasurement errors encountered during field tests. All units are indegrees Celsius.
To obtain the total temperature uncertainty, AT, the individualuncertainties have to be added using the root-square sum method. TableI shows that the location, installation, and calibration errors are thedominant factors while the device and acquisition errors are a smallercontribution to the total temperature error. Also note that field test deviceand acquisition errors are significantly larger than values quoted byinstrument manufacturers (>0.005% full scale). Again, the circumstancesand limitations encountered in field test may not always allow for idealhandling of the sensitive measurement instruments.
When substituting Eq. 6 into Eq. 1, the uncertainty for the isentropic(ideal) compressor outlet temperature is obtained.
Isentropic Temperature:
2L -I I 2 { LT. pa (14) LT L)2
+ Lpa
+ Ap s • L.,
Ps Ps
Uncertainties in pressure can also be categorized into the following fivemajor groups of errors: (i) location: incorrect position or alignment of thepressure probe in the gas stream, (ii) installation: piping vibrationtransmission to the pressure pick-up due to inadequate damping, (iii)calibration: instrument drift, non-linearities, hysteresis, and referencepressure errors, (iv) device: inherent accuracy limitations of the sensordevice, (v) acquisition: amplifier, transmission, noise, and analog-digitalconversion errors. Again, error sources (i), (ii), and (iii) are significantlylarger in field testing than in production or laboratory tests. Although theASME PTC 10 code (ASME, 1979) provides clear guidelines for correctinstallation and location of pressure probes one often finds these to be themain sources of pressure measurement errors. Table 2 shows sometypical values for the five sources of pressure measurement errorsencountered during field tests. All values are percent full scale.
aAuf
n au.
( Pd)ATd = AT, —
Ps
4
Downloaded From: http://proceedings.asmedigitalcollection.asme.org/ on 08/27/2018 Terms of Use: http://www.asme.org/about-asme/terms-of-use

Table 2: Typical Magnitudes of PressureMeasurement Errors [% Full Scaler
SensorLoca-non'
Instal-lation
Calibra-tion Device'
Acqui-sition
Simple Static 2.0 0.05 0.3 0.1 0.012 Static 1.0 0.05 0.3 -- --4 Static 0.5 0.05 0.3 -- --Pitot 1.0 0.1 0.3 0.1 0.01Kiel 0.2 0.1 0.3 0.1 0.01
Table 1. Typical Magnitudes of TemperatureMeasurement Errors [o CV, 2
SensorLoca-tion
Instal-lation
Calibra-tion Device
Acqui-sition
Hg Thermometer 0.1 0.1 0.0 0.03 0.1Thermistor 0.1 0.1 0.2 0.02 0.05Thermocouple 0.1 0.1 0.2 0.01 0.05RTD 0.1 0.1 0.2 0.01 0.05Infrared Sensor 0.3 0.0 0.3 0.05 0.05
Mass Flow:The uncertainty of the compressor efficiency, An*, is determined bysubstituting Eq. 7 and 8 into equation (I). Similar to Eq. 13, thetemperature difference should be used rather than the absolutetemperature values for the derivation of the isentropic enthalpy Eq. 15.
Isentropic Enthalpy:
(15)Ah* = 11(Ac p.(T; - T3))2 + (AT j.c 7.;)7 + (AT s •cp Ty
Isentropic Efficiency:
2( Ah *)
H2)
(16)
Aust (1988) achieved under laboratory conditions ± 0.2°K with shielded NiCrNi-thermocouple probes. He mentioned deviations which depended on the flowvelocity. Since the flow velocities in the nozzle of gas compressors are clearlysubsonic, inaccuracies due to recovery factors should be negligible. The highaccuracy will not easily be achieved in the field, since Aust used compensationelements kept in an oil bath of 0.0± 0.1° C. This procedure is not practical in thefield. In any case, he found the calibration curves given in DIN43710 to describethe behavior of the thermocouples precisely. In the field, a total inaccuracy oft0.5°K seems achievable. Cleveland (1982) shows instrument accuracies forthermometers to be 0.25-1.0 °K, thermocouples 0.25-1.0°K and RTDs 0.0025-2.5°K. Schmitt and Thomas (1995) report 0.5°K for RTDs. VDI 2045 (1993)assumes a tolerance of ±1.0°K for thermocouples and RTDs.
2
Note, that the location error is based on the use of two probes. Lower errors canbe achieved by using four probes, circumferentially distributed. Higher locationerrors occur if measurements are taken close to elbows and other flowobstructions. Also, on the discharge side of compressors, especially ofcompressors with volutes, the flow field can have significant temperaturegradients. In all these cases, four probes are necessary to maintain the locationerror margins of Table 1. As a rule of thumb, the location error decreases by amultiplier of about 1/M with M being the number of probes evenly distributedin the measurement plane.
"Ps + ( AMW' P32 2 +
2AfFVQ,
R UniversatZT sl R UniversatZT s
p r -MFV*Ags. p ;MW )22 2 p ;MW-Q
+ AZ• + AT • (17)RUniversalZ 27; ( R UniversatZTs2R UnIversaIZT,
Finally, the driver power uncertainty, AP, is obtained by combiningEq. 9 and 1 to get the following:
3
Aust (1988) achieved 0.1% of max. value for a calibrated system for wall staticpressures, not including location. The location should not cause an error largerthan 1% of dynamic pressure. Boelcs and Suter (1986) show the dependency ofthe wall static error on wall shear stress. Wall taps need to be exactlyperpendicular and flush to the surface - no burrs or slag are acceptable. On acompressor where the pressure taps were blown into the pipe with a cutting torchthe resulting spread of the 4 pressure transducers was seen to be almost 2.0% ofthe static pressure. Preferably, the wall tap should be followed by a largerdiameter hole (Bodes and Suter, 1986). The ratio of dynamic to static pressurefor most applications will be below 1%, since the pipe diameters (and thecompressor nozzle diameters) are selected to avoid high flow velocities. Also, thedistortion that is seen by the impeller will be reduced due to fact that the flownormally gets accelerated considerably between the nozzle and the impeller eye.
VDI 2045 (VDI, 1993) assumes 0.2% of full scale for transducers andgauges. One should emphasize, that the instruments is selected such that mostmeasured values are in the upper 25% of full scale. Liquid columns can be moreprecise, but the precision depends largely on the accuracy of reading the scales.
4
This error will depend largely on the uniformity of the flow at the measuringlocation.
sAlso reported by Schmitt and Thomas (1995) and by various transmitter/instrumentation manufacturers.
Apv 2 A_
5
Downloaded From: http://proceedings.asmedigitalcollection.asme.org/ on 08/27/2018 Terms of Use: http://www.asme.org/about-asme/terms-of-use
Power:
AP2 2 2
( A w. H j (Arim.H117)
( "mJJ
(18)
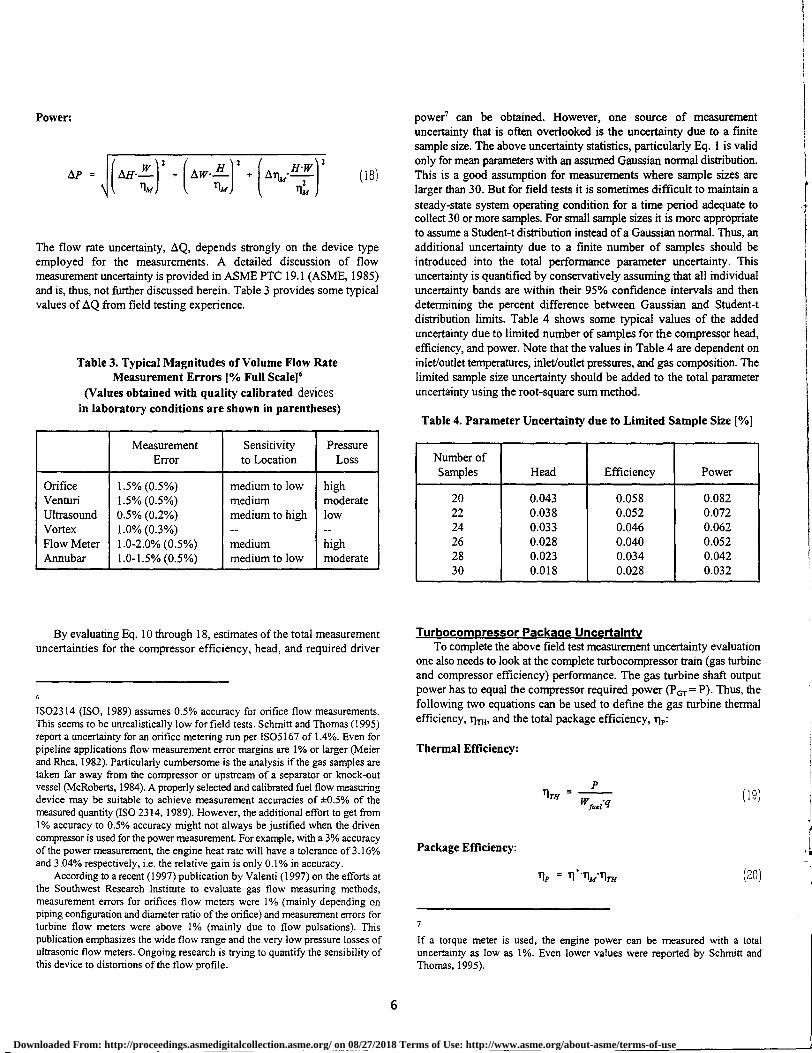
The flow rate uncertainty, AQ, depends strongly on the device typeemployed for the measurements. A detailed discussion of flowmeasurement uncertainty is provided in ASME PTC 19.1 (ASME, 1985)and is, thus, not further discussed herein. Table 3 provides some typicalvalues of AQ from field testing experience.
Table 3. Typical Magnitudes of Volume Flow RateMeasurement Errors [% Full Scaler
(Values obtained with quality calibrated devicesin laboratory conditions are shown in parentheses)
MeasurementError
Sensitivityto Location
PressureLoss
Orifice 1.5% (0.5%) medium to low highVenturi 1.5% (0.5%) medium moderateUltrasound 0.5% (0.2%) medium to high lowVortex 1.0% (0.3%) -- --Flow Meter 1.0-2.0% (0.5%) medium highAnnubar 1.0-1.5% (0.5%) medium to low moderate
power' can be obtained. However, one source of measurementuncertainty that is often overlooked is the uncertainty due to a finitesample size. The above uncertainty statistics, particularly Eq. 1 is validonly for mean parameters with an assumed Gaussian normal distribution.This is a good assumption for measurements where sample sizes arelarger than 30. But for field tests it is sometimes difficult to maintain asteady-state system operating condition for a time period adequate tocollect 30 or more samples. For small sample sizes it is more appropriateto assume a Student-t distribution instead of a Gaussian normal. Thus, anadditional uncertainty due to a finite number of samples should beintroduced into the total performance parameter uncertainty. Thisuncertainty is quantified by conservatively assuming that all individualuncertainty bands are within their 95% confidence intervals and thendetermining the percent difference between Gaussian and Student-tdistribution limits. Table 4 shows some typical values of the addeduncertainty due to limited number of samples for the compressor head,efficiency, and power. Note that the values in Table 4 are dependent oninlet/outlet temperatures, inlet/outlet pressures, and gas composition. Thelimited sample size uncertainty should be added to the total parameteruncertainty using the root-square sum method.
Table 4. Parameter Uncertainty due to Limited Sample Size [%1
Number ofSamples Head Efficiency Power
20 0.043 0.058 0.08222 0.038 0.052 0.07224 0.033 0.046 0.06226 0.028 0.040 0.05228 0.023 0.034 0.04230 0.018 0.028 0.032
By evaluating Eq. 10 through 18, estimates of the total measurementuncertainties for the compressor efficiency, head, and required driver
IS02314 (ISO, 1989) assumes 0.5% accuracy for orifice flow measurements.This seems to be unrealistically low for field tests. Schmitt and Thomas (1995)report a uncertainty for an orifice metering run per IS05167 of 1.4%. Even forpipeline applications flow measurement error margins are 1% or larger (Meierand Rhea, 1982). Particularly cumbersome is the analysis if the gas samples aretaken far away from the compressor or upstream of a separator or knock-outvessel (McRoberts, 1984). A properly selected and calibrated fuel flow measuringdevice may be suitable to achieve measurement accuracies of t0.5% of themeasured quantity (ISO 2314, 1989). However, the additional effort to get from1% accuracy to 0.5% accuracy might not always be justified when the drivencompressor is used for the power measurement. For example, with a 3% accuracyof the power measurement, the engine heat rate will have a tolerance of 3.16%and 3.04% respectively, i.e. the relative gain is only 0.1% in accuracy.
According to a recent (1997) publication by Valenti (1997) on the efforts atthe Southwest Research Institute to evaluate gas flow measuring methods,measurement errors for orifices flow meters were 1% (mainly depending onpiping configuration and diameter ratio of the orifice) and measurement errors forturbine flow meters were above 1% (mainly due to flow pulsations). Thispublication emphasizes the wide flow range and the very low pressure losses ofultrasonic flow meters. Ongoing research is trying to quantify the sensibility ofthis device to distortions of the flow profile.
Turbocompressor Package UncertaintyTo complete the above field test measurement uncertainty evaluation
one also needs to look at the complete turbocompressor train (gas turbineand compressor efficiency) performance. The gas turbine shaft outputpower has to equal the compressor required power (POT = P). Thus, thefollowing two equations can be used to define the gas turbine thermalefficiency, rim, and the total package efficiency, tip :
Thermal Efficiency:
Package Efficiency:
"flp = 11 .11mIlni (20)
7
If a torque meter is used, the engine power can be measured with a totaluncertainty as low as 1%. Even lower values were reported by Schmitt andThomas, 1995).
TITHP
(19)Wfuel -q
6
Downloaded From: http://proceedings.asmedigitalcollection.asme.org/ on 08/27/2018 Terms of Use: http://www.asme.org/about-asme/terms-of-use

Wfr.fl 2
(
) 2
+ A WI Alm AP\ wfraq
P ) 2 + (114 P ) 2 (21)fuel 2Wfue
Here Wes, is the fuel flow into the engine and q is the fuel heating value. suction and discharge; orifice flow meter for compressor flow andThe fuel flow is typically measured using an orifice plate in a metering turbine flow meter for engine fuel flowrun and the heating value is determined from the chemical compositionof the fuel (often the centrifugal compressor discharge gas is used as the • Test Conditions: p, = 65 bar, p d = 226 bar, T 5 = 303° K, T d =fuel gas). Based on the above equations the corresponding gas turbine
448.5° K (1 * = 62.0%), Q = 18.4 m3/min
uncertainty, Ath,„ and package uncertainty, Mb, are given by:
Thermal Efficiency:• Gas Composition: fluctuating by 5% in constituency composition;
during test 93.1% Methane, 5.8% Ethane, 0.4% Propane, 0.15%I-Butane, 0.25% n-Butane, 0.3% Nitrogen
Package Efficiency:
The compressor field test uncertainty is predicted by evaluatingequations (10) through (23) with assumed measurement uncertainties assuggested in Tables 1 through 3 (Ats4 = 0.41K , Ap,, 2 = 2.31% , AQ =1.5%, An, = 0.1%). The influence of the gas constituency fluctuation onthe total uncertainty is accounted for by using the method as outlined inEq. 12, which yields AZ = 0.68%, Ay = 0.72%, and AMW = 0.08% forthis case. From the resulting absolute uncertainty values for the specific
= \I(AriirviThi)2 (Ano1.n,f) 2 (Ai„Timi-02
(22)
To complete the above Eq. 21 and 22 the only additional informationneeded is the fuel flow uncertainty and the fuel heating value uncertainty.Since the fuel flow is measured in the same way as the flow through thegas compressor, uncertainty values in Table 3 can be used. Also, sincethe heating value is obtained directly from gas composition, the samepercent uncertainty as was obtained for the specific heat (Eq. 10) can beapproximately used, namely:
pq Acp
q cp (23)
By introducing the uncertainty experience values from Tables 1 through4 into Eq. 10 through 23, the measurement uncertainty for a field test canbe predicted prior to the test. Consequently, the above method allows thegas turbine/compressor manufacturer and the end-user to determinereasonable test uncertainties as well as necessary requirements for the testinstrumentation prior to the test. This method can also be employed toresolve observed variations of field test performance results fromtheoretically predicted and/or factory test results.
Uncertainty Calculations Examples and Comparisons to Field Test Results
Two examples are shown below to demonstrate how the totalmeasurement uncertainty is obtained for some actual field testexperiments. Figure 2 shows a typical gas turbine driven compressorduring a field performance test. Also, a comparison to some factory testresults is presented in Example 1:
Example 1:
During field testing of a multistage turbocompressor the followingconditions were encountered:
• Compressor Application: Gas reinjection
• Instrumentation: single RTD and single pressure tap on each
Figure 2: Typical Gas Turbine Driven Compressorduring a Field Performance Test
heat, the actual head, the isentropic efficiency, and the required power(Acp, AH A, An OW) the percent total field test uncertainties aredetermined; namely: Acp/cp = 2.46%, AH/H = 2.49%, Ai = 3.24%, AP/P= 3.79%.
Thus, total efficiency uncertainties of above 3% are seen for this setof field test measurements. The main cause for these rather largeuncertainties is the inadequate number of pressure taps installed at thecompressor suction and discharge. Increasing the number of pressure tapsfrom one to four on each suction and discharge would reduce thepredicted compressor and power uncertainties to A171* = 1.84%, AP/P= 1.95%, respectively; a significant measurement improvement. For theabove example, a factory closed loop test had been performed on thecompressor, in which an efficiency of 64.1% for a similar operating pointwas achieved. Taking the test uncertainty range into account, theefficiency measured during the field test (62%) therefore confirms thefactory test results.
7
Downloaded From: http://proceedings.asmedigitalcollection.asme.org/ on 08/27/2018 Terms of Use: http://www.asme.org/about-asme/terms-of-use

50 100
30 uncertainty %
150 200
Head kJ/kg
25
20
15
10
5
0 0 300 350250
Example 2:
During a field test on a gas turbine driving a single stage pipelinecompressor, the following compression conditions were encountered:
• Compressor Application: Pipeline
• Instrumentation: 4 thermocouples and 4 pressure taps on eachsuction and discharge; annubar flow meters for the compressorflow; orifice flow meters for engine fuel flow
• Test Conditions: ps = 45.36 bar, p d = 55.1 bar, Ts = 25.8 °C, Td =41.9°C err = 88.1%), Q = 6.64 m 3/S, Wfuel = 0.47 kg/s, TH =29.6%, ip = 26.0%
• Gas Composition: 96.1% Methane, 1.8% Ethane, 0.3% Propane,0.3% I-Butane, 0.1% n-Butane, 0.6% Carbon Dioxide, 0.8%Nitrogen
As a comparison, when applying the above test conditions to Eq. 10through 23 and assuming measurement uncertainties as shown in Tables1 through 3 (AT,,d = 0.3K , Aps,d = 0.5%, AQ = 1.5%, Arim = 0.1%) thefollowing percent uncertainties are obtained: Acp/cp = 2.40%, AH/H =3.6%, A = 5.5%, AP/P = 4.0%. Similarly, evaluating Eq. 21 and 23 forthe package and gas turbine total uncertainties with AQ ius, = 1.0% yieldsArim = 4.5% and Ari*p = 4.3%, respectively.
Note that despite a generally higher accuracy than in the firstexample, the uncertainties for Example 2 are higher. This is typical forapplications with low pressure ratios, which are very sensitive touncertainties. Also note, that an improvement of the flow uncertaintieswould increase the overall accuracy only marginally.
In Example 2, the accuracy for the power measurement is higher thanthe accuracy for the efficiency measurement. This is due to the fact, thatthe uncertainties for the actual head H are lower than for the isentropichead H*. Because the calculation of the isentropic head requires theisentropic discharge temperature Td. (Eq. 14), the associated uncertaintiesfor Td are usually higher than the uncertainties for T d,which is directlymeasured. Thus, the power can be evaluated more accurately than theefficiency in many cases, as long as the accuracy of the flowmeasurement will be sufficiently high.
As in the previous example, one should remember that the theoreticaluncertainties as determined from Eq. 10 through 23 yield results for thetotal possible performance parameter uncertainty range (which is a veryconservative estimate), while the deviation is just a comparison betweentwo different measurements. One would thus anticipate the significantlylarger theoretical uncertainty values.
Overall, the uncertainty equations are seen to predict measurementfluctuations well. However, the general experience with this method isthat the uncertainty method conservatively over predicts errors by a smallmargin.
the effect of varying a number of field test measurement parameters onthe efficiency and power uncertainty are evaluated. The compressoroperating conditions as presented as Example 1 above were used as abasis for the below studies.
Results of varying the compressor head and suction temperature(keeping all other conditions, including isentropic efficiency, constant)onthe efficiency and power uncertainty are shown in Fig. (3) and (4). Asthe head is increased, the efficiency and power uncertainties are seen todecrease. The uncertainty rate of decrease is seen to be a direct functionof the increasing compressor head magnitude. Also, the uncertainties areseen to be lower for increased compressor suction temperatures. Both ofthese results are expected and can be explained as follows: the larger thepressure or temperature suction-discharge differential, the smaller therelative influence of the individual measurement errors on the totalperformance uncertainties.
0
50
100
150 200
250
300
350
Head kJ/kgfficiency ( delta T = 0.25K) ==Power (delta T = 0.25K)
Efficiency ( delta T = 0.5K) ...Power (delta T = 0.5K)
Suction Temperature = 288K
Figure 3: Power and Efficiency Uncertainty versus Compressor Head at288° K
Itfficiency ( delta T = 0.25K) mower (delta T = 0.25K)omF'fficiency ( delta T = 0.5K) —.Power (delta T = 0.5K)
Parametric Studies and TrendsA number of parametric studies were undertaken to determine the
effect of varying individual measurement variables on the totalperformance uncertainties. These studies also help to identify parameterswhich have the most significant effect on the total uncertainty. Hence,
Suction Temperature = 388 K
Figure 4: Power and Efficiency Uncertainty versus Compressor Head at388° K.
8
Downloaded From: http://proceedings.asmedigitalcollection.asme.org/ on 08/27/2018 Terms of Use: http://www.asme.org/about-asme/terms-of-use

Results in Fig. (3) and (4) are interesting, but do not provide anyguideline as to which uncertainty most significantly affects the overallperformance parameter uncertainties. Thus, Tables 5 and 6 show aquantitative comparison of the individual measurement uncertaintieseffect on the compressor isentropic efficiency uncertainty. For thesestudies only one measurement uncertainty parameter was varied while allothers were left at the values described in Example 1 above.
Table 5. Compressor Isentropic Efficiency Uncertainties [°/01
Error, % Aps AN
1.0 2.95 2.952.0 3.15 3.153.0 3.46 3.464.0 3.86 3.86
Table 6. Compressor Isentropic Efficiency Uncertainties MI
Error AT, ATd
0.25° K 3.21 3.230.50° K 3.27 3.251.00° K 3.46 3.302.00° K 4.12 3.464.00° K 6.04 4.00
Results in Table 5 show that the influence of the suction anddischarge pressure uncertainties on the total isentropic efficiencyuncertainty are identical. This is consistent with Eq. 16; i.e., the influenceon the isentropic enthalpy and efficiency uncertainty due to the gascomposition uncertainty is negligible when compared to the influencedue to the head uncertainty. Table 6 shows that the suction temperatureuncertainty has a stronger influence on the total isentropic efficiencyuncertainty than the discharge temperature uncertainty. Also, at highertemperature uncertainty levels this trend is seen to be more pronounced.
Similarly, Tables 7 and 8 show a quantitative comparison of theindividual measurement uncertainties affect on the compressor requiredpower uncertainty. Again, for this study only one measurementuncertainty parameter was varied while all other were left at the valuesdescribed in Example 1 above.
Table 7 shows that the power uncertainty is strongly affected by thesuction pressure uncertainty but not at all affected by the dischargepressure. Namely, the only pressure influence on the power uncertaintyis through Eq. 17 and 18 which only include the suction and not thedischarge pressure. Also, Table 8 shows that the power uncertaintyalmost identically affected by the suction and discharge temperatureuncertainty. Only at higher temperature uncertainty levels does theinfluence of the suction temperature uncertainty become morepronounced. The reason for the trend in Table 8 is that the requiredpower uncertainty is primarily dependent on the temperature difference(equal influence of T 5 and Td as seen in Eq. 13) and not on the absolutetemperature values. The power uncertainty deviation at highertemperature uncertainty levels is due to the fact that the suction
temperature also affects the power uncertainty through the mass flow Eq.17.
Table 7. Compressor Required Power Uncertainties I%)
Error, % AN Apd AQ
1.0 3.17 3.79 3.622.0 3.61 3.79 4.023.0 4.25 3.79 4.604.0 5.00 3.79 5.30
Table 8. Compressor Required Power Uncertainties [%1
Error AT, ATd
0.25° K 3.77 3.770.50° K 3.81 3.811.00° K 3.90 3.902.00° K 4.22 4.174.00° K 5.20 5.02
Results in Tables 5 through 8 show that the temperature and flow ratemeasurement uncertainties have a stronger effect on the overallperformance uncertainties than the pressure measurement uncertainties.However, due to the added complexity of pressure measurements, thefield test pressure measurement uncertainties are often much larger thantemperature measurement uncertainties and, thus, pressure measurementuncertainties should not be simply discounted.
SUMMARYThe equations governing the compressor and gas turbine performance
uncertainties were rigorously derived and results were numericallycompared to two actual field tests. Typical field test measurementexperience uncertainties were presented for different sets ofinstrumentation and sensors. By introducing the uncertainty experiencevalues into the uncertainty equations the performance measurementuncertainty for a field test can be predicted prior to the test. This allowsthe gas turbine/compressor manufacturer and the end-user to agree on anallowable machinery performance range rather than having to set asingular guarantee point. The above method can also be employed toresolve observed variations of field test performance results fromtheoretically predicted or factory test results.
A number of parametric studies describing uncertainty trends areincluded. Test parameters that correlate to the most significant influenceon the performance uncertainties were identified and suggestions areprovided on how to minimize their measurement errors. Results showedthat compressor efficiency uncertainties can be unacceptably high whensome basic rules for accurate testing are violated. However, by followingsome simple measurement rules and maintaining commonality of the gasequations of state, the overall compressor package performancemeasurement uncertainty can be limited and meaningful results can beachieved.
9
Downloaded From: http://proceedings.asmedigitalcollection.asme.org/ on 08/27/2018 Terms of Use: http://www.asme.org/about-asme/terms-of-use
ACKNOWLEDGMENTSThe authors wish to thank Leon Sapiro, Daryl Legrand, Jerry
Hammer, Tom Blattner and Sebouh Ohanian for their variouscontributions to this paper.
REFERENCESASME PTC 10, 1979, "Compressors and Exhausters."ASME PTC 19.1, 1985, "Measurement Uncertainties."ASME PTC 22, 1985, "Gas Turbine Power Plants "Aust, N., 1988, "Ein Verfahren zur Digitalen Simulation Instationarer
Vorgange in Verdichteranlagen," Ph.D. Dissertation, University of theFederal Armed Forces, Hamburg, Germany.
Beinecke D. and Luedtke, K., 1983, "Die Auslegung vonTurboverdichtem unter Berucksichtigung des Realen Gasverhaltens,"VDI Berichte Number 487, pp. 271-279.
Boelcs, A. and Suter, P., 1986, "Transsonische Turbomaschinen,"Karlsruhe, Germany: G. Braun.
Brun, K., 1996, "Analysis of the Automotive Torque ConverterInternal Flow Field," Ph.D. Dissertation, University of Virginia.
Cleveland, A., 1982, "Performance Testing of Gas TurbineCompressor Sets," ASME Paper No. 82-GT-199.
Doeblin, E.0, 1966, "Measurement Systems", New York, NY:McGraw-Hill Publishing Company.
ISO 2314, 1989, "Gas Turbines - Acceptance Tests," Geneve.Fozi, A.A., 1995, "Field Testing of Compressor Packages," Solar
Turbomachinery Technology Seminar, Paper No. 98.
Klein, J.M. and Draughton, P.A., 1991, "Field Performance Testingof an Uprated Gas Reinjection Compressor/Turbine Train," ASME PaperNo. 91-GT-48.
Meier, R.H. and Rhea, C.S., 1982, "Centrifugal Compressor TestingExperience and Practice," ASME Paper No. 82-GT-320.
McRoberts, I.W., 1984, "Performance Trials of Two CentrifugalCompressor Trains on an Offshore Platform," IMechE C48/84.
Scarborough, J.B., 1955, "Numerical Mathematical Analysis,"Baltimore, Maryland: Johns Hopkins University.
Schmitt, W. and Thomas, V., 1995, "Comparison of TestMeasurements Taken on a Pipeline Compressor/ Gas Turbine Unit in theWorkshop and at Site," ASME Paper No. 95-GT-125.
Valenti, M., 1997, "Determining Gas Meter Accuracy," MechanicalEngineering, No. 119, Vol. 3, pp. 102-106.
VDI 2045, 1993, "Acceptance and Performance Tests on TurboCompressors and Displacement Compressors," Duesseldorf.
VDI 2048, 1978, "Inaccuracies in Acceptance Test Measurements,"Duesseldorf.
10
Downloaded From: http://proceedings.asmedigitalcollection.asme.org/ on 08/27/2018 Terms of Use: http://www.asme.org/about-asme/terms-of-use