measured aerodynamic characteristics of wings at low reynolds
TRANSCRIPT

Aerospace Science and Technology 42 (2015) 392–406
Contents lists available at ScienceDirect
Aerospace Science and Technology
www.elsevier.com/locate/aescte
Measured aerodynamic characteristics of wings at low Reynolds
numbers
G.K. Ananda ∗,1, P.P. Sukumar 2, M.S. Selig 3
Department of Aerospace Engineering, University of Illinois at Urbana–Champaign, 104 S. Wright St., Urbana, IL 61801, USA
a r t i c l e i n f o a b s t r a c t
Article history:Received 8 March 2014Received in revised form 3 October 2014Accepted 18 November 2014Available online 30 December 2014
Keywords:Low Reynolds numberUAVsWing aerodynamicsAspect ratioTaper ratioOswald’s efficiency factor
An experimental program was conducted to study the low Reynolds number aerodynamics of ten wings having aspect ratios ranging from 2 to 5. In this low-to-moderate aspect ratio range, experimental data for use in validation of computational methods and design is lacking in the literature, yet this range spans that of many typical modern small-scale UAVs that operate in the 50,000 to 150,000 Reynolds number range. A custom three-component force balance for measuring lift, drag, and moment is described in detail and validated. Both straight and tapered wings were wind tunnel tested, and flow visualization was performed to characterize the flow. The measurements showed that all wings exhibited sensitivity to changes in aspect ratio and Reynolds number. Oswald’s efficiency factors derived from the measurements ranged from a low value of 0.3 to more typical values near 0.8. Additionally, the aerodynamic performance trends relating to the maximum lift coefficient, lift curve slope, and aerodynamic center are computed from the measurements and discussed for the flat-plate wing models. Finally, no hysteresis in angle of attack was observed over the range of Reynolds numbers tested.
© 2015 Elsevier Masson SAS. All rights reserved.
1. Introduction
With small-scaled unmanned aerial vehicle (UAV) design and development coming to the fore in the aerospace industry, there is a great need for accurate experimental data for the purposes of aerodynamic modeling and simulation of various UAV configura-tions. Small-scaled fixed-wing UAV platforms currently in service (e.g., Desert Hawk, Wasp III, Raven) operate primarily in the low Reynolds number regime (Re ≤ 300,000).
As has been noted in literature, airfoils operating at low Reynolds numbers are primarily inhibited by the effect of the laminar separation bubble where an initially laminar boundary layer flow over an airfoil separates upon encountering an adverse pressure gradient, transitions to turbulent flow, and subsequently reattaches onto the airfoil surface. Carmichael [7] mentions in his low Reynolds number survey that there exists a range of Reynolds numbers (70,000 ≤ Re ≤ 200,000) where airfoil performance (pri-
* Corresponding author.E-mail addresses: [email protected] (G.K. Ananda), [email protected]
(M.S. Selig).1 Graduate Student (Ph.D.).2 Graduate Research Assistant; currently Software Development Engineer, Ama-
zon.com, Inc., Seattle, WA, USA.3 Associate Professor.
http://dx.doi.org/10.1016/j.ast.2014.11.0161270-9638/© 2015 Elsevier Masson SAS. All rights reserved.
marily drag) is greatly affected by the formation of the laminar separation bubble, its size, and its hysteresis effects.
The performance of low Reynolds number airfoils is therefore strongly dependent on the magnitude of the drag rise attributable to the bubble. Two dimensional airfoil data [25,42–45] plays an essential role for wings of high aspect ratio (A ≥ 7), as the local flow over the central section of these wings behave two dimen-sionally, and wing performance can be easily calculated by correct-ing for downwash effects (lifting line) with limited loss of accuracy.
For low aspect ratio wings (A ≤ 2) however, the lifting-line concept becomes of limited value as the local flow around a wing section is no longer nominally two-dimensional. Numerous exper-imental results [9,14,18,24,29,30,35,46,47,51] have shown that low aspect ratio wing performance is affected by both linear and non-linear sources of lift, and that the effect of the laminar separation bubble is attenuated by the re-energizing effect of wing-tip vor-tices. The linear source of lift is derived from the bound vortex flow. The nonlinear source of lift can be explained by applying Polhamus’ leading-edge suction analogy [37,38] to the side edges of wings [20,21]. The strong wing-tip vortices of low aspect ratio wings create low pressure peaks inboard of the side edges thereby yielding increasing nonlinear lift with growing tip vortex strength. For the past two decades, significant inroads have been made into the development of 6–12 in (15–30 cm) wingspan Micro Air Ve-hicles (MAVs) of low aspect ratio [1–3,11,12,15,16,23,28,31,32,48].
G.K. Ananda et al. / Aerospace Science and Technology 42 (2015) 392–406 393
Nomenclature
A aspect ratiob wingspanc̄ mean aerodynamic chordC D wing drag coefficient (= D/ 1
2 ρV 2∞ Sref )Cd airfoil drag coefficient (= D/ 1
2 ρV 2∞c̄)C Dmin wing minimum drag coefficientCL wing lift coefficient (= L/ 1
2 ρV 2∞ Sref )Cl airfoil lift coefficientCLα wing lift curve slopeClα airfoil lift curve slopeCMc/4 wing moment coefficient at quarter chord
(= M/ 12 ρV 2∞ Sref c̄)
Cmc/4 airfoil moment coefficient at quarter chordCMα wing moment curve slopeD wing drage0 Oswald’s efficiency factork constant of proportionality giving the rate of increase
of Cd with Cl2
L wing lift
LE leading edgeM wing moment at quarter chordRe Reynolds number based on mean aerodynamic chord
(= V∞c̄/ν)Sref wing reference areaTE trailing edgeV∞ freestream velocityx̄ac normalized location of the aerodynamic center from
the leading edge of the mean aerodynamic chordα wing angle of attackαCLmax
wing stall angle of attackδ induced drag factorλ taper ratioν kinematic viscosityρ density of air
Subscripts
ac aerodynamic centerc/4 quarter-chord
Despite this, the payload capacity and endurance of MAVs have not reached levels that are practical for use [36].
The current level of technology though has produced a plethora of small UAVs (man-portable UAVs, hand launch UAVs) that are in service both in military and civilian environments. The wings and tail surfaces of most of these UAVs fall into the low-to-moderate aspect ratio category (2 ≤A≤ 6). In this aspect ratio range where finite wing effects still play a large effect for low Reynolds num-bers, the reliance on two-dimensional experimental data would be insufficient. Limited experimental data however is available in lit-erature [6,18,27,33,35,47,49]. In addition, there have yet to be de-tailed experimental results that relate the variation of aspect ratio, taper ratio, and Reynolds number for low-to-moderate aspect ratio wings in the critical 70,000 to 200,000 Reynolds number range.
In a bid to supplement the limited data currently available for low-to-moderate aspect ratio wings at low Reynolds numbers, ten flat-plate wings of varying aspect ratio (A = 2, 3, 4, and 5) and taper ratios (λ = 0.5, 0.75, and 1) were tested using a custom-designed and fabricated low speed external platform balance over a range of Reynolds numbers between 60,000 and 160,000. General observations from the wind tunnel results are presented together with specific trends related to the maximum lift coefficient, lift curve slope, aerodynamic center, and Oswald’s efficiency factor of the models tested.
This paper is arranged as follows. A detailed description of the wind tunnel test models is first given. A detailed summary of the experimental setup and force-balance validation is then described. Finally, typical wind tunnel results and overall aerodynamic trends obtained for all wings tested are presented and discussed, and con-clusions realized.
2. Experimental methods
2.1. Models tested
A total of ten flat-plate straight wings were tested. As detailed in Ananda [4], flat plates were chosen for testing as they serve as a good baseline to observe and interpret the effects of Reynolds number, aspect ratio, and taper ratio variation. In addition, the wing aspect ratios and Reynolds numbers tested are also typical for small-scaled UAV wings and tail surfaces.
The models were rapid prototyped using stereolithography (SLA) to tolerances of approximately ±0.005 in (±0.13 mm) en-suring model accuracy and surface quality. A mean aerodynamic chord length (c̄) of 3.5 in (88.9 mm) was chosen for all wings. In addition, the model span fraction of all the wings tested was less than 0.8. The model span fraction is the ratio of the wing span to the width of the test section along the length of the wing. Accord-ing to Refs. [5] and [34], a model span fraction that is less than 0.8 is desirable in order for standard wind tunnel corrections to apply. Further, the wind tunnel facility used for testing (discussed in Sec-tion 2.2) has an increasing cross-section to account for boundary layer growth.
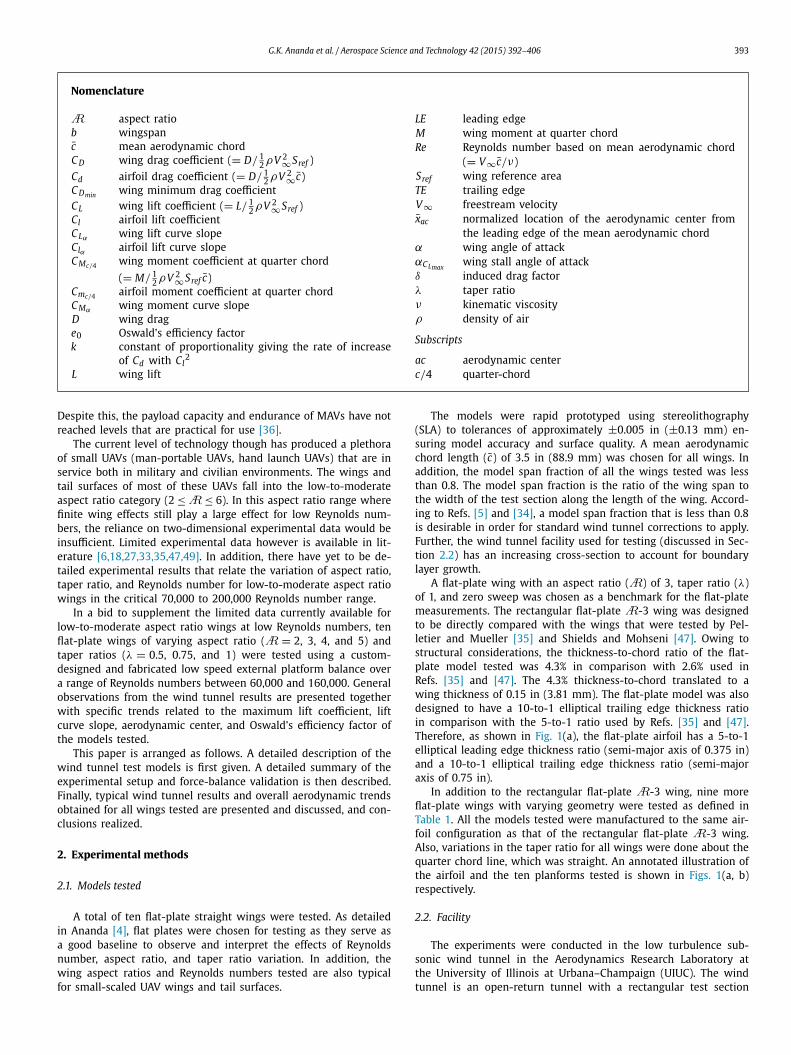
A flat-plate wing with an aspect ratio (A) of 3, taper ratio (λ) of 1, and zero sweep was chosen as a benchmark for the flat-plate measurements. The rectangular flat-plate A-3 wing was designed to be directly compared with the wings that were tested by Pel-letier and Mueller [35] and Shields and Mohseni [47]. Owing to structural considerations, the thickness-to-chord ratio of the flat-plate model tested was 4.3% in comparison with 2.6% used in Refs. [35] and [47]. The 4.3% thickness-to-chord translated to a wing thickness of 0.15 in (3.81 mm). The flat-plate model was also designed to have a 10-to-1 elliptical trailing edge thickness ratio in comparison with the 5-to-1 ratio used by Refs. [35] and [47]. Therefore, as shown in Fig. 1(a), the flat-plate airfoil has a 5-to-1 elliptical leading edge thickness ratio (semi-major axis of 0.375 in) and a 10-to-1 elliptical trailing edge thickness ratio (semi-major axis of 0.75 in).
In addition to the rectangular flat-plate A-3 wing, nine more flat-plate wings with varying geometry were tested as defined in Table 1. All the models tested were manufactured to the same air-foil configuration as that of the rectangular flat-plate A-3 wing. Also, variations in the taper ratio for all wings were done about the quarter chord line, which was straight. An annotated illustration of the airfoil and the ten planforms tested is shown in Figs. 1(a, b) respectively.
2.2. Facility
The experiments were conducted in the low turbulence sub-sonic wind tunnel in the Aerodynamics Research Laboratory at the University of Illinois at Urbana–Champaign (UIUC). The wind tunnel is an open-return tunnel with a rectangular test section
394 G.K. Ananda et al. / Aerospace Science and Technology 42 (2015) 392–406
Fig. 1. Geometric characteristics of models tested: (a) 5-to-1 elliptical leading edge thickness ratio (semi-major axis of 0.375 in) and a 10-to-1 elliptical trailing edge thickness ratio (semi-major axis of 0.75 in) flat-plate airfoil and (b) planform view of all models tested.
Table 1Flat plate model test matrix.
A
2 3 4 5
λ
0.5 0.5 0.5 –0.75 0.75 0.75 –1 1 1 1
measuring 2.8 × 4.0 ft (0.853 × 1.219 m) in cross section and hav-ing a length of 8 ft (2.438 m). Over the length of the test section, the width increases by approximately 0.5 in (12.7 mm) to account for boundary layer growth along the tunnel side walls. Test section speeds up to 160 mph (71.53 m/s) can be achieved via a 125 hp (93.25 kW) alternating current electric motor connected to a five-bladed fan. As detailed in Ref. [42], the turbulence intensity of the wind tunnel was measured to be less than 0.1%.
2.3. Force balance
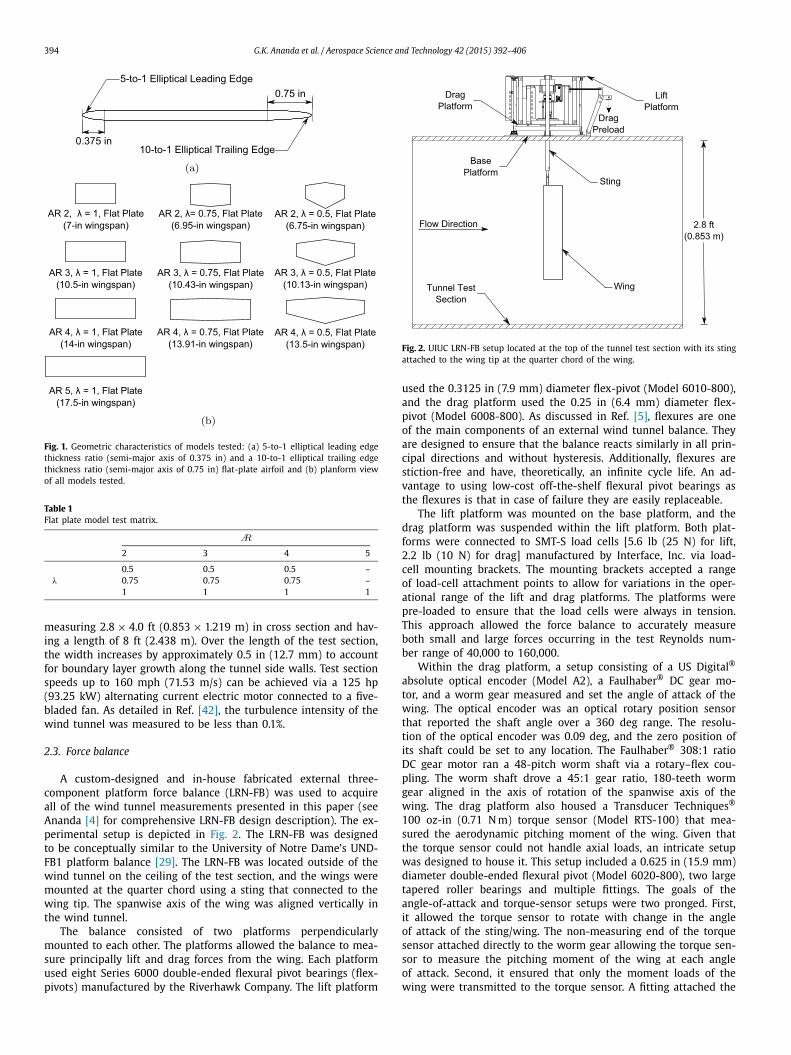
A custom-designed and in-house fabricated external three-component platform force balance (LRN-FB) was used to acquire all of the wind tunnel measurements presented in this paper (see Ananda [4] for comprehensive LRN-FB design description). The ex-perimental setup is depicted in Fig. 2. The LRN-FB was designed to be conceptually similar to the University of Notre Dame’s UND-FB1 platform balance [29]. The LRN-FB was located outside of the wind tunnel on the ceiling of the test section, and the wings were mounted at the quarter chord using a sting that connected to the wing tip. The spanwise axis of the wing was aligned vertically in the wind tunnel.
The balance consisted of two platforms perpendicularlymounted to each other. The platforms allowed the balance to mea-sure principally lift and drag forces from the wing. Each platform used eight Series 6000 double-ended flexural pivot bearings (flex-pivots) manufactured by the Riverhawk Company. The lift platform
Fig. 2. UIUC LRN-FB setup located at the top of the tunnel test section with its sting attached to the wing tip at the quarter chord of the wing.
used the 0.3125 in (7.9 mm) diameter flex-pivot (Model 6010-800), and the drag platform used the 0.25 in (6.4 mm) diameter flex-pivot (Model 6008-800). As discussed in Ref. [5], flexures are one of the main components of an external wind tunnel balance. They are designed to ensure that the balance reacts similarly in all prin-cipal directions and without hysteresis. Additionally, flexures are stiction-free and have, theoretically, an infinite cycle life. An ad-vantage to using low-cost off-the-shelf flexural pivot bearings as the flexures is that in case of failure they are easily replaceable.
The lift platform was mounted on the base platform, and the drag platform was suspended within the lift platform. Both plat-forms were connected to SMT-S load cells [5.6 lb (25 N) for lift, 2.2 lb (10 N) for drag] manufactured by Interface, Inc. via load-cell mounting brackets. The mounting brackets accepted a range of load-cell attachment points to allow for variations in the oper-ational range of the lift and drag platforms. The platforms were pre-loaded to ensure that the load cells were always in tension. This approach allowed the force balance to accurately measure both small and large forces occurring in the test Reynolds num-ber range of 40,000 to 160,000.
Within the drag platform, a setup consisting of a US Digital®
absolute optical encoder (Model A2), a Faulhaber® DC gear mo-tor, and a worm gear measured and set the angle of attack of the wing. The optical encoder was an optical rotary position sensor that reported the shaft angle over a 360 deg range. The resolu-tion of the optical encoder was 0.09 deg, and the zero position of its shaft could be set to any location. The Faulhaber® 308:1 ratio DC gear motor ran a 48-pitch worm shaft via a rotary–flex cou-pling. The worm shaft drove a 45:1 gear ratio, 180-teeth worm gear aligned in the axis of rotation of the spanwise axis of the wing. The drag platform also housed a Transducer Techniques®
100 oz-in (0.71 N m) torque sensor (Model RTS-100) that mea-sured the aerodynamic pitching moment of the wing. Given that the torque sensor could not handle axial loads, an intricate setup was designed to house it. This setup included a 0.625 in (15.9 mm) diameter double-ended flexural pivot (Model 6020-800), two large tapered roller bearings and multiple fittings. The goals of the angle-of-attack and torque-sensor setups were two pronged. First, it allowed the torque sensor to rotate with change in the angle of attack of the sting/wing. The non-measuring end of the torque sensor attached directly to the worm gear allowing the torque sen-sor to measure the pitching moment of the wing at each angle of attack. Second, it ensured that only the moment loads of the wing were transmitted to the torque sensor. A fitting attached the
G.K. Ananda et al. / Aerospace Science and Technology 42 (2015) 392–406 395
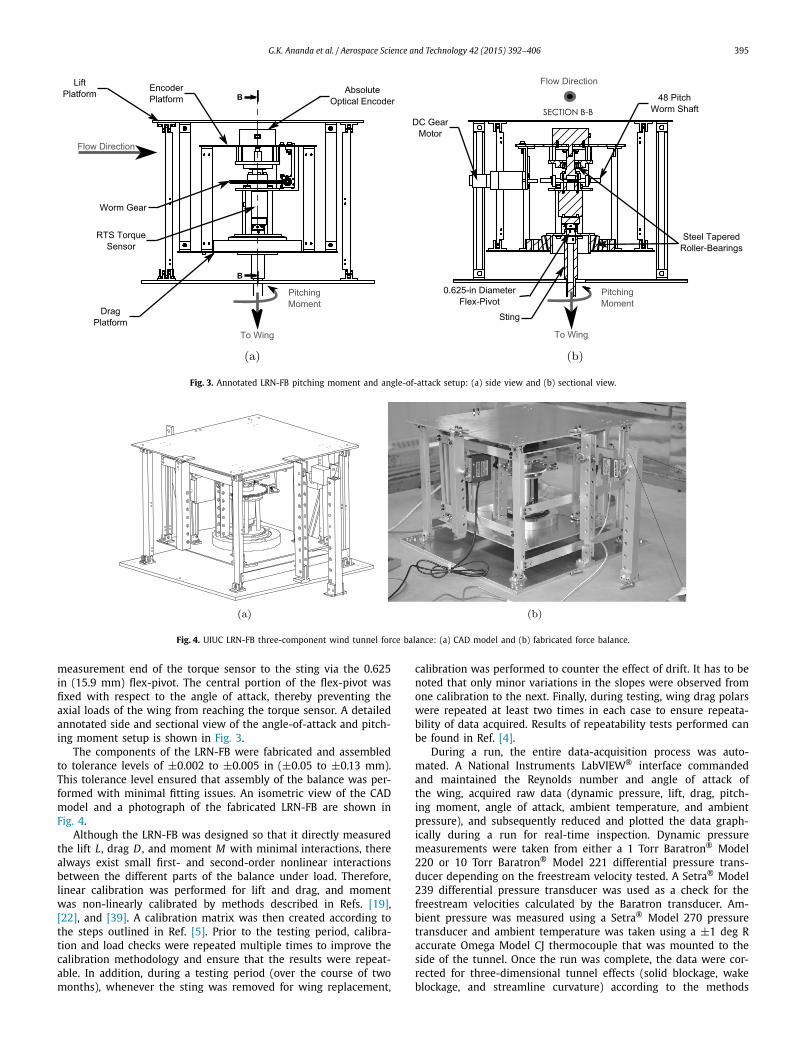
Fig. 3. Annotated LRN-FB pitching moment and angle-of-attack setup: (a) side view and (b) sectional view.
Fig. 4. UIUC LRN-FB three-component wind tunnel force balance: (a) CAD model and (b) fabricated force balance.
measurement end of the torque sensor to the sting via the 0.625 in (15.9 mm) flex-pivot. The central portion of the flex-pivot was fixed with respect to the angle of attack, thereby preventing the axial loads of the wing from reaching the torque sensor. A detailed annotated side and sectional view of the angle-of-attack and pitch-ing moment setup is shown in Fig. 3.
The components of the LRN-FB were fabricated and assembled to tolerance levels of ±0.002 to ±0.005 in (±0.05 to ±0.13 mm). This tolerance level ensured that assembly of the balance was per-formed with minimal fitting issues. An isometric view of the CAD model and a photograph of the fabricated LRN-FB are shown in Fig. 4.
Although the LRN-FB was designed so that it directly measured the lift L, drag D , and moment M with minimal interactions, there always exist small first- and second-order nonlinear interactions between the different parts of the balance under load. Therefore, linear calibration was performed for lift and drag, and moment was non-linearly calibrated by methods described in Refs. [19], [22], and [39]. A calibration matrix was then created according to the steps outlined in Ref. [5]. Prior to the testing period, calibra-tion and load checks were repeated multiple times to improve the calibration methodology and ensure that the results were repeat-able. In addition, during a testing period (over the course of two months), whenever the sting was removed for wing replacement,
calibration was performed to counter the effect of drift. It has to be noted that only minor variations in the slopes were observed from one calibration to the next. Finally, during testing, wing drag polars were repeated at least two times in each case to ensure repeata-bility of data acquired. Results of repeatability tests performed can be found in Ref. [4].
During a run, the entire data-acquisition process was auto-mated. A National Instruments LabVIEW® interface commanded and maintained the Reynolds number and angle of attack of the wing, acquired raw data (dynamic pressure, lift, drag, pitch-ing moment, angle of attack, ambient temperature, and ambient pressure), and subsequently reduced and plotted the data graph-ically during a run for real-time inspection. Dynamic pressure measurements were taken from either a 1 Torr Baratron® Model 220 or 10 Torr Baratron® Model 221 differential pressure trans-ducer depending on the freestream velocity tested. A Setra® Model 239 differential pressure transducer was used as a check for the freestream velocities calculated by the Baratron transducer. Am-bient pressure was measured using a Setra® Model 270 pressure transducer and ambient temperature was taken using a ±1 deg R accurate Omega Model CJ thermocouple that was mounted to the side of the tunnel. Once the run was complete, the data were cor-rected for three-dimensional tunnel effects (solid blockage, wake blockage, and streamline curvature) according to the methods

396 G.K. Ananda et al. / Aerospace Science and Technology 42 (2015) 392–406
outlined in Ref. [5]. The relative and absolute (in parentheses) uncertainties of the lift, drag, and moment coefficients were calcu-lated to be 3.3% (�CL = 0.0103), 2.7% (�C D = 0.00107), and 4.6% (�CMc/4 = 0.00024) respectively using the methods introduced by Kline and McClintock [17] and further discussed by Coleman and Steel [8]. Detailed information regarding calibration, uncertainty analysis (including measurement device uncertainties), and correc-tion methodology can be found in Ref. [4].
2.4. Force balance validation
Two different validations were performed on the LRN-FB: the wing mounting setup validation and a historical data validation. Results for both validation tests are presented below.
2.4.1. Validation – wing mounting setupThe cantilever beam mounting setup for all wings tested made
it necessary to account for the tare and interference effects of the sting. As discussed in Ref. [5], the tare of the sting is its direct drag effects, and the interference is its effect on the flow over the wing. The direct drag effects of the sting were accounted for by taking sting tares at each Reynolds number tested. During wing testing runs, sting tares corresponding to the Reynolds number tested were automatically subtracted prior to resolving the wing aerodynamic loads into lift, drag, and moment components.
Two methods were employed to test the interference effects of the sting. For the first test, a mirror sting was mounted to the tunnel floor. Interference tests were done using a Wortmann FX 63-137 A-4 wing. The mirror sting was not attached to the wing; a gap of approximately 1 mm was maintained. Tests per-formed at Reynolds numbers of 30,000 and 60,000 showed that the mirror sting had negligible interference effects on the lift, drag, and moment measurements of the wing. In addition, fluorescent oil-flow visualization was employed to determine whether the flow over the wings was substantially affected by the sting. Fig. 5 shows a photograph of a fluorescent oil flow over the upper surface of the Wortmann wing at α = 9 deg and Re = 90,000. The similari-ties in the surface oil flow on both ends of the Wortmann wing in Fig. 5 indicate that the flow over the sting caused minimal inter-ference to the flow over the wing. Also, several important features of low Reynolds number flow over wings were discernible such as the laminar flow, laminar separation bubble, and turbulent flow regions. Wing vortex induced separation was also observed in the region of the wing tips.
2.4.2. Validation – flat-plate A-3 wingA historical data validation case was performed on the rectan-
gular flat-plate A-3 wing. Validation was performed by comparing with data from Pelletier and Mueller [35] and Shields and Mohseni [47]. The differences between the A-3 wing tested with the LRN-FB and that tested by Refs. [35] and [47] were that the wing tested had a 4.3% thickness-to-chord ratio and a 10-to-1 elliptical trail-ing edge thickness ratio in comparison with the respective 2.6% and 5-to-1 ratio used by Refs. [35] and [47]. Also, semi-span wings were tested in Ref. [35] in comparison with full-span wings tested in Ref. [47] and with the present LRN-FB. Lift, drag, moment, and drag polar comparison results are shown in Figs. 6(a–d).
Lift comparison results show close agreement with the theoret-ical lift curve for an aspect ratio of 3 wing and data from Ref. [35]. The main differences are the stall angle of attack and maximum lift coefficient which are likely due to the differences in the models tested as discussed prior. Similarly, drag data [see Fig. 6(b)] shows good agreement with Ref. [35]. A wider drag bucket for the ex-perimental data in comparison with data from Ref. [35] can be at-tributed to test model differences (semi-span vs. full span). The ex-perimental C Dmin value (present data and Ref. [35]) also lies within
Fig. 5. Upper surface oil flow visualization of major flow features on the Wortmann FX 63-137 rectangular wing with an A of 4 (α = 9 deg, Re = 90,000).
the expected minimum drag range for a theoretical flat-plate wing at similar Reynolds numbers. Finally, moment comparison results with data from Ref. [35] and [47] show small differences that can be attributed as Ref. [47] suggests to experimental setup variations between the three tunnels and test model differences.
An attempt was made to assess whether the measured and C Dmin value from Ref. [35] of approximately 0.0175 or the C Dmin
value from Ref. [47] of approximately 0.04 was more accurate. Laminar (Blasius solution) and turbulent (empirical estimate) skin friction drag coefficients were calculated to be 0.0094 and 0.0155 respectively from incompressible boundary layer approximations for a flat plate at a Reynolds number of 80,000. In addition, XFOIL [10] was used to estimate the Cd0 for an airfoil similar to the flat plate profile tested. At a Reynolds number of 80,000, the Cd0 of the airfoil was calculated to be approximately 0.0122. Given that the XFOIL and theoretical estimates did not account for wing tip ef-fects, it can be concluded that the measured and C Dmin value from Ref. [35] is of higher accuracy as compared with the measurement from Ref. [47].
3. Results and discussion
This section lists general observations and discusses important characteristics discerned from the wind tunnel results of the ten flat-plate wings tested. The important characteristics discussed re-late to the maximum lift coefficient, lift curve slope, aerodynamic center, and Oswald’s efficiency factor of the wings. Data for all wind tunnel tests was taken from −15 to 30 deg for increasing and then decreasing angles of attack to possibly capture hystere-sis effects. Moreover, a large angle of attack range was chosen to capture post-stall effects of the flat-plate wings. A full set of wind-tunnel results can be found in Ref. [4].
3.1. Typical results and general observations
In this subsection, typical results from wind tunnel measure-ments of the ten wings tested are shown. Drag polars, lift curves, and moment curves of the flat-plate wings exhibiting various trends are presented in Figs. 7–9. In Figs. 7(a, b), results are pre-sented where Reynolds number is varied for a wing with an aspect ratio of 4 and taper ratio of 0.5. Figs. 8(a, b) present aspect ratio variation results for wings with a taper ratio of 0.75 tested at a

G.K. Ananda et al. / Aerospace Science and Technology 42 (2015) 392–406 397
Fig. 6. Comparison results for the rectangular flat-plate wing with anA of 3 at a Reynolds number of 80,000: (a) lift, (b) drag, (c) moment, and (d) drag polar.
Reynolds number of 100,000. Taper ratio variation results are pre-sented for wings with an aspect ratio of 3 tested at a Reynolds number of 80,000 in Figs. 9(a, b). In Fig. 10, lift-to-drag ratio curves as a function of angle of attack are presented at varying Reynolds numbers for a wing with an aspect ratio of 4 and a taper ra-tio of 0.5. Lastly, upper surface oil flow visualization performed on the rectangular flat-plate A-3 wing at a Reynolds number of 60,000 and at angles of attack of 5, 7, and 10 deg is presented in Figs. 11(a–c).
General observations of the results are as follows:
• The maximum lift coefficient, CLmax , was found for all models tested to be in the range of 0.55 to 0.7. The procedure used to obtain CLmax is discussed later in Section 3.2.
• Upper surface oil flow visualization results showed the ex-istence of a laminar separation bubble in the leading edge of the center section of the rectangular flat-plate A-3 wing at pre-stall angles of attack [see Figs. 11(a, b)]. A conceptual illustration of the relationship between the surface oil flow features and skin friction distribution taken from Ref. [41] is shown in Fig. 12 as an aid to understanding the flow features

398 G.K. Ananda et al. / Aerospace Science and Technology 42 (2015) 392–406
Fig. 7. Flat-plate 5-to-1 LE, 10-to-1 TE wing with anA of 4 and λ of 0.5: (a) drag polars and (b) lift and moment curves. The dash–dot line indicates initiation of lift stall.
Fig. 8. Flat-plate 5-to-1 LE, 10-to-1 TE wings with a λ of 0.75 at a Reynolds number of 100,000: (a) drag polars and (b) lift and moment curves.
of the laminar separation bubble. The flow visualization pho-tographs of the wing at 5 and 7 deg show that the laminar boundary layer flowing around the thin leading edge of the wing separates immediately. The separated laminar boundary layer then transitions to turbulent flow and reattaches itself some distance aft of the leading edge of the wing. As the an-gle of attack increases, the reattachment line of the separation bubble shifts toward the leading edge thereby shortening the length of the separation bubble. At stall (α ≈ 10 deg), flow over the center section of the wing separates completely and only the flow due to the wing-tip vortices is evident. A lami-nar separation bubble was also observed by Torres and Mueller [50] on low aspect ratio (0.5, 1, and 2) flat-plate wings.
• Stall is accompanied by a deviation of the moment coefficient from a value close to zero [see Fig. 7(b) wherein the dash–dot line indicates initiation of lift stall].
• An increase in lift curve slope, CLα , occurs with increasing Reynolds number and aspect ratio (further discussed in Sec-tion 3.3). Taper ratio has a minimal effect on CLα .
• Consequent to the increase in CLα , a widening of the drag bucket is also observed with increasing Reynolds number and aspect ratio [see Figs. 7(a) and 8(a)]. A large change in the size of the drag bucket is seen between an aspect ratio of 2 and 3.
• Prior to stall, the quarter-chord pitching moment coefficient, CMc/4 , is observed to be small for all wings tested. In the stall and post-stall regions, large negative moments are observed

G.K. Ananda et al. / Aerospace Science and Technology 42 (2015) 392–406 399
Fig. 9. Flat-plate 5-to-1 LE, 10-to-1 TE wings with anA of 3 at a Reynolds number of 120,000: (a) drag polars and (b) lift and moment curves.
Fig. 10. Lift-to-drag ratio curve for a flat-plate 5-to-1 LE, 10-to-1 TE wing with an A of 4 and λ of 0.5 at different Reynolds numbers.
with larger magnitude moments observed for low aspect ratio, low taper ratio wings [see Figs. 7(b), 8(b), and 9(b)].
• In the post-stall region, both lift and moment coefficients are observed to be relatively constant over the range of angles of attack tested (up to 30 deg).
• The C Dmin values for all wings tested are observed to be approximately 0.01–0.02 over the Reynolds numbers tested (60,000 to 160,000). At these Reynolds numbers, the laminar (Blasius solution) skin friction drag coefficient was calculated to be from 0.0066 to 0.0108, and the turbulent (empirical ap-proximation) skin friction drag coefficient was calculated to be from 0.0134 to 0.0164.
• In terms of lift-to-drag ratio (Fig. 10), a narrow high CL/C D an-gle of attack range is observed for all flat-plate wings. The high CL/C D range is preceded and followed by precipitous drops in lift-to-drag ratio, indicative of flat-plate stall and consequently a narrow maximum range flight envelope. Also, a general trend of increasing maximum lift-to-drag ratio with Reynolds num-ber is observed for most flat-plate wings tested.
• Finally, aerodynamic hysteresis was not observed for any of the flat-plate wings over the range of angles of attack and Reynolds numbers tested.
3.2. Maximum lift coefficient
The maximum lift coefficient, CLmax , of a wing is sometimes dif-ficult to obtain as wings undergoing stall may not exhibit a loss of lift. The flat-plate models tested exhibited relatively flat post-stall curves [see Figs. 7(b), 8(b), and 9(b)]. As a result, the determina-tion of CLmax becomes somewhat ambiguous. Since CLmax should be tied to an indication of flow separation from the wing, the change in the quarter-chord moment, CMc/4 , of the wing from a value close to zero was chosen as the indicator for stall. Therefore, in this pa-per, CLmax is defined as the lift coefficient for which the magnitude of the moment curve slope, CMα , is the largest. The moment curve slope, CMα , is derived at each angle of attack from CMc/4 using a five-point linear least squares fit method.
The method of obtaining CLmax from wind tunnel measurements is illustrated in Figs. 13(a–c) where CL , CMc/4 , and CMα curves are presented as a function of angle of attack for the benchmark (A = 3, λ = 1) flat-plate wing at a Reynolds number of 120,000. The largest magnitude for CMα [see Fig. 13(c)] was chosen as it represents the largest change in the moment of the wing, sig-nifying that the flow has substantially separated from the upper surface of the wing. Past this angle of attack, the wing would be stalled, and wing buffeting would occur.
Using the procedure described above, the CLmax of all the flat-plate wings is presented as a function of Reynolds number in Fig. 14. Only a slightly increasing trend for CLmax with increasing Reynolds number is observed in Fig. 14. Over the range of Reynolds numbers tested, CLmax was found to lie between 0.55 and 0.7.
Figs. 15(a–c) present CLmax results as a function of aspect ratio at different Reynolds numbers. Results are presented for each taper ratio case (λ = 0.5, 0.75, and 1). Apart from the slightly higher CLmax values for a flat-plate wing with an aspect ratio of 2 and taper ratio of 1 [see Fig. 15(c)], CLmax remains relatively constant with variation in aspect ratio. Further, the large CLmax increasing effects with decreasing aspect ratio observed by Torres and Mueller

400 G.K. Ananda et al. / Aerospace Science and Technology 42 (2015) 392–406
Fig. 11. Upper surface oil flow visualization on the rectangular flat-plateA-3 wing at a Reynolds number of 60,000 at (a) α = 5 deg, (b) α = 7 deg, and (c) α = 10 deg.
Fig. 12. Conceptual illustration of the relationship between the surface oil flow fea-tures and skin friction distribution in the region of the laminar separation bubble plotted against airfoil length [41].
[50] for low aspect ratio wings (A ≤ 2) was not evident for the low-to-moderate aspect ratio wings tested.
The maximum lift coefficient, CLmax , results are also presented as a function of taper ratio in Figs. 16(a–c). Results are presented for flat-plate wings with an aspect ratio of 2, 3, and 4 at differ-ent Reynolds numbers. The CLmax of wings with an aspect ratio of 3 and 4 [see Figs. 16(b, c)] is shown to slightly decrease with increasing taper ratio, meaning that a lower CLmax is observed for rectangular flat-plate wings. As Fig. 16(a) shows, wings with an as-
pect ratio of 2 do not show any apparent trends with taper ratio variations.
3.3. Lift curve slope
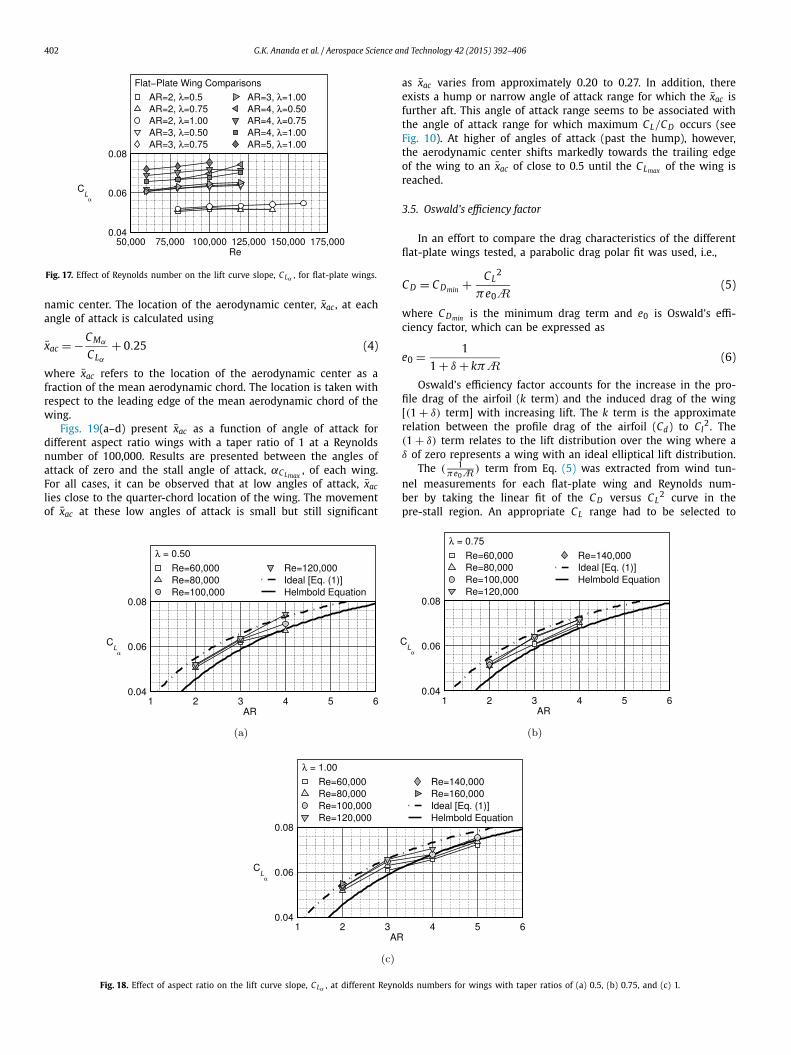
The lift curve slopes were calculated by fitting the linear por-tion of each lift curve to a linear trendline. Presented in Fig. 17, a general increasing trend was exhibited for the lift curve slope, CLα , of the flat-plate wings with increasing Reynolds number. As expected, Fig. 17 also shows that there is a difference in CLα with respect to aspect ratio.
To reinforce these observations, CLα results are presented in Figs. 18(a–c) as a function of aspect ratio at varying Reynolds num-bers for each of the three taper ratios that were tested. Also, the theoretical lift curve slope for a finite wing of elliptical wing load-ing (ideal wing) and the Helmbold low aspect ratio straight-wing equation slopes are co-plotted as lines in Figs. 18(a–c). The ideal theoretical lift curve slope is given by
CLα = ClαA
A+ 2(1)
and the Helmbold equation, taken from Ref. [26], is given by
CLα = ClαA
(Clαπ ) +
√(
Clαπ )2 +A2
(2)
where Clα refers to the airfoil lift curve slope taken as 2π .Figs. 18(a–c) show that the measured CLα for flat-plate wings at
low Reynolds numbers follows the general trends given by the the-oretical lift curve slope and the Helmbold equation. It is observed

G.K. Ananda et al. / Aerospace Science and Technology 42 (2015) 392–406 401
Fig. 13. Method of obtaining CLmax from (a) CL curve, (b) CMc/4 curve, and (c) CMα curve for a flat-plate wing with anA of 3 and λ of 1 at a Reynolds number of 120,000.
Fig. 14. Effect of varying Reynolds number on the maximum lift coefficient, CLmax , for flat-plate wings.
that with increasing Reynolds number, CLα tends to converge to-ward the theoretical lift curve slope [Eq. (1)]. Also, for wings with a taper ratio of 1, the CLα of wings with an aspect ratio of 4 and 5 more closely agrees with the Helmbold equation; whereas, wings
Fig. 15. Effect of varying aspect ratio on the maximum lift coefficient, CLmax , at different Reynolds numbers for wings with taper ratios of (a) 0.5, (b) 0.75, and (c) 1.
Fig. 16. Effect of varying taper ratio on the maximum lift coefficient, CLmax , at different Reynolds numbers for wings with aspect ratios of (a) 2, (b) 3, and (c) 4.
with aspect ratios of 2 and 3 closely agree with the theoretical lift curve slope. The trend of the data relative to the Helmbold equa-tion is increasing lift with lower aspect ratio. It is speculated that this may be a result of vortex lift such as that observed on delta wings; however, in this experiment no supporting data was taken to validate this hypothesis. It is worth mentioning that at an aspect ratio of 2 the measured and theoretical lift curve slope matches the lift curve slope from slender wing theory [13], where
CLα = π
2A (3)
Finally, no discernible trends were observed in CLα as a function of taper ratio.
3.4. Moment curve and aerodynamic center
The moment curve results for all wings tested suggest that al-though the moment coefficient, CMc/4 , lies close to zero for low an-gles of attack [see Figs. 7(b), 8(b), and 9(b)], there exists a variance in CMc/4 as a function of angle of attack. The variance observed in CMc/4 can be interpreted in terms of the movement of the aerody-
402 G.K. Ananda et al. / Aerospace Science and Technology 42 (2015) 392–406
Fig. 17. Effect of Reynolds number on the lift curve slope, CLα , for flat-plate wings.
namic center. The location of the aerodynamic center, x̄ac , at each angle of attack is calculated using
x̄ac = − CMα
CLα
+ 0.25 (4)
where x̄ac refers to the location of the aerodynamic center as a fraction of the mean aerodynamic chord. The location is taken with respect to the leading edge of the mean aerodynamic chord of the wing.
Figs. 19(a–d) present x̄ac as a function of angle of attack for different aspect ratio wings with a taper ratio of 1 at a Reynolds number of 100,000. Results are presented between the angles of attack of zero and the stall angle of attack, αCLmax
, of each wing. For all cases, it can be observed that at low angles of attack, x̄aclies close to the quarter-chord location of the wing. The movement of x̄ac at these low angles of attack is small but still significant
Fig. 18. Effect of aspect ratio on the lift curve slope, CLα , at different Reynolds numbers for wings with taper ratios of (a) 0.5, (b) 0.75, and (c) 1.
as x̄ac varies from approximately 0.20 to 0.27. In addition, there exists a hump or narrow angle of attack range for which the x̄ac is further aft. This angle of attack range seems to be associated with the angle of attack range for which maximum CL/C D occurs (see Fig. 10). At higher of angles of attack (past the hump), however, the aerodynamic center shifts markedly towards the trailing edge of the wing to an x̄ac of close to 0.5 until the CLmax of the wing is reached.
3.5. Oswald’s efficiency factor
In an effort to compare the drag characteristics of the different flat-plate wings tested, a parabolic drag polar fit was used, i.e.,
C D = C Dmin + CL2
πe0A(5)
where C Dmin is the minimum drag term and e0 is Oswald’s effi-ciency factor, which can be expressed as
e0 = 1
1 + δ + kπA(6)
Oswald’s efficiency factor accounts for the increase in the pro-file drag of the airfoil (k term) and the induced drag of the wing [(1 + δ) term] with increasing lift. The k term is the approximate relation between the profile drag of the airfoil (Cd) to Cl
2. The (1 + δ) term relates to the lift distribution over the wing where a δ of zero represents a wing with an ideal elliptical lift distribution.
The ( 1πe0A
) term from Eq. (5) was extracted from wind tun-nel measurements for each flat-plate wing and Reynolds num-ber by taking the linear fit of the C D versus CL
2 curve in the pre-stall region. An appropriate CL range had to be selected to

G.K. Ananda et al. / Aerospace Science and Technology 42 (2015) 392–406 403
Fig. 19. Movement of the aerodynamic center, x̄ac , for wings with a λ of 1 and aspect ratios of (a) 2, (b) 3, (c) 4, and (d) 5 at a Reynolds number of 100,000.
Fig. 20. Effect of varying CL2 on the drag coefficient, C D , with linear fits for a flat-plate wing with an A of 3 and λ of 1 using a CL range of (a) 0 to 0.4, (b) 0 to 0.5, and
(c) 0 to 0.6.
perform the linear fit. Three lift coefficient ranges were exam-ined: CL = 0 to 0.4, CL = 0 to 0.5, and CL = 0 to 0.6. Figs. 20(a–c) present C D versus CL
2 results and their corresponding linear fits for the three ranges on the benchmark flat-plate wing (A = 3, λ = 1) at a Reynolds number of 120,000. In addition, from regres-sion analysis, the coefficient of determination (R-squared value) for the three ranges was found to be 0.952, 0.975, and 0.966 respec-tively. The CL range of 0 to 0.5 was chosen because the coefficient of determination was the largest, and the linear fit agreed well with the data [see Fig. 20(b)]. The linear fit provided the coeffi-cient for the CL
2 term of Eq. (5). Together with C Dmin , a parabolic fit for the drag polars was created for all wings and Reynolds numbers tested. As shown in Figs. 21(a–c), the pre-stall drag po-lars for the models matched well with the parabolic fits from
Eq. (5). Oswald’s efficiency factor was calculated from each ( 1πe0A
)
term.Fig. 22 presents e0 as a function of Reynolds number. From
Fig. 22, it is evident that there exist a large variation in e0 for flat-plate wings at low Reynolds numbers. The large variation in e0 represents a significant departure from the commonly recom-mended values of approximately 0.6–0.9 from literature [26,40]. The atypical e0 values observed have been also noted and dis-cussed by Spedding and McArthur [49]. The general trend ex-hibited in Fig. 22 is that e0 increases with increasing Reynolds number. As discussed prior, Oswald’s efficiency factor is the quan-tification of the rate of drag rise of a specific wing with lift. In addition, as alluded to in Ref. [49], the rate of drag rise is related to the degree of separation that exists on the wing (whether it

404 G.K. Ananda et al. / Aerospace Science and Technology 42 (2015) 392–406
Fig. 21. Effect of varying lift coefficient, CL , on the drag coefficient, C D , with parabolic fits for flat-plate wings at a Reynolds number of 120,000 for wings having the following geometric characteristics: (a) A= 2, λ = 0.5, (b) A= 3, λ = 1, and (c) A= 4, λ = 0.75.
Fig. 22. Effect of varying Reynolds number on Oswald’s efficiency factor, e0, for flat-plate wings.
be from a separation bubble or separation forward of the trailing edge). Therefore, the trends exhibited in Fig. 22 can be explained in terms of a decrease in the degree of separation on the wing with increasing Reynolds number.
The e0 results are also presented in Figs. 23(a–c) as a function of aspect ratio at varying Reynolds numbers. Each case represents a different taper ratio. There exists a highly sensitive relationship between e0 and aspect ratio where at low aspect ratios, e0 val-ues obtained (∼0.6–0.8) closely match that discussed in literature; whereas, with increasing aspect ratio, e0 values as low as approxi-mately 0.33 are seen. Similar to the effects observed with Reynolds number, e0 increases with decreasing aspect ratio as the degree of separated flow is attenuated by the strengthening wing tip vortex structures of lower aspect ratio wings.
Fig. 23. Effect of varying aspect ratio on Oswald’s efficiency factor, e0, at different Reynolds numbers for wings with taper ratios of (a) 0.5, (b) 0.75, and (c) 1.
The e0 trends observed are further aided by examining data from Pelletier and Mueller [35]. Flat-plate rectangular wing aero-dynamic measurements at a Reynolds number of 140,000 from Ref. [35] show e0 values of approximately 0.39, 0.34, and 0.22 for wings with an aspect ratio of 2, 3, and 6 respectively. Dis-crepancies in the e0 values to that presented in this paper could be attributed to test model differences, accuracy of data extrac-tion, and the fact that semi-span wings were tested in Ref. [35]. In addition, low aspect ratio rectangular flat-plate wing results from Torres and Mueller [50] between the Reynolds numbers of 70,000 and 100,000 showed e0 values of approximately 0.82, 0.57, and 0.38 for wings with an aspect ratio of 0.5, 1, and 2 respectively.
A jump in e0 with taper ratio is observed in Fig. 24(a) for wings with an aspect ratio of 2 from a taper ratio of 0.5 and 0.75 to a taper ratio of 1. The results give credence to the non-intuitive notion that wing tip vortices aid in reducing drag by limiting the dominant pressure drag of flat-plate wings since rectangular wings have higher strength wing tip vortices in comparison with tapered wings. No obvious change in e0 was observed in Figs. 24(b–c) as the effect of wing-tip vortices in delaying separation is minimized for higher aspect ratio wings.
4. Conclusions
An external platform force balance, the LRN-FB, was designed, fabricated, and assembled to address an area of research found to be lacking in the low Reynolds number aerodynamics regime. More specifically, from a literature review, it was found that a systematic study had not yet been performed on small-scaled UAV lifting sur-faces of low-to-moderate aspect ratio and varying taper ratio in the critical 70,000 to 200,000 low Reynolds number range. The LRN-FB was validated for low Reynolds number, low-to-moderate aspect ratio wings by data comparisons with historical data. As a bench-mark for the flat-plate wing wind tunnel results, data comparisons

G.K. Ananda et al. / Aerospace Science and Technology 42 (2015) 392–406 405
Fig. 24. Effect of varying taper ratio on Oswald’s efficiency factor, e0, at different Reynolds numbers for wings with aspect ratios of (a) 2, (b) 3, and (c) 4.
for a wing with an aspect ratio of 3 and taper ratio of 1 showed good agreement with lift, drag, and moment results of historical data at similar Reynolds numbers.
Ten low-to-moderate aspect ratio (A= 2, 3, 4, and 5) and vary-ing taper ratio (λ = 0.5, 0.75, and 1) flat-plate wings were tested at low Reynolds number (60,000 to 160,000). Wind tunnel results showed that for all flat-plate wings no hysteresis was observed. The stall angle of attack was taken as the angle of attack that cor-responded to the largest change in the moment coefficient. The corresponding CLmax values for all wings were found to lie be-tween 0.55 and 0.7. Interestingly, the CLmax results for the low-to-moderate aspect ratio wings tested were observed to be minimally sensitive to variations in aspect ratio in comparison with low as-pect ratio wing (A≤ 2) results from literature.
The lift curve slopes calculated for the wings matched trends found using the Helmbold equation and the theoretical lift curve slope for a finite wing of elliptical wing loading. In addition, the lift curve slope exhibited Reynolds number effects and was negligibly affected by taper ratio.
The location of the aerodynamic center with respect to the mean aerodynamic chord was calculated from the moment curve slope and lift curve slope of all rectangular wings tested. The re-sults showed that for flat-plate rectangular wings, the location of the aerodynamic center varied considerably with angle of attack. At low angles of attack, the aerodynamic center was located close to the quarter-chord location of the wing. In contrast, at high an-gles of attack approaching stall, the aerodynamic center shifted toward the trailing edge of the wing.
The key results from the wind tunnel tests performed relate to Oswald’s efficiency factors that were extracted from the measure-ments. Wind tunnel measurements showed large sensitivities in Oswald’s efficiency factor of flat-plate wings to aspect ratio vari-ations. Oswald’s efficiency factor was found to decrease with in-creasing aspect ratio from a value of approximately 0.81 for a wing with an aspect ratio of 2 and taper ratio of 1 down to a value of approximately 0.33 for a wing with an aspect ratio of 5 and taper ratio of 1.
Based on the aerodynamic performance trends observed for the flat-plate wings, no observable benefit was found for the use of tapered (λ = 0.5 and 0.75) low-to-moderate aspect ratio wings at low Reynolds numbers. However, aspect ratio was found to be the main driver with Reynolds number coming second in varying wing performance characteristics. Finally, future aerodynamic modeling of small-scale aircraft should account for the different Oswald’s efficiency factors associated with wings and tail surfaces at low Reynolds numbers.
Acknowledgements
The authors thank Agrim Sareen, Arjun H. Rao, Chinmay Sapre, Harshit Parolia, and Andrew Jang for their assistance in wind tun-nel testing. The authors would also like to thank Scott A. Mc-Donald, Greggory L. Bennett, and David L. Switzer from the UIUC Electrical and Computer Engineering (ECE) machine shop for their guidance and support in machining the low Reynolds number force balance (LRN-FB).
References
[1] K. Ailinger, Micro air vehicle (MAV) development at NRL, in: Association of Un-manned Vehicle Systems International Conference 1997, AUVSI ’97, Arlington, VA, 1997.
[2] R. Albertani, Experimental aerodynamics of elastic deformation characteriza-tion of low aspect ratio finite wings applied to micro air vehicles, Ph.D. thesis, Department of Mechanical and Aerospace Engineering, University of Florida, Gainesville, FL, 2005.
[3] R. Albertani, B. Stanford, J.P. Hubner, P.G. Ifju, Aerodynamic characterization and deformation measurements of a flexible wing micro air vehicle, Exp. Mech. 47 (5) (2007) 625–635.
[4] G.K. Ananda, Aerodynamic performance of low-to-moderate aspect ratio wings at low Reynolds numbers, Master’s thesis, Department of Aerospace Engineer-ing, University of Illinois at Urbana–Champaign, Urbana, IL, 2012.
[5] J.B. Barlow, W.H. Rae Jr., A. Pope, Low-Speed Wind Tunnel Testing, 3rd edition, John Wiley and Sons, New York, NY, 1999.
[6] W.G. Bastedo Jr., T.J. Mueller, Spanwise variation of laminar separation bubbles on wings at low Reynolds numbers, J. Aircr. 23 (9) (1986) 687–694.
[7] B.H. Carmichael, Low Reynolds number airfoil survey, NASA CR 165803, November 1981.
[8] H.W. Coleman, W.G. Steele Jr., Experimentation and Uncertainty Analysis for Engineers, John Wiley and Sons, New York, NY, 1989.
[9] P. Cosyn, J. Vierendeels, Numerical investigation of low-aspect-ratio wings at low Reynolds numbers, J. Aircr. 43 (3) (2006) 713–722.
[10] M. Drela, XFOIL: an analysis and design system for low Reynolds number air-foils, in: T.J. Mueller (Ed.), Low Reynolds Number Aerodynamics, in: Lecture Notes in Engineering, vol. 54, Springer-Verlag, New York, 1988, pp. 1–12.
[11] J.M. Grassmeyer, M.T. Keennon, Development of the black widow micro air ve-hicle, AIAA Paper 2001-0127, Reno, NV, January 2001.
[12] P.G. Ifju, D.A. Jenkins, S. Ettinger, Y. Lian, W. Shyy, M.R. Waszak, Flexible-wing-based micro air vehicles, AIAA Paper 2002-0705, Reno, NV, January 2002.
[13] R.T. Jones, Properties of low-aspect-ratio pointed wings at speeds below and above the speed of sound, NACA TR 135, 1946.
[14] S.M. Kaplan, A. Altman, M. Ol, Wake vorticity measurements for low aspect ratio wings at low Reynolds numbers, J. Aircr. 44 (1) (2007) 241–251.
[15] J.C. Kellogg, Case study: micro tactical expendable rigid-wing micro air vehi-cle, in: T.J. Mueller (Ed.), Introduction to the Design of Fixed-Wing Micro Air Vehicles, in: AIAA Educational Series, AIAA, Reston, VA, 2006, pp. 151–184.
[16] J.C. Kellogg, C. Bovais, J. Foch, R. Gardner, D. Gordon, R. Hartley, B. Kamgar-Parsi, H. McFarlene, F. Pipitone, R. Ramamurthy, R. Sciambi, W. Spears, D. Scrull, C. Sullivan, The NRL micro tactical expendable (MITE) air vehicle, Aeronaut. J. (2002) 431–441.
[17] S. Kline, F.A. McClintock, Describing uncertainty in single-sample experiments, Mech. Eng. 75 (1953) 3–8.
[18] E.V. Laitone, Wind tunnel tests of wings at Reynolds numbers below 70,000, Exp. Fluids 23 (5) (1997) 405–409.

406 G.K. Ananda et al. / Aerospace Science and Technology 42 (2015) 392–406
[19] S.S.W. Lam, A FORTRAN program for the calculation of the calibration co-efficient of a six-component strain gauge balance, Flight Mechanics Techni-cal Memorandum 410, Aeronautical Research Laboratory, Defence Science and Technology Organisation, Melbourne, Australia, 1989.
[20] J.E. Lamar, Extension of leading-edge suction analogy to wings with separated flow around the side edges at subsonic speeds, NASA TR R-428, L-9460, Octo-ber 1974.
[21] J.E. Lamar, Prediction of vortex flow characteristics of wings at subsonic and supersonic speeds, J. Aircr. 13 (7) (1976) 490–494.
[22] S.Y.F. Leung, Y.Y. Link, Comparison and analysis of strain gauge balance cal-ibration matrix mathematical models, DSTO 857, Aeronautical and Maritime Research Laboratory, Defence Science and Technology Organisation, Melbourne, Australia, 1999.
[23] Y. Lian, W. Shyy, Three dimensional fluid structure interactions of a membrane wing for MAV applications, AIAA Paper 2003-1726, Norfolk, VA, April 2003.
[24] S. Lupo, H. Nyberg, A. Karlsson, K. Mohseni, Xwing – a 3D viscous design tool for wings, AIAA Paper 2008-0173, Reno, NV, January 2008.
[25] C.A. Lyon, A.P. Broeren, P. Giguère, A. Gopalarathnam, M.S. Selig, Summary of Low-Speed Airfoil Data, vol. 3, SoarTech Publications, Virginia Beach, VA, 1997.
[26] B.W. McCormick, Aerodynamics, Aeronautics, and Flight Mechanics, 2nd edi-tion, John Wiley & Sons, New York, NY, 1995.
[27] M. Mizoguchi, H. Itoh, Effect of aspect ratio on aerodynamic characteristics at low Reynolds numbers, AIAA J. 51 (7) (2013) 1631–1639.
[28] J.-M. Moschetta, C. Thipyopas, Aerodynamic performance of a biplane micro air vehicle, J. Aircr. 44 (1) (2007) 291–299.
[29] T.J. Mueller, Aerodynamic measurements at low Reynolds numbers for fixed wing micro-air vehicles, RTO AVT/VKI special course, Rhode-St-Genèse, Bel-gium, 1999.
[30] T.J. Mueller, J.D. DeLaurier, Aerodynamics of small vehicles, Annu. Rev. Fluid Mech. 35 (2003) 89–111.
[31] W. Null, S. Shkarayev, Effects of camber on the aerodynamics of adaptive-wing micro air vehicles, J. Aircr. 42 (6) (2005) 1537–1542.
[32] W. Null, A. Noseck, S. Shkarayev, Effects of propulsive-induced flow on the aerodynamics of micro air vehicles, AIAA Paper 2005-4616, Toronto, Ontario, June 2005.
[33] M. Okamoto, A. Azuma, Aerodynamic characteristics at low Reynolds number for wings of various planforms, J. Aircr. 49 (6) (2011) 1135–1150.
[34] R.C. Pankhurst, D.W. Holder, Wind-Tunnel Technique, Pitman Publishing Corpo-ration, London, 1952.
[35] A. Pelletier, T.J. Mueller, Low Reynolds number aerodynamics of low-aspect-ratio thin/flat/cambered-plate wings, J. Aircr. 37 (5) (2000) 825–832.
[36] D.J. Pines, F. Bohorquez, Challenges facing future micro-air-vehicle develop-ment, J. Aircr. 43 (2) (2006) 290–305.
[37] E.C. Polhamus, A concept of the vortex lift of sharp-edge delta wings based on a leading-edge-suction analogy, NASA TN D-3767, December 1966.
[38] E.C. Polhamus, Predictions of vortex-lift characteristics by a leading-edge suc-tion analogy, J. Aircr. 8 (3) (1971) 713–722.
[39] M.A. Ramaswamy, T. Srinivas, V.S. Holla, A simple method for wind tunnel bal-ance calibration including non-linear interaction terms, IEEE Paper A88-36483 14-35, Williamsburg, VA, June 1987.
[40] J. Roskam, C.E. Lan, Airplane Aerodynamics and Performance, DAR Corporation, Lawrence, KS, 1997, p. 193.
[41] M.S. Selig, Low Reynolds number airfoil design, no. RTO/AVT-VKI-104, von Kar-man Institute for Fluid Dynamics (VKI) Lecture Series, 2003.
[42] M.S. Selig, B.D. McGranahan, Wind tunnel aerodynamic tests of six air-foils for use on small wind turbines, National Renewable Energy Laboratory, NREL/SR-500-35515, Golden, CO, 2004.
[43] M.S. Selig, J.F. Donovan, D.B. Fraser, Airfoils at Low Speeds, Soartech 8, SoarTech Publications, Virginia Beach, VA, 1989.
[44] M.S. Selig, J.J. Guglielmo, A.P. Broeren, P. Giguère, Summary of Low-Speed Air-foil Data, vol. 1, SoarTech Publications, Virginia Beach, VA, 1995.
[45] M.S. Selig, C.A. Lyon, P. Giguère, C.N. Ninham, J.J. Guglielmo, Summary of Low-Speed Airfoil Data, vol. 2, SoarTech Publications, Virginia Beach, VA, 1996.
[46] M. Shields, K. Mohseni, Experimental complications inherent to low Reynolds number wind tunnel testing, AIAA Paper 2011-0873, Orlando, FL, January 2011.
[47] M. Shields, K. Mohseni, Effects of sideslip on the aerodynamics of low-aspect-ratio low-Reynolds-number wings, AIAA J. 50 (1) (2012) 85–99.
[48] S. Shkarayev, J.-M. Moschetta, B. Bataille, Aerodynamic design of micro air ve-hicles for vertical flight, J. Aircr. 45 (5) (2008) 1715–1724.
[49] G.R. Spedding, J. McArthur, Span efficiencies of wings at low Reynolds numbers, J. Aircr. 47 (1) (2010) 120–128.
[50] G.E. Torres, T.J. Mueller, Aerodynamic characteristics of low aspect ratio wings at low Reynolds numbers, in: T.J. Mueller (Ed.), Fixed and Flapping Wing Aero-dynamics for Micro Air Vehicle Applications, in: Progress in Astronautics and Aeronautics, vol. 195, AIAA, Reston, VA, 2001, pp. 115–141.
[51] G.E. Torres, T.J. Mueller, Low-aspect-ratio wing aerodynamics at low Reynolds numbers, J. Aircr. 42 (5) (2004) 865–873.
Gavin K. Ananda is a graduate research assis-tant at the University of Illinois at Urbana–Champaign (UIUC). He received his M.S. in Aerospace Engineer-ing from UIUC in December 2012 and his B.S. in Aerospace and Mechanical Engineering from the Uni-versity of Arizona in 2008. He is currently working toward his Ph.D. in Aerospace Engineering at UIUC. Gavin is a member of the UIUC Applied Aerodynamics Research Group, and his research involves primarily
experimental work in the low Reynolds number regime and real-time flight simulation and modeling.
Pritam P. Sukumar is a Software Development En-gineer at Amazon.com, Inc. He obtained a M.S. in Aerospace Engineering in 2008 with a focus on dy-namic soaring and a M.S. in Computer Science in 2013 with a focus on Computer Vision.
Michael Selig (http :/ /m-selig .ae .illinois .edu/) is an Associate Professor of Aerospace Engineering at the University of Illinois at Urbana–Champaign and teaches courses in Applied Aerodynamics, Aircraft De-sign and Flight Mechanics. He is the leader of the UIUC Applied Aerodynamics Group and has published widely in the areas of low-speed aerodynamics, low Reynolds number aerodynamics, airfoil design, wind energy, wind tunnel testing and real-time flight sim-
ulation, including aircraft icing upset simulation and modeling. His codes and methods for airfoil design and wind turbine blade design are widely used. His airfoil designs and data are available in the open literature and used.