measured effects of elevated temperature on vine … · victor sadras, martin moran & paul...
TRANSCRIPT

Measured effects of elevated temperature on vine
phenology, yield, berry and wine attributes
Victor Sadras, Martin Moran & Paul Petrie South Australian R&D Institute, Treasury Wine Estates
Vintage 2030 - Melbourne, 19th June 2013
Funded by
Grape and Wine R&D Corporation
State NRM Program
Department of Agriculture, Fisheries and Forestry

Methods, data sources and reliability
Measured effects of elevated temperature on:
time of harvest
yield
berry traits
juice and wine attributes
Aims

Papers retrieved searching
“temperature” + “grapevine” (Web of Science)
Year
1920 1940 1960 1980 2000
Num
ber
of
public
ations
0
20
40
60
80
100
120
140
160
1940
1960
1980
2000
2020
Nu
mb
er
of
cita
tio
ns
0
350
700
1050
1400

Indirect methods
comparison between regions, vintages, row orientation…
large confounded effects
Direct methods
side-by-side experimental comparison of treatments
involving different temperatures
large to small confounded effects
Effect of temperature on vines and wines: indirect vs direct methods

Regional or seasonal comparisons
confound temperature with radiation,
humidity, etc (+ soil, + management)
Indirect methods cannot prove cause
and effect
Regional classification as a function
of temperature is ok for marketing but
is an oversimplification
Sadras & Petrie 2011 Austr J Grape Wine Res 17, 199
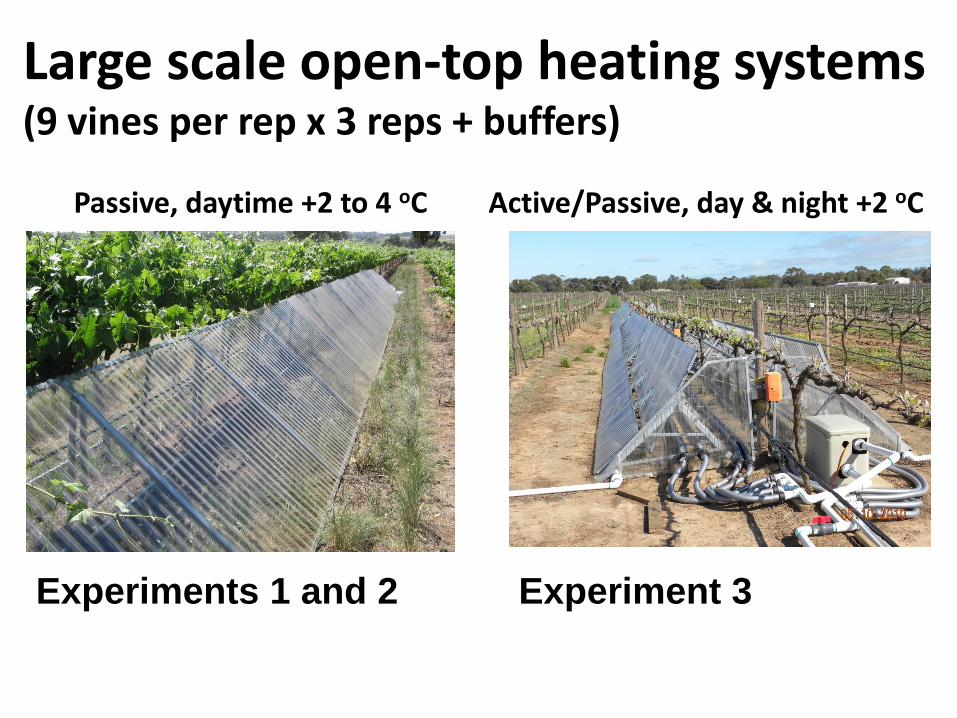
Large scale open-top heating systems (9 vines per rep x 3 reps + buffers)
Passive, daytime +2 to 4 oC Active/Passive, day & night +2 oC
Experiments 1 and 2 Experiment 3

Spring
1/10/10 10/10/10 19/10/10 28/10/10
0
1
2
3
4control
heated
1/1/11 10/1/11 19/1/11 28/1/11
0
2
4
6
8
10
1/3/11 10/3/11 19/3/11 28/3/11
Va
po
r pre
ssu
re d
efic
it (kP
a)
0
1
2
3
4
Date
1/6/11 10/6/11 19/6/11 28/6/11
0.0
0.5
1.0
1.5
1/10/10 10/10/10 19/10/10 28/10/10
0
10
20
30
Summer
1/1/11 10/1/11 19/1/11 28/1/11
10
20
30
40
Autumn
1/3/11 10/3/11 19/3/11 28/3/11
Te
mp
era
ture
(ºC
)
10
20
30
Winter
1/6/11 10/6/11 19/6/11 28/6/11
0
10
20
1. Reproduces the daily and seasonal cycles of temperature and vapour pressure deficit.
2. Does not increase relative humidity, hence allowing for increased vapour pressure deficit.
3. Minimises biologically important secondary effects.
4. Has structural strength to withstand the weather (particularly wind) to ensure a reasonable longevity.
5. Allows for number and size of replicates required for statistical resolution and viticultural needs, including sufficient fruit for meaningful wine production.
Design Criteria

Probing for
experimental artefacts

0
5
10
15
20
25
0 50 100 150
Control
Heated
0
5
10
15
20
25
0 500 1000 1500 2000 Mali
c a
cid
(m
g g
fw
t-1)
Time after anthesis
(d)
Thermal time after anthesis
(oC d)
Sweetman et al (unpublished)

Days after anthesis
20 40 60 80 100 120
Liv
ing tis
sue (
%)
50
60
70
80
90
100
Thermal time after anthesis (oCd)
200 400 600 800 1000 1200 1400 1600
control
heated
Bondada et al 2013 Austr J Grape Wine Res 19: 97

Exp 1 2 temperatures (high, control) x 4 varieties x 3 seasons
Exp 2 (Shiraz) 2 temperatures x 2 fruit loads (thinned, control) x 2 seasons
Exp 3 (Shiraz) 2 temperatures x 2 water regimes (irrigated, deficit) x 2 seasons
Experiments

experiments explored a good range of Barossa seasonal variation
Month
SEP OCT NOV DEC JAN FEB MAR
Tem
pera
ture
(oC
)
10
15
20
25
30
352009
2010
2011
2012
10th
90th

Traits
Phenology Yield and components Pruning weight and components Starch reserves in trunk and roots Stomatal conductance, density and size Photosynthesis Leaf chlorophyll Pre-dawn and mid-day leaf water potential Canopy and bunch temperature Sap flow Berry: dynamics of TA, pH, TSS and anthocyanins Berry progression of cell death Sensory traits in berries and wines

20
Time (d)
Phenolo
gic
al sta
ge
heated
controlT
em
pera
ture
effect (h
eate
d -
contr
ol)
Phenological stage in control
divergent parallel convergent
divergent parallel convergent

Developmental stage in control (oBrix)
0 10 20 30
Tem
pera
ture
eff
ect
(oB
rix)
-2
0
2
4
6
7.6 ± 0.37
Shiraz, Exp. 1, irrigated 2010-11Shiraz, Exp. 1, deficit 2010-11Shiraz, Exp. 2, unthinned 2010-11Shiraz, Exp. 2, thinned 2010-11Cab Franc, Exp. 3 2010-11Chardonnay, Exp. 3 2010-11Semillon, Exp. 3 2010-11
Shiraz, Exp. 1, irrigated 2011-12Shiraz, Exp. 1, deficit 2011-12Shiraz, Exp. 2, unthinned 2011-12Shiraz, Exp. 2, thinned 2011-12Cab Franc, Exp. 3 2011-12Chardonnay, Exp. 3 2011-12Semillon, Exp. 3 2011-12Shiraz Exp. 3 2011-12
Shiraz, Exp. 3 2010-11
lag-phase to onsetof rapid sugar accumulation
active sugar accumulation in fruit
21
nonlinear thermal effect on grapevine phenology
Sadras & Moran 2013 Agric Forest Meteorol 173:107

Experiments Approx 3 d oC-1
Indirect methods 6.6 ± 0.92 d oC-1 (Petrie and Sadras 2008)
8 d oC-1 (Tomasi et al 2011)
9.8 ± 0.94 d oC-1 (Sadras and Petrie 2011)
smaller than expected effect of temperature on maturity (21.6 oBrix)
Sadras & Moran 2013 Agric Forest Meteorol 173:107

Traits
Phenology Yield and components Pruning weight and components Starch reserves in trunk and roots Stomatal conductance, density and size Photosynthesis Leaf chlorophyll Pre-dawn and mid-day leaf water potential Canopy and bunch temperature Sap flow Berry: dynamics of TA, pH, TSS and anthocyanins Berry progression of cell death Sensory traits in berries and wines

asymmetric effect of warming on yield 46% reduction to 177% increase
Yield control (kg per vine)
0 4 8 12
Yie
ld h
eate
d (
kg p
er
vin
e)
0
4
8
12
Cab Franc 2010
Cab Franc 2011
Cab Franc 2012
Chardonnay 2010
Chardonnay 2011
Chardonnay 2012
Semillon 2010
Semillon 2011
Semillon 2012
Shiraz 2010
Shiraz 2011
Shiraz 2012
Shiraz, thinned 2011
Shiraz, unthinned 2011
Shiraz, thinned 2012
Shiraz, unthinned 2012
Shiraz, irigated 2011
Shiraz, deficit 2011
Shiraz, irrigated 2012
Shiraz, deficit 2012
exp. 1
exp. 2
exp. 3
y= x
Sadras & Moran 2013 Agric Forest Meteorol 173:116

(a)
Temperature effect on bunch number (%)
-50 0 50 100
Tem
pera
ture
eff
ect
on
yie
ld (
%)
-100
-50
0
50
100
150
200
no temperature effect
significant interaction
significant temperature effect
r2 = 0.92
P < 0.0001
(b)
Temperature effect on berries per bunch (%)
-40 -20 0 20 40 60
Resid
uals
(%
)
-40
-20
0
20
40
r2 = 0.28
P = 0.01
(c)
Bunch number in control (vine-1
)
0 40 80 120
Tem
pera
ture
eff
ect
on
bu
nch
nu
mb
er
(%)
-40
0
40
80
120 r2 = 0.32
P = 0.03

(a) root
Starch concentration in control (%)
0 5 10 15 20 25
Sta
rch
con
cen
tration
in
heate
d (
%)
0
5
10
15
20
25 (b) trunk
0 5 10 15
0
5
10
15
P = 0.0005P = 0.32
y = xy = x
elevated temperature reduced starch concentration in trunk
Sadras & Moran 2013 Agric Forest Meteorol 173:116

Stomata lenght ( m)
0 10 20 30 40
Fre
qu
en
cy (
%)
0
10
20
30control (n = 1025)
heated (n = 886)
P < 0.0001
leaves formed under high temperature had larger stomata
Sadras et al. 2012 Agric Forest Meteorol 165:35

Traits
Phenology Yield and components Pruning weight and components Starch reserves in trunk and roots Stomatal conductance, density and size Photosynthesis Leaf chlorophyll Pre-dawn and mid-day leaf water potential Canopy and bunch temperature Sap flow Berry: dynamics of TA, pH, TSS and anthocyanins Berry progression of cell death Sensory traits in berries and wines
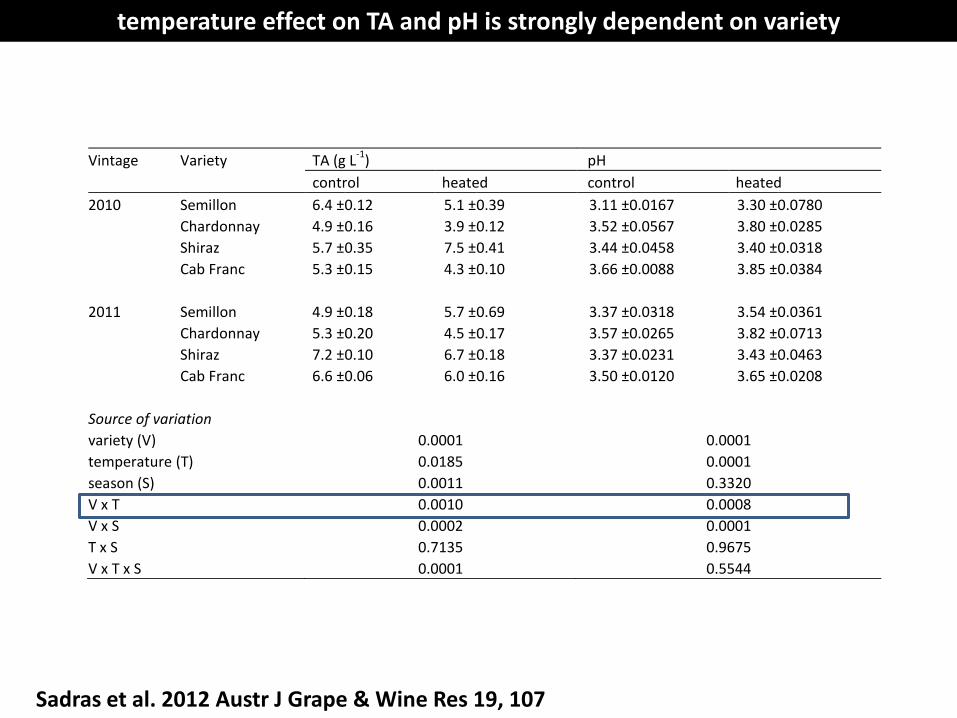
temperature effect on TA and pH is strongly dependent on variety
Vintage Variety TA (g L-1
) pH
control heated control heated
2010 Semillon 6.4 ± 0.12 5.1 ± 0.39 3.11 ± 0.0167 3.30 ± 0.0780
Chardonnay 4.9 ± 0.16 3.9 ± 0.12 3.52 ± 0.0567 3.80 ± 0.0285
Shiraz 5.7 ± 0.35 7.5 ± 0.41 3.44 ± 0.0458 3.40 ± 0.0318
Cab Franc 5.3 ± 0.15 4.3 ± 0.10 3.66 ± 0.0088 3.85 ± 0.0384
2011 Semillon 4.9 ± 0.18 5.7 ± 0.69 3.37 ± 0.0318 3.54 ± 0.0361
Chardonnay 5.3 ± 0.20 4.5 ± 0.17 3.57 ± 0.0265 3.82 ± 0.0713
Shiraz 7.2 ± 0.10 6.7 ± 0.18 3.37 ± 0.0231 3.43 ± 0.0463
Cab Franc 6.6 ± 0.06 6.0 ± 0.16 3.50 ± 0.0120 3.65 ± 0.0208
Source of variation variety (V) 0.0001 0.0001
temperature (T) 0.0185 0.0001
season (S) 0.0011 0.3320
V x T 0.0010 0.0008
V x S 0.0002 0.0001
T x S 0.7135 0.9675
V x T x S 0.0001 0.5544
Sadras et al. 2012 Austr J Grape & Wine Res 19, 107

Phenotypic plasticity allows for complex variety x environment interaction
Environment
Trai
t
high plasticity
low plasticity

text-book expected increase in pH and reduction in TA with high temperature is an oversimplification
5.0 5.5 6.0Tit
atr
ab
le a
cid
ity (
g L
-1)
3
6
9Cabernet Franc
Chardonnay
Titratable acidity environmental mean (g L-1
)
5.0 5.5 6.0
Semillon
Shiraz
Plastic Non-plastic
0.351.6b
0.212.9b
P < 0.0001
P < 0.001
b = 0
P = 0.72
b = 0
P = 0.82
(b)
(a)
Sadras et al. 2012 Austr J Grape & Wine Res 19, 107

Plastic Non-plastic
3.4 3.5 3.6 3.7
pH
3.0
3.2
3.4
3.6
3.8
4.0Cabernet Franc
Chardonnay
Semillon
0.511.4b
0.420.9b
0.281.7b
P < 0.0001
P < 0.06
P < 0.02
3.4 3.5 3.6
Shiraz
b = 0
P = 0.92
pH environmental mean
(c) (d)
text-book expected increase in pH and reduction in TA with high temperature is an oversimplification
Sadras et al. 2012 Austr J Grape & Wine Res 19, 107

trait decoupling
Thermal decoupling is the consequence of differential responses of related traits.
Sugars Anthocyanins pH TA Flavour compounds
Balanced fruit
Sugars Anthocyanins pH TA Flavour compounds
Decoupled fruit
temperature

elevated temperature decoupled anthocyanins and sugars in Shiraz and Cab franc
0 10 20 30
Anth
ocyanin
s (
mg g
-1)
0
1
2
3
Exp. 1, 2010
Exp. 1, 2011
Exp. 2, 2011
Exp. 3, 2011
n = 300
R2
= 0.88P < 0.0001
phase 1 phase 2
Total soluble solids (oBrix)
Sadras & Moran 2012 Austr J Grape & Wine Res 18, 115

elevated temperature decoupled anthocyanins and sugars
Total soluble solids (oBrix)
0 10 20 30
0
1
2
3
control
heated
n = 268
R2
= 0.76P < 0.0001
P < 0.0001
control heated
Re
sid
ua
ls (
mg
g-1
)
-0.10
-0.05
0.00
0.05
0.10
An
thocya
nin
s (
mg
g-1
)
Sadras & Moran 2012 Austr J Grape & Wine Res 18, 115

elevated temperature decoupled anthocyanins and sugars by delaying pigment development in a brix scale
Exp. 3, Shiraz
5 10 15 20 25
0.0
0.5
1.0
1.5
control
heated
An
tho
cyan
ins
(mg
/g)
TSS (oBrix)

water deficit partially restored the anthocyanin : sugar balance
Total soluble solids (oBrix)
10 15 20 25
An
toc
ya
nin
s (
mg
/g)
0.0
0.5
1.0
1.5
fully irrigated
water deficit
Sadras & Moran 2012 Austr J Grape & Wine Res 18, 115

temperature decoupled sensory berry traits
Cabernet Franc 2010 control
heated
berry colour
berry softness
berry stalk removal
pulp acidity
pulp detachment
pulp fruity aromas
pulp herbaceus aromas
pulp juiciness
pulp sweetnessseed
astringency
seed colour***
seed crushability*
seed flavours*
seed tannic intensity**
skin acidity
skin astringency
skin desintegration
skin
fruity aromas
skin
herebaceus
aromas
skin tannic
intensity
Sadras et al. 2012 Austr J Grape & Wine Res 19, 95

strong variety x season x temperature effect on wine sensory traits
Shiraz
berry
flora
l
ripe
flavo
urs
cook
ed fr
uit
Sc
ore
-1.0
-0.5
0.0
0.5
1.0
gree
n leaf
rich
mou
th fe
el
ripe
flavo
urs
-1.0
-0.5
0.0
0.5
1.0
Cabernet Franc
Wine attribute
gree
n leaf
light
er p
alat
e
tann
in stru
ctur
e
varie
tal c
hara
cter
-1.0
-0.5
0.0
0.5
1.0
Semillonmore intense trait in controls
more intense trait in heated treatment
no temperature effect
**
***
2010 vintage
*** *
Sadras et al. 2012 Austr J Grape & Wine Res 19, 107

Conclusions

In a warmer Barossa
Nonlinear effect on phenology
Smaller than expected effect on maturity (3 days per oC)
Asymmetric effect on yield mediated by bunch number 46% reduction to 177% increase
Apparent depletion of starch in trunks?
Larger, more open stomata; ↑ leaf transpiration and
photosynthesis per unit leaf area
Variety-dependent responses (pH, TA)
Decoupling of berry traits and wine attributes

Can we shift phenology and
restore berry and wine balance
with late pruning?
By Paul Petrie, this meeting

A window into hotter and drier futures:
phenological shifts and adaptive practices
Final Report to Grape and Wine
Research & Development Corporation
Project Number: SAR 0901
1 July 2009 – 30 June 2012
Victor Sadras, Martin Moran and Paul Petrie
December 2012
questions, comments, report: [email protected]
Thank you