measured enthalpy and derived thermodynamic properties of ...enthalpy and derived thermodynamic...
TRANSCRIPT
JOURNAL OF RESEARCH of the Notiona l Bureau of Standa rds-A. Physics and Chemist ry
Vol. 73A, No.5, September- October 1969
Measured Solid
Enthalpy and Derived Thermodynamic Properties of and Liquid Lithium Tetrafluoroberyllate,
from 273 to 900 K 1
Thomas B. Douglas and William H. Payne 2
Institute for Basic Standards, National Bureau of Standards, Washington, D.C. 20234
(May 20, 1969)
The enthalpy of a sam ple of lithium tetraAuoroberylla te, Li,BeF4 , of 98.6 perce nt purit y was ?,eas u. red re laLJ ve to 273 K a t eleven te mpe ratures from 323 to 873 K. Correc tions we re applied fo r the Im purI lies and fo r exte n ~ lv e premelting be low the me lti~ g point (745 K). The e nthalpy and heat ca pacity, a nd the e ntropy and GIbbs free-energy functIOn rela LJ ve to the unde termined value of 5,°98 15 ' we re computed from empiri ca l functIO ns of tem peratu re derived from the data and are tabuhie d from 273 to 900 K. '
Key words: Drop calorimetry; enthalpy data; lithium beryllium Auoride; lithium te traAuorobe ryllate; premeltmg; the rmodynamic properties.
1. Introduction
As part of a long-term research program at the National Bureau of S tandards on the thermodynamic properties of the simple r light-element compounds, the meas ure ments of high-temperature enthalpy have included several well-defin ed substances which may be regarded as doubl e oxides or double fluorides of
I two metals. S uch results have been published in two paper s for BeO · Ah03 (BeAh04) and BeO· 3Al20 3
(BeAlsO IO) [1] ,3 are being obtained for 3LiF· AIF3 (LiaAIF6 ), and are presente d in this paper for 2LiF · BeF2 r (Li2BeF4). The standard heats of formation and heat capacities of so me " double" compounds of this type are very nearly the same as the values calculated additively from the parent binary compounds (in the same state), but in other cases there are considerable differences.
The United States molten salt reactor program has , in recent years provided several notable demonstra
tions of feasible examples. In nearly any foreseeable thermal reac tor of this type , the solvent for the fi ssile and/or fe rtile material is an LiF-BeF2 mixture of composition near that of Li2BeF4 [2]. Accordingly, the thermodynamic properties of this compound are of great practical importance in thi s developing
y technology.
I Research sponsored by the Advanced Researc h P rojects Agency, U.S. De partment of Defense. under ARPA Order No. 20 , and by the Ai r Force O ffice of Scie ntific Researc h
_, Office of Aerospace Researc h, U.S. Air Force, unde r AFOSR Contract No. ISSA 68-0004~ 2 P resent address: Science Info rmat ion Exchange. 1730 M St. . N. W., Washington ,
D.C. 20036. 3 Figures in bracke ts indicate the li tera tu re references a t the end of thi s paper.
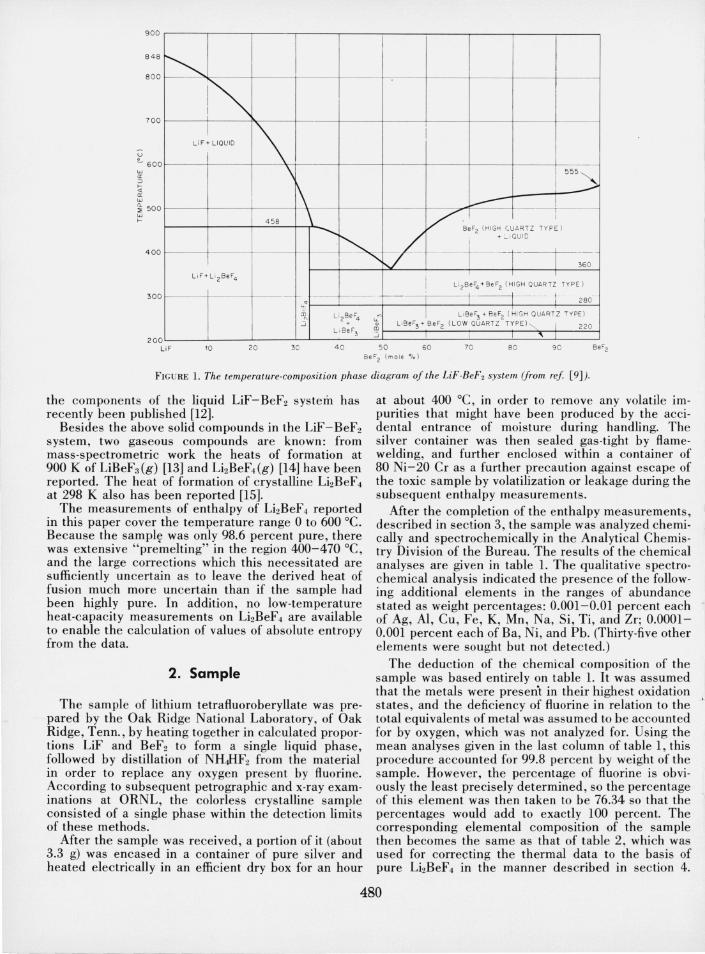
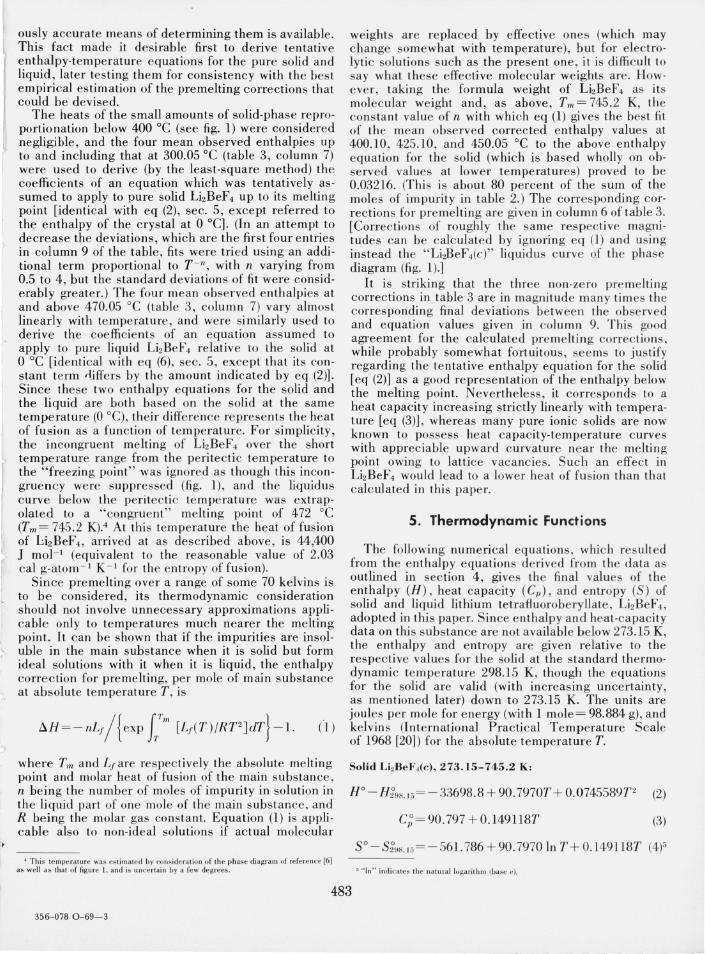
The temperature-composition phase diagram of the condensed phases of the LiF-BeF2 system has been investigated in a number of laboratories. The version in a fairly recent compilation of phase diagrams [3] is based on the results of two groups of workers [4, 5]. Another composite di agram [6] is based on the res ults of the above workers, as well as on those from two other publications [7 , 8] and additional work unpublished at that time. A more recent version of the phase diagram , which is in essential agreement with the two already mentioned , is reproduced here as fi gure 1; it is based largely on a comprehensive s tud y at th e Oak Ridge National Laboratory [9]. One group of workers [5] reported a compound LiF . 2BeF2 not found in other laboratories. There is general agreement , however , on the existence of the two solid compounds in the LiFBeF2 syste m indicated in fi gure 1. It will be noted that Li2BeF4 , the compound of interest in this paper, is not quite congruent-melting, showing a peritectic point. The liquid fi eld is continuous, but when it has the stoichiometric composition of LhBeF4 it may be regarded as the liquid phase of this compound.
Crystalline LhBeF4 exhibits an unusually small volume change when it melts (no more th an 2 or 3 percent [10]). This is attributed to the existence of two continuous void channels penetrating the unit cell of the crystal, an unusual feature revealed by a recent quantitative structure de termination [11]. A consequence of this feature is that the crys tal density of LhBeF4 is about 15 percent less than that computed additively from the two component bin ary fluorides. An inves tigation of the thermodynamic ac tivities of
479
~ I
~ I \ 1
LiF + LlQUID
i \
--
555 ""
1\ ---" ~
458 V BeF2 (HIGH CUART Z TYPE ) ..........
"" L ' + :"" I QU ID
-i--r- --......... J 360
900
848
8 00
700
u ~ 600
500
4 00
L i F+ Li 2BeF4
I Li 28 eF4 + BeF2 ( HIG H QUARTZ TYPE)
--r--~.
I --I 1 280 300
200 L iF 10 20 30
,;:" m~ Li2~e F4 .J
LiBe F3
4 0
I L IBe F3 + BeF2 ( HIG H QUARTZ TYPE) " ':; L, Se F3 + 8eF2 ( LOW QUARTZ TY PE) ", I 220 CD .J I "
50 60 70 80 90 oeF2 (mol e %)
FIG URE L The temperature-composition phase diagram of the LiF-BeF2 system (from ref [9])_
the components of the liquid LiF-BeF2 system has recently been published [12].
Besides the above solid compounds in the LiF - BeF2 system, two gaseous compounds are known: from mass-spectrometric work the heats of formation at 900 K of LiBeF3 (g) [13] and LizBeF4(g) [14] have been reported. The heat of formation of crystalline Li2BeF4
at 298 K also has been reported [15]. The measurements of enthalpy of Li2BeF4 reported
in this paper cover the temperature range 0 to 600°C. Because the sampl~ was only 98.6 percent pure, there was extensive "premelting" in the region 400-470 °C, and the large corrections which this necessitated are sufficiently uncertain as to leave the derived heat of fusion much more uncertain than if the sample had been highly pure. In addition, no low-temperature heat-capacity measurements on Li2BeF4 are available to enable the calculation of values of absolute entropy from the data.
2. Sample
The sample of lithium tetrafluoroberyllate was prepared by the Oak Ridge National Laboratory, of Oak Ridge, Tenn., by heating together in calculated proportions LiF and BeF2 to form a single liquid phase, followed by distillation of NHJIF2 from the material in order to replace any oxygen present by fluorine. According to subsequent petrographic and x-ray examinations at ORNL, the colorless crystalline sample consisted of a single phase within the detection limits of these methods.
After the sample was received, a portion of it (about 3.3 g) was encased in a container of pure silver and heated electrically in an efficient dry box for an hour
at about 400°C , in order to remove any volatile impurities that might have been produced by the accidental entrance of moisture during handling. The silver container was then sealed gas-tight by flamewelding, and further enclosed within a container of 80 Ni-20 Cr as a further precaution against escape of the toxic sample by volatilization or leakage during the subsequent enthalpy measurements.
After the completion of the enthalpy measurements, described in section 3, the sample was analyzed chemically and spectrochemically in the Analytical Chemistry Division of the Bureau. The results of the chemical analyses are given in table 1. The qualitative spectrochemical analysis indicated the presence of the following additional elements in the ranges of abundance stated as weight percentages: 0.001-0.01 percent each 1 of Ag, AI, Cu, Fe, K, Mn, Na, Si, Ti, and Zr; 0.0001-0.001 percent each of Ba, Ni, and Pb. (Thirty-five other elements were sought but not detected.)
The deduction of the chemical composition of the sample was based entirely on table 1. It was assumed r that the metals were presen·t in their highest oxidation . states, and the deficiency of fluorine in relation to the total equivalents of metal was assumed to be accounted for by oxygen, which was not analyzed for. Using the mean analyses given in the last column of table 1, this procedure accounted for 99.8 percent by weight of the sample. However, the percentage of fluorine is obviously the least precisely determined, so the percentage of this element was then taken to be 76.34 so that the percentages would add to exactly 100 percent. The corresponding elemental composition of the sample then becomes the same as that of table 2, which was used for correcting the thermal data to the basis of pure Li2BeF4 in the manner described in section 4.
480
TABLE 1. Chemical analysis of the sample
Element Individual analyses
Weight % Li a 13.87, a 13.85 Be 9.36, 9.33 F 76.42,75.90, 75.56, 75.91 Ca < 0.01 Mg 0.01 Cr < 0.01 Sr 0.02
a Uncorrected for Ca, Mg, Cr, and Sr.
Mean
Weight % b 13.85
9.34 75.95 0.005
.01
.005
.02
h This value includes a correction of - 0.01 percent to account for thp. Ca, Mg, Cr, and Sr.
TABLE 2. Assumed chemical composition of the sample
Relative Relative Substance No. of Substance No. of
moles moles
Li, BeF. 1 SrF, 0.0002 BeD 0.0269 CaF, .0001 BeF, .0121 CrF" .0001 MgF, .0004
3. Enthalpy'Measurements
The enthalpy measurements were made using the > "drop" method, which, as used in this laboratory, is
described in detail in a recent publication [16]. Briefly, the method is as follows. The sample in its container is suspended inside a vertical thick-wall silver pipe in a furnace until it has had time to reach the temperature of the silver. It is then dropped into a Bunsen ice
Il calorimeter, which precisely measures the heat ;P' evolved by the sample and container in cooling to 0 °C ! (273.15 K). In order to account for the enthalpy change , of the container itself and the small amount of heat
lost from its surface during the drop, a separate measurement is made on the empty container at the same furnace temperature. In the present case the measurements with and without the sample present
'> employed the same outer (80 Ni-20 Cr) container, but 1~ utilized different though entirely comparable inner
containers of pure silver having identical masses. For the present measurements the furnace tempera-
l ture was measured by two Pt/Pt-lO percent Rh thermocouples (as a precaution against any sudden shifts in the differences between their readings, which did not occur). One of these thermocouples was calibrated before the enthalpy measurements by the NBS Pyrometry Laboratory, and it agreed with another similarly calibrated thermocouple when the two were compared in the furnace.
The heats observed in individual measurements are listed (in joules) in table 3 (columns 3 and 4). These
" values are for the actual sample and container used, except that corrections have been applied for very small unavoidable departures from the "standard"
masses of parts of the container system, but not for impurities or premelting. For each furnace temperature the values are given in chronological order , although the different furnace temperatures were run in somewhat random order. As always with this method, the times in the furnace adequate for reaching thermal equilibrium were predetermined from preliminary measurements at one temperature with deliberately inadequate times. The times actually used are shown in column 2 of table 3. As a further precaution, considerably different times for duplicate measurements at most of the temperatures were dpliberately chosen. A second precaution was to hold the sample for a few minutes at temperatures higher than the final ones, in the case of one measurement at 470.05 °C and one at 500.10 °C (see table 3), to hasten the slow process of fusion at these temperatures near the melting point. However, there is no correlation between columns 2 and 3 of the tabl~ that might suggest the appreciable lack of thermal equilibrium for any of the measurements.
The derivation of columns 5-9 of table 3 is discussed in the next section.
4. Treatment of the Data
The purpose of the present investigation was to determine thermodynamic properties (those derivable from enthalpy data) of pure Li2BeF4 , not the actual sample measured nor even an odd composition of the LiF-BeF2 system. It is convenient to correct the enthalpy data for the deviation of the sample composition from pure Li2 BeF4 in two steps, firstly for the impurities indicated by table 2 and secondly for the "premelting" of the Li2 BeF4 whic h they caused.
Figure 1 shows qualitatively the expected equilibrium behavior as the temperature is raised above 200°C. No polymorphic transition of pure Li2 BeF4 is indicated, but at the peritectic temperature it decomposes completely into a liquid richer in BeF2 and a small amount of LiF( c), and several degrees higher (when the highest liquidus curve is crossed) all solid has disappeared and the liquid has regained the composition LizBeF4. If the actual sample represented by table 2 behaved as LizBeF4 with a small proportion of additional BeF2 , it was completely solid at and below 300°C, but had successively increasing proportions of liquid at 400, 425, and 450°C, and may have been all liquid at 470°C. ,
After averaging the entries in column 3 of table 3 for each furnace temperature (column 1), subtracting the corresponding average for the empty container (column 4), and converting this net enthalpy to a molar basis (defining 1 mole as 1 gram-formula-weight of LizBeF4), the total correction listed in column 5 for the impurities given in table 2 was applied on the basis of replacing the impurities by the same mass of LizBeF4. The correction for BeO(c) was computed from accurate results obtained in this laboratory [17], that for BeF2 (c) was computed from results of drop calorimetry elsewhere [18], and that for the small amounts of the four additional fluorides was assumed
481
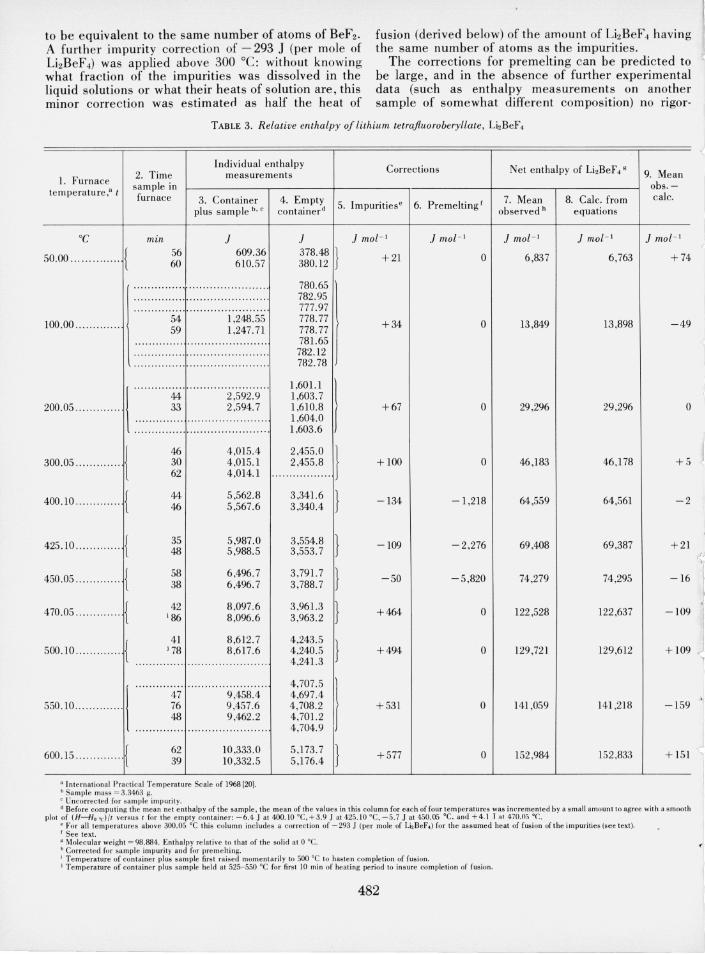
to be equivalent to the same number of atoms of BeF2 •
A further impurity correction of - 293 J (per mole of LbBeF4) was applied above 300°C: without knowing what fraction of the impurities was dissolved in the liquid solutions or what their heats of solution are , this minor correction was estimatecl as half the heat of
fusion (derived below) of the amount of Li2 BeF4 having the same number of atoms as the impurities.
The corrections for pre melting can be predicted to be large, and in the absence of further experimental data (such as enthalpy measurements on another sample of somewhat differe nt composition) no rigor·
TABLE 3. Relative enthalpy of lithium tetraf/uoroberyllate, Li,BeF4
Individual enthalpy
l. Furnace 2. Time measure ments sample in
temperature ," t furnace 3. Container plus sam pie b . c
°C mtn J
50.00 ..... . .... ... { 56 609.36 60 610.57
. . . . . . . . . . . . . . . ... ... ... .. ......... ...
. . . . . . . . . . . . . . . ..... ..... .... .. .. ......
...... .... ..... ... .. .. .... ..... ....... 100.00 ...... .. ..... 54 1,248.55
59 1,247.71 .. .. .. ........ ..... .. ................ .. ... ...... . . . . . . . . . . . . . . . . . . . . . . . . . . . ............... ................ ........
\ ..... .. .. .. ~ . ......... ....... ........ 2,592.9
200.05 ... ....... .... 2 ,594.7 ............ .. ............... ........ ..... ...... .... · . . . . . . . . . . . . . . . . . . . . . . .
300.05 .... .. ....... t 46 4,015.4 30 4,015.1 62 4,014.1
400 .1O ............. . { 44 5,562.8 46 5,567.6
425.10 .......... ... { 35 5,987 .0 48 5,988.5
450 .05 ...... .. ..... { 58 6,496.7 38 6,496 .7
470 .05 ..... ........ { 42 8 ,097.6 i86 8 ,096.6
500.10 ............. { 41 8 ,612.7
j 78 8 ,617.6 .............. · . . . . . . . . . . . . . . . . . . . . . . .............. · . . . . . . . . . . . . . . . . . . . . . .
47 9 ,458.4 550.10 ............ .. 76 9,457 .6
48 9,462.2 ...... ...... .. ........ ... .............
600.15 .... .. ........ { 62 10,333 .0 39 10,332. 5
:I Inte rn ational Practical Tempera ture Scale of 1968 {20]. h Sample mass = 3.3463 g. C Uncorrected for sample impurity.
4. Empty containerd
5.
J 378.48 } 380.12
780.65 782.95 777.97 778.77 778.77 781.65 782.12 782.78
1,601.1 1,603.7 1,610.8 1,604.0 1,603.6
..... ~:~.~~.:~ .. } 3,341.6 } 3,340.4
3,554.8 } 3,553.7
3,791.7 } 3,788.7
3,961.3 } 3,963.2
4,243.5 } 4,240.5
4,241.3
4,707.5 4,697.4 4,708.2 4,701.2 4,704.9
5,173.7 } 5,176.4
Corrections Net enthalpy of Li2BeF4 •
7. Mean 8. Calc. from Impurities· 6. Premelting f observed h equations
J mol - I J mol - I J mol - I J mol - I
+21 0 6,837 6 ,763
+ 34 0 13,849 13,898
+ 67 0 29 ,296 29 ,296
+ 100 0 46,183 46 ,178
- 134 - 1,218 64 ,559 64,561
-109 -2,276 69 ,408 69 ,387
-50 -5,820 74,279 74,295
+ 464 0 122 ,528 122 ,637
+494 0 129 ,721 129,612
+531 0 141 ,059 141 ,218
+ 577 0 152,984 152,833
9. Mean obs.-calc.
J mol - '
+ 74
-49
0
+5
- 2
+ 21
-16
-109
+ 109
-159
+ 151
d Before computing the mean ne t en thalpy of the sa mple. the mean of the values in thi s column for each of four temperatures was incremented by a s mall amount to agree with a s mooth plot of (H-flo "C)/t versus t for the empty container: - 6.4 J at 400.10 °C, + 3.9 J at 425.10 °C, -5.7 J at 4S0.05 0c. and + 4 .1 .I fir 470.0.~ or..
e For all temperatures above 300.05 °C this column includes a correc tion of - 293 J (per mole of Li2 BeF.t ) for the assumed heat of fusion of the impurities (see text). f See text. 1/ l\'lo1ecular weight = 98.884. Enthalpy re lative to that of the so lid a t O°C. h Corrected for sample impurity and for pre melting. I Temperature of container plus sample firs t ra ised momentaril y to 500 °C to hasten completion of fu sion. j Temperature of container plus sample held a t 525- 550 °C for first 10 min of heating period to ins ure comple tion of fusion.
482
, , ,
')
ously accurate means of determining them is available. This fact made it desirable first to derive tentative enthalpy· temperature equations for the pure solid and liquid, later testing the m for consistency with the best empirical es timation of the premelting corrections that could be devised.
The heats of the small amounts of solid-phase reproportionation below 400°C (see fig. 1) were considered negligible, and the four mean observed enthalpies up to and including that at 300.05 °C (table 3, column 7) were used to derive (by the least-square method) the coefficients of an equation which was tentatively assumed to apply to pure solid Li2BeF4 up to its melting point [identical with eq (2), sec. 5, except referred to the enthalpy of the crystal at 0 °C] . (In an attempt to decrease the deviations, which are the first four entries in column 9 of the table , fits were tri ed using an additional term proportional to T - II , with n varying from 0.5 to 4, but the standard deviations of fit were considerably greater.) The four mean observed e nthalpies at and above 470.05 °C (table 3, column 7) vary almost linearly with tempera ture, and were similarly used to derive the coe fficients of an equa tion assumed to apply to pure liquid Li2BeF4 relative to the solid at o °C [identical with eq (6), sec. 5 , except that its constant term rliffers by th e amount indicated by eq (2)]. Since these two e nthalpy equations for the solid and the liquid are both based on the solid at the same temperature (0 °C), their difference represents the heat of fusion as a function of te mperature. For simplicity , the incongruent melting of Li2 BeF4 over the short temperature range from the peritecti c temperature to the "freezing point" was ignored as though thi s incongruency were suppressed (fig. 1) , and the liquidus curve below the peritectic te mperature was extrapolated to a "congrue nt" melting point of 472 °C (Tm= 745.2 K).4 At thi s temperature the heat of fusion of LbBeF4 , arrived at as described above, is 44,400 J mol- 1 (equivalen t to the reasonable value of 2.03 cal g-ato m - 1 K - l for the entropy of fusion).
Since pre melting over a range of some 70 kelvins is to be considered, its thermodynamic consideration should not involve unnecessary approximations applicable only to temperatures much neare r the melting point. It can be shown that if the impurities are insoluble in the main substance when it is solid but form ideal solution s with it when it is liquid, the enthalpy correction for pre melting, per mole of main substance at absolute temperature T, is
/ { (Till } 6.H = -nLt exp Jr [Lt( T) jRPJdT - 1, (1 )
where Till and Lt are res pecti vely the absolute melting point and molar heat of fusion of the main substance, n being the number of moles of impurity in solution in the liquid part of one mole of the main substance, and R being the molar gas cons tant. Equation (1) is applicable also to non-ideal solutions if actual molecular
~ This tempe rature wa s es ti mated by co nsideration of th e phase diagram of reference [6] as well as that of figu re 1, and is ull ce rt a in by a few degrees.
weight are replaced by effective ones (which may change somewhat with temperature), but for electrolytic solutions such as the present one , it is difficult to say what these e ffective molecular weights are. However , taking the formula weight of Li2BeF4 as its molecular weight and , as above, T m = 745.2 K, the co ns tan t value of n with which eq (1) gives the bes t fit of the mean observed correc ted enthalpy values at 400.10, 425.10, a nd 450.05 °C to the above enthalpy equation for the solid (which is based wholly on obse rved values a t lower temperatures) proved to be 0.03216. (Thi s is about 80 percent of the sum of the moles of im purity in table 2.) The corresponding correc tions for premelting are given in column 6 of table 3. [Corrections of roughly the same respective magnitudes can be calculated by ignoring eq (1) and using instead the "Li~eF4(c)" liquidus curve of the phase diagram (fi g. 1).]
It is striking tha t the three non-zero premelting corrections in table 3 are in magnitude many tim es the corresponding final deviations between the observed and equation values given in column 9. This good agreement for the calculated premelting corrections, while probably somewhat fortuitous, seems to justify regarding the tentative enthalpy equation for the solid [eq (2)] as a good representation of the enthalpy below the melting point. Nevertheless, it corresponds to a heat capacity increasing strictly linearly with temperature [eq (3)], whereas many pure ionic solids are now known to possess heat capacity-temperature curves with appreciable upward curvature near the melting point owing to lattice vacancies. Such an effect in Li2BeF4 would lead to a lower heat of fusion than that calculated in thi s paper.
S. Thermodynamic Functions
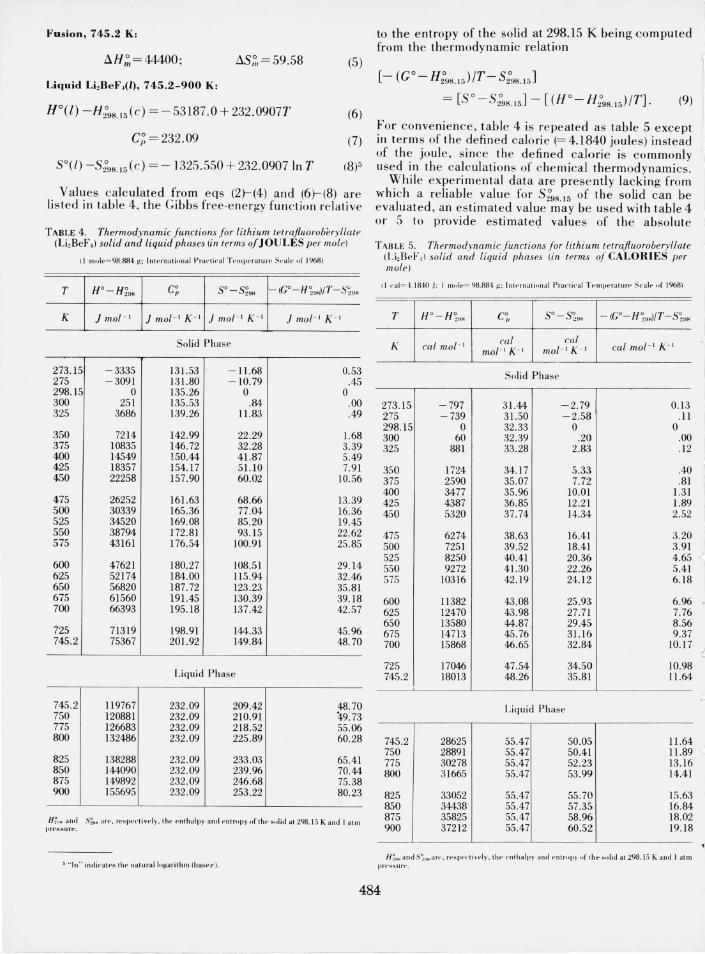
The following numerical equations, which resulted from the enthalpy equations derived from the data as outlined in section 4, gives the final values of the enthalpy (H ), heat capacity (Cp ), and e ntropy (5) of solid and liquid lithium tetrafluoroberyllate, Li2BeF4 ,
adopted in this paper. Since e nthalpy and heat-capacity data on this subs tance are not available below 273.15 K, the enthalpy and entropy are given relative to the respective values for t he solid at the standard thermodynamic temperature 298.15 K, though the equations for the solid are valid (with increasing uncertainty, as mentioned later) down to 273.15 K. The units are joules per mole for e nergy (with 1 mole= 98.884 g), and kelvi ns (Intern ational Practical Temperature Scale of 1968 [20]) for the absolute temperature T.
Solid Li2 BeF. (c), 273.15-745.2 K :
H O- H~!JH. 1 5= -33698.8 + 90. 7970T + 0.0745589T2 (2)
C; = 90.797+0 .149118T (3)
S° - 5~!rH. 15= - 561. 786 + 90.7970 In T + 0.149118T (4)5
r; " In " ind ica tes the nalura l logarilhm (base p).
483
356- 078 0 - 69- 3
Fusion, 745.2 K:
.:lH,~, = 44400; .:lS~,=59.58 (5)
Liquid Li2BeF,(i), 745.2-900 K:
H°(l) -H;98. 15(C) = - 53187.0 + 232.09071' (6)
C~ = 232.09 (7)
5°(l) -S;H8 15 (c) = - 1325.550 + 232.0907 In l' (8)5
Values calc ulated from eqs (2)-(4) and (6)-(8) are li s ted in table 4, the Gibbs free·energy function relative
TABLE 4. Thermodynamic functions for lithium tetrajluoroberyllate (Li,BeF,) solid and liquid phases (in terms of JOULES per mole)
II rnole= 98.884~; Inl ernaliunal Pra( ' li c al Temperature S\'a le of 1968)
T HO- H~!IK C~ SO-S~!lH - (Go-H~!I,JIT-.s~!lK
K J mol - I J mol- I K - I J mol- I K - I J mol- I K - I
Solid Phase
273.15 -3335 131.53 -11.68 0.53 275 -3091 131.80 -10.79 .45 298.15 0 135.26 0 0 300 251 135.53 .84 .00 325 3686 139.26 11.83 .49
350 7214 142.99 22.29 1.68 375 10835 146.72 32.28 3.39 400 14549 150.44 41.87 5.49 425 18357 154.17 51.10 7.91 450 22258 157.90 60.02 10.56
475 26252 161.63 68.66 13.39 500 30339 165.36 77.04 16.36 525 34520 169.08 85.20 19.45 550 38794 172 .81 93.15 22.62 575 43161 176.54 100.91 25 .85
600 47621 180.27 108.51 29.14 625 52174 184.00 115.94 32.46 650 56820 187.72 123.23 35.81 675 61560 191.45 130.39 39.18 700 66393 195.18 137.42 42.57
725 71319 198.91 144.33 45.96 745.2 75367 201.92 149.84 48.70
Liquid Phase
745.2 119767 232 .09 209.42 48.70 750 120881 232.09 210.91 49.73 775 126683 232.09 218.52 55.06 800 132486 232 .09 225.89 60.28
825 138288 232.09 233.03 65.41 850 144090 232.09 239.96 70.44 875 149892 232.09 246.68 75.38 900 155695 232.09 253.22 80.23
H~H>' autl S~ml <.lre . ft'SPt'{·livt'ly. lilt' t' lllhalpy and t'ntnlPY Ilftht' s \llid at 298. IS K and" aim press un:.
r. "'n" indi ('att' s tilt' l1 aturalln~arithm (base e).
to the entropy of the solid at 298.15 K being computed from the thermodynamic relation
[- (Go- H;98. 15)/1'-S:98.15)
= [S O-S;98.15] - [(HO- H;9815)/1']. (9)
For conven ience, table 4 is repeated as table 5 except in terms of the defined calo ri e (= 4.1840 joules) instead of the joule, s ince the defined calorie is co mmonly used in the calcula tions of che mical thermodynamics.
While experimental data are presently lacking from which a re liable value for 5;'98.15 of the solid can be evaluat ed, an es timated value may be used with table 4 or 5 to provide es timated values of the absolute
TABLE 5. Thermodynamic functions for lithium tetrajluoroberyllate (Li,BeF,\ solid and liquid phases (in terms of CALORIES per mole)
( I ('a l= 4. 1 840 .I : I Illlllt'= 98.884 /.!.: intt 'rnal i, .nal Pral.:li('al Tt'lllpt-'ralurt' Sealt' 1'£ 1968)
T HO - H~~H C~J SO -S~!lK - (Go-H~!I,J/T -S~!I"
cal mol- I ca l cu I ca l mol- I K- I K mol- I K- I mol- I K - I
Solid Phase
273. 15 -797 31.44 -2.79 0. 13 275 -739 31.50 -2.58 .11 298.15 0 32.33 0 0 300 60 32 .39 .20 .00 325 881 33.28 2.83 .12
350 1724 34. 17 5.33 .40 375 2590 35.07 7.72 .81 400 3477 35.96 10.01 1.31 425 4387 36.85 12.21 1.89 450 5320 37.74 14.34 2.52
475 6274 38.63 16.41 3.20 500 7251 39.52 18.41 3.91 525 8250 40.41 20.36 4.65 550 9272 41.30 22.26 5.41 575 10316 42.19 24.12 6.18
600 11382 43.08 25.93 6.96 625 12470 43.98 27.71 7.76 650 13580 44.87 . 29.45 8.56 675 14713 45.76 31.16 9.37 700 15868 46.65 32.84 10.17
725 17046 47.54 34.50 10.98 745.2 18013 48.26 35.81 11.64
Liquid Phase
745.2 28625 55.47 50.05 11.64 750 28891 55.47 50.41 11 .89 775 30278 55.47 52.23 13.16 800 31665 55.47 53.99 14.41
825 33052 55.47 55.70 15.63 850 34438 55.47 57.35 16.84 875 35825 55.47 58.96 18.02 900 372 12 55.47 60.52 19.18
H ~!I,,'HHIS~~ ... art ·. rt' ~ p(' (· li \, t'ly.llw t'll lha lpy and t'nlropy ufllu-' ~H lid a1298. IS K a nd I atm prt-' ~~urt· .
484
j
"
entropy and the Gibbs free-energy function. One compilation [19] has estimated for this constant 29.8
I ± 2 cal mol- t K- t (124.7±8J mol- t K- t) , taken as the sum of the entropies at this temperature of two moles of LiF( c) and one mole of BeFdc).
From a consideration of the sources of systematic error and the precision of the enthalpy values, the corrected heat capacities as given by eqs (3) and (7) and in tables 4 and 5 are estimated to have general un-
, certainties of ± 2 percent for the solid fro m 298 to 600 K and ± 3 percent for the liquid from 750 to 850 K. However, the error in the derived heat capacity may reach several percent near the lower end of the experi mental range (below 298 K)_ Between 600 and 750 K the large, rather uncertain corrections for premelting introduce additional uncertainties for the solid and the
, heat of fusion which are difficult to estimate, but no additional uncertainty for the enthalpy of the liquid as given by eq (6), and very little for the e ntropy of the liquid as given b y eq. (8).
I t~.
I )
The authors a re pleased to acknowledge the help of several persons. Roy E. Thoma and his associates at the Oak Ridge National Laboratory prepared the sample and made the petrographic and x-ray examinations of it. The s ample was a nalyzed in the Analytical Che mis try Division of the Bureau - che mically by Rolf A. Paulson and E. June Maienthal, and spectroc hemically by Elizabeth K. Hubbard.
6. References
[II Ditmars, D. A., 'and Douglas, T. B., ]. Research NBS 71A, 89, 97 (1967).
-, ..... _---- -----
[21 Thoma, R. E., private communication (April 21 , 1969), (3) Phase Diagrams for Ceramists, Levin, E. M., Robbin s, C. R .,
and McMurdie, H. F. , The American Ceramic Society, Columbus, Ohio, 1964, p. 420 (fig. 1469).
[4) Jones, L. V. , Etter, D. E. , Hudgens, C. R., Huffman , A. A., Rhinehammer, T. B., Rogers , N. E., Tucker, P. A., and Wittenberg, L. J., ]. Am. Ceram. Soc. 45, 80 (1962).
[51 Roy, D. M., Roy, R. , and Osborn, E. F., J . Am. Ceram. Soc. 37, 300 (1954).
[6] Phase Diagrams of Nuclear Reactor Materials, Thoma, R. E. , Ed., Report ORNL-2548 [TID- 4500 (15th ed.)), Oak Ridge National La horatory; Oak Ridge, Tenn., Nov. 20, 1959. p. 33.
[7) Novose lova, A. V. , Simanov , Yu. P ., and Yarembash , E. I., J . Phys. Chern . (U.S.S.R.) 26,1244 (1952).
[81 S pe irs, J. L. , "The Binary and Ternary Systems Formed by Calc ium Fluoride, Lithium Fluoride, and Beryllium Fluoride: P hase Diagrams and E lec trolytic Studies," Ph.D. thesis, Univ. of Michigan, Ann Arbor, Mich., May 29, 1952.
[91 Thoma, R. E., Insley, H., Fri edman, H. A., and Hebert , G. M., J. Nuclear Materials 27, 166 (1968).
[lOJ Sturm , B. ]. , and Thoma, R. E., Report ORN L-3789, Oa k Ridge National Laboratory, Oak Ridge, Te nn. 1965, p. 83.
[11] Burns, J. H. , and Gordon, E. K. , Acta Cryst. 20 , 135 (1966). [12] Mathews, A. L., and Baes, C. F., lnorg. Che rn . 7, 373 (1968). [13) Berkowitz, ]. , and Chupka, W. A., Ann. N.Y. Acad. Sci. 79,
1073 (1960). [14] Buchler, A., and Stauffer, J . L. , Sy mposium on Thermo·
dynamics, Paper SM- 66/26, Vienna, Austri a, 1965. [15) Gross, P., Admin. Report No.5 [Contract AF 61(052)-863 ,
1 Jan. 1966- 30 April 1966], Fulmer Research Inst. , Stoke P oges, Buckinghamshire, England.
r16] Experimental Thermodynamics, Vol. I , McCullough , .T. P ., and Scott , D. W., Ed. , Butterworths , London, 1968 (Ch. 8, " High· temperature Drop Calorimetry ," Douglas, T. B., and King, E. G., p. 293).
[171 Victor, A. c., and Douglas, T. B., J. Research NBS 67A, 325 (1963).
[18] Taylor , A. R., and Gardner , T . E. , U.S. Bur. Mines Rept. Invest. 6664 (1965).
[19) JANAF Ther mochemical Tables, Second Addendum (PB 168 370-2), Clearinghouse, U.S. Department of Commerce, Springfield , Va., Aug. 1967 (tables fo r crys talline and liquid Li2BeF., da ted Jun e 30 , 1966).
[201 International Prac tical Tempe rature Scale of 1968, Metrologia 5, 35 (1969).
(Paper 73A5-565)
485