measured thermal response of concrete box...
TRANSCRIPT
94 TRANSPORTATION RESEARCH RECORD 1460
Measured Thermal Response of Concrete Box-Girder Bridge
K. NAM SHIU AND HABIB TABATABAI
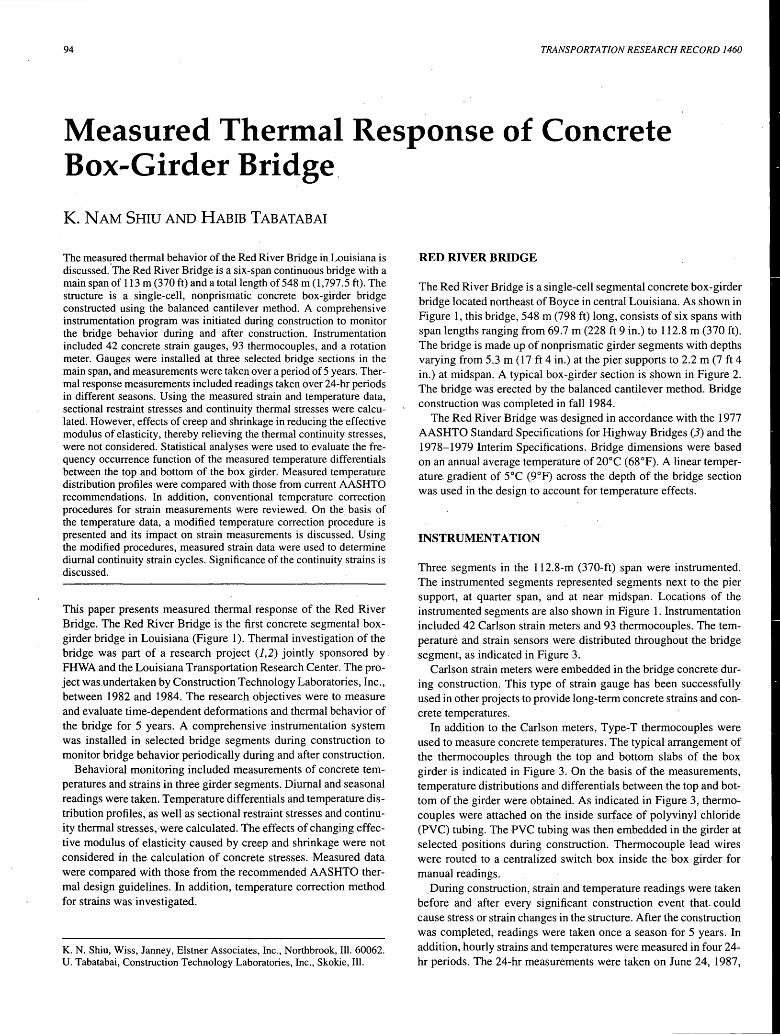
The measured thermal behavior of the Red River Bridge in Louisiana is discussed.' The Red River Bridge is a six-span continuous bridge with a main span of 113 m (370 ft) and a total length of 548 m (1,797.5 ft). The structure is a single-cell, nonprismatic concrete box-girder bridge constructed using the balanced cantilever method. A comprehensive instrumentation program was initiated during construction to monitor the bridge behavior during and after construction. Instrumentation included 42 concrete strain gauges, 93 thermocouples, and a rotation meter. Gauges were installed at three selected bridge sections in the main span, and measurements were taken over a period of 5 years. Thermal response measurements included readings taken over 24-hr periods in different seasons. Using the measured strain and temperature data, sectional restraint stresses and continuity thermal stresses were calculated. However, effects of creep and shrinkage in reducing the effective modulus of elasticity, thereby relieving the thermal continuity stresses, were not considered. Statistical analyses were used to evaluate the frequency occurrence function of the measured temperature differentials between the top and bottom of the box girder. Measured temperature distribution profiles were compared with those from current AASHTO recommendations. In addition, conventional temperature correction procedures for strain measurements were reviewed. On the. basis of the temperature data, a modified temperature correction procedure is presented and its impact on strain measurements is discussed. Using the modified procedures, measured strain data were used to determine diurnal continuity strain cycles. Significance of the continuity strains is discussed.
This paper presents measured thermal response of the Red River Bridge. The Red River Bridge is the first concrete segmental boxgirder bridge in Louisiana (Figure 1). Thermal investigation of the bridge was part of a research project (J,2) jointly sponsored by FHWA and the Louisiana Transportation Research Center. The project was.undertaken by Construction Technology Laboratories, Inc., between 1982 and 1984. The research objectives were to measure and evaluate time-dependent deformations and thermal behavior of the bridge for 5 years. A comprehensive instrumentation system was installed in selected bridge segments during construction to monitor bridge behavior periodically during and after construction.
Behavioral monitoring included measurements of concrete temperatures and strains in three girder segments. Diurnal and seasonal readings were taken. Temperature differentials and temperature distribution profiles, as well as sectional restraint stresses and continuity thermal stresses,-were calculated. The effects of changing effective modulus of elasticity caused by creep and shrinkage were not considered in the calculation of concrete stresses. Measured data were compared with those from the recommended AASHTO thermal design guidelines. In addition, temperature correction method for strains was investigated.
K. N. Shiu, Wiss, Janney, Elstner Associates, Inc., Northbrook, Ill. 60062. U. Tabatabai, Construction Technology Laboratories, Inc., Skokie, Ill.
RED RIVER BRIDGE
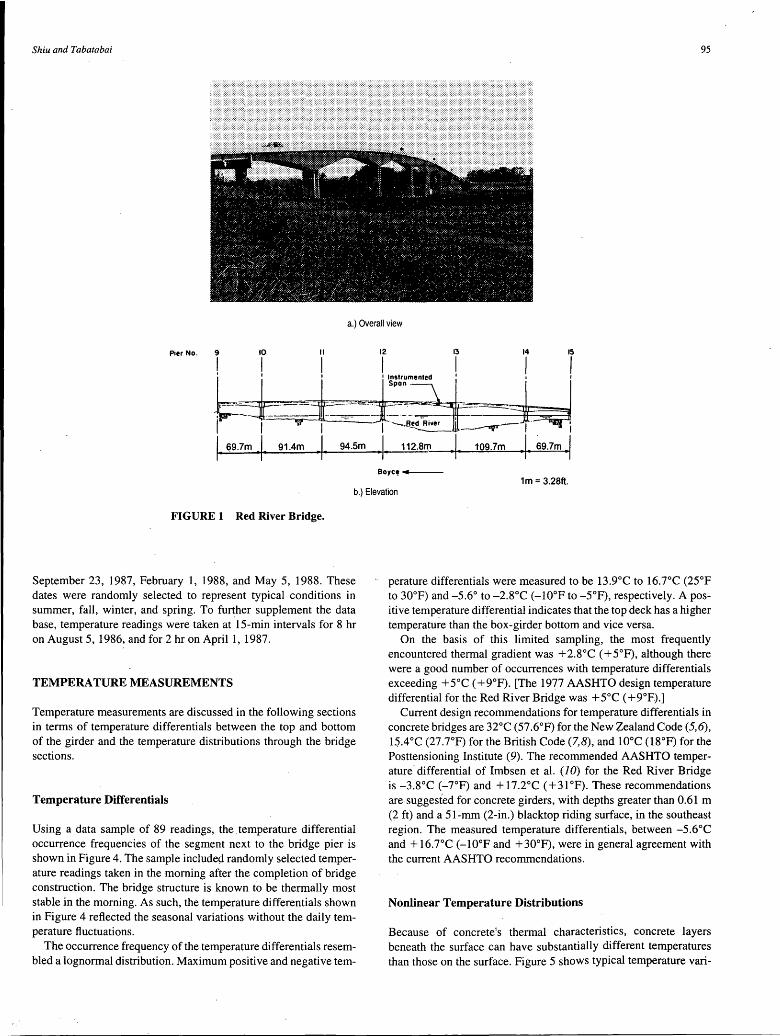
The Red River Bridge is a single-cell segmental concrete box-girder bridge located northeast of Boyce in central Louisiana. As shown in Figure 1, this bridge, 548 m (798 ft) long, consists of six spans with span lengths ranging from 69.7 m (228 ft 9 in.) to 112.8 m (370 ft). The bridge is made up of nonprismatic girder segments with depths varying from 5.3 m (17 ft 4 in.) at the pier supports to 2.2 m (7 ft 4 in.) at midspan. A typical box-girder section is shown in Figure 2. The bridge was erected by the balanced cantilever method. Bridge construction was completed in fall 1984.
The Red River Bridge was designed in accordance with the 1977 AASHTO Standard Specifications for Highway Bridges (3) and the 1978-1979 Interim Specifications. Bridge dimensions were based on an annual average temperature of 20°C (68°F). A linear temperature. gradient of 5°C (9°F) across the depth of the bridge section was used in the design to account for temperature effects.
INSTRUMENTATION
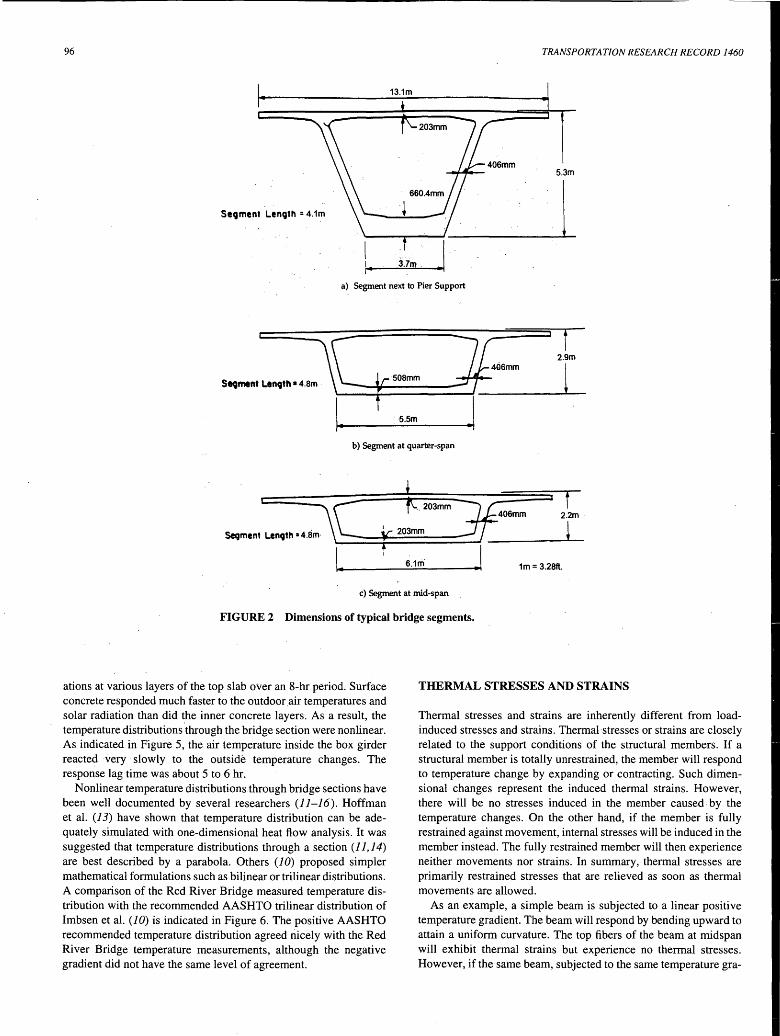
Three segments in the 112.8-m (370-ft) span were instrumented. The instrumented segments represented segments next to the pier support, at quarter span, and at near midspan. Locations of the instrumented segments are also shown in Figure 1. Instrumentation included 42 Carlson strain meters and 93 thermocouples. The temperature and strain sensors were distributed throughout the bridge segment, as indicated in Figure 3.
Carlson strain meters were embedded in the bridge concrete during construction. This type of strain gauge has been successfully used in other projects to provide long-term concrete strains and concrete temperatures.
In addition to the Carlson meters, Type-T thermocouples were used to measure concrete temperatures. The typical arrangement of the thermocouples through the top and bottom slabs of the box girder is indicated in Figure 3. On the basis of the measurements, temperature distributions and differentials between the top and bottom of the girder were obtained. As indicated in Figure 3, thermocouples were attached on the inside surface of polyvinyl chloride (PVC) tubing. The PVC tubing was then embedded in the girder at selected positions during construction. Thermocouple lead wires were routed to a centralized switch box inside the box girder for manual readings.
. During construction, strain and temperature readings were taken before and after every significant construction event that. could cause stress or strain changes in the structure. After the construction was completed, readings were taken once a season for 5 years. In addition, hourly strains and temperatures were measured in four 24-hr periods. The 24-hr measurements were taken on June 24, 1987,
Shiu and Tabatabai 95
a.) Overall view
Pier No. 9 10 II 12 13 14 15
I I I I I I I
b' 1 1 1 Instrumented 1 1 1
. ~±-=-~~;t;~=~5tJ I I *lf' I l~-..B_e~-~I i I 69.?m I 91.4m I 94.Sm ,, 112.Sm I 109.?m .j G9.7m .j
Boyc~-4----
1m = 3.28ft. b.) Elevation
FIGURE 1 Red River Bridge.
September 23, 1987, February 1, 1988, and May S, 1988. These dates were randomly selected to represent typical conditions in summer, fall, winter, and spring. To further supplement the data base, temperature readings were taken at lS-min intervals for 8 hr on August S, 1986, and for 2 hr on April 1, 1987.
TEMPERATURE MEASUREMENTS
Temperature measurements are discussed in the following sections in terms of temperature differentials between the top and bottom of the girder and the temperature distributions through the bridge sections.
Temperature Differentials
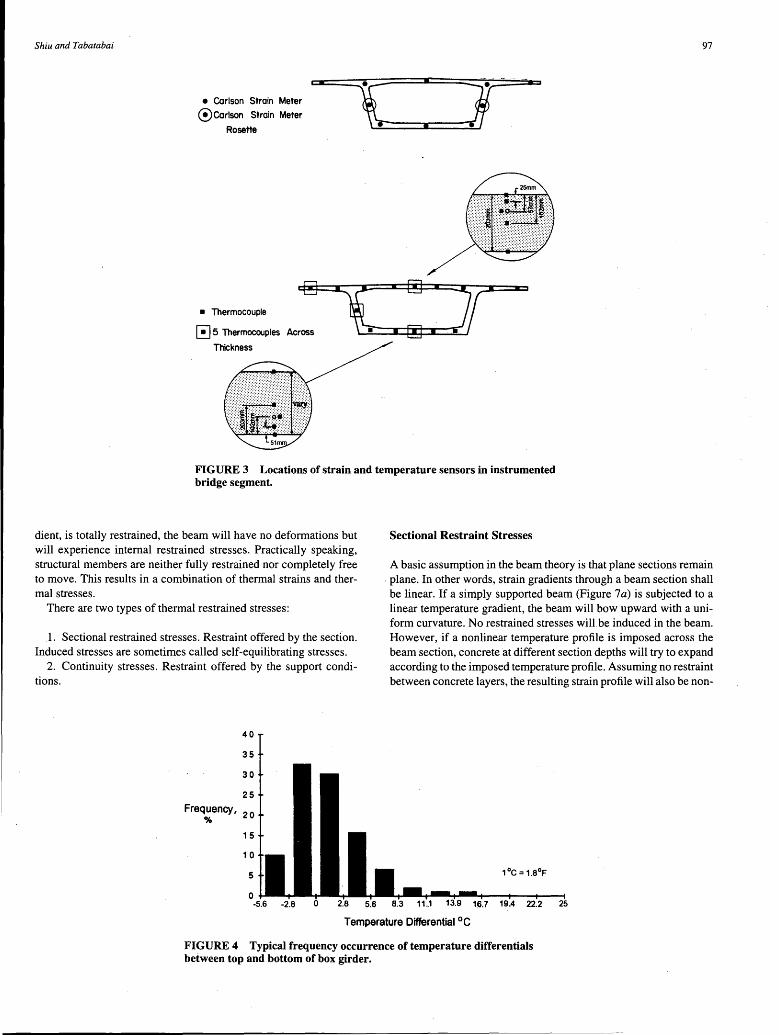
Using a data sample of 89 readings, the. temperature differential occurrence frequencies of the segment next to the bridge pier is shown in Figure 4. The sample included randomly selected temperature readings taken in the morning after the completion of bridge construction. The bridge structure is known to be thermally most stable in the morning. As such, the temperature differentials shown in Figure 4 reflected the seasonal variations without the daily temperature fluctuations.
The occurrence frequency of the temperature differentials resembled a lognormal distribution. Maximum positive and negative tern-
perature differentials were measured to be 13.9°C to 16.7°C (2S°F to 30°F) and-S.6° to -2.8°C (-10°F to -S°F), respectively. A positive temperature differential indicates that the top deck has a higher temperature than the box-girder bottom and vice versa.
On the basis of this limited sampling, the most frequently encountered thermal gradient was +2.8°C ( + S°F), although there were a good number of occurrences with temperature differentials exceeding +S°C ( +9°F). [The 1977 AASHTO design temperature differential for the Red River Bridge was +S°C ( +9°F).]
Current design recommendations for temperature differentials in concrete bridges are 32°C (S7.6°F) for the New Zealand Code (5,6), 15.4°C (27.7°F) for the British Code (7,8), and 10°C (l8°F) for the Posttensioning Institute (9). The recommended AASHTO temperature· differential of Imbsen et al. (10) for the Red River Bridge is -3.8°C (-7°F) and +17.2°C (+31°F). These recommendations are suggested for concrete girders, with depths greater than 0.61 m (2 ft) and a Sl-mm (2-in.) blacktop riding surface, in the southeast region. The measured temperature differentials, between -S.6°C and+ 16.7°C (-10°F and +30°F), were in general agreement with the current AASHTO recommendations.
Nonlinear Temperature Distributions
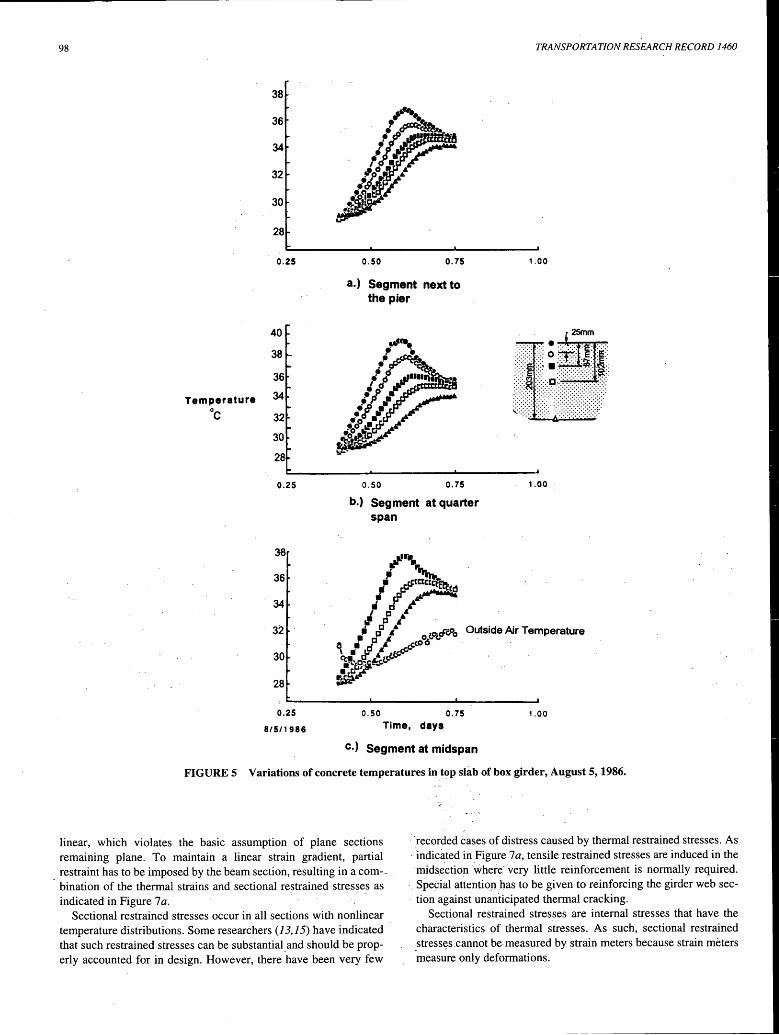
Because of concrete's thermal characteristics, concrete layers beneath the surface can have substantially different temperatures than those on the surface. Figure S shows typical temperature vari-
96 TRANSPORTATION RESEARCH RECORD 1460
13.1m
5.3m
Secament Lenqth = 4.1m
a) Segment next to Pier Support
2.9m
secament Lencatn. 4.8m 508mm l
5.5m
b) Segment at quarter-span
406mm 2.2m
Segment Lenqth •4.Sm· l 6.1m· 1m = 3.28ft.
c) Segment at mid-span
FIGURE 2 Dimensions of typical bridge segments.
ations at various layers of the top slab over an 8-hr period. Surface concrete responded much faster to the outdoor.air temperatures and solar radiation than did the inner concrete layers. As a result, the temperature distributions through the bridge section were nonlinear. As indicated in Figure 5, the air temperature inside the box girder reacted very slowly to the outside temperature changes. The response lag time was about 5 to 6 hr.
Nonlinear temperature distributions through bridge sections have been well documented by several researchers (11-16). Hoffman et al. (13) have shown that temperature distribution can be adequately simulated with one-dimensional heat flow analysis. It was suggested that temperature distributions through a section (11, 14) are best described by a parabola. Others (10) proposed simpler mathematical formulations such as bilinear or trilinear distributions. A comparison of the Red River Bridge measured temperature distribution with the recommended AASHTO trilinear distribution of Imbsen et al. (10) is indicated in Figure 6. The positive AASHTO recommended temperature distribution agreed nicely with the Red River Bridge temperature measurements, although the negative gradient did not have the same level of agreement.
THERMAL STRESSES AND STRAINS
Thermal stresses and strains are inherently different from loadinduced stresses and strains. Thermal·stresses or strains are closely related to the support conditions of the structural members. If a structural member is totally unrestrained, the member will respond to temperature change by expanding or contracting. Such dimensional changes represent the induced thermal strains. However, there will be no stresses induced in the member caused. by the temperature changes. On the other hand, if the member is fully restrained against movement, internal stresses will be induced in the member instead. The fully restrained member will then experience neither movements nor strains. In summary, thermal stresses are primarily restrained stresses that are relieved as soon as thermal movements are allowed.
As an example, a simple beam is subjected to a linear positive temperature gradient. The beam will respond by bending upward to attain a uniform curvature. The top fibers of the beam at midspan will exhibit thermal strains but experience no thermal stresses. However, if the same beam, subjected to the same temperature gra-
Shiu and Tabatabai 97
• Corlson Strain Meter
(!) Corlson Strain Meter
Rosette t:J
El • Thermocouple
[!] 5 Thermocouples Across
Thickness
i:::.2r
FIGURE 3 Locations of strain and temperature sensors in instrumented bridge segment.
dient, is totally restrained, the beam will have no deformations but will experience internal restrained stresses. Practically speaking, structural members are neither fully restrained nor completely free to move. This results in a combination of thermal strains and thermal stresses.
There are two types of thermal restrained stresses:
1. Sectional restrained stresses. Restraint offered by the section. Induced stresses are sometimes called self-equilibrating stresses.
2. Continuity stresses. Restraint offered by the support conditions.
40
35
30
25
Frequency, 2 0 %
1 5
1 0
5
Sectional Restraint Stresses
A basic assumption in the beam theory is that plane sections remain plane. In other words, strain gradients through a beam section shall be linear. If a simply supported beam (Figure 7a) is subjected to a linear temperature gradient, the beam will bow upward with a uniform curvature. No restrained stresses will be induced in the beam. However, if a nonlinear temperature profile is imposed across the beam section, concrete at different section depths will try to expand according to the imposed temperature profile. Assuming no restraint between concrete layers, the resulting strain profile will also be non-
1°c = 1.8°F
-2.8 0 2.8 5.6 8.3 11..1 19_4 22.2 25
Temperature Differential 0 c
FIGURE 4 Typical frequency occurrence of temperature differentials between top and bottom of box girder.
98 TRANSPORTATION RESEARCH RECORD 1460
38
36
34
32
30
28
0.25 0.50 0.75 1.00
a.) Segment next to the pier
Temperature oc
40
38
36
34
32
30
28
••• ltl1i~llfl
i;;....~~~~~--~~~~~~.a.-~~~~~~
0.25 0.50 0.75 1.00
b.) Segment at quarter span
38
36
34
32
30
28
0.25
8/5/1986
0.50 0.75 1.00
Time, days
c.) Segment at midspan
FIGURE 5 Variations of concrete temperatures in top slab of box girder, August 5, 1986.
linear, which violates the basic assumption of plane sections remaining plane. To maintain a linear strain gradient, partial
. restraint has to be imposed by the beam section, resulting in a com- .. bination of the thermal strains and sectional restrained stresses as indicated in Figure 7 a.
Sectional restrained stresses occur in all sections with nonlinear temperature distributions. Some researchers (13, 15) have indicated that such restrained stresses can be substantial. and should be properly accounted for in design. However, there have been very few
··recorded cases of distress caused by thermal restrained stresses. As · indic~ted in Figure 7 a, tensile restrained stresses are induced in the midsection where· very little reinforcement is normally required .
· Special attentio11 .has to be given to reinforcing the girder web sec. tion against unanticipated thermal cracking.
Sectional restrained stresses are internal stresses that have the characteristics of thermal stresses. As such, sectional restrained _stress~s .cannot be. measured by strain meters because strain meters measure only deformations.

-10 °C 0 20°C
• AASHTO - lmbsen a Measured
-6.1°C 0 2.8°C
Negative Positive
a.) Segment next tQ the pier
-10 °C 0
-6.1°C O 2.8°C
Negative Positive
b.) Segment. at quarter span
20°C
-10 °C 0
-6. f°C o 2.8 °C
Negative Positive
c.) Segment at midspan
FIGURE 6· Comparison of AASHTO recommended vertical temperature gradient with measured temperature gradients with highest differentials (1°C = l.8°F). ·
l I. L
~6Lr- 6T T i-.-~lr0
Depth CJ
Section
J_ l. L 111
. {;;;
I. 1
~ . J.
Under Temperature Gradient, 6 T
a.) Sectional restraint
·~
.I
b.) Continuity restraint
--------
FIGURE 7 Sectional restrained stresses and continuity stresses.
Effective Curvature
100
Continuity Stresses
When subjected to a linear temperature gradient, a simply supported beam in Figure 7 a will be free to move and will experience no support restraint. However, support restraint will be present in multispan continuous beams. Stresses resulting from this type of restraint are called continuity stresses.
When a linear temperature gradient is imposed on two simply supported beams, each span will bow upward, as indicated in Figure 7 b by the dotted lines. To make the two simple spans continuous over the center support, a continuity moment Mc is needed to enforce the midsupport compatibility. The moment Mc then represents the additional flexural restraint offered by the support condition. The moment Mc is called the continuity moment, and stresses resulting from this moment are the continuity stresses.
Continuity stresses are similar to the secondary stresses in prestressed concrete construction. Although they are temperatureinduced stresses, continuity stresses do not have the characteristics of thermal stresses and strains. Continuity strains can be measured by strain meters. The magnitude of the continuity stresses are comparable to those of live load stresses and should be duly considered in design.
TEMPERATURE CORRECTION METHODS
All materials, including the measuring sensors, are subjected to temperature effects. To properly evaluate temperature effects in the measured strain, the strain re:duction method was critically reviewed. In this section, a modified temperature adjustment procedure is proposed and its impact on strain measurements is discussed.
Conventional Temperature Correction
Usually strains are obtained by multiplying changes in strain readings before and after an event by the manufacturer's recommended gauge factor. The resulting strain values represent strain movements of the object at the temperature at which strain readings were c<?llected. As such, the measured strains include the apparent strains from the material contraction or expansion caused by temperature changes between strain readings. To eliminate these apparent strains, the following temperature correction equation has been used.
Temperature Correction = (T - Tref) X 'Yconcrete
- (T - Tref) X 'Ymeter
where
T = concrete temperature, °C (°F); I'ret = reference temperature, 23°C (73°F);
'Ymeter = coefficient of expansion for the strain meter; and 'Yconcrete = coefficient of expansion for concrete.
(1)
The first term (T - Tref) X 'Yconcrete in Equation 1 represents the apparent thermal strains of concrete, whereas the second term (T-TreD X 'Ymeter represents the apparent thermal strains of the strain meter. Both terms assume totally unrestrained movements.
As a basis for comparison, Tref was arbitrarily chosen to be 23°C (73°F). The thermal coefficient of expansion for concrete was assumed to be 9.9 strain millionth/°C (5.5 millionth/°F). The expan-
TRANSPORTATION RESEARCH RECORD 1460
sion coefficient of the Red River Bridge concrete was measured to range from 8.5 to 11.5 strain millionth/°C (4.7 to 6.4 strain millionths/0F). The coefficients of thermal expansion for the strain meters were provided by the gauge manufacturer.
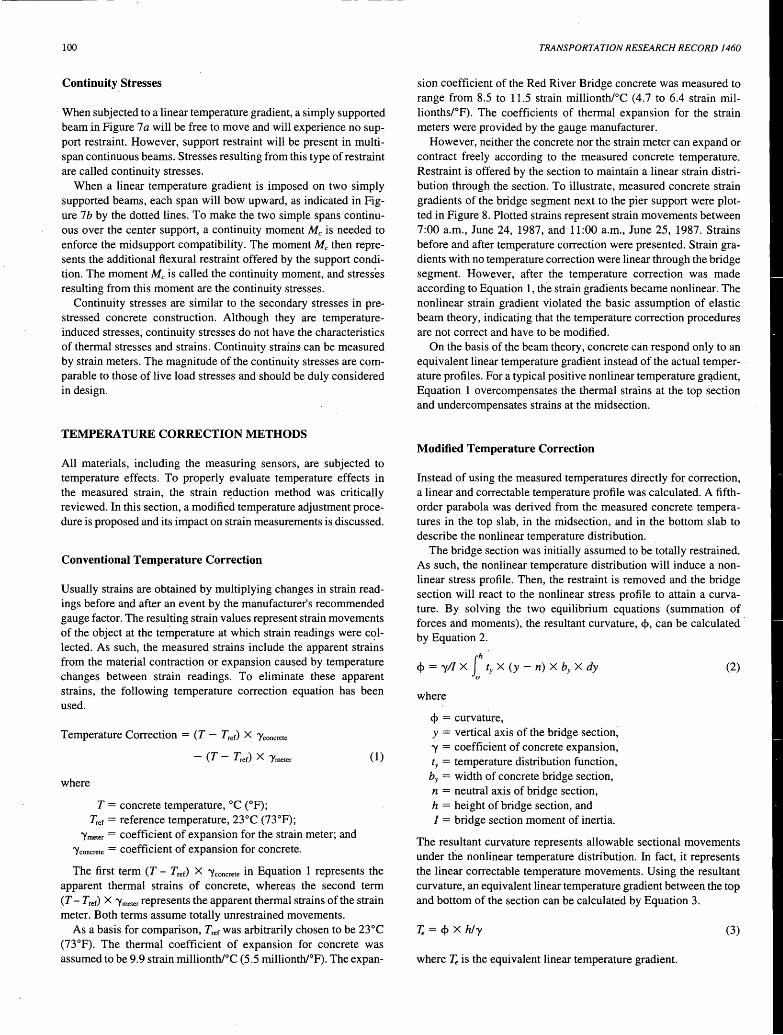
However, neither the concrete nor the strain meter can expand or contract freely according to the measured concrete temperature. Restraint is offered by the section to maintain a linear strain distribution through the section. To illustrate, measured concrete strain gradients of the bridge segment next to the pier support were plotted in Figure 8. Plotted strains represent strain movements between 7:00 a.m., June 24, 1987, and 11:00 a.m., June 25, 1987. Strains before and after temperature correction were presented. Strain gradients with no temperature correction were linear through the bridge segment. However, after the temperature correction was made according to Equation 1, the strain gradients became nonlinear. The nonlinear strain gradient violated the basic assumption of elastic beam theory, indicating that the temperature correction procedures are not correct and have to be modified.
On the basis of the beam theory, concrete can respond only to an equivalent linear temperature gradient instead of the actual temperature profiles. For a typical positive nonlinear temperature gr~dient, Equation 1 overcompensates the thermal strains at the top section and undercompensates strains at the midsection.
Modified Temperature Correction
Instead of using the measured temperatures directly for correction, a linear and correctable temperature profile was calculated. A fifthorder parabola was derived from the measured concrete temperatures in the top slab, in the midsection, and in the bottom slab to describe the nonlinear temperature distribution.
The bridge section was initially assumed to be totally restrained. As such, the nonlinear temperature distribution will induce a nonlinear stress profile. Then, the restraint is removed and the bridge section will react to the nonlinear stress profile to attain a curvature. By solving the two equilibrium equations (summation of forces and moments), the resultant curvature, <f>, can be calculated· by Equation 2.
<I> = "fl/ x r ty x (y - n) x by x dy (2) 0
where
<I> = curvature, y = vertical axis of the bridge section, 'Y = coefficient of concrete expansion, ty = temperature distribution function,
by = width of concrete bridge section, n = neutral axis of bridge section, h = height of bridge section, and I = bridge section moment of inertia.
The resultant curvature represents allowable sectional movements under the nonlinear temperature distribution. In fact, it represents the linear correctable temperature movements. Using the resultant curvature, an equivalent linear temperature gradient between the top and bottom of the section can be calculated by Equation 3.
I;= <I> x hly (3)
where Te is the equivalent linear temperature gradient.

Shiu and Tabatabai 101
10:00 AM 1:30 PM 3:00 PM 5:00 PM 28.9 317 33.y I ' I
I I I I I I I I I I I I I 26.7 27.2 26.\\
----~- 34.4 -----.---
\ I 26.7\\
31.1 II \30.6 30.6 \ -30 0 30 -30 0 30 -30 0 30 -30 0 30 Strain, millionths (typ.)
----Without Concrete Temperature Adju1tment
--With Concrete Temperature Adju1tment
June 25, 1988 7'.20 PM 9:20 PM 12:30 2:1~ AM
34~4 33:'3 32.2v 31.7
27:2 27.8, 28.3 \\: 28.3 I I
I I I
30.6 31.7,lh 31.1 31.1 -30 0 30 -30 0 30 -30 0 30 -30 0 30
5:25 AM 7:00 AM 9:00AM ll:OOAM
30.6 30 29.4
f 30.6 XT I
27.2 27.2 i
27-.8 · i I
2:076\\l I l I I I
Jl I I I
I -
31.1 I
31.1 30.6 -30 0 30 -30 0 30 -30 0 30 -30 0 30
_ ( #) Concrete Temperature, 0c 1°C=1.8°F
FIGURE 8 Strain gradient with and without concrete temperature correction for segment next to pier support, June 24 and 25, 1987.
With 'L (y) in place of T, Equation 1 can be used to correct for the apparent temperature strains. A step-by-step procedure for the modified concrete temperature correction is summarized as follows:
1. Measured temperatures of the girder are used to derive a parabolic function to describe the temper~ture distribution across the girder section.
2. Curvature resulting from the parabolic temperature distribution is calculated by Equation 2.
3. With the calculated curvature, an equivalent linear temperature gradient and the correctable temperature at the location of the strain gauges are calculated by Equation 3.
4. The correctable temperature is then used as concrete temperature in Equation 1.
102
Comparison of Two Temperature Correction Methods
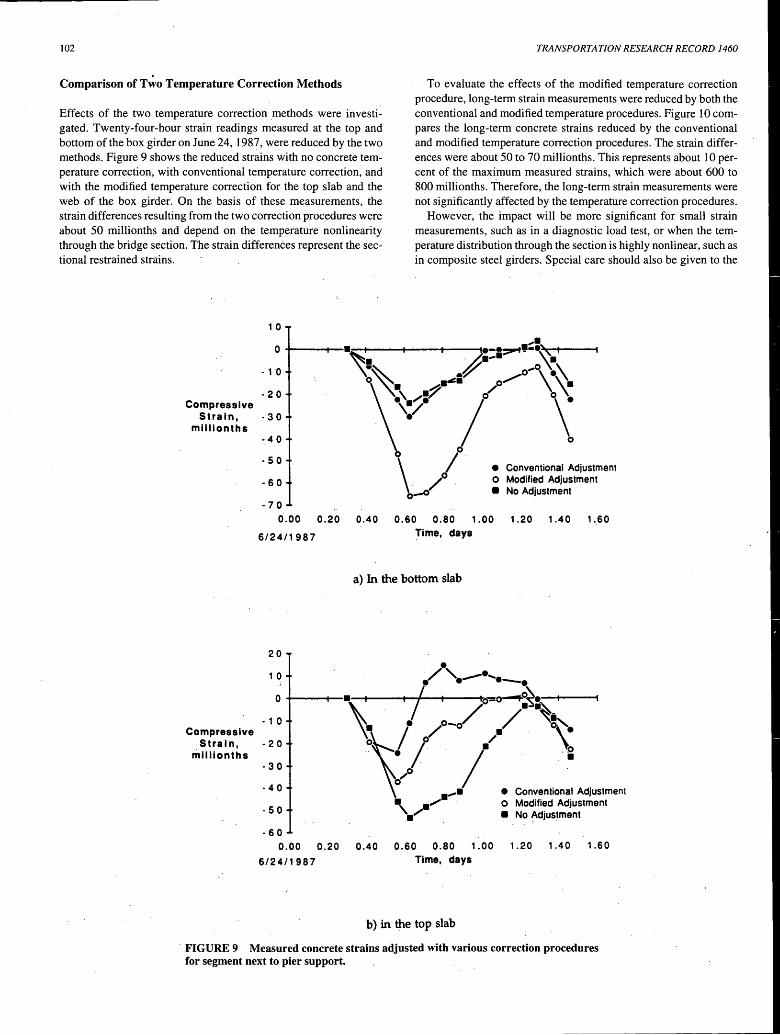
Effects of the two temperature correction .methods were investigated. Twenty-four-hour strain readings measured at the top and bottom of the box girder on June 24, 1987, were reduced by the two methods. Figure 9 shows the reduced strains with no concrete temperature correction, with conventional temperature correction, and with the modified temperature correction for the top slab and the web of the box girder. On the basis of these measurements, the strain differences resulting from the two correction procedures were about 50 millionths and depend on the temperature nonlinearity through the bridge section. The strain differences represent the sectional restrained strains.
1 0
0
. 1 0
. 2 0 Compressive
Stra 1·n, . 30 mllllonths
. 4 0
. 50
. 6 0
- 7 0
TRANSPORTATION RESEARCH RECORD 1460
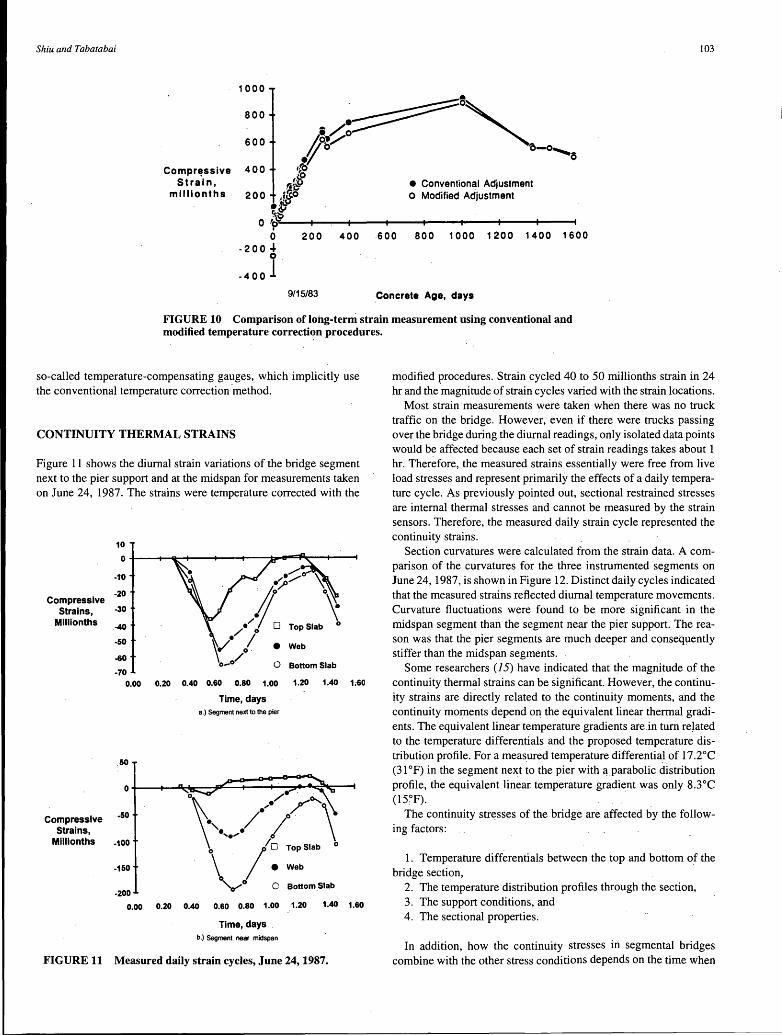
To evaluate the effects of the modified temperature correction procedure, long-term strain measurements were reduced by both the conventional and modified temperature procedures. Figure 10 compares the long-term concrete strains reduced by the conventional and modified temperature correction procedures. The strain differences were about 50 to 70 millionths. This represents about 10 percent of the maximum measured strains, which were about 600 to 800 millionths. Therefore, the long-term strain measurements were not significantly affected by the temperature correction procedures.
However, the impact will be more significant for small strain measurements, such as in a diagnostic load test, or when the temperature distribution through the section is highly nonlinear, such as in composite steel girders. Special care should also be given to the
• Conventional Adjustment o Modified Adjustment • No Adjustment
0.00 0.20 0.40 0.60 0.80 1.00 1.20 1 .40 1.,60
6/24/1987
20
1 0
0
. 1 0 Compressive
Strain, . 2 0 mllllonths
. 3 0
.4 0
. 5 0
. 6 0 0.00 0.20
6/24/1987
Time, days
a) In the bottom slab
• ~/'·--· .... ·-· •I. 1/ I/-~,
\:~; /--0 ,,/ \.. :J I ·~ ..... • • Conventional Adjustment
•, ,,,•"" · o Modified Adjustment • • No ~djustment
0.40 0.60 0.80 1.00 1.20 1.40 1.60 Time, days
b) in the top slab
·FIGURE 9 Measured concrete strains adjusted with various correction procedures for segment next to pier support.
Shiu and Tabatabai
Compr~ssive Strain,
millionths
1000
800
600
400
200
9/15/83
103
400 600 800 1000 1200 1400 1600
Concrete Age, days
FIGURE 10 Comparison of long-term strain measurement using conventional and modified temperature correcti~n procedures.
so-called temperature-compensating gauges, which implicitly use the conventional temperature correction ·method.
CONTINUITY THERMAL STRAINS
Figure 11 shows the diurnal strain variations of the bridge segment next to the pier support and at the midspan for measurements taken on June 24, 1987. The strains were temperature corrected with the
10
o+----+-..... -+----1----ot"----t:.o"""""=fi~---1-----1
-to
·20 Compressive
Strains, -30
Millionths .-40
-50
-60
-70 0.00 0.20 0.40 0.60 0.80 1.00 1.20 1.40 1 ;6Q
,50
0
Compressive -50
Strains, Miiiionths -100
-150
-200
0.00 0.20
Time, days a.) Segment next to the pier
' ./ /' •' \ •,•, . .,/ lo . 0 . /0 TopSlob '
~ e Web 0 O Bottom.Slab
0.40 0.80 0.80 1.00
Time, days . b.) Segment near midspan
1.20 1.40
FIGURE 11 Measured daily strain cycles, June 24, 1987.
1.60
modified procedures. Strain cycled 40 to 50 millionths strain in 24 hr and the magnitude of strain cycles varied with the strain locations.
Most strain measurements were taken when there was no truck traffic on the bridge. However, even if there were trucks passing over the bridge during the diurnal readings, only isolated data points would be affected because each set of strain readings takes about 1 hr. Therefore, the measured strains essentially were free from live load stresses and represent primarily the effects of a daily temperature cycle. As previously pointed out, sectional restrained stresses are internal thermal stresses and cannot be measured by the strain sensors. Therefore, the measured daily strain cycle represented the continuity strains.
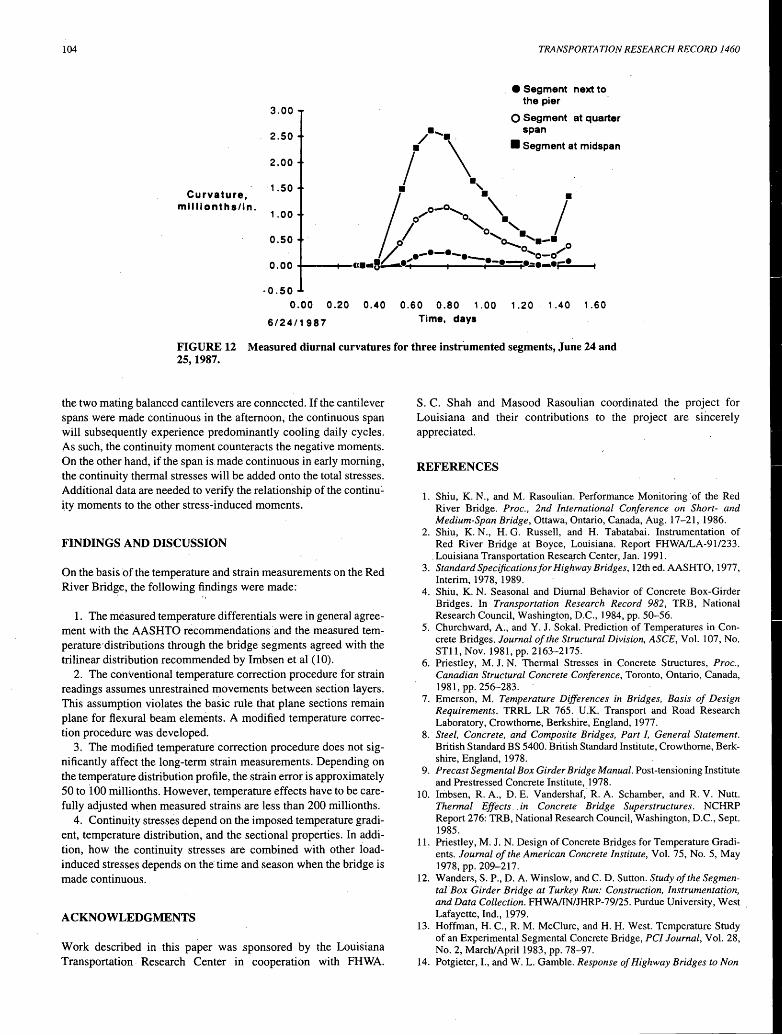
Section curvatures were calculated from the strain data. A comparison of the curvatures for the three instrumented s_egments on June 24, 1987, is shown in Figure 12. Distinct daily cycles indicated that the measured strains reflected diurnal temperature movements. Curvature fluctuations were found to be more significant in the midspan segment than the segment near the pier support. The reason was that the pier segments are much deeper and consequently stiffer than the midspan segments.
Some researchers (15) have indicated that the magnitude of the continuity thermal strains can be significant. However, the continuity strains are directly related to the continuity moments, and the continuity moments depend on the equivalent linear thermal gradients. The equivalent linear temperature gradients are.in turn related to the temperature differentials and the proposed temperature distribution profile. For a meas_ured temperature differential of 17 .2°C (31°F) in the segment next to the pi(!r with a parabolic distribution profile, the equivalent linear temperature gradient was only 8.3°C (15~F).
The continuity stresses of the bridge are affected by the following factors:
1. Temperature differentials between the top and bottom of the bridge section,
2. The temperature distribution profiles through the section, 3. The support conditions, and 4. The sectional properties.
In addition, how the continuity stresses in segmental bridges combine with the other stress conditions depends on the time when
104 TRANSPORTATION RESEARCH RECORD 1460
• Segment next to the pier
3.00 O Segment at quarter
2.50 /•...... span
2.00
Curvature, millionths/In.
i \ •Segment at midspan
. £.1°"°~\, i . 0 °'o ....... _.
'/ ....... 0 0 / _ .-•-•-• 'o-o"' o .oo ____ ,, •• e......-.•""" -·-·-·-=•-•F!---t
1.50
1.00
0.50
-0.50
0.00 0.20 0.40 0.60 0.80 1.00 1.20 1.40 1.60
6/24/1987 Time, days
FIGURE 12 Measured diurnal curvatures for three instrumented segments, June 24 and 25, 1987.
the two mating balanced cantilevers are connected. If the cantilever spans were made continuous in the afternoon, the continuous span will subsequently experience predominantly cooling daily cycles. As such, the continuity moment counteracts the negative moments. On the other hand, if the span is made continuous in early morning, the continuity thermal stresses will be added onto the total stresses. Additional data are needed to verify the relationship of the continu:.. i.ty moments to the other stress-induced moments.
FINDINGS AND DISCUSSION
On the basis of the temperature and strain measurements on the Red River Bridge, the following findings were made:
1. The measured temperature differentials were in general agreement with the AASHTO recommendations and the measured temperature· distributions through the bridge segments agreed with the trilinear distribution recommended by Imbsen et al (10).
2. The conventional temperature correction procedure for strain readings assumes unrestrained movements between section layers. This assumption violates the basic rule that plane sections remain plane for flexural beam elements. A modified temperature correction procedure was developed.
3. The modified temperature correction procedure does not significantly affect the long-term strain measurements. Depending on the temperature distribution profile, the strain error is approximately 50 to too millionths. However, temperature effects have to be carefully adjusted when measured strains are less than 200 millionths.
4. Continuity stresses depend on the imposed temperature gradient, temperature distribution, and the sectional properties. In addition, how the continuity stresses are combined with other loadinduced stresses depends on the time and season when the bridge is made continuous.
ACKNOWLEDGMENTS
Work described in this paper was sponsored by the Louisiana Transportation Research Center in cooperation with FHWA.
S. C. Shah and Masood Rasoulian coordinated the project for Louisiana and their contributions to the project are sincerely appreciated.
REFERENCES
1. Shiu, K. N., and M. Rasoulian. Performance Monitoring of the Red River Bridge. Proc., 2nd International Conference on Short- and Medium-Span Bridge, Ottawa, Ontario, Canada, Aug. 17-21, 1986.
2. Shiu, K. N., H. G. Russell, and H. Tabatabai. Instrumentation of Red River Bridge at Boyce, Louisiana. Report FHWNLA-91/233 .
. Louisiana Transportation Research Center, Jan. 1991. 3. Standard Specifications for Highway Bridges, 12th ed. AASHTO, 1977,
Interim, 1978, 1989. 4. Shiu, K. N. Seasonal and Diurnal Behavior of Concrete Box-Girder
Bridges. In Transportation Research Record 982, TRB, National Research Council, Washington, D.C., 1984, pp. 50-56.
5. Churchward, A., and Y. J. Sokal. Prediction of Temperatures in Concrete Bridges. Journal of the Structural Division, ASCE, Vol. 107, No. STll, Nov. 1981, pp. 2163-2175.
6. Priestley, M. J. N. Thermal Stresses in Concrete Structures, Proc., Canadian Structural Concrete Conference, Toronto, Ontario, Canada, 1981, pp. 256-283.
7. Emerson, M. Temperature Differences in Bridges, Basis of Design Requirements. TRRL LR 765. U.K. Transport and Road Research Laboratory, Crowthorne, Berkshire, England, 1977.
8. Steel, Concrete, and Composite Bridges, Part /, General Statement. British Standard BS 5400. British Standard Institute, Crowthome, Berkshire, England, 1978.
9. Precast Segmental Box Girder Bridge Manual. Post-tensioning Institute and Prestressed Concrete Institute, 1978.
10. Imbsen, R. A., D. E. Vandershaf, R. A. Schamber, and R. V. Nutt. Thermal Effects . . in Concrete Bridge Superstructures. NCHRP Report 276: TRB, National Research Council, Washington, D.C., Sept. 1985.
11. Priestley, M. J. N. Design of Concrete Bridges for Temperature Gradients. Journal of the American Concrete Institute, Vol. 75, No. 5, May 1978, pp. 209-217.
12. Wanders, S. P., D. A. Winslow, and C. D. Sutton. Study of the Segmental Box Girder Bridge at Turkey Run: Construction, Instrumentation, and Data Collection. FHWA/IN/JHRP-79/25. Purdue University, West . Lafayette, Ind., 1979.
13. Hoffman, H. C., R. M. McClure, and H. H. West. Temperature Study of an Experimental Segmental Concrete Bridge, PC/ Journal, Vol. 28, No. 2, March/April 1983, pp. 78-97.
14. Potgieter, I., and W. L. Gamble. Response of Highway Bridges to Non

Shiu and Tabatabai
linear Temperature Distributions. Report FHW A/IL-UI/201. Uni versity of Illinois, April 1983.
15. Elbadry, M., and A. Ghali. Thermal Stresses and Cracking of Concrete Bridges. Journal of the American Concrete Institute, Vol. 83, No. 6, Nov.-Dec. 1986, pp. 1001-1009.
16. Prakash Rao, D.S. Temperature Distributions and Stresses in Concrete Bridges. Journal of the American Concrete Institute, Vol. 83, No. 4, July-Aug. 1986, pp. 589-596.
105
The contents of this paper reflect the views of the authors, who are responsible for the facts and accuracy of the presented data. The contents do not necessarily reflect the official view or policies of the Louisiana Transportation Research Center or FHWA.
Publication of this paper sponsored by Committee on Dynamics and Field Testing of Bridges.