measurement and characterization of dual-band lora
TRANSCRIPT

Measurement and characterization ofdual-band LoRa communication in the Antarctic
Patrick Van Torre1, Johnny Gaelens1, Jo Verhaevert1, Hendrik Rogier1
1Ghent University - imec, IDLab, Department of Information Technology (INTEC),Technologiepark-Zwijnaarde 15, 9052 Gent, Belgium, [email protected]
Abstract—The Antarctic is vast continent without any com-munication or power infrastructure. However, many countriesoperate scientific experiments in the Antarctic and desire low-power long-range data communication for their scientific mea-surement setups. Currently, expensive satellite communicationvia Argos or Inmarsat is often employed. In case of limiteddata rate, sub-GHz frequency bands offer excellent radio wavepropagation to provide ground-based communication links. Thelonger wavelength in these bands results in less path loss for asimilar range, compared to microwave links at GHz frequencies.In a recent evolution, LoRa networks are deployed, allowing alarger link budget thanks to chirp spread spectrum modulation.In this paper, a number of dual band mobile-to-base-stationmeasurements are described for the 434 and 868 MHz frequencybands. The channel measurements are analyzed for signal tonoise ratio and packet loss, as recorded for different practicaltrajectories. The relation between packet loss and signal to noiseratio is also provided for practical applications in mobile to basestation communication links.
Index Terms—Antarctic, LoRa, antenna, propagation, mea-surement.
I. INTRODUCTION
The Antarctic is still a mostly unexplored environment situ-ated far away from the inhabited world. Scientific base stations[1], experimental sensor setups and mobile vehicles employedfor expeditions all need wireless data communication. In thiscontinent at this moment no frequency regulation exists forradio communication, implying that theoretically all frequencybands could be used without power limit. Of course, it isimportant to employ as little power as possible in order toextend the battery life of remote equipment. Renewable energyis generally preferred, charging the batteries of long-termremote science setups by means of solar power or wind energy.Additionally, despite the freedom offered by the unregulatedspectrum, it is technically more feasibly to employ technologywhich is already validated in the inhabited world.
The range for which communications need to be establishedis in the order of up to almost 30 km around the basestation. In the field of wireless sensor networks, an evolutionexists towards the use of sub-GHz frequencies for long-rangelow-power communication. Sub-GHz frequencies offer theadvantage of a longer range, combined with more diffractionof the waves around small obstacles. Different technologiesare currently being promoted and used in industry, of whichthe most popular are LoRa [2], Sigfox [3] and DASH7 [4].In a recent publication LoRa technology was employed in the
Antarctic, resulting in successful data communication up toa distance of 28 km between the base station and a mobilevehicle [5].
LoRa technology is indeed a promising technique for long-range links, allowing low packet loss, even with very weaksignals buried in the noise, thanks to the chirp spread spec-trum modulation (CSS) providing a large spreading gain. Analternative for long-range links is Sigfox, but in comparisonLoRa offers a larger bandwidth and data rate. The adaptivedata rate is considered an advantage, increasing the autonomyof the wireless nodes. Transmissions can indeed be shorter totransmit a given amount of data, resulting in optimal energyconsumption. Additionally, the larger bandwidth and CSSmodulation employed by LoRa allows the system to handleDoppler shifts of the signals more efficiently, resulting in bettermobile performance. The DASH7 standard, in comparison,offers a data rate comparable to LoRa but is presented as asolution for link ranges up to 2 km [4].
The Antarctic, with it’s thick ice sheet, mountains andabsence of buildings, presents an interesting environment forpropagation measurements. Channel characterization, as oftenperformed in the inhabited world [6], is not found in literaturefor this continent.
Recent publications covering LoRa experiments are mostlyperformed in cities, where interference is an importantperformance-limiting issue [7]. Indoor as well as outdoormeasurements with LoRa links are described in [8], providinginteresting information about propagation over water for arange comparable to measurements following in this paper.
A first set of Antarctic channel measurements was presentedin [5]. In this paper measurements for wireless mobile tobase-station links are documented and compared for differentfrequency bands. This paper focuses on the relation betweenSignal-to-Noise Ratio (SNR) and packet loss for different prac-tical mobile-to-base-stations links. Measurements are repeatedand compared for similar trajectories. The characteristics formeasurements performed on different days are compared.Additionally, measurements in different bands are analyzed inorder to obtain a general performance indicator, comparingthe efficiency of those bands as a candidate for wirelesssensor communication in the Antarctic. The packet loss is alsodetermined as a function of SNR for practical links.
The paper is further organized as follows. The measurementsetup is presented in Section II, the measurement results inSection III and finally by the conclusions in Section IV.

II. MEASUREMENT SETUP
A. General setup
The general setup is valid for both the base station and themobile vehicle. Measurements are performed employing LoRacommunication from a mobile transmitter to a receiving basestation in both the 434 and 868 MHz bands.
Packets are sent every 5 seconds, alternating on each band inorder to allow a performance comparison in both bands for thedistance covered by the mobile vehicle. The communicationis one-way, without acknowledge packets sent by the receiver.GPS positions are continuously recorded, providing accuraterange information.
The Microchip Technology DM164138 board [9] is em-ployed as a dual-band transceiver at both sides of the link.This board relies on the RN2483 LoRa chip. LoRa modulatedpackets with a 3-byte payload containing increasing sequencenumbers are transmitted at a power of +14 dBm, with 125 kHzbandwidth, 4/5 coding rate, a preamble length of 10 chips anda bandwidth spreading factor of 12. A Cyclic RedundancyCheck (CRC) is also employed, guaranteeing the correctnessof the received packet’s data content. These parameters corre-spond to the board’s default configuration, resulting in a datarate of 293 bps.
B. Base station receiving setup
At the Belgian Princess Elisabeth Antarctic Station [1], adual band LoRa receiver is installed, connected to verticallypolarized directional Yagi-Uda antennas installed on the roofof the station, as illustrated in Fig. 1. The detailed picture inFig. 2 shows a detail of both antennas. The top antenna isa 9-element 824-960 MHz directional 13 dBi gain antennawhereas the bottom antenna is a 7-element 390-480 MHzdirectional 10 dBi antenna, both from the LPRS (Low PowerRadio Solutions) company [10]. The antennas are mountedapproximately 8 m above ground level, corresponding to1390 m above sea level. The expeditions performed withthe mobile vehicle always stay within the main beam widthof these Yagi-Uda antennas. The gain antennas are onlyused for receiving, hence the power limits imposed by thedifferent spectrum regulations in the world are not exceeded.However, as no spectrum regulation exists in the Antarctic,gain antennas could also be legally employed for transmitting,further extending the link’s range. The receiver, based on theRN2483 chip which is specified to operate at temperaturesdown to −40◦ C, is mounted in a small cabinet near theantennas to limit coaxial cable losses, as is clearly visible inFig. 2.
C. Mobile transmitting setup
The mobile vehicle used for the expeditions is a caterpillar-track equipped Toyota Hilux, as displayed in Fig. 3. Omni-directional vertical monopole antennas for each band areinstalled on the roof of the vehicle. Similar hardware as in thebase station is used as a transmitter. However, the transmitternow is controlled by a Raspberry PI board [11] in order tokeep the power consumption as low as possible. Additionally,
this board is specified to operate down to temperatures as lowas −40◦ C. Measurements are performed during inspection ofscience setups up to a range of approximately 30 km from thebase station.
Fig. 1. Base station, equipped with Yagi-Uda receive antennas on a smallmast.
Fig. 2. Detail of the base station Yagi-Uda antennas and the LoRa receiver.
Fig. 3. Mobile vehicle, equipped with transmit antennas installed on the roofof the car.
III. MEASUREMENT RESULTS
A number of measurements have been performed, duringexpeditions on different days. The LoRa system was furtherdeveloped during the measurement campaign. Therefore initialmeasurements are only in the 868 MHz band, further measure-ments are dual band, on 434 and 868 MHz. Some technicalproblems also limited the amount of useful data that wasrecorded. Due to the weather conditions, some measurementscould not be repeated. Table I lists the available measurements.
TABLE IANTARCTIC LORA MEASUREMENTS
Meas. Date Band (MHz) Reference
I Dec. 17th, 2016 868 -II Jan. 03th, 2017 434 + 868 -III Jan. 10th, 2017 434 + 868 [5]IV Jan. 20th, 2017 (434) + 868 -
A. Outbound and return path to base station at 868 MHz
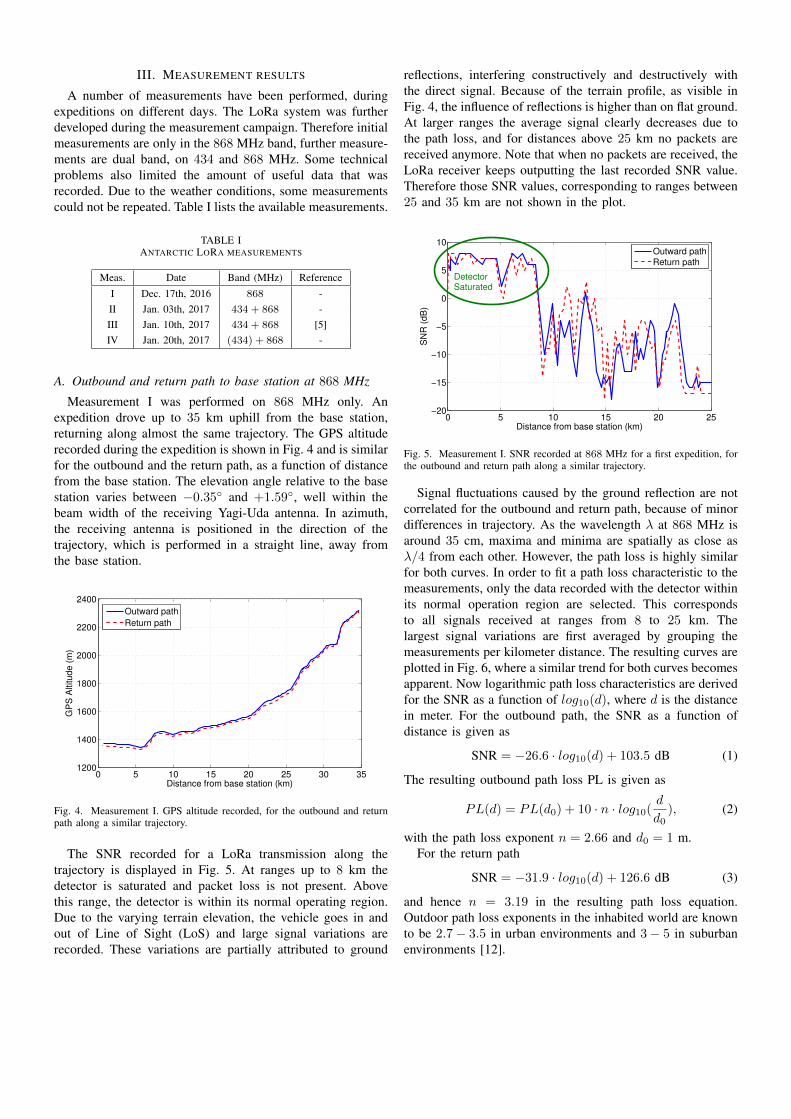
Measurement I was performed on 868 MHz only. Anexpedition drove up to 35 km uphill from the base station,returning along almost the same trajectory. The GPS altituderecorded during the expedition is shown in Fig. 4 and is similarfor the outbound and the return path, as a function of distancefrom the base station. The elevation angle relative to the basestation varies between −0.35◦ and +1.59◦, well within thebeam width of the receiving Yagi-Uda antenna. In azimuth,the receiving antenna is positioned in the direction of thetrajectory, which is performed in a straight line, away fromthe base station.
0 5 10 15 20 25 30 351200
1400
1600
1800
2000
2200
2400
Distance from base station (km)
GP
S A
ltitude (
m)
Outward path
Return path
Fig. 4. Measurement I. GPS altitude recorded, for the outbound and returnpath along a similar trajectory.
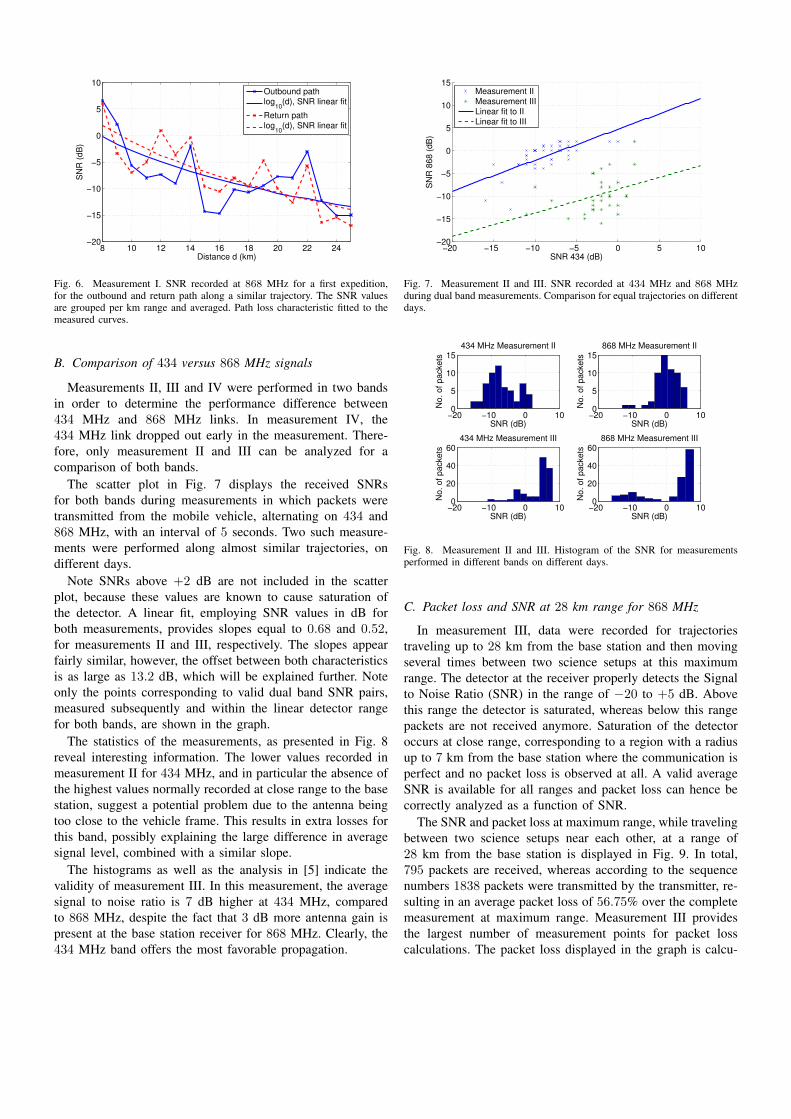
The SNR recorded for a LoRa transmission along thetrajectory is displayed in Fig. 5. At ranges up to 8 km thedetector is saturated and packet loss is not present. Abovethis range, the detector is within its normal operating region.Due to the varying terrain elevation, the vehicle goes in andout of Line of Sight (LoS) and large signal variations arerecorded. These variations are partially attributed to ground
reflections, interfering constructively and destructively withthe direct signal. Because of the terrain profile, as visible inFig. 4, the influence of reflections is higher than on flat ground.At larger ranges the average signal clearly decreases due tothe path loss, and for distances above 25 km no packets arereceived anymore. Note that when no packets are received, theLoRa receiver keeps outputting the last recorded SNR value.Therefore those SNR values, corresponding to ranges between25 and 35 km are not shown in the plot.
0 5 10 15 20 25−20
−15
−10
−5
0
5
10
Distance from base station (km)S
NR
(dB
)
Outward path
Return path
DetectorSaturated
Fig. 5. Measurement I. SNR recorded at 868 MHz for a first expedition, forthe outbound and return path along a similar trajectory.
Signal fluctuations caused by the ground reflection are notcorrelated for the outbound and return path, because of minordifferences in trajectory. As the wavelength λ at 868 MHz isaround 35 cm, maxima and minima are spatially as close asλ/4 from each other. However, the path loss is highly similarfor both curves. In order to fit a path loss characteristic to themeasurements, only the data recorded with the detector withinits normal operation region are selected. This correspondsto all signals received at ranges from 8 to 25 km. Thelargest signal variations are first averaged by grouping themeasurements per kilometer distance. The resulting curves areplotted in Fig. 6, where a similar trend for both curves becomesapparent. Now logarithmic path loss characteristics are derivedfor the SNR as a function of log10(d), where d is the distancein meter. For the outbound path, the SNR as a function ofdistance is given as
SNR = −26.6 · log10(d) + 103.5 dB (1)
The resulting outbound path loss PL is given as
PL(d) = PL(d0) + 10 · n · log10(d
d0), (2)
with the path loss exponent n = 2.66 and d0 = 1 m.For the return path
SNR = −31.9 · log10(d) + 126.6 dB (3)
and hence n = 3.19 in the resulting path loss equation.Outdoor path loss exponents in the inhabited world are knownto be 2.7− 3.5 in urban environments and 3− 5 in suburbanenvironments [12].
8 10 12 14 16 18 20 22 24−20
−15
−10
−5
0
5
10
Distance d (km)
SN
R (
dB
)
Outbound pathlog
10(d), SNR linear fit
Return pathlog
10(d), SNR linear fit
Fig. 6. Measurement I. SNR recorded at 868 MHz for a first expedition,for the outbound and return path along a similar trajectory. The SNR valuesare grouped per km range and averaged. Path loss characteristic fitted to themeasured curves.
B. Comparison of 434 versus 868 MHz signals
Measurements II, III and IV were performed in two bandsin order to determine the performance difference between434 MHz and 868 MHz links. In measurement IV, the434 MHz link dropped out early in the measurement. There-fore, only measurement II and III can be analyzed for acomparison of both bands.
The scatter plot in Fig. 7 displays the received SNRsfor both bands during measurements in which packets weretransmitted from the mobile vehicle, alternating on 434 and868 MHz, with an interval of 5 seconds. Two such measure-ments were performed along almost similar trajectories, ondifferent days.
Note SNRs above +2 dB are not included in the scatterplot, because these values are known to cause saturation ofthe detector. A linear fit, employing SNR values in dB forboth measurements, provides slopes equal to 0.68 and 0.52,for measurements II and III, respectively. The slopes appearfairly similar, however, the offset between both characteristicsis as large as 13.2 dB, which will be explained further. Noteonly the points corresponding to valid dual band SNR pairs,measured subsequently and within the linear detector rangefor both bands, are shown in the graph.
The statistics of the measurements, as presented in Fig. 8reveal interesting information. The lower values recorded inmeasurement II for 434 MHz, and in particular the absence ofthe highest values normally recorded at close range to the basestation, suggest a potential problem due to the antenna beingtoo close to the vehicle frame. This results in extra losses forthis band, possibly explaining the large difference in averagesignal level, combined with a similar slope.
The histograms as well as the analysis in [5] indicate thevalidity of measurement III. In this measurement, the averagesignal to noise ratio is 7 dB higher at 434 MHz, comparedto 868 MHz, despite the fact that 3 dB more antenna gain ispresent at the base station receiver for 868 MHz. Clearly, the434 MHz band offers the most favorable propagation.
−20 −15 −10 −5 0 5 10−20
−15
−10
−5
0
5
10
15
SNR 434 (dB)
SN
R 8
68
(d
B)
Measurement II
Measurement III
Linear fit to II
Linear fit to III
Fig. 7. Measurement II and III. SNR recorded at 434 MHz and 868 MHzduring dual band measurements. Comparison for equal trajectories on differentdays.
−20 −10 0 100
5
10
15434 MHz Measurement II
SNR (dB)
No
. o
f p
acke
ts
−20 −10 0 100
5
10
15868 MHz Measurement II
SNR (dB)
No
. o
f p
acke
ts
−20 −10 0 100
20
40
60434 MHz Measurement III
SNR (dB)
No
. o
f p
acke
ts
−20 −10 0 100
20
40
60868 MHz Measurement III
SNR (dB)
No
. o
f p
acke
ts
Fig. 8. Measurement II and III. Histogram of the SNR for measurementsperformed in different bands on different days.
C. Packet loss and SNR at 28 km range for 868 MHz
In measurement III, data were recorded for trajectoriestraveling up to 28 km from the base station and then movingseveral times between two science setups at this maximumrange. The detector at the receiver properly detects the Signalto Noise Ratio (SNR) in the range of −20 to +5 dB. Abovethis range the detector is saturated, whereas below this rangepackets are not received anymore. Saturation of the detectoroccurs at close range, corresponding to a region with a radiusup to 7 km from the base station where the communication isperfect and no packet loss is observed at all. A valid averageSNR is available for all ranges and packet loss can hence becorrectly analyzed as a function of SNR.
The SNR and packet loss at maximum range, while travelingbetween two science setups near each other, at a range of28 km from the base station is displayed in Fig. 9. In total,795 packets are received, whereas according to the sequencenumbers 1838 packets were transmitted by the transmitter, re-sulting in an average packet loss of 56.75% over the completemeasurement at maximum range. Measurement III providesthe largest number of measurement points for packet losscalculations. The packet loss displayed in the graph is calcu-

lated as a moving average over 30 valid received packets. Thenumber of lost packets is determined by means of the missingsequence numbers at the receiving side. Clearly, packet lossfluctuates very significantly according to the position of thevehicle, local terrain elevation and possibly operations per-formed by the scientist at the setups, blocking the signal path.However, a limited throughput is always available and duringthe peaks of highest SNR, the packet loss is as low as 3%,despite the 28 km range covered.
0 500 1000 1500 2000−25
−20
−15
−10
−5
0
SN
R (
dB
)
0 500 1000 1500 20000
20
40
60
80
100
% p
acke
t lo
ss
Fig. 9. Measurement III. Moving average of the packet loss at 28 km rangefor 868 MHz.
A bar graph of the packet loss as a function of the averageSNR expressed in dB per group of 30 received packets isshown in Fig. 10. Thanks to the spreading gain of the CSSmodulation employed for LoRa communication, packet lossoccurs only for received signal powers below the noise level.For higher SNRs, no packet loss is observed. A linear fit tothe bar graphs allows to approximate the percentage of packetloss as −5.4 · SNR − 19 for −19 dB < SNR < −3.52 dB.
−20 −15 −10 −5 00
20
40
60
80
Average SNR (dB)
Pa
cke
t L
oss (
%)
Packet Loss
Linear fit
Fig. 10. Measurement III. Grouped packet loss as a function of SNR, for868 MHz at 28 km range.
The CSS modulation employed by the LoRa standardclearly causes a higher practical link budget. Frequency ShiftKeying (FSK), as employed in Sigfox, and Bi-Phase Shift Key-ing (BPSK) in DASH7, require positive SNRs in dB to achievesimilar packet loss figures at the receiver. Theoretically, anSNR of 0 dB results in a Bit Error Rate (BER) of 0.1482 forFSK and 0.0786 for BPSK, respectively. A BER in this orderof magnitude would generally be uncorrectable by coding andresult in an unacceptable packet loss rate.
IV. CONCLUSION
The measurements performed in the Antarctic provide aclear indication of the practical range and reliability of LoRawireless sensor links. Measurement results are shown to bereproducible, based on signal levels recorded during oneexpedition, comparing values recorded along the outbound andreturn path along the same trajectory.
The performance at 434 and 868 MHz is compared. The434 MHz link generally provides a better signal to noise ratio,as expected based on wave propagation theory. Excludingsaturation of the detector, the average signal to noise ratiois 7 dB higher at 434 MHz, compared to 868 MHz, despitethe fact that 3 dB more antenna gain is present at the basestation receiver for 868 MHz.
At 28 km range, a variable packet loss was measured.Depending on the position of the vehicle, packet loss values aslow as 3 % are possible. Packet loss was also characterized asa function of signal to noise ratio. The measurements indicatethat LoRa communication over this range is perfectly possible.
The paper provided measurement and analysis of practicalLoRa wireless sensor communication in the Antarctic. Theresults from this work will be used for the future developmentof wireless links to remote weather stations. Future researchcan also include topologies where the nodes not only transmittheir own data, but additionally forward LoRa packets frommore remote sensor nodes, in order to extend the range of thewireless sensor system.
ACKNOWLEDGMENT
This research was possible thanks to InternationalPolar Foundation (www.polarfoundation.org /www.antarcticstation.org). Funding of the part of researchinfrastructure used in this paper was made available byBELSPO through the IAP Phase VII BESTCOM project.
REFERENCES
[1] Princess Elisabeth Antarctic Station http://www.antarcticstation.org, Ac-cessed May 10, 2017.
[2] Lora Alliance, Lora alliance https://www.lora-alliance.org/.[3] Sigfox.com, Sigfox https://www.sigfox.com/en.[4] DASH7 Alliance, Dash7 http://www.dash7-alliance.org/.[5] J. Gaelens, P. Van Torre, J. Verhaevert, and H. Rogier, “LoRa mobile-
to-base-station channel characterization in the Antarctic,” Sensors,vol. 17, no. 8, 2017. [Online]. Available: http://www.mdpi.com/1424-8220/17/8/1903
[6] J. B. Andersen, T. S. Rappaport, and S. Yoshida, “Propagation mea-surements and models for wireless communications channels,” IEEECommunications Magazine, vol. 33, no. 1, pp. 42–49, Jan 1995.
[7] M. Lauridsen, B. Vejlgaard, I. Kovcs, H. Nguyen, and P. Mogensen,Interference Measurements in the European 868 MHz ISM Band withFocus on LoRa and SigFox, 3 2017.
[8] J. Petjjrvi, K. Mikhaylov, M. Pettissalo, J. Janhunen, and J. Iinatti, “Per-formance of a low-power wide-area network based on LoRa technology:Doppler robustness, scalability, and coverage,” International Journal ofDistributed Sensor Networks, vol. 13, no. 3, 2017.
[9] Microchip, Microchip LoRa board DM164138http://www.microchip.com/Developmenttools.
[10] LPRS, Low Power Radio Solutions Ltd http://www.lprs.co.uk.[11] Raspberry Pi Foundation, Raspberry Pi https://www.raspberrypi.org/.[12] T. S. Rappaport, Wireless Communications: Principles and Practice.
Upper Saddle River, New Jersey: Prentice Hall PTR, 1996.