measurement and prediction procedures for printability … · printed in france by ato imprimerie -...
TRANSCRIPT

Measurement and Prediction Procedures for Printability in
Flexography (MP3 Flexo)
Laurent, Girard Leloup
Stockholm 2002
Doctoral Dissertation Royal Institute of Technology
Department of Numerical Analysis and Computer Science ---
Media Technology and Graphic Arts

Laurent, Girard Leloup ∗ Royal Institute of Technology ∗ 2002 2
Respondent: Laurent, Girard Leloup Opponent: Dr. Patrice J. Mangin Examination committee: Dr. Renke Wilken Prof. Lars Järnström Dr. Lars Palm Supervisor: Prof. Nils Enlund Chairman: Prof. Roger Wallis Thesis for the degree of Doctor of Technology to be presented with due permission by the Royal Institute of Technology, for public examination and criticism, in room E3, at the Royal Institute of Technology, KTH, Lindstedtsvägen 5, Stockholm, on June 7, 2002, at 10 AM. TRITA-NA-0212 ISSN-0348-2952 ISBN 91-7283-306-8 ISRN-KTH/NA/R-02/12-SE * Laurent, Girard Leloup, Mai 2002 Printed in France by ATO IMPRIMERIE - 8, Rue Jacquard - 54500 VANDOEUVRE

Laurent, Girard Leloup ∗ Royal Institute of Technology ∗ 2002 3
Abstract The time flexography was synonym for “potatoes printing” belongs to the history. All around the world the flexographic process has proved its ability to produce high quality on a very large amount of different substrates. Flexibility and simplicity are namely major assets of the process, which is the only conventional printing process showing a positive growth during the last years. A literature study around the printability and quality control terms in flexography, completed by interviews, help for the analysis of the parameters, the planning of printing trials and the measurement of quality factors. The next stage was the establishment of the procedures. The present work should help the flexography to achieve needed standardisation to assure the stability of the process. Flexography is profiting and simultaneously suffering from its broadband of possibilities, which make the decisions complicated in view of quality striving. The thesis proposes a solution to objectively quantify the quality of the achieved (measurement procedure) or achievable (prediction procedure) result. The use of a “Printability Coefficient” obtained with the help of measurement and prediction procedures will give the industry a further weapon to improve and promote flexography. “MP3 Flexo” is a quality control and communication instrument, which accompanies the product from its conception (customer, publicity agency, paper and supplier industries) to its realisation (printing industry). The system as presented here can be implemented in the industry. Key words: flexography, printability, objectivity, measurement, prediction, quality control

Laurent, Girard Leloup ∗ Royal Institute of Technology ∗ 2002 4
Preface The project was part of a national research program called T2F (“Tryckteknisk Forskning”), financed at the same level by the Swedish government and the paper/printing industries. A network of industrial partners and research institutes throughout Sweden manages the projects. This project was the first one and accompanied the building up of the network. In addition to the scientific results presented in this thesis, my work also provided many results and experiences on another level. From the human point of view the project brought some results about teamwork, communication and industrial property in the paper and printing research and industry. A few examples:
• There exists a real concurrence between the different research institutes. This concurrence occurs at the personal, knowledge and equipment levels. It could be a positive motivation factor but also, in a case of a network, slow down some projects.
• Human affinity or the lack of it could be a relevant success factor
• The industry is open to interesting projects and can offer help by delivering materials or exp ert time
• Meetings, conferences and fairs visits are important inputs for a research project. The exchange of information with other experts guides the project by giving it the right orientation and avoiding too theoretical work, work without interest for the industry or the repetition of work already done.
To summarize, I would like to say that this project was in a lot of aspects en enrichment for me and consequently I will keep a positive memory of the time I spent making this research.

Laurent, Girard Leloup ∗ Royal Institute of Technology ∗ 2002 5
List of included papers PAPER I Girard Leloup, L. “Statistical Analysis of the possibilities and limits of Flexographic Process Modelling.” – Presented at the TAGA 2000 Conference - Colorado Springs (USA) – Paper published in Conference Proceedings TAGA 2000 – pp. 469-486 PAPER II Girard Leloup, L. “Analysis of the correlation between the print quality required in Flexography and the tolerances in materials and paper manufacturing in terms of printability.” – Presented at the FFTA Y2K Forum - Orlando (USA) – Paper publis hed in Y2K FFTA Forum Proceedings CD – “General Session” PAPER III Girard Leloup, L. “Study of paper printability in flexography by controlled variation of the surface roughness.” – Presented at the IARIGAI 2000 Conference - Graz (A) - Paper published in IARIGAI 2000 Conference Programme – pp.171-189 PAPER IV Girard Leloup, L. ”A Flex-Odyssey…” – Presented at the FFTA Forum 2001 – Nashville (USA) - Paper published in FFTA 2001 Forum Proceedings CD – “Paper substrates Session” PAPER V Girard Leloup, L. “Establishment and Comparison of Different Definitions and Equations for a “Printability Coefficient” for the Flexographic Process.” – Presented at the TAGA 2001 – San Diego (USA) - Paper published in Conference Proceedings TAGA 2001 – pp. 80-97 PAPER VI Girard Leloup, L. “Prediction of the Substrate Printability in Flexography by using a new established Printability Coefficient.” – APPITA 2002 - Rotorua (NZ) - Paper published in Proceedings 56th APPITA Annual Conference 2002 – pp.459-464
Laurent, Girard Leloup ∗ Royal Institute of Technology ∗ 2002 6
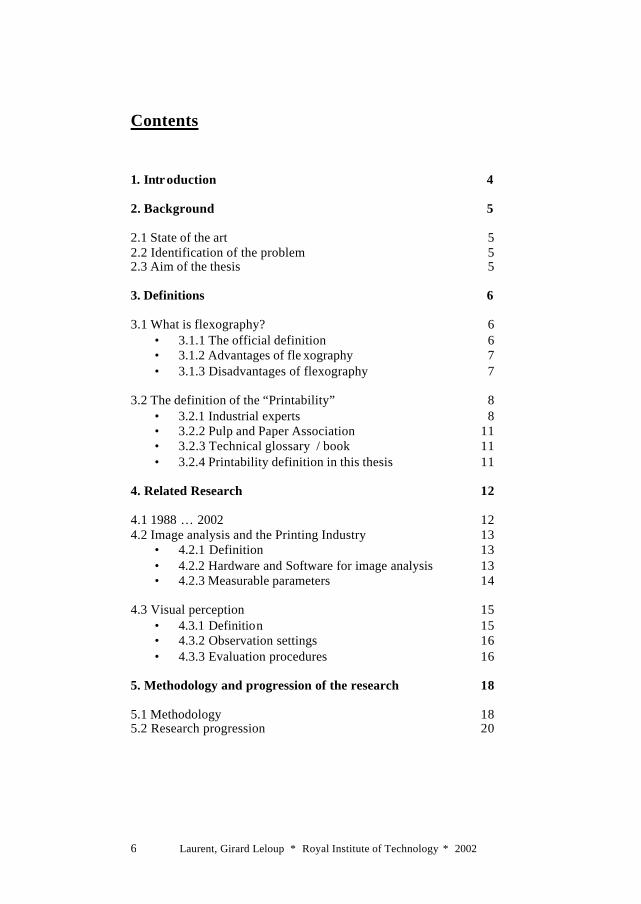
Contents
1. Intr oduction 4 2. Background 5 2.1 State of the art 5 2.2 Identification of the problem 5 2.3 Aim of the thesis 5 3. Definitions 6 3.1 What is flexography? 6
• 3.1.1 The official definition 6 • 3.1.2 Advantages of fle xography 7 • 3.1.3 Disadvantages of flexography 7
3.2 The definition of the “Printability” 8
• 3.2.1 Industrial experts 8 • 3.2.2 Pulp and Paper Association 11 • 3.2.3 Technical glossary / book 11 • 3.2.4 Printability definition in this thesis 11
4. Related Research 12 4.1 1988 … 2002 12 4.2 Image analysis and the Printing Industry 13
• 4.2.1 Definition 13 • 4.2.2 Hardware and Software for image analysis 13 • 4.2.3 Measurable parameters 14
4.3 Visual perception 15
• 4.3.1 Definition 15 • 4.3.2 Observation settings 16 • 4.3.3 Evaluation procedures 16
5. Methodology and progression of the research 18 5.1 Methodology 18 5.2 Research progression 20

Laurent, Girard Leloup ∗ Royal Institute of Technology ∗ 2002 7
• 5.2.1 Census of the parameters 20 • 5.2.2 Individual analysis of each component 20 • 5.2.3 Description of the evaluation method 21 • 5.2.4 Definition of the quality factors 21 • 5.2.5 Determination of the influence of each parameter 23 • 5.2.6 Acquisition of the evaluation methodology 23 • 5.2.7 Establishment of a “Printability Coefficient” 23 • 5.2.8 Test of the relevancy of the equation 24
• 5.2.9 Modelling 24
• 5.2.9.1 Modelling of the printing parameters 24 • 5.2.9.2 Modelling of the paper characteristics 25
• 5.2.10 Establishment of a procedure for the prediction of the Printability 25 • 5.2.10.1 Definition of a reference 25 • 5.2.10.2 Determination of the Min and Max values 25 • 5.2.10.3 Theoretical and practical optimal quality 25 • 5.2.10.4 Prediction of the Printability 26 • 5.2.10.5 Judgement of the quality 26 • 5.2.10.6 After printing 27
6. A journey through six papers 28 6.1 The printing press parameter 28 6.2 The influence of the primary parameters 29 6.3 Deeper in the paper characteristics 30 6.4 A Flow diagram as directive line 31 6.5 Establishment of a “Printability coefficient” 32 6.6 The way back 33 7. Summary of results 35 7.1 Technical results 35 7.2 Results for the process 36 8. Discussion 36 8.1 The adjustments 37 8.2 Relevancy of the work 37 8.3 Proposition for further work 38

Laurent, Girard Leloup ∗ Royal Institute of Technology ∗ 2002 8
9. Conclusions 38 Acknowledgements 40 Literature cited and reviewed 41 Included Papers Paper I 48 Paper II 66 Paper III 82 Paper IV 102 Paper V 114 Paper VI 136

Laurent, Girard Leloup ∗ Royal Institute of Technology ∗ 2002 9
1. Introduction In spite of the appearance of a multitude of new information and communication technologies, the Graphics Arts are still one of the leading media support. This position is due to the variety of the products and the constant reaction to new requirements. High quality is today, in addition to the production speed and economical aspects, a must. Flexography, which is one of the most-used printing processes in the packaging industry, had also to raise the challenge to survive. The complete environment of flexography has been continuously the object of an evolution. The evolution has been so enormous and so rapid that it is here possible to speak about a real revolution at the printing industry scale. On one side, the paper industry worked on the structure and surface properties of the different substrates. On the other side, the suppliers of the printing industry concentrated their research on developing new gravure technologies for anilox rollers, new types of printing plates and mounting tapes, improving the sleeve technology, redesigning the printing presses, defining new ink formulations ... Today the professionals of the flexographic printing industry have at their disposition all the technical elements to be able to produce a very high and competitive quality. But they sometimes lose their way by navigating through the multitude of parameters. Why? Because they do not have the help of a structured method, of an instrument to objectively evaluate and compare the results achieved with different parameter combinations.

Laurent, Girard Leloup ∗ Royal Institute of Technology ∗ 2002 10
2. Background 2.1 State of the art The flexographic process, born under this name in 1952, has moved in the last years from a “marking process” to a “high qualitative printing process”. The development of the different components of the flexographic printing process has allowed an important improvement of the achievable quality. Today the flexographic process is the printing process that shows the largest rate of expansion. The previsions for the next years are also very optimistic. The years 2000-01 were strong for flexographic printing, as quality achievements impressed package buyers and, near the traditional flexographic products, more conversions from offset were noted (Armel, 2001). Computer-to-plate was most notable in this segment, providing a competitive tonal range and detail rendition. Flexographic printing with UV inks has matched offset printing in quality. 2.2 Identification of the problem However, and unfortunately, flexography, which strives to compete with the gravure and offset processes, is confronted with two main problems: the absence of standards (as they exist for the offset process) and the impossibility of previewing and measuring with objectivity the obtained quality. The lack of standards has inhibited progress in reaching more consistency from job to job and plant to plant, as well as the inability to predict results without costly makeovers. Moreover a minimum amount of systematic and disciplined training prevents companies from taking advantage of its equipment capabilities. 2.3 Aim of the thesis The present thesis will contribute to find a solution to the above-mentioned problems, which could be obstacles for the competitiveness of the flexographic process in the future. At the same time the work should be a step, a contribution, to a necessary standardisation of the flexographic process. The main objective of this research work is to make it possible to measure the printed quality in flexography and in a second step, to be able to predict the print quality without any trials before the achievement of the print. This quantification should take into consideration the interaction between the substrate characteristics and the printing parameters.

Laurent, Girard Leloup ∗ Royal Institute of Technology ∗ 2002 11
Therefore it is preferable to speak of measurement of the “Printability”. The method should be objective by eliminating the human judgement and the environmental factors which currently lead to interpretation and not to scientific measurement. To achieve these requirements of simplicity and objectivity, we need the help of a “key number”: In my investigations I have studied the relevancy of such a number I call the “Printability Coefficient”. The printability coefficient “P” is the final number resulting from the input into an equation of measured quality quantificators called quality factors, like density, mottling, edge sharpness, cleanliness of solid area, dot gain and dot deformation. The gain of the equation will result from different steps in the project. These steps can be seen as intermediate goals: study of the influence of the paper characteristics, study of the influence of the printing parameters and acquisition of the quality input parameters. The modelling of the print and modelling of the unprinted paper in view of printability will serve to establish the printability prediction procedure, which could be seen as the end product for the industry. The discussion I had with a technical expert summarizes the situation; his words: “Today we draw an arbitrary statement on the term “printability” and I am afraid that this is not a very scientific way of determining it. If you can directly give an absolute number to this very difficult to catch parameter, it would help us very much to get a better understanding.” 3. Definitions 3.1 What is flexography?
3.1.1 The official definition
“Flexography is a method of direct rotary printing that uses resilient relief image plates of rubber or photopolymer material. The plates are affixable to plate cylinders of various repeat lengths, inked by a cell-structured ink-metering roll, with or without a reverse-angle doctor blade, and carrying a fast drying fluid ink to plates that print onto virtually any substrate, absorbent or non-absorbent. Flexography is a rotary printing method, which means for every revolution of the printing plate cylinder, an image is produced.” (FFTA, 1999)

Laurent, Girard Leloup ∗ Royal Institute of Technology ∗ 2002 12
3.1.2 Advantages of flexography
• It can print on a wide variety of absorbent and non-absorbent substrates
• It uses fast-drying inks, whether solvent, water-based or ultraviolet (UV) curable ink
• It can print wet ink over dry ink to eliminate trapping problems, back-trap contamination and setoff
• It uses resilient rubber or photopolymer image carriers (printing plate) that can print millions of impressions
• Presses can accommodate a wide range of cylinder repeat lengths to match customer print length requirements. Flexography is a near total variable-repeat-length system
• Its inking system (anilox roller) can deliver a predetermined amount of ink with minimum on-press adjustments
• It can print continuous patterns (gift wrap, wallpaper, floor tiles) • It can print on extensible plastic films • It can print on the reverse side of stretchable, transparent films • It can perform coating and in-line laminating operations • It is cost effective for many applications • It enables fast turnaround time between jobs • It can do short-run work profitably • Presses can produce in-line, pressure sensitive labels in a
continuous operation • Presses can produce many types of projects requiring down line
finishing such as: die cutting, kiss cutting, scoring, perforating, embossing, hole punching, etc.
• The investment costs are lower than for the offset and gravure processes
• The achievable quality is continually growing and now matches the offset and gravure recognized qualities
3.1.3 Disadvantages of flexography
• It still shows some repeatability problems from order to order: the stability of the process is not yet equal to that of gravure
• It has difficulties with the reproduction of motives with continuous screen
• The plate making is time expensive • It is characterised by a large dot gain, which has to be
compensated for

Laurent, Girard Leloup ∗ Royal Institute of Technology ∗ 2002 13
• It has a tendency to halo around the text: this can be seen as a edge sharpness problem due to the elasticity of the printing form
• The large range of substrates and products confront the printer with a lot of different situations and problems to solve
3.2 The definition of “Printability” The word “printability” is the key concept of this thesis and it is also interesting to spend some time looking at its origins and to explain its significance. The noun “Printability” can be broken down into two parts: “print” and “ability”. A first and logical approach would give as definition “the ability to be printed”. The suffix “ability” comes from the Latin “abilitas” (14th century) and means capacity, fitness or tendency to act or be acted on in a specified way. To understand the meaning of “printability” it is necessary to confront the word to its industrial context. To get definitions that can be classified under the category “descriptive definitions”, an interesting survey* has been carried out and gives the following results to the question: “What is your definition of printability?” 3.2.1 Industrial experts Industrial experts are people working in the industry at a leading or research level. They have been selected for their diversity. The diversity must be understood as different sectors of the industry, countries, educations and age classes. “Printability is a term which describes the interaction between paper, ink and press from the paper’s point of view.” “A somewhat difficult question - define it along the lines of the digital workflow: A file to be printed is printable when 1. the file itself is processable in the environment under view and (not or) 2. the device for printing the file is able to fulfil the requirements as they are encrypted in the file and (not or) sooner or later 3. the digital environment around a device is able to process the job ticket as it is attached to the file. * A list of the interviewed experts can be found in the chapter “References”.

Laurent, Girard Leloup ∗ Royal Institute of Technology ∗ 2002 14
In future, to some degree the information-feedback strategy (how does the device communicate with controllers, servers, front end) will also be an issue which will be decisive on whether or not a file to be printed is printable.” “For me printability is a word for calibrating media source material for different quality printing output.” “Physical and chemical parameters that influence the transfer, setting and drying of inks on the substrate.” “Excellent question! Would like to see the answers.” I would like to explain printability starting with defining print quality in measurable variables as: 1) Register (Colour to colour and colour to structure); 2) Edge sharpness (this would cover the edges of bar codes but also dot's in half tone printing); 3) Colour (shade and variability in colour); 4) Cleanliness (dust spots in full tone area); 5) Mottling (random and pattern or stripiness in print related to the flutes of corrugated board); If we now look at printability of paper, we need to look at 2 to 5 and the paper properties that influence them. The measurable paper properties that can influence them are: a) Porosity (influences: 2, 3, 5); b) Colour (influences: 3); c) Surface energy (influences 2, 3); d) pH (influences: 2, 3); e) Dust (influences: 4) This might look too simple but use it as a start. I might have overlooked something.” “This is a tough one! I would probably define printability as: ...the measure of likelihood of being able (or not) to reproduce (print) the text or design in the colours selected or by the printing method chosen. Printer’s point of view “Printability is whether or not the printing ink will adhere to the stock/material being used in a satisfactory manner”.

Laurent, Girard Leloup ∗ Royal Institute of Technology ∗ 2002 15
Agency point of view “The suitability of the printing image and the paper/card/board to be printed on.” “Printability is a complex term but is influenced by several specific factors. These include surface topography (smoothness), compressibility, ink receptivity and holdout, ink vehicle absorption and dimensional stability. Of course each characteristic has its own complex set of variables. Sorry, but it is not so simple.” “Although we use the term on a daily basis I didn't really have a good clear definition for it. When you asked this question I started thinking how to define printability. I didn't come to a definition in terms of a mathematical or physical formulation but I thought along the lines of a more general definition: Printability is the ability to imitate life two-dimensional on paper and/or board. The better a picture or print represents its original life example in colour, sharpness, density, the better the printability.” “…to me is the ability of a print substrate to present the information (to be printed) so that it is perceived by the viewer to be “as” or “close to” the original; In the case where no original exists, you could perhaps say: perceived by the viewer to be “as” or “close to” what is supposed to be the original.” “The definition of printability is like asking where does your lap go when you stand up? I will look up some references in some text and would you please clarify what aspects of printability you are looking for? For instance, printability on a styrene soda bottle label is different from printability on a cosmetic box.” “Printability refers to the transfer of the ink onto the paper and corresponding processes. The main part of printability is the ability to achieve an even ink layer over the total image carrier in order to have a true image reproduction without faults, which will reduce the image quality. Printability deals also with the adhesion to the image carrier. Many factors affect printability, such as ink transfer in the printing press, ink transfer to the print carrier, ink setting and ink drying. Important quality aspects are: ink distribution, ink drying, image resolution, colour gamut, density range, dot gain, rub resistance. In short, one could say that printability is factors that influence the print quality.”

Laurent, Girard Leloup ∗ Royal Institute of Technology ∗ 2002 16
3.2.2 Pulp and Paper Association “The printability is how well the paper performs in a printing machine.” (Canadian Pulp and Paper Association) “Printability is a measure of the ability of a printing paper to provide a high quality printing medium. It has been found that print mottle, or the unevenness of print density, is the most important factor affecting printability” (Pulp and Paper Centre, Toronto) 3.2.3 Technical glossary / book “The combination of print quality characteristics that enhance the reproduction of an original in any printing process.” (Glossary of Graphic Communications) “That characteristic of a material, such as paper, which permits high quality printing, and which, though not capable of precise definition, is generally judged visually in terms of uniformity of colour of the printed areas, uniformity of ink transfer, quality of “black on white”, and rate of ink setting and drying. In paper, hardness, smoothness, opacity, colour, and pick resistance are some characteristics, which lend themselves to good printability.” (Bookbinding and the Conservation of Books, A dictionary of Descriptive Terminology) “A broad paper characteristic, which refers to a paper’s suitability for presswork.” (Glossary of paper terms, Southwestern Indian Polytechnic Institute) “Printability covers a range of paper properties affecting print results: gloss, smoothness, whiteness, opacity, etc.” (Print Process) “How well a paper performs with ink on press. Absorbency, smoothness, ink holdout, and opacity all affect printability.” (Paper Encyclopedia) 3.2.4 Printability definition in this thesis Reading the different definitions emphasises the disparity of the different definitions. The paper industry of course does not have the same definition as the IT industry, nor is it the same as the printing industry. However, these 3 industries (at least 2 of them) are working in a much confine connection. This observation justifies the necessity of an “own” or “work definition” to clarify the objective of the research. This
Laurent, Girard Leloup ∗ Royal Institute of Technology ∗ 2002 17
definition, which is also a stipulative one, will have to be accepted to understand and discuss the research work. The definition of printability I have chosen for this work is the following: “Achievable print quality resulting from the interaction between the critical properties of the substrate and the printing parameters” The main objective of the work is to give an objective measurement of the printability for the flexographic printing process. This objective measurement is nothing more than an operational definition of the printability. 4. Related Research 4.1 1988 … 2002 Some researchers already tried in the past to objectively quantify the printability. Some of them did that even specifically for the flexographic process. The common factor for all the research work is to take the substrate as the parameter for the study. The substrate, depending on the work, is characterised by one to a multitude of properties, like surface topography, absorption, porosity, optical properties, etc. Moreover, it is possible to distinguish different schools in the research approach. The classification can be done in two categories:
• By listing the variables considered in the study: the most common studied single correlation is the influence of the substrate properties by keeping other parameters constant (Zang, 1995), (Göttsching, 1997) and (Miller, 1997). A few papers regarding the ink have been published (Ginman, 1988), (Jensen, 1989), (Steadman, 1993). The influence of the printing pressure has also been studied as an independent factor (Pommice, 1989). Then we have a few publications taking into account, near the substrate, two or more other parameters. Lindström (1994) was looking at the printing speed and anilox roller contributions; Chalmers (1997) was taking into consideration both the ink and printing pressure factors. The most ambitious attempts, concerning the number of parameters have been realised by Aspler (1998) and Armel (2001) by analysing the same combination ink, printing plate and printing pressure.

Laurent, Girard Leloup ∗ Royal Institute of Technology ∗ 2002 18
• By looking at the chosen quality factors for the evaluation of the printed samples: in the same way as for the variables we can here note research using a single quality factor, the density (Chalmers, 1997), the mottling (Armel, 2002), the missing dots (Göttsching, 1997) or the unevenness (Miller, 1997). Lindström (1994) and Steadman (1993) were analysing the density and unevenness, Zang (1995) added the gloss whereas Pommice (1989) concentrated his work on dot gain and density. In the late 80’s, the Finnish school with Ginnman (1988) and Jensen (1989) developed a more global approach by looking simultaneously at the density, contrast, gloss, dot gain and unevenness of the printed samples. 10 years later, Aspler (1998) made a tentative with the mottling, bar code reading and dot gain quality factors.
A common method for the measurement of the substrate properties or the evaluation of the printing samples is to have recourse to the image analysis. It was also interesting to give a brief overview of this methodology. 4.2 Image analysis and the printing industry 4.2.1 Definition “Image analysis is a discipline, which takes two-dimensional data from a variety of sources, manipulates it and makes measurements on it” (I’Anson, 2001). This data is usually what could be described as a digital photograph obtained from a camera or a scanner. The images that are analysed are not continuous but are made up of large number of points. Each point, called a pixel, can take a value from a limited range, which describes its appearance. For the printing industry, this value is a grey level or a colour. The number of pixels in an image determines the resolution of the image. The range of values determines the limits for contrast and brightness. The way the printing and paper industry is working with image analysis is to remove all the unwanted information for the image, leaving the bits needed. The final result is often just a single number. 4.2.2 Hardware and software for image analysis The following list is not restrictive but should give an overview of the image analysis instrumentation and software available and usually implemented in the paper and printing industries:

Laurent, Girard Leloup ∗ Royal Institute of Technology ∗ 2002 19
Devices:
• Microscopy • Ultraviolet viewing systems • Infrared viewing systems • Image enhancement systems • Thin layer chromatography • High-pressure liquid chromatography • Gas chromatography • Scanning electron microscopy • X-Ray • Fluorescence spectrometry • Fourier transform infrared spectrophotometry
Software: • Standard image processing software • IDL • ImagePro • MBS
4.2.3 Measurable parameters Image analysis is a very helpful instrument for the paper and printing industries. The paper industry profiting from medical research has long used and contributed to the development of the technology. Some of the current utilisations of the image analysis:
• Dirt and ink particle measurement and counting • Filler distribution in paper • Density profile through paper thickness • Fibre length, coarseness • Fibre contact ratio • Fibre orientation • Formation and flocculation • Forming fabric, press felt, dryer fabric, press roll mark diagnosis • Paper machine CD relative shrinkage profile • Surface roughness • Curl of paper • Local gloss measurement • Calender blackening • Analysis of print mottle

Laurent, Girard Leloup ∗ Royal Institute of Technology ∗ 2002 20
• Measurement of dot deformation • Evaluation of optical dot gain • Edge sharpness determination (wicking, bleeding, etc.) • Missing dots
4.3 Visual perception The visual perception makes an attempt at a global quality statement, which corresponds to the definition of the printability retained for this research work. Lyne in 1979 already showed the way to follow by introducing the multidimensional scaling for the print quality; Aspler (1998) and his colleagues at PAPRICAN developed the method and looked at the correlation with the objective measurements. In the research, reference will be made to visual perception, and for better understanding of the work, a short description of what it returns is given here. Unconsciously, the perception of the visual scene can greatly affect mood and behaviour. The ability to characterise light, colour and appearance impinges on numerous aspects of the daily life and as a consequence, there is strong industrial interest in ensuring that these measurements can be made in such a way that they correlate to the visual perception (Lindberg, 2001). 4.3.1 Definition: From the optical point of view, the first stage in visual perception is the formation of an image on the retina. The quality of this image sets the limit on the quality of visual perception. The main factors that affect the quality of the retinal image are: Diffraction, spherical aberration, chromatic aberration and scatter (Thomson, 2002). In the quality control field, visual perception is a “human” instrument, which allows a subjective evaluation of the product quality. For the paper and printing industries, the products are printed samples and the criteria for the judgement parameters, like colour rendition, sharpness, mottle, contrast, etc.

Laurent, Girard Leloup ∗ Royal Institute of Technology ∗ 2002 21
4.3.2 Observation settings The visual perception is based on the observation of one selected and representative sample of each printed series. For the observation, the printed images are presented to the test panels mounted in standard daylight viewing equipment placed in an experimental room. The room is painted in a pale shade of grey, illuminated by daylight-simulating light tubes. The intensity of the light at the picture location is 2000 lux and over the table it varied from 1750 to 2000 lux. Normally, different paper qualities are used for the printing trials. In order to avoid the test panel judging similarity by comparing the unprinted, tinted edges of the picture, the samples were mounted without an unprinted edge surrounding the picture. The pictures are attached to a grey paper, Y-value 60, by means of corner slips, with two unprinted sheets of paper as backing. 4.3.3 Evaluation procedures a. The “Proscale” evaluation a.1 Definition Human psychological judgment has been computerized in Proscale. Proscale is a measurement technique and accompanying software tool. It offers a variety of techniques adapted to measuring paper and print quality. Proscale allows the user to obtain simple ratings of overall preference for a series of samples, as well as ratings on specific describable aspects of the samples. It also provides a method for obtaining multidimensional similarity and preference ratings from a sample set, for associating these measurements with physical measurement variables through regression and correlational techniques, and for averaging the results from replicated samples within the set. It provides a method of defining observer sub-groups whose judgments about the sample set differ (Donderi, 1999). a.2 Procedure The samples were spread out on a large table covered by a dark grey cloth. The purpose of the cloth was to neutralize the surroundings. D50 illumination, a spectral distribution of daylight that has a correlated colour temperature of 5000 Kelvin, is used for the test.

Laurent, Girard Leloup ∗ Royal Institute of Technology ∗ 2002 22
A test panel participated in the experiment. Everyone had normal or corrected to normal vision and had been tested for colour vision with a simple test The test panel was instructed to arrange the samples into groups with respect to their similarity in print quality so that each group had some characteristic in common that separated them from the other groups. The participants of the test panel were free to arrange as many groups as seemed appropriate. The groups were then assigned ratings corresponding to each participant’s perception of the quality of the samples in each group. As an attempt to understand the strategy behind the grouping, the participants of the test panel were asked to characterize each group of samples. Finally, the participants were requested to decide whether the samples could be considered acceptable to a buyer or a consumer. b. Opinion ratings All relevant print quality factors are, for practical reasons, interpreted by using some sort of common scale. When particular print impairments have been previously identified and defined, their magnitudes could be assessed on impairment scales. Studies allow finding the important dimensions. For an overview, see table 1. Each of these was put on an impairment scale of perceptibility and annoyance, employing nine level-dependent criteria ranging from ‘very annoying’ to ‘not perceptible’. Often the criterion of greatest interest is the overall quality itself. Therefore, jointly with the impairment scales, ‘overall quality’ was assessed along with the quality of ‘colour rendition, sharpness, contrast and detail rendering in shadows and highlights’. The quality scales had nine levels ranging from ‘unusable’ to ‘excellent’. Type of scale Scale levels Quality scales
Overall quality 9 levels, ‘unusable’ to ‘excellent’
Colour rendition 9 levels, ‘unusable’ to ‘excellent’
Sharpness 9 levels, ‘unusable’ to ‘excellent’
Contrast 9 levels, ‘unusable’ to ‘excellent’
Rendition of details in highlight 9 levels, ‘unusable’ to ‘excellent’
Rendition of details in shadow 9 levels, ‘unusable’ to ‘excellent’

Laurent, Girard Leloup ∗ Royal Institute of Technology ∗ 2002 23
Tone quality (smoothness of tone transitions)
9 levels, ‘unusable’ to ‘excellent’
Gloss level 9 levels, ‘unusable’ to ‘excellent’
Impairment Scales
Colour shift 9 levels ‘very annoying’ to ‘not perceptible’
Patchyness 9 levels ‘very annoying’ to ‘not perceptible’
Mottle 9 levels ‘very annoying’ to ‘not perceptible’
Ordered noise 9 levels ‘very annoying’ to ‘not perceptible’
Gloss unevenness 9 levels ‘very annoying’ to ‘not perceptible’
Table 1: Opinion rating scales. The room was equipped with standardized viewing conditions, the same as for the Proscale evaluation. Overhead lighting had a temperature of 5000 K and the illuminance was in accordance with the specification followed by the graphic industry. The participants of the test panel sat by the neutral grey table, described earlier, and had a pile of samples and the reference image placed on small tilted table. Each sample was taken one by one and compared to the reference images and ratings were entered directly on a computerized form. Ratings were given to each of the attributes compared to the reference image. The judges were encouraged to move and handle the samples as under normal reading conditions in order to get a good view of, for instance, gloss characteristics. A short training session was conducted before the actual session started. 5. Methodology and progression of the research 5.1 Methodology of the research The analysis of the market and trends took place at different levels of the paper and printing industries. A literature survey around the terms quality control, measurement, printability, print quality, flexography in different databases has covered a large part of the research field.

Laurent, Girard Leloup ∗ Royal Institute of Technology ∗ 2002 24
The results of the literature survey have been completed between 1999-2002 by:
• attending scientific conferences arranged by PIRA [Printing Industry Research Association], FTA [Flexographic Technical Association], STFI [Swedish Pulp and Paper Research Institute] or TAGA [Technical Association for the Graphic Arts].
• visiting paper mill production in Sweden (SCA, StoraEnso), Germany (StoraEnso) and Austria (Sappi), research sites in UK, Germany and Sweden and printing plants from several large companies (Å&R, TetraPak, Kobusch Folie, etc.). These visits gave the occasion to interview employees and experts of both paper and printing industries.
• Visiting fairs (DRUPA, PROFLEX, INFOFLEX, PrintPack, etc.), which offered the opportunity to contact the supplier industry. This opened the doors to companies like Bobst, Dupont, BASF, Praxair, ManRoland…
All these actions have allowed the identification of the major problems. The next step was the formulation of the question, which is at the same time the aim of the thesis: the relevancy of a “key number” to objectively quantify the printability in Flexography. The methodology of the research is the explanation of the way “to answer the question”. The way can be divided in several stages, which however can be carried out simultaneously. The different stages mostly interact together. To answer the question, it would be tried at several printing trials at different places both in Sweden and Germany. The variations of the printing conditions and materials corresponded to the objectives of the investigations (Papers I-III). To complete the printing trials, a calendaring would be achieved at the STFI (Paper III). Each printing trial was followed by an evaluation of the printed results to get the required numeric results and to prepare the next trials. The measurement part of the work has been carried out at different places, depending of the nature of the measurements and the equipment needed. Framkom [Research Corporation Media and Communication Technology], DFTA-TZ [Technology Centre of the German Flexographic Technical Association] and the paper labs of the paper industry are the more often used resources (Papers III & V). The link between the different actions will be described in detail in the next part, called research progression.
Laurent, Girard Leloup ∗ Royal Institute of Technology ∗ 2002 25
5.2 Research progression 5.2.1 Identification of the influence parameters The problem to be solved had a high grade of complexity. A detailed analysis was needed to first set the parameters, which could have an influence on the printability in flexography. Then it would be possible to simplify the problem environment. The question to answer corresponded in a certain way to building a bridge between the paper and printing industries and their customers. This bridge, the “Printability Coefficient”, should facilitate communication, decision-making and avoid conflicts. The parameters could be classified in three main categories, where only two of them have been analysed here. The first category was called “printing parameters” and contained all the materials, press and press peripheries involved in the flexographic printing process. The second category, called “paper characteristics” gathered the substrate properties, which primary influence the printability (Paper II). The third category, which will not be taken into account, is formed by the “human factors”. 5.2.2 Individual analysis of each parameter Each parameter has been the object of a detailed analysis. For the printing parameters, the analysis has been held in two steps: It has been distinguished between the variations within the manufacture tolerances and the absolute variations. The first type of variations could be seen as “done” variations and the user cannot influence them but must nevertheless consider them. The second type of variations represents the product range of the market for a special item. For the paper characteristics, the way has been different. First, a qualitative analysis has been realised, the goal for which was to identify the primary and secondary characteristics. The primary characteristics are usual and easy to measure characteristics. They influence directly the printability (Paper III). The secondary characteristics are subjacent and influence the printability only indirectly, by modifying the primary ones. The second step of the analysis was a quantitative study. The objective of both procedures was to look at the parameter’s relevancy and influence in the problem solving approach.

Laurent, Girard Leloup ∗ Royal Institute of Technology ∗ 2002 26
5.2.3 Description of the evaluation method The evaluation method for the printed samples has been adapted to the type of parameters to be analysed. However, all the methods were based on the same fundamental principle. The evaluation has been carried out with the help of the quality factors. The differentiation occurred by varying the nature and number of quality factors, like the mathematical instrument. Two mathematical tools have delivered the results: traditional statistical evaluation and Multivariate Data Analysis (MDA). The MDA has been employed to make comparisons, and with the help of the projection method, has allowed a graphical summarization of the results for a meaningful overview (Paper III). The main contribution of the MDA method was the elimination of the parameter “printing press”. The statistical instrument has help by the construction of the equation, the different modelling and the establishment of the printability prediction procedure. 5.2.4 Definition of the quality factors The quality factors (QF) are the heart of the flow diagram (figure 1), called printability system. The QF are the inputs of the equation to calculate the “Printability Coefficient” in the measurement way of the system and at the same time the “blind” intermediate calculators in the printability prediction procedure. They have been selected in accordance to their relevancy for the flexographic process. The relevancy itself has been the object of a double check. It indeed goes through the subjective judgement of expert and non-expert panels and the objectivity of measurements and statistical analysis (Paper V). The quality factors retained for the establishment of the equation are the following: density, dot deformation, dot gain, edge sharpness and mottling.

Laurent, Girard Leloup ∗ Royal Institute of Technology ∗ 2002 27
Figure 1: A Flow diagram: “The Printability system”
By varying the combinations of the printing parameters and paper characteristics, printing trials has been carried out. The results of the printing trials were a series of printing samples. The printing samples were in the next step evaluated with the help of a measurement tool. The quality factors were obtained at this stage. The quality factors were the input of the Pi equations, which has been established in parallel (Paper V). The output of these equations (P9 and P10) is the “Printability Coefficient”. The measured quality factors and row data from the printed samples allowed in a second step (Paper VI) to model the print and the substrate. These modellings are used in the prediction procedure to jump over the
Printingparameters
Paper characteristics
Printing Trials
Modelingof the print
Modelingof the
substrate
Printed samples
Measurement tool
Quality
Factors
” P ””Printability Coefficient”
Laurent, Girard Leloup ∗ Royal Institute of Technology ∗ 2002 28
costs and time expensive printing trials and quality factors measurement stages. 5.2.5 Determination of the influence of each parameter Each parameter has been analysed by its characterising properties. The influence of the parameter has been determined by choosing materials (substrates and periphery equipments) covering a large range of the products available on the market. To guaranty the relevancy of the results, the combinations have been chosen, such as the variations of the values for the quality factors that show great amplitudes. Systematic printing trials (Papers III and V) with variation of one parameter, keeping the other constant, are allowed to test the influence. 5.2.6 Acquisition of the evaluation methodology The acquisition of the evaluation methodology comported two parts. The first part was a theoretical contribution. It corresponds to the development of the flow diagram. The flow diagram represents the strategy for the evaluation work (Paper IV). The second part was the selection of the methodology or devices to get the values of the quality factors. The quality factors are common and recognised factors in the quality control sector of the printing industry. Moreover the lack of a standard gives the user the freedom to choose his measuring methods. For the density and the dot gain, the use of a densitometer is synonymous with a standard method. The densitometer measures the density and calculates the total (geometrical + optical) dot gain with the help of the Murray-Davies formula. The mottling, edge sharpness and dot deformation quality factors do not lay out of spread portable device in the paper or printing industry. To quantify this factor the industry resorts with the image analysis technology. This has also been the case in this project. More information about image analysis can be found in the chapter 4.1. 5.2.7 Establishment of a “Printability Coefficient” The establishment of a “Printability Coefficient” for the flexography process has been realised in successive stages. The first stage was to find the best linear combination of the measured quality factors (QF). The linear combination had to contain at least all the previously selected quality factors and fit with the visual perception values (VP).

Laurent, Girard Leloup ∗ Royal Institute of Technology ∗ 2002 29
The VP -quality was evaluated for the flexographic samples by expert and non-expert panels. More details about VP have been done in chapter 4.2. The goal was to obtain an equation valid for the flexographic process by minimising the distance between the values of both printability (measured/calculated and visual) but at the same time keeping the shape of the printability curves parallel for the other printing processes (Paper V). 5.2.8 Test of the relevancy of the equation To test the relevancy of the equation, another data series (52 different combinations) specific for the flexography has been confronted to the best two equations. The ranking given by the equations has been attentively observed and analysed by experts. The analysis comported two parts: a visual judgment of the quality and a study of the partial quality factors rankings. The validation of the equations for non-absorbent substrate has been successfully led. The equations were also retained for the next stage, which is the elaboration of the prediction procedure. 5.2.9 Modelling The objective of the modelling was the achievement of the second part of the research. The measurement of the printability was the result of the first part. The gain of a “Printability Coefficient” and consequently of an objective and reproducible evaluation is a big step. However, the method requires printing trials and measurement operations. This makes the method time and cost expensive and only adapted for a production quality control. The method is not adapted for decision-makers or comparison studies. For these kinds of problems, the modelling has been the instrument allowing the establishment of a prediction procedure. 5.2.9.1 Modelling of the printing parameters The modelling of the hardness of the printing plate, the pressure at the plate/substrate nip and of the anilox roller volume took place in two stages. The first one was to look at the influence in percent of the primary parameters on the QF. Then, the corresponding influence of the final “Printability Coefficient” was calculated by transitivity. The variation range was divided in unit variation and the modelling was done for this unit. A scale was created to judge the degree of importance in the modelling.

Laurent, Girard Leloup ∗ Royal Institute of Technology ∗ 2002 30
5.2.9.2 Modelling of the paper characteristics The modelling of the paper density, surface roughness, absorption and porosity followed the same construction as the modelling of the printing parameters. The choice of these characteristic resulted from two criteria: the characteristics had to be standard parameters each paper supplier is able to provide in the paper delivery protocol, and the influence of the printability is great for the flexographic process (Papers III and VI). 5.2.10 Establishment of a procedure for the prediction of the Printability The procedure should be seen as a conclusion of the research work and at the same time as a manual for the user: “How can I get a value for “P”?”. The establishment of the procedure followed a logical process. The first steps are necessary for the construction and understanding of the procedure but not to use it. The central part is the prediction itself. The judgement and “after printing” parts are the analysis steps (Paper VI). 5.2.10.1 Definition of a reference To be able to predict the printability without any printing trials (see flow diagram), it was necessary to define a reference. This reference has been calculated by giving the quality factors the mean values for both the printing and paper parameters. The reference is called P average, noted Pav and will not directly be used in the numeric interpretation. It is a graphic instrument (fig. 2). 5.2.10.2 Determination of the Min and Max values for P The Min and Max values for P will allow the user to roughly locate the quality of the printing and paper parameter combinations she/he has simulated and calculated the “Printability Coefficient” for. It is also a control to detect eventual errors by calculating: the calculated values included have to be between Pmin and Pmax! 5.2.10.3 Theoretical and practical optimal quality The theoretical achievable quality is the quality calculated in the preceding chapter (Pmin and Pmax): 7 and 4 respectively for the printability equations P9 and P10 (Paper VI). Moreover, the process has certain limitations and tolerances, which have to be reflected in the judgement. These limitations will reduce the interval of variation for “P” and centre the mean value of Pa v. This new value for P will be fixed as goal for the

Laurent, Girard Leloup ∗ Royal Institute of Technology ∗ 2002 31
user: Pg. The correction is effectuated by considering the tolerances for the quality factors (Paper VI). 5.2.10.4 Prediction of the Printability The next and last step of the prediction is to make the calculation of the prediction values for “P” (Pp). For the calculation, the user needs to know or choose values for the printing parameters and paper characteristics he is going to use. These values (xi) are the input for the evaluation of the deviation to the standard values (a i). The standard values are the values used in the research work to get the modelling and establish Pav, the constant factor in the Pp calculation. The deviation obtained will then be divided by the unit coefficient (c i) and multiply by (fi), the, in percent, influence coefficient. The (a i), (c i) and (fi) values are values resulting from the research (Paper VI). The user has these values at his disposition, which are constant. The sum of the i indexes of the results for the different (xi) will be called “p” (small p). Pp is then the result of the multiplication of p by the average value of P (Pav). Pp is also the “solution value”!
p = ∑ {[ (xi - ai) / ci] * fi}
Pp = Pav * (p/100 +1)
5.2.10.5 Judgement of the quality The limits for P are now known: Pmin (0) and Pmax (4,8) theoretical values. The centre of the variation interval will be considered as “at least to achieve quality” (Pg) for the prediction stage. The figure 2 is a proposition for a graphic representation of the different Pp calculated. The representation allows a rapid and easy interpretation of the results. The centre of the figure is the “low quality” area and the contour the “high quality” area. The geometry of the figure varies with the number of simulations (Pp) plotted (in the represented case an heptagon for the 7 predictions). The points located in the area between Pg and Pmax are the points researched. The Pp points are the points for the calculated (with the

Laurent, Girard Leloup ∗ Royal Institute of Technology ∗ 2002 32
procedure described in 6.10.4) printability and the Pm points are the measured (on printed samples with input of the quality factors in a Pi equation) printability.
0,00
5,00
1
2
3
45
6
7
Pp Pm Pav
Pmin Pmax Pg
Figure 2: Visualisation of the Printability for different calculated Pp
5.2.10.6 After printing The last step of the procedure takes place after the printing stage. To personalize the Pp the user has the possibility to calculate a ∆P, which will give him an idea of the accuracy of his prediction. The ∆P can be used to adjust the fi to his production more precisely with an iterative procedure. Thus, the user can better fit the technical parameters, the tolerances as well as indirectly the skill of the personnel for his company.
∆P = Pp – Pm
Pm is with the P9 or P10 equations measured “Printability Coefficient”.
Laurent, Girard Leloup ∗ Royal Institute of Technology ∗ 2002 33
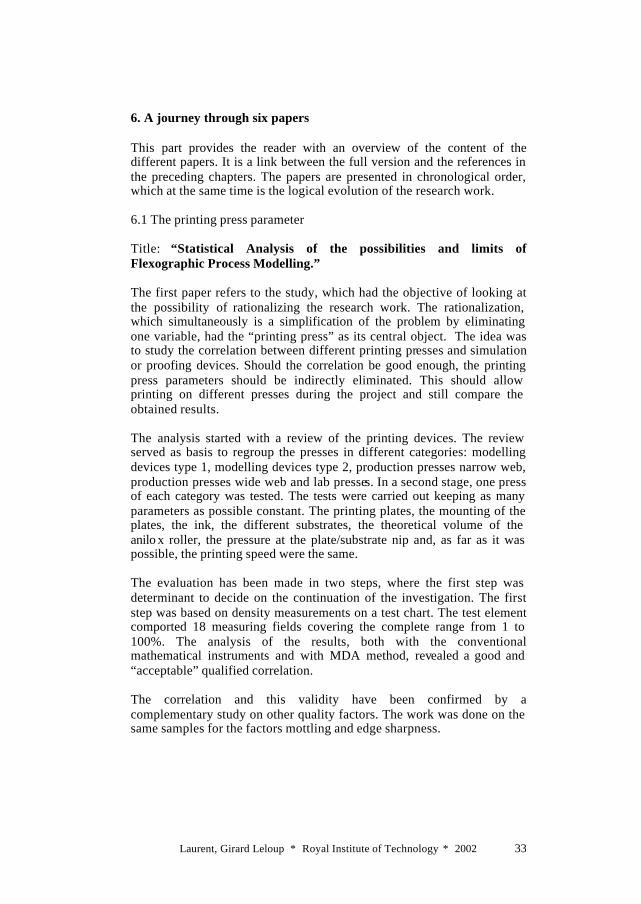
6. A journey through six papers This part provides the reader with an overview of the content of the different papers. It is a link between the full version and the references in the preceding chapters. The papers are presented in chronological order, which at the same time is the logical evolution of the research work. 6.1 The printing press parameter Title: “Statistical Analysis of the possibilities and limits of Flexographic Process Modelling.” The first paper refers to the study, which had the objective of looking at the possibility of rationalizing the research work. The rationalization, which simultaneously is a simplification of the problem by eliminating one variable, had the “printing press” as its central object. The idea was to study the correlation between different printing presses and simulation or proofing devices. Should the correlation be good enough, the printing press parameters should be indirectly eliminated. This should allow printing on different presses during the project and still compare the obtained results. The analysis started with a review of the printing devices. The review served as basis to regroup the presses in different categories: modelling devices type 1, modelling devices type 2, production presses narrow web, production presses wide web and lab presses. In a second stage, one press of each category was tested. The tests were carried out keeping as many parameters as possible constant. The printing plates, the mounting of the plates, the ink, the different substrates, the theoretical volume of the anilo x roller, the pressure at the plate/substrate nip and, as far as it was possible, the printing speed were the same. The evaluation has been made in two steps, where the first step was determinant to decide on the continuation of the investigation. The first step was based on density measurements on a test chart. The test element comported 18 measuring fields covering the complete range from 1 to 100%. The analysis of the results, both with the conventional mathematical instruments and with MDA method, revealed a good and “acceptable” qualified correlation. The correlation and this validity have been confirmed by a complementary study on other quality factors. The work was done on the same samples for the factors mottling and edge sharpness.

Laurent, Girard Leloup ∗ Royal Institute of Technology ∗ 2002 34
6.2 The influence of the primary parameters Title: “Analysis of the correlation between the print quality required in Flexography and the tolerances in materials and paper manufacturing in terms of printability.” The printing press was the central object of the first paper. The analysis in the second paper took into account the materials and peripheries of the flexographic process. In the same way it was possible to speak about tolerances in press manufacturing, the variations and tolerances in materials have been analysed. For the printing parameters, the analysis covered the tolerance in the material manufacturing. The manufacturing tolerances are the tolerances given by the supplier at material delivery and are not to be confused with the variation of the parameters. It is indeed not the same to get different results due to the use of two different materials and to get different results due to tolerances in the same material. The evaluation was done in two stages. The first stage was a control of the tolerances given by the different suppliers. The second stage was to choose materials at the extremities of the intervals and to obtain a numeric evaluation of the projected tolerance intervals for parameters like density or dot gain. For the paper characteristics, the work was more critical. The paper industry is more “reserved” to fix production tolerances. The range is very large and the explanation to justify this fact is: “We are manufacturing the paper on-demand!” Moreover, it was possible to proceed to a qualitative analysis for each separate characteristic and to obtain a quantitative evaluation of the global influence. The tolerances are given and can normally not be reduced by the user. The study has shown the non-negligible influence of very small variations within the tolerances. It is also necessary not to forget that these tolerances and their consequences can, in the worst case, be added. The analysis resulted in a very strong control of the material for the rest of the research work and the advice to the industry to proceed in the same way.

Laurent, Girard Leloup ∗ Royal Institute of Technology ∗ 2002 35
6.3 Deeper in the paper characteristics Title: “Study of paper printability in flexography by controlled variation of the surface roughness.” The idea of the third paper was to study more precisely the influence of the paper characteristics on the printability. At this stage of the work, the equation was not yet available, but the different quality factors were known. The printing substrate, paper or board, is a complicated subject. The multiple interactions between the different characteristics do not make the study easy: it has also been decided to work on one parameter. For practical and technical reasons, the retained parameter was the surface roughness. The control of the surface roughness was obtained by calendaring the substrate at different predetermined defined levels. The control measurements were effectuated following the Bendtsen method. The precision of the method could be discussed, but was appropriated in this case due to the large range it offers and the intervals selected. The influence was quantified and analysed separately for each quality factor. The results show significant variations for the successive calendaring levels. A better surface quality is, for all the quality factors except for solid area mottling, synonymous with an improvement of the quality factor measured and, consequently, of the general printability. The results were presented in a numeric and as well a graphic form resulting from a multivariate data analysis. Both are correlated. The surface roughness was the fixed parameter in this study, but the other paper characteristics, like density, absorption or porosity, have also been evaluated and will serve to determine the contribution of the surface roughness in the noted improvement of the printability.

Laurent, Girard Leloup ∗ Royal Institute of Technology ∗ 2002 36
6.4 A Flow diagram as directive line Title: ”A Flex-Odyssey…” To be able to understand the theory behind the numbers and particularly behind the “Printability Coefficient”, it happened at this stage of the research to be necessary to reveal and explain the flow diagram, which the research is based on. The title of the paper reflects the course flexography has followed the last 50 years. Flexography is today a high quality printing process, which strives after a standardisation and needs therefore tools like the “Printability Coefficient”. The paper should present the flow diagram by answering two fundamentals questions. The first question was: How to read the flow diagram? The diagram has two entries. Depending from the utilisation calculation / prediction or measurement, the level of entry is different. Whereas in the prediction case, the inputs are the printing parameters and the paper characteristics, in the measurement “modus” the inputs are the measured quality factors. The output is in both cases a value of “P”; called respectively Pp and Pm. Due to their roles in both procedures, the quality factors are qualified as “heart of the flow diagram”. The second question was: What is the contribution of each box in the diagram? By contribution, it is to be understood both the content and the functionality of the box. The content of the box described the nature and properties of the elements contained in the box. The functionality of the box is a definition of the interaction potential of the content of the box with the other boxes of the flow diagram. The paper was a kind of platform to give the reader a simultaneous summary of the work already done, an indication of the future work and present the global strategy of the project. The flow diagram and the answers to the two questions are the main results of this paper. The missing answer is the answer to the question “How to use it?” This will be the object of the final part of the work.

Laurent, Girard Leloup ∗ Royal Institute of Technology ∗ 2002 37
6.5 Establishment of a “Printability coefficient” Title: “Establishment and Comparison of Different Definitions and Equations for a “Printability Coefficient” for the Flexographic Process.” The work done in the first part of the research and reported in the four preceding papers gave all the data and information to start the modelling. In this paper, the establishment of different equations for a “Printability Coefficient” are presented. The construction has been realised in successive steps. The first step was the collection and handling of the visual perception data. The visual perception data served as a skeleton for the construction of “P”. The goal was not to fit the visual perception values with a complicated equation but to take into account the data and use them to adjust the equation. It was indeed decided from the beginning to look at linear combinations of quality factors. This decision was based on two factors. The quality factors are measurement and can be seen as secondary parameters where the non-linear dependency is already eliminated. The equation should be as simple as possible due to the finality of the final product: an instrument for the industry and not only for the research. After the handling of the data, several equations were tested for all the printing processes. The equation was progressively improved to simultaneously respect the profile of the visual perception values for all the processes and reduce the distance between the objective and subjective values. During this stage of the work, by eliminating the certain negligible quality factors, a simplified and adapted equation for the flexographic process was established. To be sure of the credibility of the equation, the equation was confronted with a new data series. The results were encouraging. The flexography disposes on a global and objective quality control instrument. This is however not the final result of the project and the research will be continued to the next phase. The goal is a prediction of the printability.

Laurent, Girard Leloup ∗ Royal Institute of Technology ∗ 2002 38
6.6 The way back Title: “Prediction of the Substrate Printability in Flexography by using a new established Printability Coefficient.” The stage reached corresponds to the bottom of the flow diagram. The results presented prior to this paper allow the calculation of a “Printability Coeffic ient”. The result however, is not satisfying for an industry where the time and cost aspects play a central role. The industry needs an instrument to save time and only a prediction of the printability without any trials can answer the demand. The last stage of the research project was thus devoted to the development of a prediction procedure for the printability. The previously established and verified equations for the printability were the fundament of the work. With the help of the equations, the influence of the quality factors on the “Printability Coefficient” were analysed and quantified. The quantification was characterized in percentage of a “P unit”. The next step was to look at the influence of the primary parameters, both printing parameters and paper characteristics variations onto the quality factors variations. The calculation was done for the total variation range of the different parameters and then reduced to a “united result” in percentage. With the two precedent results and the definition of units (c i), it was also possible to calculate first the partial and then the global influence, in percentage of “P units”, of each primary parameters onto the final “Printability Coefficient”. The result of the calculation is called unit influence coefficient and indicated with fi. The discussion part of the paper should answer the question “How to use the Printability Coefficient?” The user of the “Printability Coefficient” needs some references to be able to compare his primary parameters. The references were fixed as the mean values of the parameters used in the research work. The calculation of the distance of the user’s values (xi) to the references values (a i) will then be the first step of the calculation procedure. The obtained values will be divided by the defined units (c i) and then multiplied by fi, the unit influence coefficient. The sum on the index i is called “p”.
p = ∑ {[ (xi - ai) / ci ] * fi}

Laurent, Girard Leloup ∗ Royal Institute of Technology ∗ 2002 39
The predicted “Printability Coefficient”, Pp is also the result of the multiplication of Pav (average of “P”) by (p/100 +1).
Pp = Pav * (p/100 +1)
The calculation of “P” is not sufficient to make a judgement of the quality. The user needs a scale to be able to locate the values he has calculated. The results can be confronted to the absolute quality or theoretical optimal quality but it is more interesting to compare the Pp values to the practical optimal quality. The centre of the variation interval will then be defined as “at least to achieve quality” and called Pg. As final consideration, the Pp points located in the area between Pg and Pmax are the points researched.

Laurent, Girard Leloup ∗ Royal Institute of Technology ∗ 2002 40
7. Summary of results The research carried out and the experience acquired during the management of the project have led to results of different natures. The results should profit to both the research field and the printing and paper industries. Some results are solutions to a well-known problem and can be applied as presented; other results are ideas or partial solutions, which must be adapted before the implementation. 7.1 Technical results The technical results are principally the results obtained in the first part of the project where the variables have been tested separately. They are from different natures: results for the project itself or for further research works, results for the flexographic industry and results for the final users. The principal technical results of the research can be resumed in the following points:
• Correlation exists between the overall quality of the different flexographic printing presses used in the production and the modelling devices (Paper I).
• IGT F1 is, as a modelling device, a “standard” instrument in the research world. The IGT is not the only construction on the market, but, by respecting certain conditions, delivers satisfying results, which can serve as start for further, more deeper investigations: a good compromise (Papers I and II).
• The tolerances in material are not to be underestimated: a receiving control can avoid trouble-shooting and save a lot of time and money (Paper II)!
• An improvement of the paper surface roughness significantly affects the printability. The influence is both direct, due to the better surface, but also indirect, by modification of other parameters like density or porosity of the substrate (Paper III).
• The Multivariate Data Analysis (MDA) is an instrument to get a visual and fast overview of measurement data that can be used in certain situations with acceptable results (Paper III).
• Mottling definition and measurement is a research project itself. Different kinds and definition of mottling, different methods to measure it coexist and the industry needs the establishment of a standard.
• The flow diagram of figure 1 can help the user in the decision-making action. The flow diagram is at the same time the map of

Laurent, Girard Leloup ∗ Royal Institute of Technology ∗ 2002 41
the project, the representation of the decision process and the support of the explanation for the printability prediction procedure (Paper IV).
7.2 Results for the process These results can be seen as the contribution of the research work to the standardisation of the flexographic process. They are at the same time global and final results with a direct application in the paper and printing industrial worlds.
• It has been shown that an objective quantification of the printability is credible. This quantification is an instrument for the quality control. The objective quantification shows a strong positive correlation with the ranking and scale of the subjective quantification (visual perception) (Paper V).
• Equations are at disposal to numerically calculate the values for the quantification: the “Printability Coefficient” (Paper V).
• A modelling of the printing parameters and of the paper characteristics via the quality factors is the basis of the printability prediction (Paper VI).
• A procedure for calculating “Pp” has been developed and the final user has the possibility to use it as is or adapt it to his own environment (Paper VI).
8. Discussion The objective of the discussion part is to give the reader an instrument to be able to judge of the quality and relevancy of the work. The reflection should allow the reader to know how to use the results, how to profit from them and eventually how to complete them. The planed work was an ambitious project, according to the statements from different experts. It represented a new approach to the quality control in the flexographic process. The research works achieved and published around the world before this research had the main objective of studying one or several quality parameters or quality factors in detail and the final results were helpful for one part of the industry. It was not a question of a universal communication instrument. This work had the ambition of establishing a technical and objective language between different industries and level of users. As all “new products”, some

Laurent, Girard Leloup ∗ Royal Institute of Technology ∗ 2002 42
adjustments occurred during the research and further adjustments are probably necessary for the generalisation of the utilisation. 8.1 The adjustments The first adjustment, which could be seen as a restriction of the original work ambition, is that the project “only” delivers procedures for the measurement and the prediction of the printability and is not a complete tool, as the end user could wish. The decision not to include the measurement device in the final result was taken at an early stage of the research. After an analysis of the market and contact with different suppliers and developers, it has been clear that different measuring devices for the quality factors are spread in the industry and that to fix the utilisation of a specific one could have limited the universality of the results. Moreover, standards for all the quality factors do not exist and the work could not wait for the establishment of standards. The second adjustment is the choice of the printing parameters and paper characteristics. Of course the choice is the consequence of several interviews and a scientific analysis of the parameters, but it could appear that, for a specific production, one or more parameters have to be added or removed. The structure of the results with the delivery of flexible procedures allows the adaptation of the results. In this case, the research work final results are a support for the final user to develop his own procedure. 8.2 Relevancy of the work It is difficult to compare the results with results of preceding works due to the lack of research in this specific area. The high quality flexography is a new actor in the packaging industry and the reference for quality control in the past had to be adapted. Moreover, a study of what has been done in the printing industry shows very few similar works, which there should be for other printing processes. It is also probably the first major result and innovation of this work: a new approach to quality control, more global, more communicative and more final user and industry-oriented. The relevancy of the work for the industry is justified by responding the requirements of modern life:
• Credibility: The “Printability Coefficient” is a new quality control instrument based on a scientific approach,

Laurent, Girard Leloup ∗ Royal Institute of Technology ∗ 2002 43
• Objectivity: A key number (P), and only one, can objectively quantify the global quality of the printed result in flexography,
• Reality: The proposed number correlates with the visual perception evaluation
• Economy: The prediction procedure eliminates the cost expensive printing trials stage
• Simplicity: No need of complicated devices or high level of education
The establishment of a key number is a necessary and important step to a standardisation of the flexographic process. 8.3 Proposition for further work The work done has shown the way to be followed and should be completed by a systematic application of the procedures for different productions. In this way, the different needed adjustments will “polish” the procedures. In a next step, the problem can also be extended to the flexible packaging industry, where the flexography is very present. It can also relatively easily lead to the development of software, which could be distributed by the different suppliers of the paper and printing industries. A possibility should be to offer the customers the prediction of a n e-service on the net: “Log in, enter your specific parameters, we calculate the printability with our own product range”. 9. Conclusions As conclusions to the research work it, seems important to remember the main results and to give the future users the last advice for good usage of the “Printability Coefficient”. At this stage, it is time to give the future users the last recommendations. Before printing, the users dispose of two equations to calculate the predicted printability (Pp). Depending of the precision and goal of the calculation, the user will choose the influence coefficient (f i) corresponding to P10 for a global approach or to P9 for a more detailed one. After printing, the user will be able to measure the printability (Pm) by measuring the quality factors. The next step will be, with the help of Pp and Pm, the calculation of ∆P. The comparison between the ∆P value and the predefined tolerance will help the user to personalize his printability coefficient and achieve standards.

Laurent, Girard Leloup ∗ Royal Institute of Technology ∗ 2002 44
As a basis of the research, the credibility of a key number has been discussed. The characterisation of the significance behind the number has been delimited by giving the printability a definition. Starting from this definition, the architecture of the work, an equation has been built. The equation was a partial result and represents the body of the printability house. The testing and adjustment of the equation gave it the furniture. The establishment of the prediction procedure completed the work by delivering the key of the global quality control in flexography to the user.

Laurent, Girard Leloup ∗ Royal Institute of Technology ∗ 2002 45
Acknowledgements I would like to express my sincere gratitude to a few persons who, during the last past years, gave me opportunities, facilities, motivation, support or love. Respecting this sequence, I would like to start by thanking Anders Bovin and Prof. Nils Enlund for their engagement, making my study in Sweden possible. I would like to continue by thanking the IMT / Framkom management for the technical support. I formulate a special thanks to the colleagues, who helped with my integration at the institute and in the “cold” Sweden. I do not want to forget the “Hochschule der Medien” in Stuttgart for its contribution in the final phase of my work. An industrial work without industrial partners could not have been possible. Therefore a particular “tack” to the companies that supported my work by delivering materials, answering questions, making visits possible… taking time in participating in my project. Finally, I would like to thank particularly my near family for all kinds of support. They were close to me during the last year for Tanja, the last years for my brother Quentin and all my long adventure until this 7th of June 2002 for my parents Marc and Marie-Claude Leloup.

Laurent, Girard Leloup ∗ Royal Institute of Technology ∗ 2002 46
Literature cited and reviewed Armel, D., Cusdin, G. (2001) “ Plates & Printability ” – FQC FLEXO 04/2001 Aspler, J., Byron, J.,Zang, H. and Nguyen, N., (1998) “Print Quality of Linerboard in Commercial Water-based Flexography” - TAGA 98 proceedings, pp. 749-774 Bichard, W. (1992) “The Inter-relationship among Air-Leak Roughness / Smoothness Methods” - Pulp and Paper Canada, N. 93(6), pp. 147-152 Bookbinding and the Conservation of Books, A dictionary of Descriptive Terminology http://palimpsest.stanford.edu/don/dt/dt2682.html Chabut, F., Girard Leloup, L. (2000) “Influence of the printing press and paper surface roughness onto the printability for the Flexographic Process” - Projet de Fin d’Etudes - EFPG (F) Chalmers, I.R. (1997) “Flexographic printability of packaging grade papers” – Appita’97, pp. 335-341 Donderi, D.C., Aspler, J. (1999) ”Proscale: a fast new way to measure subjective print and paper quality” – Preprint of PAPTAC Annual Meeting, Montreal, pg. B241 Foundation of Flexographic Technical Association, Inc. (1999) “Flexography: Principle & Practices, 5th Edition” Ginman, R. and Tiainen P.-R., (1988) “Requirements of the flexographic printing process on wrapping paper and packaging board” - Adv. Print. Sci. Techno, N. 19, pp. 210-227 Girard Leloup, L. (2000) “Analysis of the correlation between the print quality required in Flexography and the tolerances in materials and paper manufacturing in terms of printability.” - FFTA Y2K Forum - Orlando (USA)

Laurent, Girard Leloup ∗ Royal Institute of Technology ∗ 2002 47
Girard Leloup, L. (2000) “Statistical Analysis of the possibilities and limits of Flexographic Process Modelling.” - TAGA 2000 - Colorado Springs (USA)
Girard Leloup, L. (2000) “Study of paper printability in flexography by controlled variation of the surface roughness.” - IARIGAI 2000 - Graz (A) Girard Leloup, L. (2001) “Es tablishment and Comparison of Different Definitions and Equations for a “Printability Coefficient” for the Flexographic Process.” – TAGA 2001 – San Diego (USA) Girard Leloup, L. (2001) “A Flex-Odyssey…” - FFTA Forum 2001 – Nashville (USA) Girard Leloup, L. (2002) “Prediction of the Substrate Printability in Flexography by using a new established Printability Coefficient.” – APPITA 2002 - Rotorua (NZ) Glossary of Graphic Communications - “Definition of Printability” Glossary of paper terms, Southwestern Indian Polytechnic Institute http://native.sipi.bia.edu/ Göttsching, Prof. Dr.-Ing. Dr.H.C.L., Ness, Dr.-Ing. C. (1997) “Two-Dimensional Characterisation on the Surface of Paper with reference to its Printability” – Institute für Papierfabrikation, Darmstadt (D), EU Publication COST E11 I’Anson, S.J. (2001) ”The fundamental of digital image analysis and its application to paper and board making problems” – http://pygarg.ps.umist.ac.uk/ianson Jensen, K.W. (1989) “Flexo Printability of Coated White-Top Liner with Consideration of Convertability” - Graphic Arts in Finland N. 18, pp. 14-20 Karcz, J.P. (1998) “Pinpoint Those Printing Problems” – Paperboarb Packaging (08/98), pp. 32-34

Laurent, Girard Leloup ∗ Royal Institute of Technology ∗ 2002 48
Lagerstedt, P., Kolseth, P. “Influence of Surface Energetics on Ink Transfer in Flexo Printing” – STFI, Stockholm, Sweden Lindström, C., Dölling, R., Poustis, J. “Evaluating the printability of liner board for flexography” - Paper Technology (10/94), pp. 38-41 Lyne, M.B. (1979) ”Multidimensional scaling of print quality” – Tappi Journal (11/79), pp. 103-107 Meyer, Prof. K.H. (1996) “Toleranzen in der Druckabwicklung und deren Auswirkung” – DFTA-TZ Miller, B.W. (1997) “Determining printability of liner-board manufactured for postprint converters using water-based flexographic ink” – 1997 Process & Product Quality Conference & Trade Fair, pp. 135-138 “Minutes” - Paptac Printing and Graphic Arts Committee Meeting – 10/1998 – Québec (Canada) Murray-Davies equation: FD = [1-10(-DR)] / [1-10-(DV)] , DR is the halftone density and DV the solid tone density Paper encyclopedia http://graphics.tech.uh.edu/Costing/Paperencyclopedia.pdf Plowman, N. (1991) “Ink gloss mottle, Graphic Arts Monthly” - vol 63, N.5, pp.122-125 Pommice, J.C., Poustis, J., Lalanne, F. “Testing the printability of board for flexography” – Paper Technology (11/89), pp. 22-24 Print Process – www.printprocess.net “Provtryckning 2000” DPC-FRAMKOM-STFI Research project (Sweden) Steadman, R., Woodall M. and Lesniak M. (1993) “The flexographic printability of linerboard” - Appita’93, pp. 629-637

Laurent, Girard Leloup ∗ Royal Institute of Technology ∗ 2002 49
Thomson, D. (2002) “Image formation in the eye” – http://www.city.ac.uk/optics/visual perception/ Zang, Y.H., Aspler, J.S. (1995) “Factors that affect the flexographic printability of linerboards” – Tappi Journal (10/95), pp. 23-33
List of the experts, who participated at the survey “Definition of printability”: Dijkstra, G.(WXS); Has, M. (OCE); Incontrao, R. (NAPIM); Knudsen, C. (KTH); Lie, C. (KTH); Lindholm, G. (Tumbabruk), Lindström, M. (IMT); Olsson, M. (Framkom); Parker, S. (Kalamazoo Paper Chemicals); Streefland, W. (SCA Research); Wagner, L. (3M).

Laurent, Girard Leloup ∗ Royal Institute of Technology ∗ 2002 50

Laurent, Girard Leloup ∗ Royal Institute of Technology ∗ 2002 51
Paper I
Paper II
Paper III
Paper IV
Paper V
Paper VI

Laurent, Girard Leloup ∗ Royal Institute of Technology ∗ 2002 52

Laurent, Girard Leloup ∗ Royal Institute of Technology ∗ 2002 53
Statistical Analysis of the possibilities and limits of Flexographic Process Modelling.
Girard Leloup, Laurent*
Flexography - Printability - Modelling - Correlation
Abstract: Several research programmes are aiming at a standardisation of the flexographic printing process. To obtain viable results, it is necessary to distinguish between different steps in the scientific approach to the problem. The first one is to formulate a ”useful” definition of printability in flexography. This definition will then, at a final stage, allow a statistical analysis based on parameters defined in advance. One of the intermediate steps of the work consists of a comparison of the different possibilities of modelling the flexographic process. The goal is less to pass a judgement than to find a correlation between the different methods for future investigations. In this study, we have compared 2 different industrial production presses, a laboratory press and 2 simulation systems. The results obtained are positive: the parameter printing press can, within certain limits, be fixed as a constant for future investigations. 1. Objecti ves of the investigation The flexographic process is from the first approach based on a simple ink transfer concept but if you look at it in more detail you discover a multitude of variable parameters, which influence this ink transfer and also the quality of the final printed result. Due to economic demands and ever decreasing delivery times, it is impossible to run a job on a production press for use as proof. Therefore the industry is looking to develop systems with the ability to refine the flexographic process or at least a part of the process. The goal of the project was to analyse the correlation between production printing presses and these modelling systems.

Laurent, Girard Leloup ∗ Royal Institute of Technology ∗ 2002 54
2. Review of the modelling systems available in the market with short description An inquiry has shown that the number of available systems is not as significant as expected. The reasons are once again the costs of the development of such devices which can not be sold in large series and the lack of knowledge of modelling the flexographic process. References to 6 companies have been found which deal with development and marketing of “modelling systems” for the flexographic process. IGT Reprotest has developed the computerized F1 printability tester, which consists of a combined inking unit with an engraved anilox roller, doctor blade and a printing unit with printing form and impression cylinder. The substrate is attached to a substrate carrier and placed on the substrate guide, between the printing form and the impression cylinder. With the aid of a pipette, a few drops of ink are applied to the nip between the doctor blade and the engraved anilox roller. The ink is transferred from the anilox roller to the printing form and from the printing form to the substrate. Two prints are automatically made since this the anilox roller is filled as well as possible with ink. The second print will be used for the evaluation. The MacMillan Bloedel Print Indicator & Sizing Tester was developed to provide a rapid indication of print quality and sizing characteristics. Using an analytical pumping system, the device dispenses microliter-sized drops of ink onto a mylar foil. The drops are then drawn onto the paper sample and down its length by a motorized blade at controlled speed and pressure. The resulting printing length is directly related to ink receptivity and surface topography. The Pamarco Flexo Proofer is a simple hand-held device, using an anilox roller for dispensing a layer of ink on to the substrate. With the aid of a micropipette, 250µl of ink are applied to the nip between the anilox roller and the rubber roller. Then the proofer is drawn rapidly along the sample to make the print. The RK company supplies laboratory reel to reel presses. Their RK Rotary Koater can be configured for flexography. The flexographic unit consists of a printing head with micrometer adjustable pressure settings, doctor blade assembly and an ink tray; also required are anilox rollers. With sufficient drying, speeds up to 90m/min can be reached which allow inks to be used at press viscosity.

Laurent, Girard Leloup ∗ Royal Institute of Technology ∗ 2002 55
The RNA-51 two shaft Printability Tester is a microprocessor controlled unit. When fitted with an anilox roller and steel doctor blade assembly, fast setting inks can be used. The motorized system keeps the anilox roller in constant motion, thereby continuously bathing the anilox in ink and subsequently doctoring it off. The Flexo Proofer F.P. 100/300 is a reel to reel device which has been developed by the Saueressig company. The substrate is stocked from the top onto the presseur and stick on the roll for printed material. The plate cylinder and anilox roller move hydraulically to the arrested presseur. When the doctor blade comes into position, the ink will be provided with a pipette and the print operation is started. 3. The selected systems for the trials in order to look at correlation a. the printing devices: In the following study we will compare 2 of the mentioned devices (IGT and Saueressig), which represent the main families of modelling devices, to production presses. The RNA system can be assimilated to the IGT F1 and the RK Koater to the Saueressig Flexo Proofer. The 2 other systems reviewed, MacMillan Bloedel and Pamarco were not suitable for this study due to the only partial modelling of the flexographic process they offer. In the first case the system does not include any anilox roller nor any photopolymer plate; in the second case no control of the pressure at the nip and no constant speed are to be seen. Hence the choice not to integrate these devices in the study. As far as the production presses were concerned, the investigations were carried out on 3 different presses. The LEMO flexopress, located at the DFTA-TZ in Stuttgart (D) is a five-year-old six-colour CI-Press, with a width of 1300 mm and equipped with chambered doctor blades, CNC motors for the adjustment of the nip pressures and an automatic regulation of ink viscosity. The second press is a Flexocompact seven-year-old, two-colour press with a 600 mm width. This press located at the IMT in Stockholm (S) is a modified production press used for research work. The capability and repeatability of the press have been tested in the past and show very good results. A new Soloflex eight--colours CI-Press with a 850 mm width was the third flexopress in the programme. This press located at Windmöller & Hölscher in Lengerich (D) represents a standard product on the market in

Laurent, Girard Leloup ∗ Royal Institute of Technology ∗ 2002 56
the middle-width range and is also equipped with chambered doctor blades and an ink viscosity regulation system. b. the data acquisition: A testform with different types of elements was elaborated for the series of trials. This testform should make it possible to establish the correlation between the different presses by measuring the density and the dot gain at different places and within the range of 1% to 100% by 18 steps. Circular dots. a resolution of 2540 dpi and a 34 l/cm screen were selected so as to reflect industrial reality. The testform is also quite particular in that it allows study of the influence of the printing direction. Moreover, it consists of other elements such as bar codes, a large solid area, a large 50% field and negative and positive text which will be used for further investigations and to look respectively at the edge sharpness, the uniform coverage and the cleanliness of the print. The data acquisition was carried out using a Gretag D19C densitometer and using the KeyWizard data collection software to import the values into calculation tables. 4. Test methods and parameters a. Description of the materials a.1. the different paper qualities: A discussion with experts from the SCA and StoraEnso paper industry companies led to the conclusion that to make the work credible it was necessary to print on five different paper qualities (Table I).
Paper quality
SEC Coated Liquid Packaging BoardSEU Uncoated Liquid Packaging BoardSCAWT1 White TopSCAWT2 White TopSCAPK Print Kraft
Table I: The different paper qualities
The chosen qualities represent 3 large product families. The characteristics of the different substrates are presented in table II. It is

Laurent, Girard Leloup ∗ Royal Institute of Technology ∗ 2002 57
important to note the large amplitude of the paper characteristics: the surface roughness (PPS) shows values between 1.9 and 7.2 µm, the thickness between 157.0 and 269.0 µm and the weight between 138.7 and 193.0 g/m2. This dispersion will allow explanation of certain results and eliminate the risk of error in the interpretation regarding correlation.
PPS Bendtsen Thickness Weight(µm) (ml/min) (µm) (g/m2)
SEC 1.90 93 267.50 193.00SEU 7.20 493 269.00 172.00SCAWT1 6.45 277 157.00 138.70SCAWT2 6.59 297 161.00 139.30SCAPK 6.90 330 170.00 141.80
Table II: The characteristics of the different substrates
a.2. the different printing plates: With the same objective of eliminating the risk of erroneous conclusions due to coincidence, 4 types of photopolymer plates have been used for the trials (Table III).
Name: Type:
DPS Digital
"universal plate"
HOF Conventional
"flexible plate" (exposure latitude and image resolution)
HOS Conventional
clean image relief / high quality process printing
TDR Conventional
the "corrugated board plate"
Table III: the different types of plates Both the conventional and digital plate making workflow have been considered. 2 different thicknesses have been tested and all the plates presented different types of polymer, exposure time and hardness.

Laurent, Girard Leloup ∗ Royal Institute of Technology ∗ 2002 58
Name: Hardness Thickness (mm)
(Shore A) min. max.
DPS 49 2.80 2.84
HOF 55 2.85 / 2.80 2.89 / 2.84
HOS 71 1.70 1.73
TDR 37 2.85 2.87
Table IV: the characteristics of the different plates The values in the table correspond to our measurements and could differ from the standard values given by the supplier. 2 plates have been used for the HOF type therefore 2 values for the min. and max. thickness. The plates were mounted using a 0.20 mm PVC tape for the 2.84 mm plates and a 0.38 mm PE foam for the 1.70 mm plate. a.3. the ink: The ink was the same for all the trials and was a cyan commercial water-based ink. The ink was printed with a 28-30s viscosity (Frikmar cup 4mm). a.4. the anilox rollers: The anilox roller is a very important component in the ink transfer process and is sometimes described as the “heart” of the process. The problem is that different suppliers have different methods to engrave the cylinders. This reality explains that the cells could have different forms, depths and surface finishing and consequently the ink transfer will not be the same! Moreover the anilox roller manufacturers use different ceramics and deliver protocols with volume indications measured with more or less accurate methods. In view of this problem and to moderate its influence, 2 different volumes have been selected for the trials: 8 and 12 cm3/m2. The screen ruling, the exact volume and the supplier are shown in Table V.

Laurent, Girard Leloup ∗ Royal Institute of Technology ∗ 2002 59
Press: Screen ruling Volume Supplier
(l/cm) (cm3/m2)
LEMO 160 7.0/7.5 Zecher
100 13.0/11.6 Praxair
Saueressig 120 8.0 Saueressig
80 12.7 Saueressig
Flexocompact 140 7.9 Praxair
100 12.4 Praxair
IGT F1 180 8.0 IGT
120 12.0 IGT
W+H Soloflex 140 8.0 Zecher
120 11.0 Zecher
Table V: the anilox rollers characteristics b. Description of the trials The trials took place at different locations under external conditions (Table VI) varying within a range not affecting the substrates and the printing conditions. The procedure was the same for each trial, only the planing was different for practical reasons. Depending of the press it was easier to start by changing the plate, the paper or the anilox roller.
Press: Place Temp. Rel. humidity
(°C) (%)
LEMO DFTA-TZ 25-27 43
Stuttgart (D)
Saueressig DFTA-TZ 23 40-43
Stuttgart (D)
Flexocompact IMT 26 48
Stockholm (S)
IGT F1 StoraEnso 20 40-45
Falun (S)
W+H Soloflex W+H 23 50-55
Lengerich (D)
Table VI: the printing conditions

Laurent, Girard Leloup ∗ Royal Institute of Technology ∗ 2002 60
The first step, after checking the ink viscosity, was to obtain the Kiss Print. The Kiss Print was important with regard to the rest of the trials because fixing the reference for the following different pressures at the plate-substrate nip. No standard method exists for obtaining the Kiss Print and it is still a subjective procedure. To minimise the fluctuation, elements have been tested but without success. Therefore it has been decided that one person, the same for all the trials, would be responsible for the “OK Kiss Print” with the help of a reference sample. After realisation of the Kiss Print, it was printed at different plate-substrate nip pressures: 100, 150, 200, 250 µm over the Kiss Print. The printing speed was kept constant: 120 m/min. For each pressure 25 samples were cut after printing the complete series for the evaluation. These samples represent approximately 1/10 of the total running time: which, depending of the repeat length (Table VII), was about 45 to 60 s. It was sufficient to allow the establishment of a stable situation. For the IGT F1, it was not possible to keep the same parameters. The speed was 0.3 m/s (18 m/min). This choice results from the study of anterior research, which have shown that by printing with speeds above 0.6 m/s, the print density decreases and the coefficient of variation increases. The pressures at the plate-substrate nip were 65 and 120 N which, once established after several tests, should correspond to 100 and 200 µm respectively over Kiss Print. Moreover, after checking the repeatability of the device, the decision was taken to print only 2 “good samples”. The washing time was about 5 minutes between each sample, corresponding to 190 hours for 25 samples! Lindström, Dölling and Poustis looked at the repeatability in their work and came to the conclusion that the repeatability expressed as the coefficient of variation of print density was about 1%. The Saueressig Flexoproofer was run at 50 m/min and the plates were mounted diagonally to avoid the significant vibrations observed in the normal configuration.
Press: Repeat length Width Speed
(mm) (mm) (m/min)
LEMO 480 1300 120
Saueressig 315 270 50
Flexocompact 600 600 120
IGT F1 530 50 18
W+H Soloflex 400 850 120 Table VII: Repeat length, width and speed

Laurent, Girard Leloup ∗ Royal Institute of Technology ∗ 2002 61
The particular features of the 3 production presses were that they were equipped with chambered doctor blades and 2 of them had an ink viscosity regulation system. In the case of the third one the viscosity was manually controlled regularly. Drying was necessary for the 2 presses with the short paper band before rewinding and the temperature was maintained at between 70 and 75°C. 5. Results The significant quantity of trials and measurements has produced a very large database. To be able to make a relevant interpretation and a comprehensible presentation of the main conclusions, it has been necessary to extract only a part of the values. The goal of the project was to analyse the correlation between production printing presses and modelling systems. Different combinations with different types of plates, anilox rollers, pressures at the nip and substrates have been tested and evaluated. Figures 1 to 5 represent the density variations measured for each press with the 4 different plates. The pressure at the plate-substrate nip was 100 µm and the volume of the anilox roller 8 cm3/m2. A study of the diagrams shows that all the curves have the same profile with the same ranking for the different presses regarding the ink transfer: the DPS plate transfers the least ink, then the HOS and TDR have almost the same comportment and finally the HOF is characterised by a higher ink transfer.
Density IGT-SEU-8-100
-
0,40
0,80
1,20
1,60
2,00
2,40
2,80
0% 10% 20% 30% 40% 50% 60% 70% 80% 90% 100%
% Film
HOS HOF TDR DPS

Laurent, Girard Leloup ∗ Royal Institute of Technology ∗ 2002 62
Density Saueressig-SEU-8-100
-
0,40
0,80
1,20
1,60
2,00
2,40
2,80
0% 10% 20% 30% 40% 50% 60% 70% 80% 90% 100%
% Film
HOS HOF TDR DPS
Density DFTA-SEU-8-100
-
0,40
0,80
1,20
1,60
2,00
2,40
2,80
0% 10% 20% 30% 40% 50% 60% 70% 80% 90% 100%
% Film
HOS HOF TDR DPS
Density IMT-SEU-8-100
-
0,40
0,80
1,20
1,60
2,00
2,40
2,80
0% 10% 20% 30% 40% 50% 60% 70% 80% 90% 100%
% Film
HOS HOF TDR DPS

Laurent, Girard Leloup ∗ Royal Institute of Technology ∗ 2002 63
Density WH-SEU-8-100
-
0 , 4 0
0 , 8 0
1 , 2 0
1 , 6 0
2 , 0 0
2 , 4 0
2 , 8 0
0% 1 0 % 20% 30% 40% 50% 6 0 % 70% 80% 90% 100%
% Film
HOS HOF TDR DPS Only the IGT F1 presents an inversion of the ranking: the HOS and HOF plates show an ink transfer of about 35% less than expected. The reason should be the following: the HOF and HOS plates both have a higher degree of hardness and 65N represents in this case less than 100 µm due to the higher resistance of the polymer against the action. The fact that all the curves have the same profile enables us to look closely at the influence of the presses for one type of plate and all the different substrates. The DPS plate has been chosen to purchase this study. The next series of diagrams (figure 6-10) the represents the density variations measured for each substrate with the printing press as a variable parameter. The pressure at the plate-substrate nip was 100 µm and the volume of the anilox roller 8 cm3/m2. The influence of the anilox roller and of the pressure at the plate-substrate nip will be considered separately shortly. The curves obtained show a large divergence between the comportment of the uncoated substrates and the SEC coated one. For this last quality, only the IGT F1 has a conventional density profile. This is probably due to the fact that it was running at the lowest speed and also a more uniform ink transfer. What is responsible for this abnormal result? The thickness of the SEC is almost the same as the thickness of the SEU quality - it is also possible to eliminate this parameter – and the study of the curves at the 200 µm pressure produced the same results. It seems also to be only the coating which affects the result. This is confirmed by figure 11, which shows the influence of the paper for the IMT press. In this diagram it is easier to see the special comportment of the SEC substrate.

Laurent, Girard Leloup ∗ Royal Institute of Technology ∗ 2002 64
Density SEC-DPS-8-100
-
0,40
0,80
1,20
1,60
2,00
2,40
2,80
0% 10% 20% 30% 40% 50% 60% 70% 80% 90% 100%
% Film
IGT Saueressig DFTA IMT W+H
Density SEU-DPS-8-100
-
0,40
0,80
1,20
1,60
2,00
2,40
2,80
0% 10% 20% 30% 40% 50% 60% 70% 80% 90% 100%
% Film
IGT Saueressig DFTA IMT W+H
Density PK-DPS-8-100
-
0,40
0,80
1,20
1,60
2,00
2,40
2,80
0% 10% 20% 30% 40% 50% 60% 70% 80% 90% 100%
% Film
IGT Saueressig DFTA IMT W+H

Laurent, Girard Leloup ∗ Royal Institute of Technology ∗ 2002 65
Density WT2-DPS-8-100
-
0,40
0,80
1,20
1,60
2,00
2,40
2,80
0% 10% 20% 30% 40% 50% 60% 70% 80% 90% 100%
% Film
IGT Saueressig DFTA IMT W+H
Density WT1-DPS-8-100
-
0,40
0,80
1,20
1,60
2,00
2,40
2,80
0% 10% 20% 30% 40% 50% 60% 70% 80% 90% 100%
% Film
IGT Saueressig DFTA IMT W+H
Density DPS-IMT-8-100
-0,40
-
0,40
0,80
1,20
1,60
2,00
2,40
2,80
0% 10% 20% 30% 40% 50% 60% 70% 80% 90% 100%
% Film
SEU SEC WT1 WT2 P K Figure 11: influence of the paper (plate DPS)
The diagrams demonstrate a good correlation between 4 of the 5 presses and a less successful correlation for the last one. This does not signify that it will not be possible to use the Saueressig Flexoproofer for trials in the future but it is necessary to take into consideration the fact that the density obtained is always about 20% higher than with the other presses.

Laurent, Girard Leloup ∗ Royal Institute of Technology ∗ 2002 66
The same conclusion is to be noted at the 200 µm nip pressure and with the 12 cm3/m2 anilox roller. It is interesting to note one exception: the curves of the IMT and Saueressig crossed at 85% for the 200 µm nip pressure (figure 12). This is not due to a modification of the comportment of the Saueressig flexoproofer but to high densities in the 0-85% range at 200 µm with the IMT press. Regarding the correlation between the 4 other presses, it is necessary to distinguish 3 different parts for the evaluation: • 0 – 30% : the range of the density variation is on average 12%
between the IMT, DFTA and IGT presses and about 23% for the W+H press. This means for a 0.35 average density, the IMT, DFTA and IGT densities are between 0.33 and 0.37 and the W+H density between 0.31 and 0.39
• 30 – 80% : in this part the density variation on average remains at
12% for the IMT, DFTA and IGT presses and is reduced to 16% for the W+H press. (D=1.0 => 0.94<IMT,DFTA,IGT<1.06 and 0.92<IMT,DFTA,IGT,W+H<1.08)
• 80 – 100% : the last part of the curves shows a greater dispersion,
the percentage is common to the 4 presses and about 20%. (D=1.6 => 1.44<IMT,DFTA,IGT,W+H<1.76) A possible explanation for this divergence in the high tone area could be the variation in the volume of the anilox rollers: the printing was carried out with 8 cm3/m2 in all the presses but it would be interesting to measure the volume of all the anilox rollers with the same method!
Density WT1-DPS-8-200
-
0,40
0,80
1,20
1,60
2,00
2,40
2,80
0% 10% 20% 30% 40% 50% 60% 70% 80% 90% 100%
% Film
IGT Saueressig DFTA IMT W+H Figure 12: the “crossing” at 200 µm

Laurent, Girard Leloup ∗ Royal Institute of Technology ∗ 2002 67
6. Conclusion This analysis proves that when taking care of certain limiting parameters like width, speed or stability of the devices it is really possible to determinate a correlation between the different printing presses and modelling devices. The fluctuations measured stay in an acceptable area. Only the coated quality was outside the tolerances. Of course the study of the density variations have to be supplemented with further analysis to quantify specific surface defects and edge sharpness but this research would mean further investigation using multivariate statistical analysis and image analysis. References: Steadman, R., Woodall M. and Lesniak M. “The flexographic printability of linerboard” – Appita’93 Chalmers, I.R. “Flexographic printability of packaging grade papers” – Appita’97 Lindström, C., Dölling, R., Poustis, J. “Evaluating the printability of liner board for flexography” – Paper Technology (10/94)

Laurent, Girard Leloup ∗ Royal Institute of Technology ∗ 2002 68

Laurent, Girard Leloup ∗ Royal Institute of Technology ∗ 2002 69

Laurent, Girard Leloup ∗ Royal Institute of Technology ∗ 2002 70

Laurent, Girard Leloup ∗ Royal Institute of Technology ∗ 2002 71
Analysis of the correlation between the print quality required in Flexography and the
tolerances in materials and paper manufacturing in terms of printability.
Due to the fast development of new technologies, it is today necessary to have another approach to the flexographic process: a better comprehension and control of the process. It could be a fatal error to think that the process control has to start when you are printing: in some cases it is already too late! This control begins at an early stage of the materials delivery. To be able to preview the future print quality it is important to know the tolerances you can expect from your suppliers for the delivery of all the different elements such as the inks, anilox rollers, photopolymere plates, mounting tapes, sleeves and substrates you are using and the influence of these tolerances on the final printed result. This paper presents the results of an investigation carried out with suppliers and users in a project, a step towards standardisation, with the goal of measuring the printability of different substrates in flexography. I. The materials: 1. Printing plate: The printing plate as a raw material is characterised by two quantifiable parameters: its Shore A hardness and its thickness. Plate suppliers distinguish tolerances between two productions, two charges and tolerances within a plate or a box. The official statement is a thickness variation of +/ - 0.010 to 0.015 mm within a plate or within a box. At the same time they certify variation in the range +/- 0.025 mm between two productions. Regarding the hardness you can measure two different values: the hardness of the raw plate or the hardness after processing. The hardness of the raw plate is not really relevant for the printer, therefore it is usually not controlled. The plate hardness after processing influences the ink

Laurent, Girard Leloup ∗ Royal Institute of Technology ∗ 2002 72
transfer and must be considered carefully. Suppliers indicate tolerances within a range of +/- 2 °Shore A. In this study we have considered 4 different types of plates and two different thicknesses. Each plate has been made 3 times with the same film. The thickness has been measured in 8 positions and the Shore A measurement has been repeated 3 times.
Plate 1A Plate 1BPlate 1C Plate 2A Plate 2B Plate 2CPlate 3APlate 3B Plate 3CPlate 4APlate 4BPlate 4C
Position 1 2,82 2,819 2,818 2,857 2,862 2,862 2,884 2,881 2,852 1,717 1,704 1,71Position 2 2,813 2,813 2,81 2,862 2,855 2,861 2,879 2,873 2,861 1,717 1,705 1,708Position 3 2,813 2,817 2,811 2,855 2,853 2,863 2,879 2,886 2,86 1,715 1,701 1,707Position 4 2,842 2,81 2,819 2,857 2,857 2,858 2,877 2,874 2,872 1,715 1,704 1,711Position 5 2,819 2,797 2,84 2,854 2,854 2,856 2,883 2,869 2,872 1,714 1,705 1,723Position 6 2,811 2,826 2,821 2,867 2,862 2,861 2,884 2,873 2,873 1,714 1,705 1,719Position 8 2,822 2,832 2,824 2,86 2,859 2,851 2,887 2,883 2,866 1,716 1,707 1,719Position 9 2,826 2,837 2,835 2,868 2,872 2,856 2,881 2,885 2,868 1,714 1,708 1,723
Average (plate) 2,821 2,819 2,822 2,860 2,859 2,859 2,882 2,878 2,866 1,715 1,705 1,715V- -0,01 -0,022 -0,012 -0,006 -0,006 -0,008 -0,005 -0,009 -0,014 -0,001 -0,004 -0,005 -0,009V+ 0,021 0,016 0,018 0,008 0,013 0,004 0,005 0,008 0,006 0,002 0,003 0,008 0,009Average (box) 2,821 2,859 2,875 1,712V-- -0,024 -0,008 -0,023 -0,011 -0,014V++ 0,021 0,013 0,012 0,013 0,012Average (charge) 2,852V--- -0,045V+++ 0,035 Figure 1: Tolerance in plate thickness The table above (figure 1) presents the results of the thickness measurements: the average plate is the variation within the same plate and the eight different positions measured, the average box is the variation between plates from the same box and the average charge is the variation between two deliveries of plates. If we compare the results with the values given by the suppliers, we can observe that the variations within a plate are as expected, the variations within a box are at the limits of the tolerance area but still under the tolerances but the variations between two productions are larger than mentioned by the supplier. The fact that the tolerances between two charges are about +/- 0.040 mm instead of +/- 0.025 mm is not a dramatic problem but justifies a certain work methodology. It is of course interesting to know that variation in thic kness exists in the plate and how large it is but the most interesting thing is to know the influence of these variations on the final printed result. To study the

Laurent, Girard Leloup ∗ Royal Institute of Technology ∗ 2002 73
problem 2 plates from the same type and also with the same Shore A have been selected and printed at the same time on the circumference of the plate cylinder to be sure to have the same kiss-print. The specificity is that these two plates have a thickness difference located in the middle of tolerance scale: if we eliminate the case to print a job with two different charges, the tolerances are +/- 0.015 mm and the middle tolerance 0,015 mm. Plate 1 and 2 had a thickness of 2.825 mm and 2.840 mm respectively. Figure 2 shows the dot gain curve calculated with the Murray-Davies formula for the two plates. The interesting part of the curves is the middle tones part between 20 and 60%. In this part we can observe a translation of the curve from plate 2 to a higher dot gain. The study of the measured values quantifies this difference with an average of 4.7 %.
Tolerance in plate thickness
0
20
40
60
80
100
0 20 40 60 80 100
% Film
% P
rin
t
2,840 mm
2,825 mm
Figure 2: Dot gain and plate thickness

Laurent, Girard Leloup ∗ Royal Institute of Technology ∗ 2002 74
Figure 3: Hardness expected / measured The diagram (figure 3) presents the result of the Shore A hardness measurements. The values measured tie in very well with the values and tolerances given by the supplier. The tolerances for the measured plates are included between +0/-0 and -1/+2° Shore A, which conforms to the +/-2 ° Shore previously mentioned. In the worst case the difference between 2 plates could be 4° Shore A. In order to see the influence or not of this factor, we printed, with the same procedure and test form we used in the thickness investigation, two types of plates with 8 ° Shore A difference and the same thickness. The study of the dot gain curves (figure 4) confirms the importance of the Shore A hardness for the ink transfer. The difference measured from 10.8 % in average between the 20 and 60 % tones is very demonstrative. Of course the large amplitude is due to the choice of the plates but in the case of 4° Shore A tolerances, 4-5% difference in dot gain can be expected.
Tolerances in plate hardness
0
20
40
60
80
1 2 3 4
Type of plate
° S
ho
re A

Laurent, Girard Leloup ∗ Royal Institute of Technology ∗ 2002 75
Tolerances in plate Shore A
0
20
40
60
80
100
0 20 40 60 80 100
% Film
% P
rin
t45° Shore A
37° Shore A
Figure 4: Dot gain and plate hardness
2. Tape or foam tape: The tape or foam tape is one of the elements of the “tolerances sandwich”. For tape thickness under 0.20 mm the small variations are not to be taken into consideration. For tape over 0.20 mm and foams it is not possible to neglect the tolerances. A study at the DFTA-TZ has shown that for 0.20 / 0.30 mm tapes the tolerances are about 0.020 mm and could reach 0.035 mm for 0.55 mm foam tapes. The deviations to the nominal value are in most cases positive. For the foam tapes the dimensional stability to the temperature, the memory of the foam and its compressibility are the most important factors which condition its thickness during production. The tape is sometimes considered as a secondary element but in reality its choice and good usage are very important: choose the right tape with the right plate and motive to print, control its thickness and mount all the plates of a job with the same roll could avoid expensive problems.

Laurent, Girard Leloup ∗ Royal Institute of Technology ∗ 2002 76
3. Ink viscosity: The goal of the investigation was to look at the influence of the variation in the viscosity in a range which corresponds to viscosity measurement uncertainty. When measuring the viscosity manual with a cup, 2 factors influence the measurement: the state of the cup (wear, clean/dirty) and the person stopping the time. These factors lead to +/- 2s variations. Moreover 4s is a realistic value for a maximum variation between two manual controls of the viscosity during the production. The diagram (figure 5) represents the density variations measured for 23, 25 and 27s viscosity for a water-based ink. The curves are very similar and no relevant density variation can be noted.
Tolerances in viscosity
0,0
0,2
0,40,6
0,8
1,01,2
1,4
1,61,8
2,0
2,2
0 20 40 60 80 100
% film
Ded
nsi
ty
27 25 23
Figure 5: Viscosity and density

Laurent, Girard Leloup ∗ Royal Institute of Technology ∗ 2002 77
Tolerance in sleeves wall thickness
0
20
40
60
80
100
0 20 40 60 80 100
% Film
% P
rin
t
Figure 6: Dote gain and sleeve diameter
4. Sleeve: The number of printers using sleeve technology is growing very fast. The main advantage of this technology is its flexibility. With the same cylinder you are able to print different repeat lengths, to use different plates and tape thickness. Moreover the make ready time of the press is considerably reduced. What about the tolerances? Do we have the same precision we had with cylinders? Delivery certificates guarantee a circularity of 0.025 mm and tolerances for the external diameter of +/- 0.020 mm. These tolerances are independent of the diameter and length of the sleeve. The 2 sleeves tested (figure 6) presented a difference of 0.013 mm in diameter and the average variation in dot gain measured is 2,2 % for the 20-60% part of the curve. This demonstrates one more time the importance of control by material delivery. It does not mean you have to refuse sleeves if you measure one with +0.020 and an other one with –0.020mm but do not use it for the same job in the press!
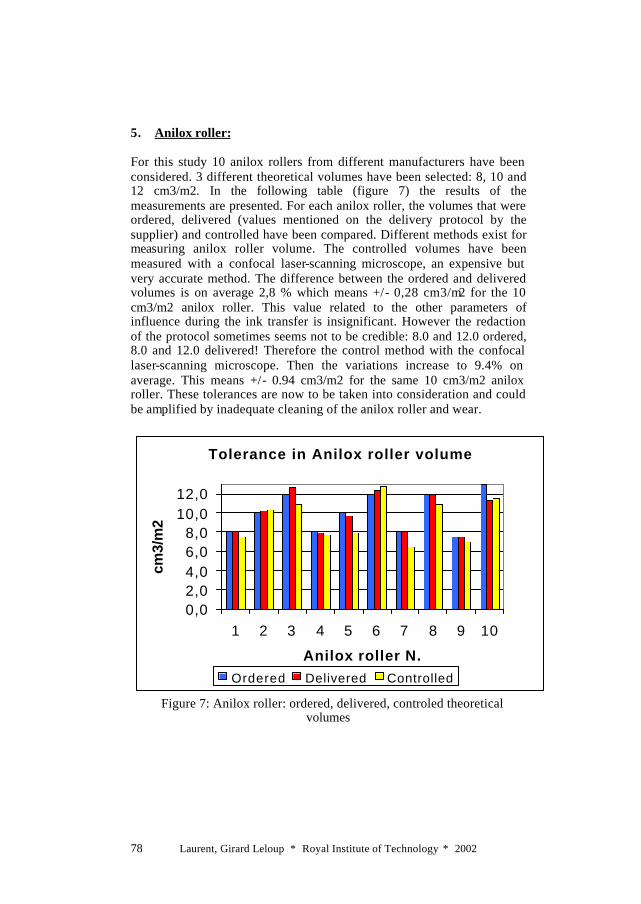
Laurent, Girard Leloup ∗ Royal Institute of Technology ∗ 2002 78
5. Anilox roller: For this study 10 anilox rollers from different manufacturers have been considered. 3 different theoretical volumes have been selected: 8, 10 and 12 cm3/m2. In the following table (figure 7) the results of the measurements are presented. For each anilox roller, the volumes that were ordered, delivered (values mentioned on the delivery protocol by the supplier) and controlled have been compared. Different methods exist for measuring anilox roller volume. The controlled volumes have been measured with a confocal laser-scanning microscope, an expensive but very accurate method. The difference between the ordered and delivered volumes is on average 2,8 % which means +/- 0,28 cm3/m2 for the 10 cm3/m2 anilox roller. This value related to the other parameters of influence during the ink transfer is insignificant. However the redaction of the protocol sometimes seems not to be credible: 8.0 and 12.0 ordered, 8.0 and 12.0 delivered! Therefore the control method with the confocal laser-scanning microscope. Then the variations increase to 9.4% on average. This means +/- 0.94 cm3/m2 for the same 10 cm3/m2 anilox roller. These tolerances are now to be taken into consideration and could be amplified by inadequate cleaning of the anilox roller and wear.
Tolerance in Anilox roller volume
0,02,04,06,08,0
10,012,0
1 2 3 4 5 6 7 8 9 10
Anilox roller N.
cm3/
m2
Ordered Delivered Controlled
Figure 7: Anilox roller: ordered, delivered, controled theoretical volumes

Laurent, Girard Leloup ∗ Royal Institute of Technology ∗ 2002 79
6. Cylinders: The impression cylinders, plate cylinder and anilox roller are manufactured with tolerances in circularity and diameter. The measurement of these tolerances was the topic a thesis at the HDM in Stuttgart (D). The analysis of the result leads us to accept 5 to 10 µm as a standard for both multi- or central impression cylinder presses. II. The substrate: The objective is to select the measurable paper characteristics which influence the printability in flexography and to study the effect of their variations on the printed results to be able to model the paper in terms of printability. 1. surface roughness: Surface roughness is one of the most important characteristics of the paper regarding its printability. Surface roughness can be measured with different procedures but the most common are the Bendtsen and PPS methods both based on air leak measurement.The PPS method delivers values in micrometers and the Bendtsen method in ml/min. Both methods present advantages and disadvantages: PPS gives a good physical representation of the surface topography but the Bendtsen method is more accurate due to the wide range of the variations (400 ml/min instead of 5,3 µm). The variations in surface roughness influence the ink transfer and are responsible for a form of mottling. 2. surface tension: The surface tension determines the wetting of the paper surface by the ink. Wetting is one of the basic requirements for ink absorption and ink transfer. The contact angle method and Hercules size test are standard methods to quantify the wetting of papers and boards and the results given in mN/m is often called surface energy. When printing on paper or board, using water-based ink, the problem is that the range of the paper surface energy is almost the same as the range of the equilibrium surface tension of the inks, which is from 20 to 40 mN/m. From this fact results an inhomogeneous wetting leading to a print mottle. Wilhelmy and Bristow tests are other methods to measure the surface energy but they are not suitable for predicting the print mottle (Zang). A study has shown that it would probably be more relevant to adjust the dynamic surface tension of

Laurent, Girard Leloup ∗ Royal Institute of Technology ∗ 2002 80
the ink, which is higher and suits the ink transfer mechanism better, to the surface energy of the substrate. 3. water absorbency: When printing with water-based ink on “non closed” substrates, the water absorbency is a determinant parameter for the printability. But at the same time the interaction with the ink is complex and needs a very prudent approach. The water absorbency will give an indication of the ink consumption but the relation between the ink consumption and the print density is not linear. The reason is that the quantity of ink offered by the anilox roller is limited: if this amount of ink is superior to the absorbency of the substrate, then the density will increase with the absorbency, but if the amount of ink is inferior, then a low absorbency substrate will show the highest print density (the other characteristics of the 2 substrates are supposed to be similar). IGT, Cobb test, Unger (g/m2), K&N (%), Tainionkoski (%), STFI (g/m2) are other procedures for measuring the water absorbency. 4. porosity / air permeability: The porosity of a substrate is theoretically defined as the ratio of the void volume within a porous material to its total volume. Due to the difficulties involved in measuring this volume, the air permeability, which is the rate at which air passes through the paper under specific conditions is currently used in the paper and paperboard industry to quantify the porosity of a substrate. Dalphond and Koller have shown a good correlation obtained between the measurement of Gurley, Parker Print Surf and Sheffield. However it is important to note that the measured air permeability of a substrate is not suitable when comparing porosity of substrates with different thicknesses, the thickness of the substrate affecting the air permeability. These two conclusions, the correlation between surface roughness and the non-suitability of the method for thickness variations leads us to consider that the porosity of the substrate is not a specific parameter of prime importance for the determination of the printability. A good exploitation of the surface roughness measurements and a consideration of the water absorbency will take care of this parameter and also simplify the modelling of the substrate.

Laurent, Girard Leloup ∗ Royal Institute of Technology ∗ 2002 81
5. pH: Water-based flexographic inks are generally formulated with resins soluble in water under alkaline conditions (ammonia and alkanolamines are used as solubilising agents) and they also show a pH range of 8.0-9.0. The acidity of the substrate neutralises the solubilising amines and at the same time a drying of the ink film occurs. This drying effect is suitable in multicolour printing to eliminate the problem of the pearling of the ink and assure a good ink trapping. However the relation pH of the substrate/ pH of the ink has to be kept under control to avoid the development of tack in the ink films. 6. density of the paper: Density is defined as the quotient weight/thickness and is given in g/cm3. Paper density is a characteristic of its compressibility. Compressibility plays an important role in combination with the plate/mounting tape hardness for the cleanliness of the solid area and the edge sharpness. The following diagrams (figures 9 to 14) represent density variations measured for 5 different paper qualities (figure 8) with 2 different printing plates, 2 anilox rollers and 2 pressures. For each diagram the different elements have been kept constant and only the paper quality varies. It is easy to observe that: first, the variations in paper properties affect directly the printing quality (in this case the density), second the variations are depending of elements such as the printing plate (hard/soft), the theoretical volume of the anilox roller (8/12 cm3/m2) or the pressure at the plate-substrate nip (100/200 µm).
Figure 8: papers characteristics
Paper quality PPS Bendtsen Thickness Weight(µm) (ml/min) (µm) (g/m2)
SEC Coated Liquid Packaging Board 1,90 93 267,50 193,00
SEU Uncoated Liquid Packaging Board 7,20 493 269,00 172,00WT1 White Top 6,45 277 157,00 138,70
WT2 White Top 6,59 297 161,00 139,30PK Print Kraft 6,90 330 170,00 141,80

Laurent, Girard Leloup ∗ Royal Institute of Technology ∗ 2002 82
-
0,40
0,80
1,20
1,60
2,00
2,40
2,80
0 % 10% 20% 30% 40% 50% 60% 70% 80% 90% 100%
% Film
SEU SEC WT1 WT2 PK Figure 9: hard plate – 8 cm3/m2 – 100 µm
-
0,40
0,80
1,20
1,60
2,00
2,40
2,80
0 % 10% 20% 30% 40% 50% 60% 70% 80% 90% 100%
% Film
SEU SEC WT1 WT2 PK
Figure 10: hard plate – 8 cm3/m2 – 200 µm
-
0,40
0,80
1,20
1,60
2,00
2,40
2,80
0 % 10% 20% 30% 40% 50% 60% 70% 80% 90% 100%
% Film
SEU SEC WT1 WT2 PK
Figure 11: hard plate – 12 cm3/m2 – 100 µm
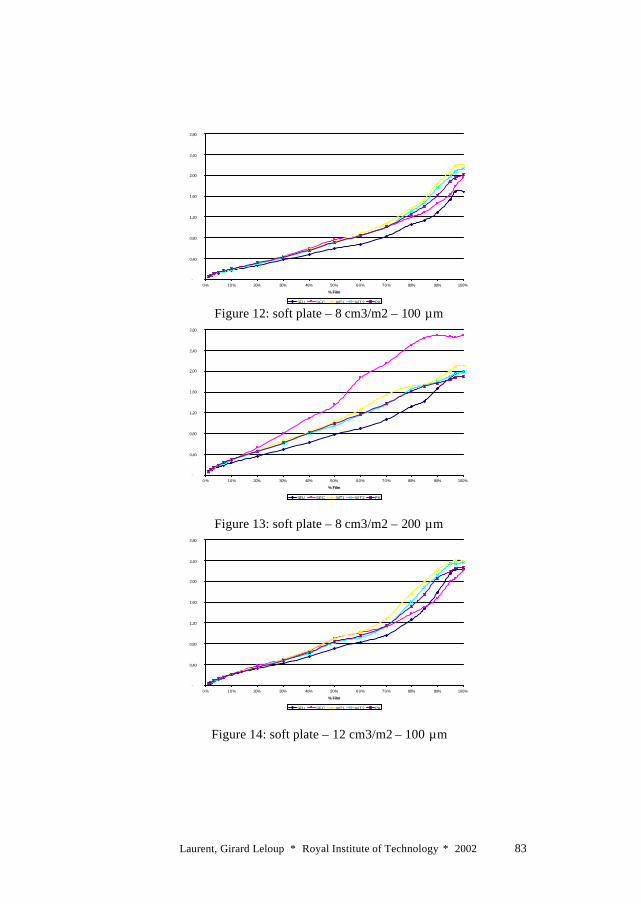
Laurent, Girard Leloup ∗ Royal Institute of Technology ∗ 2002 83
-
0,40
0,80
1,20
1,60
2,00
2,40
2,80
0 % 10% 20% 30% 40% 50% 60% 70% 80% 90% 100%
% Film
SEU SEC WT1 WT2 PK Figure 12: soft plate – 8 cm3/m2 – 100 µm
-
0,40
0,80
1,20
1,60
2,00
2,40
2,80
0 % 10% 20% 30% 40% 50% 60% 70% 80% 90% 100%
% Film
SEU SEC WT1 WT2 PK
Figure 13: soft plate – 8 cm3/m2 – 200 µm
-
0,40
0,80
1,20
1,60
2,00
2,40
2,80
0 % 10% 20% 30% 40% 50% 60% 70% 80% 90% 100%
% Film
SEU SEC WT1 WT2 PK
Figure 14: soft plate – 12 cm3/m2 – 100 µm

Laurent, Girard Leloup ∗ Royal Institute of Technology ∗ 2002 84
Conclusion: This study attests the complexity of the high quality flexographic process. It confirms the necessity for a standardisation of the process and the necessity for the development of a tool to be able to measure and predict the printability when varying the different parameters. The analysis of the properties of various elements has shown that variations within the material tolerances influence the printed results. If you now add these tolerances or use materials with properties outside the tolerances you can imagine the consequences of the print quality. Therefore the choice of materials with the right properties and tolerances and careful checking of the delivered materials should be the start of all high quality flexographic printing production. References: Jensen, K.W. ”Flexo printability of Coated White-Top Liner with Consideration of Convertability” Graphic Arts in Finland 1989 Meyer, Prof. K.H ”Toleranzen in der Druckabwicklung und deren Auswirkung” – DFTA-TZ Zang, Y.H., Aspler, J.S. ”Factors that affect the flexographic printability of linerboards” – Tappi Journal 10/95

Laurent, Girard Leloup ∗ Royal Institute of Technology ∗ 2002 85

Laurent, Girard Leloup ∗ Royal Institute of Technology ∗ 2002 86

Laurent, Girard Leloup ∗ Royal Institute of Technology ∗ 2002 87
Study of paper printability in flexography by controlled variation of the surface roughness.
Laurent, Girard Leloup framkom – KTH, Stockholm, Sweden Introduction: The flexographic printing is in a period of rapid development. The process achieves a high quality and allows to print of a large range of different substrates. These substrates show very different properties. The quality of the printed result related to the substrate properties and to the printing parameters is called printability. In a first step of the research work, the influence of the variation of the printing parameters has been studied. This paper presents the results of the second phase of the work, which intend to correlate the paper properties to the printability. The problem is that the different paper characteristics are dependant variables and interact. It is also very difficult to study all of them at the same time. Therefore the chosen way was to control the surface roughness of the substrate by calendering the paper in several steps. Methods: To be able to integrate this study in the research concept about the establishment of a “Printability Coefficient“ it was necessary to keep the same type of paper we used in the first step. The paper was an uncoated Liquid Packaging Board (SEU) with a basis weight varying between 232 and 236g/m2 and a thickness varying between 0.382 and 0.398mm. Both reels from the middle and reels from the side of the jumbo reel have been used. The paper was coming from a production and was a conventional product without special modification for the investigation. After the measurement of the initial Bendtsen surface roughness values, it has been renounced to the idea to calender at the same time a white top testliner. This paper showed almost the same values for the middle and the side reels for both 140g/m2 and 200g/m2 qualities. The variations measured were in the range of the tolerances of the Bendtsen process. However the white top testliner (WT1) has been used to compare the behaviour of 2 different paper qualities with the same surface roughness.

Laurent, Girard Leloup ∗ Royal Institute of Technology ∗ 2002 88
Calendering was performed at the STFI (1) on the pilot calender. The calendering was a steel/steel nip calendering as used in the production of this type of paper. The centre roll was heated to 200°C and the speed was about 300m/min. The paper was calendered using different line loads. The first rolls were used to find appropriate line loads giving the requested Bendtsen values. Five line loads were tested and Bendtsen values for those levels were measured. The following reels, which were destined to be printed, were then calendered at the line loads given by the first trials. The aims of the calendering were first to obtain paper with constant values of Bendtsen surface roughness and second to create a possible comparison between edge and middle reels, liquid packaging board and testliner qualities. The next step of the work was to print on the paper. The printing trials were carried out on the Flexocompact flexographic printing press at framkom (2). The press is a 2-colour multicylinder press equipped with chamber doctor blades and a warm air dryer. The press is seven years old and has shown its repeatability in precedent research works. The speed was maintained constant at 120m/min during all the trials. The ink was a to the substrate adapted water based ink, cyan, printed with a viscosity of 27s (Frikmar 4mm). 2 different printing plates have been used both with a 1.70mm thickness: a digital universal plate with the DPS designation (Hardness 56° Shore A) and a conventional plate with the designation HOS (Hardness 71° Shore A). The anilox rollers were selected to cover a large range of transferred ink volumes; from 3 to 12 cm3/m2. All of them were laser engraved ceramic anilox rollers, engraved with the multi pulse technology and had a 45° screen angle. Moreover the study was used to test how a fine screening affect the printability: this has been done by choosing for the 4,5 cm3/m2 volume 2 different screen rulings: 200 and 500 l/cm. The testform was a new one, developed to allow the measurement of several printability factors. For this study we only considered the 34l/cm screen ruling. Measured were the density for 18 different tonal values (1-100%), the mottling for a solid area and for a 30% screen area, the bleeding, the wicking and the dot gain for the 50% tonal value. For each printing plate/anilox roller/substrate combination, 3 different pressures at the plate/substrate nip were printed. The first one was the Kiss Print to define the “zero point“, then the pressure has been increased to 200µm by 2 100µm steps. After stabilisation of the printing conditions, samples has been collected at each stage for the future measurements.

Laurent, Girard Leloup ∗ Royal Institute of Technology ∗ 2002 89
The measurements were effectuated in 2 steps. The first step was to measure the optical density with a Gretag Macbeth D19C densitometer. For each series the measurements were carried out on 3 samples and exported to an Excel sheet using the Key Wizard interface. The average values have been used for the evaluation. The second step was the measurement of the mottling, wicking, bleeding and dot gain values using the Papeye (3) software. The method is based on an image analysis system with a scan of the sample as input for the different calculations. The mottling analysis module gives a mottling index as result. This index is calculated with the following procedure: The sample is scanned with a resolution of 300 dpi, the application of a wavelet mathematical transformation allows to calculate values for different resolutions, then using a double weighting of the different points (a first weighting taking care of the resolution of the human eye and second one to enhance the local maximum), an average is calculated. This average is the called “mottling index“. This index varies between 0, corresponding to the mottling of a plastic surface printed with a neutral colour and 100 to a chequered black/white surface with edge length of 2.7mm. The following 2 measurements, bleeding and wic king had for goal to quantify an important quality factor for the flexographic process: the edge sharpness. The bleeding procedure has been used to measure the sharpness of negative text and the wicking the sharpness of positive text. Both procedures are based on the same measurement principle and return 2 values as results: the surface area and the calculated sharpness in mm2. The surface area is the difference between the area of the scanned sample, calculated with a method based on the comparison of pixe ls, and the area of the reference sample, entered by the user. The sharpness is the surface difference between the surface area and the ideal outline of the object measured. The dot gain measurement was in this study used as test for further development. The procedure used (based on the sharpness measurement) differs from the conventional methods but the results let expect a future for the method. The last part of the methodology I would like to mention here is the use of the SIMCA P8 multivariate data analysis software for the exploitation of the results. The Principal Component Analysis (PCA) is a multivariate projection method that is designed to extract and highlight the systematic variation in a multivariate data matrix and the eventual outliers to the considered model. This analysis has to be seen like a control and complementary analysis to the conventional statistical analysis presented in the results part of the paper and will be used for the discussion.
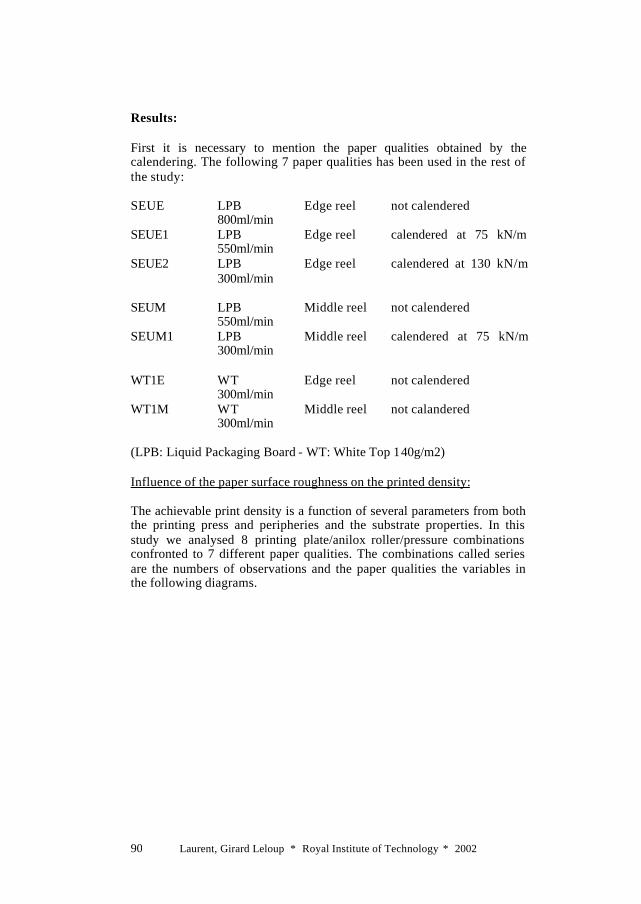
Laurent, Girard Leloup ∗ Royal Institute of Technology ∗ 2002 90
Results: First it is necessary to mention the paper qualities obtained by the calendering. The following 7 paper qualities has been used in the rest of the study: SEUE LPB Edge reel not calendered 800ml/min SEUE1 LPB Edge reel calendered at 75 kN/m 550ml/min SEUE2 LPB Edge reel calendered at 130 kN/m 300ml/min SEUM LPB Middle reel not calendered 550ml/min SEUM1 LPB Middle reel calendered at 75 kN/m 300ml/min WT1E WT Edge reel not calendered 300ml/min WT1M WT Middle reel not calandered 300ml/min (LPB: Liquid Packaging Board - WT: White Top 140g/m2) Influence of the paper surface roughness on the printed density: The achievable print density is a function of several parameters from both the printing press and peripheries and the substrate properties. In this study we analysed 8 printing plate/anilox roller/pressure combinations confronted to 7 different paper qualities. The combinations called series are the numbers of observations and the paper qualities the variables in the following diagrams.

Laurent, Girard Leloup ∗ Royal Institute of Technology ∗ 2002 91
Influence of the PSR on the density - DPS
1,50
1,60
1,70
1,80
1,90
2,00
2,10
2,20
2,30
2,40
1 2 3 4
Serie
Den
sity
WT1E WT1M SEUE SEUE1 SEUE2 SEUM SEUM1 Figure 1: Full tone density – DPS plate
Influence of the PSR on the density - HOS
1,50
1,60
1,70
1,80
1,90
2,00
2,10
2,20
2,30
1 2 3 4
Serie
Den
sity
WT1E WT1M SEUE SEUE1 SEUE2 SEUM SEUM1
Figure 2: Full tone density – HOS plate The figure 1 and 2 present the density variations observed for the plate HOS with the different papers. Series 1 and 2 are the results with a low ink volume and 3 and 4 with an high volume. For the white top qualities, which have not been calendered differences are constated at low nip pressure but disappear at high pressure. This result confirms the existence of 2 roughness levels and in this case the “macro-roughness” of the both papper is the same but it is probably a difference in the“micro-roughness” which make the difference at low pressure. At high pressure the micro-roughness is then also compensated. For the calendered qualitites, the edge reels show a regular behaviour for all the series but more pronounced at low nip pressure. The density is increasing at the same time the Bendtsen values are decreasing. The same

Laurent, Girard Leloup ∗ Royal Institute of Technology ∗ 2002 92
trend is to see for the middle reels except for the serie 3 with the DPS plate! However the figure 3 illustrates that the density variations are not so significant: the average is 0.07 for an average full tone density of 2.01, which represents a variation of 3.5%.
Influence of the PSR on the print density
0,00
0,50
1,00
1,50
2,00
0 10 20 30 40 50 60 70 80 90 100
% Film
Den
sity
WT1E-HOS08200 WT1M-HOS08200 SEUE-HOS08200 SEUE1HOS08200SEUE2HOS08200 SEUM-HOS08200 SEUM1HOS08200
Figure 3: Density variations for tonal values between 0% and 100% Influence of the paper surface roughness on the motlling: The mottling is an important parameter to quantify the printability. The mottling measured in this study corresponds to the “global” mottling. The global mottling is the residual mottling from the substrate modified by the print mottling. The used method to calculate the mottling index allows only in a few special cases to distinguish the both types of mottling. It is only if the unprinted and printed papers have the same mottling curve profiles, that the possibility exists to separate the contributions of the paper and print mottling. In these cases the mottling index is a value usable for comparison or global statements. - Solid area (100%): The figure 4 is a representation of the average mottling index measured in a solid area for each paper qualities. The values are varying between 11.87 and 12.92 which are quite high values but a narrow range of variation. Regarding the ranking of the different qualities and the correlation with the surface roughness the measurements prove that the

Laurent, Girard Leloup ∗ Royal Institute of Technology ∗ 2002 93
calendering is influencing the mottling index. The variation of the mottling is opposite to this of the surface roughness: the improvement of the surface quality creates an increasing of the mottling for both edge and middle reels. The comparison of the 4 qualities with the same (300ml/min) Bendtsen value conducts to the conclusion that it exists a correlation between the surface roughness and the mottling index. But the Bendtsen characteristic is not the only one factor: it has been measured a 0.65 difference (12.27-12.92) between the minimum and the maximum values.
Mottling 100%
11,00
11,20
11,40
11,60
11,80
12,00
12,20
12,40
12,60
12,80
13,00
WT1E-Moy WT1M-Moy SEUE-Moy SEUE1-Moy SEUE2-Moy SEUM-Moy SEUM1-Moy
Mo
ttli
ng
ind
ex
Figure 4: Mottling index for a 100% area
- screen area 30% The mottling index values for the 30% screen area are varying between 8.72 and 9.78 (figure 5), which corresponds exactly to the same range (1.06 / 1.05) as for the solid area. It is however important to note 2 particularities. - The first one is that the mottling index is in average 4.5 less than for the solid area: the explanation is that the solid area mottling is at the same time influenced by the uniform coverage and at low nip pressure the mottling index measured is sometime accentuated by the non uniform coverage and also the residual substrate grey value. - The second particularity is that the variations are opposite: the improvement of the surface roughness has for consequence a decreasing of the mottling index. Interesting is the fact that at same Bendsten the difference between the minimum and the maximum (8.72 – 9.37) is one more time 0.65.

Laurent, Girard Leloup ∗ Royal Institute of Technology ∗ 2002 94
Mottling screen 30%
8,00
8,20
8,40
8,60
8,80
9,00
9,20
9,40
9,60
9,80
10,00
WT1E-Moy WT1M-Moy SEUE-Moy SEUE1-Moy SEUE2-Moy SEUM-Moy SEUM1-Moy
Mo
ttli
ng
in
dex
Figure 5: Mottling index for a 30% area
Influence of the paper surface roughness on the edge sharpness of the print: - wicking: To measure the wicking sharpness of a motive (text, line) is a method to quantify the edge sharpness for positive elements. A low wicking is synonym to a high sharpness. The figure presents the wicking sharpness in %. The values fluctuate between 0.87 and 1.01% (figure 6). For the edge reels the wicking reduces with the improvement of the surface roughness what is the opposite for the middle reels. In this case it would be interesting to control the absorption of the paper because it seems that the effect of the absorption and the surface roughness are combined. A too closed paper structure contributes to a spreading on the ink, which is in this case is intensified by the calendering (see SEUM/SEUM1).
Wicking
0,80
0,85
0,90
0,95
1,00
1,05
WT1E-Moy WT1M-Moy SEUE-Moy SEUE1-Moy SEUE2-Moy SEUM-Moy SEUM1-Moy
%
Figure 6: Wicking measured for the different paper qualities

Laurent, Girard Leloup ∗ Royal Institute of Technology ∗ 2002 95
- bleeding The bleeding can be considered as the negative effect of the wicking. The bleeding is used to characterise the edge sharpness of negative motives. In combination with the wicking the bleeding creates an “absolute” sharpness. The trends for the bleeding are the same as for the wic king, only the amplitude of the variations is greater (3.6% / 0.14% - Figure 7). This is due in major part to the deformation of the fotopolymer printing plate.
Bleeding
0,00
1,00
2,00
3,00
4,00
5,00
6,00
WT1E-Moy WT1M-Moy SEUE-Moy SEUE1-Moy SEUE2-Moy SEUM-Moy SEUM1-Moy
%
Figure 7: Bleeding measured for the different paper qualities
The “absolute” sharpness is built by calculating the average of the bleeding and wicking sharpness. The value confirms the results of the partial sharpness with the same ranking and values from 1.42 to 3.26% (figures 8).
"Absolute" Sharpness
0,00
1,00
2,00
3,00
4,00
5,00
6,00
WT1E-Moy WT1M-Moy SEUE-Moy SEUE1-Moy SEUE2-Moy SEUM-Moy SEUM1-Moy
%
Figure 8: “Absolute” sharpness for the different paper qualities

Laurent, Girard Leloup ∗ Royal Institute of Technology ∗ 2002 96
Influence of the paper surface roughness on the dot gain in middle ton (50%) The dot gain has been measured following 2 methods. The first method is the conventional one using a densitometer and the Murray-Davies formula with the full tone and 50% densities as inputs: the result is an optical dot gain.
DG= [(1-10E( -D50%)) / (1-10E( -D100%))] – 50 [%] (1)
with: DG: Dot Gain D50%, D100%: Density for respective the 50% and 100 %areas
The second method was tested during this study and used the wicking function of the Papeye software. In this case the result is a geometrical dot gain: a one 1cm2 50% screen area with a 34 l/cm screen ruling has been used to calculate the total area of the points. The accuracy of the method can be justified by the fact that each time 34x34=1156 points are measured and the final value is the average (figure9).
DG= [(WA/1156) x 50/ TPA] – 50 [%] (2)
with: DG: Dot Gain WA: Wicking Area TPA: Theoretical Point Area The method using the Murray-Davies formula gives variation from 10.05% to 16.75%, the values with the geometrical method are varying between 23,51% and 31.18% (figure 10). The correlation between both methods can be seen on the figure 10: the trends for the variations are exactly the same and the rapport geometrical/optical dot gain is about 2 for all the paper qualities. Regarding the fluctuation of the dot gain, a better surface topography leads to a reduction of the dot gain but this result has to be nuanced by the fact that the amplitude of the variations is limited (about 2.5%).

Laurent, Girard Leloup ∗ Royal Institute of Technology ∗ 2002 97
Dot Gain 50%
20,00
22,50
25,00
27,50
30,00
32,50
35,00
WT1E-Moy WT1M-Moy SEUE-Moy SEUE1-Moy SEUE2-Moy SEUM-Moy SEUM1-Moy
% P
rint
Figure 9: Geometrical Dot gain for the different paper qualities
Dot Gain comparison
0,00
2,50
5,00
7,50
10,00
12,50
15,00
17,50
20,00
22,50
25,00
27,50
30,00
32,50
35,00
WT1E-Moy WT1M-Moy SEUE-Moy SEUE1-Moy SEUE2-Moy SEUM-Moy SEUM1-Moy
%
Serie1 Serie2 Figure 10: Optical / Geometrical Dot gain for the different paper qualities

Laurent, Girard Leloup ∗ Royal Institute of Technology ∗ 2002 98
Discussion: The figures 11 to 16 have been created using the SIMCA P8 multivariate data analysis software. These have for aims to obtain a graphic representation of the printability of the different paper qualities. The diagrams have to be considered as scores/loadings pairs. In the loadings it is possible to localise the position of the different parameters which has been measured (density, mottling index, wicking,…). The lecture of the scores informs about the quantitative influence of these parameters onto the paper quality plotted. The centre of the ellipse would represent the ideal point or the best compromise without to take care of the density. However the achievable density can not be excluded from a printability evaluation. Therefore the 3 different pairs of plots (scores/loadings) with the density for the respective 2 (“trame 2%), 50 (“Eng 50%”) and 100% (“Aplat”) tonal values. To take into consideration the fact that all the parameters except the density are expected minimum and the density maximum, it is necessary to consider the line joining the centre of the ellipse to the density point in the loadings plot. The point P situated on the line at 1/5 to the centre of the ellipse is defined as the ideal point. The distance d between the point P and the paper points plotted in the scores plots is characterisation of the Printability. Using this definition of the printability and a graphical evaluation, the results are very encouraging. For each density the WT1M, SEUM1 qualities are the nearest points and for SEUE2 quality the result is similar for 2 densities. This would lead to the conclusion that the 3 precedent qualities are the best printability.

Laurent, Girard Leloup ∗ Royal Institute of Technology ∗ 2002 99
-3
-2
-1
0
1
2
3
-6 -5 -4 -3 -2 -1 0 1 2 3 4 5 6
t[2]
t[1]
Roughness – Solid area densityDistribution of papers (average)
Scores: t[1]/t[2]Ellipse: Hotelling T2 (0.05)
WT1E-
WT1M-SEUE-
SEUE1
SEUE2
SEUM
SEUM1
Figure 11: Scores for the 100% Density Printability evaluation
-0.40
-0.20
0.00
0.20
0.40
0.60
-0.50 -0.40 -0. 30 -0.20 -0.10 0.00 0.10 0.20 0.30 0.40 0.50
p[2]
p[1]
Roughness – Solid Area density
Loadings: p[1]/p[2]
Aplat
Mottling 30%
Mottling Apl
% W Sharp
Eng 50%
Figure 12: Loadings for the 100% Density Printability evaluation

Laurent, Girard Leloup ∗ Royal Institute of Technology ∗ 2002 100
-3
-2
-1
0
1
2
3
-6 -5 -4 -3 -2 -1 0 1 2 3 4 5 6
t[2]
t[1]
Roughness – 50% screen densityDistribution of papers (Average)
Scores: t[1]/t[2]Ellipse: Hotelling T2 (0.05)
WT1E-
WT1M-
SEUE-
SEUE1
SEUE2
SEUM1SEUM
Figure 13: Scores for the 50% Density Printability evaluation
-0.20
-0.10
0.00
0.10
0.20
0.30
0.40
0.50
0.60
0.70
0.80
0.90
-0 .5 0 -0.40 -0.30 -0.20 -0.10 0.00 0.10 0.20 0.30 0 .4 0 0.50
p[2]
p[1]
Roughness – 50% screen density
Loadings: p[1]/p[2]
Trame 50%
Mottling 30%
Mottling Apl
% W Sharp
Eng 50%
Figure 14: Loadings for the 50% Density Printability evaluation

Laurent, Girard Leloup ∗ Royal Institute of Technology ∗ 2002 101
-3
-2
-1
0
1
2
3
-6 -5 -4 -3 -2 -1 0 1 2 3 4 5 6
t[2]
t[1]
Roughness – 2% screen densityDistribution of papers (average)
Scores: t[1]/t[2]
Ellipse: Hotelling T2 (0.05)
WT1E-
WT1M-SEUE-SEUE1
SEUE2
SEUM1
SEUM
Figure 15: Scores for the 2% Density Printability evaluation
-0.40
-0.30
-0.20
-0.10
0.00
0.10
0.20
0.30
0.40
0.50
0.60
0.70
0.80
0.90
-0.40 -0.30 -0.20 -0.10 0.00 0.1 0 0.20 0.30 0.40 0.50
p[2]
p[1]
Roughness – 2% screen density
Loadings: p[1]/p[2]
Trame 2%
Mottling 30%
Mottling Apl
% W Sharp
Eng 50%
Figure 16: Loadings for the 2% Density Printability evaluation

Laurent, Girard Leloup ∗ Royal Institute of Technology ∗ 2002 102
Conclusion: This study has shown that by influencing different components of the printability matrix, the surface roughness (Bendtsen) of the substrate has a great contribution to the quality of the printed result. The contribution is positive for all the measured parameters excepted for the solid area mottling index. This leads to the conclusion (confirmed by the discussion) that an improvement of the surface roughness improve at the same time the global and objective printability of the substrate. Further research works will be carried out to complete the results and quantify the part of the surface roughness influence in the total influence of the paper parameters. Acknowledgements: I would like here to thank Francoise Chabut, Student at the EFPG in Grenoble, F for her help in this project by doing measurements and discussing the results. References: Aspler, J., Byron, J.,Zang, H. and Nguyen, N., (1998), Print Quality of Linerboard in Commercial Water-based Flexography, TAGA 98 proceedings, 749-774 Ginman, R. and Tiainen P.-R., (1988), Requirements of the flexographic printing process on wrapping paper and packaging board, Adv. Print. Sci. Techno, 19:210 Jensen, K.W., (1989), Flexo Printability of Coated White-Top Liner with Consideration of Convertability, Graphic Arts in Finland 18:14-20 Plowman, N., (1991), Ink gloss mottle, Graphic Arts Monthly, vol 63, N.5:122 Bichard, W. (1992), The Inter-relationship among Air-Leak Roughness / Smoothness Methods, Pulp and Paper Canada, 93(6):147 Appendix: (1): STFI: Swedish Pulp and Paper Research Institute (2): framkom: Research Corporation for Media and Communication technology, Stockholm, Sweden (3): Papeye: a software from Only Solutions (Kassel – D)

Laurent, Girard Leloup ∗ Royal Institute of Technology ∗ 2002 103
Bendtsen Roughness: The Bendtsen tester, first introduced in 1939, measures the rate of air-flow, in ml/min, between the paper surface and a narrow annular surface, which rests on the paper against a smooth glass plate. The air supply is maintained at a constant pressure and, with the aid of an air-flow meter, the instantaneous rate of the airflow across the paper surface is measured. The resistance to the airflow between the annulus and the paper surface decreases with the roughness of the paper.

Laurent, Girard Leloup ∗ Royal Institute of Technology ∗ 2002 104

Laurent, Girard Leloup ∗ Royal Institute of Technology ∗ 2002 105

Laurent, Girard Leloup ∗ Royal Institute of Technology ∗ 2002 106

Laurent, Girard Leloup ∗ Royal Institute of Technology ∗ 2002 107
A Flex-Odyssey…
Girard Leloup, Laurent*
Keywords: Flexography - Printability Coefficient – Flow diagram - Quality Control – Objectivity - Measurement
1. Introduction The Flexography started 50 years ago a long travel. The different stages and the final destination of this Odyssey were not easy to predict. Today it looks to be evident that this Odyssey has for objective the “total quality” concept. The flexographic process is reaching its maturity and competitiveness, quality, innovation, flexibility are the words qualifying the flexography. This explains probably why the flexography is actually the only one conventional printing process still growing. The objective of this work is to predict and measure print quality in flexography, before the actual job is printed. This quantification should take into consideration the interaction between the substrate characteristics and the printing parameters. Therefore it is preferable to speak of measurement of the “PRINTABILITY”. The method should be objective by eliminating the human judgement and the environmental factors, which currently lead to an interpretation and not to a scientific measurement. To achieve these requirements of simplicity and objectivity, the help of a “key number” is needed. In the investigation the credibility of such a number called “Printability Coefficient” will be studied. _________________ *Research Corporation Media and Communication Technology (Framkom), Royal Institute of Technology (KTH), Stockholm, Sweden

Laurent, Girard Leloup ∗ Royal Institute of Technology ∗ 2002 108
2. Objectives of the investigation The “Printability Coefficient”, “P” is the final number resulting from the input of measured quality quantificators like density, mottling, edge sharpness cleanliness of solid area, dot gain and dot deformation. The gain of the equation results from different steps in the project. The achieved first steps of the research work allow today the introduction of a flow diagram for the method. Moreover almost all the parts of the diagram can now be described in details. In this paper the results will be introduced in 2 steps: the first step is a general explanation of the diagram “How to read it” and the second step will be look at the contribution of the different “boxes”.
3. Results 3.1 How to read it?
Figure 1: “Printability Coefficient”: The Flow Diagram
PrinciplePrinting
parametersPaper
characteristics
2001 A FLEX2001 A FLEX--ODYSSEYODYSSEY
Printing Trials
Modelingof thePrint
Modelingof the
Substrate
Printed samples
Measurement Tool
Quality factors
”Printability coefficient”

Laurent, Girard Leloup ∗ Royal Institute of Technology ∗ 2002 109
The flow diagram is a representation on paper of the way a job is planed and executed in the industry. A printing product has been concept and has to be realised. It could be a simple or a very complicated item but the approach of the work and the way to follow to the final product are similar. Before running the printing press, have to be decided:
- the substrate and its properties - the press configuration and its peripheries
The flow diagram should help the technical people both from the paper and the printing industries to take the right decision. The right decision is a consequence of different requirements, which interact together. The final product and its functionality have to satisfy the technical and financial aspect of the project. It means criteria such as transport, marketing have to be considered in the choice of the “Printability Coefficient”: the quality has a price, the technique has limits, “P” should help to find the best compromise! The next step is to achieve the “make ready” press, to get the “first sheet” and to compare the obtained result with the expected or required result. At this stage appear different problems. The first one and probably the most important is the objectivity of the judgement during the quality control. Why is it a problem? There is actually no standard to measure the “total quality” but only different partial qualities like density measurement, dot gain calculation, measurement, of spectral values… This has for consequence the difficulty to compare different “sheets” in view of “total quality”. To solve this problem the method requires the measurement of standard and process adapted quality factors. The quality factors are then the input values for an equation, which will give as result a “Printability Coefficient”.
3.2 Contribution of the different “boxes”: 3.2.1 Paper characteristics:
a. factors to take into consideration: . The design of the product: today the packaging industry does not anymore work only with the transport function of the packaging but as well with the practical aspect and the marketing strategy of the final customer. The substrate must as the same time respond to the mechanical, chemical criteria and the “buy me” criteria. The first one

Laurent, Girard Leloup ∗ Royal Institute of Technology ∗ 2002 110
does normally not interest the creative people but the technical people have to find a solution to be able to realise the product! . The economical parameters: the costs have to be minimized. The packaging represents in Europe in average 6% of the final product selling price and the substrate represents a large part of the packaging costs. Some customers do only look at the quality of the final product: in this case the decision is very simple and the choice is oriented to the substrate with the best printability. However the majority of the customers are looking for the price and need an instrument to select the best compromise: a “Printability Coefficient”. . The printing process: in the choice of the paper is the printing process a relevant player. It is necessary to know in advance which technical constraints will appear in the printing process. The type of press (CI, stack, multi cylinder), the ink system (water based, solvent based, UV) and the drying technology are some of the most important parameters to take into consideration. . The converting exigencies: not forget that the printed product is not always the final product! The paper, board has by its density, thickness, … to guaranty the transformation (die cutting, gluing, …) of the printed product into a final product without to damage the technical and esthetical qualities of the before achieved result. . The motive to be print: depending of the required quality and the difficulty of the motive to be print certain paper properties become more or less importance: typical example are the whiteness or the surface roughness of the paper . . Skill of the company / employees: the strategy of the company can here be the critical point: What is the best investment or the investment of high priority: invest for the education and motivation of the employees and save money by buying a cheaper paper or pay the price for a high quality paper to obtain the same result? Is it really the same result? Is a compromise the right alternative? b. the quantificators for the substrate: This part of the diagram has been described in a precedent paper under the title: “Analysis of the correlation between the print quality required in Flexography and the tolerances in materials and paper manufacturing in terms of printability.” The substrates properties, which influence directly the printability are the following:
. surface roughness
. water absorbancy

Laurent, Girard Leloup ∗ Royal Institute of Technology ∗ 2002 111
. surface energy
. porosity / air permeability
. pH
. homogeneity of the surface (mottling)
. density
Some other characteristics of the substrate should influence the printability but indirectly: it means these characteristics like paper formation, relative humidity, … are secondary variables, which change the values of the above primary variables.
3.2.2 Printing parameters:
a. the anilox roller:
. The choice of the anilox roller depends of the substrate and its characteristics, the nature of the motive to be print and the specifications of the prepress work (screen ruling, colours separation, colour management…). To define are the angle of the screening, the theoretical volume of ink transferred, the cell geometry (it is a directly consequence of the engraving technology used by the supplier) and the screen ruling.
b. the press:
. The press must be adapted to the type of product to be print. The size of the product, the substrate, the inking / drying systems, the design and the quality required are the relevant factors. A further parameter is the control of the pressure at the nip printing plate / substrate: this adjustment is not really a characteristic of the press but a problem at the interface printer/printing press. A well-equipped press (with CNC motors) will reduce the risk of error from the user. Not to forget is the next step of the work and its requirements: the converting.
c. the ink:
. The final product function and the substrate lead to the type of ink, ink system to use. Food and cosmetic industry for example will have very high exigencies that will not be the same for wrapping paper or trivial packaging solutions. In a second phase the runnability will play a major role: the viscosity, the pH and the temperature of the ink have to be

Laurent, Girard Leloup ∗ Royal Institute of Technology ∗ 2002 112
adapted and a stability of these parameters during the production has to be assured.
d. the printing plate:
. The printing plate summarizes the work down in the prepress stage: it is the support of the information to be reproduced and the rightness of this information has to be proofed. The content and the integrality of the information such as the rightness of the technical data (screen ruling / dot size, dot shape, relief depth, …) are primordial factors for a good result. Moreover the printing plate is by its own characteristics an important element in the ink transfer process. The composition of the photopolymer, its hardness and the thickness of the printing plate as well as its relief depth allow with different mounting techniques several combinations for an optimisation of the ink transfer.
3.2.3 Printing trials / Printed samples: This box in the flow diagram represents the output box for the first 2 boxes described above: the collected samples are a materialisation of the combinations obtained by the materials and peripheries selection. At the same time the printed samples are an input for the next box: the measurement tool. The printing trials deliver printed samples with test charts / elements, which will be used for the evaluation of the different quality factors. 3.2.4 Measurement Tool: The measurement tool is based on optical measurements of the different test charts and test elements present on the printed sheet. The measurements are effectuated with the help of densitometers, spectrophotometers and image analysis hardware and software. A detailed description of the different methodologies can be found in 2 precedent publications: “Study of paper printability in flexography by controlled variation of the surface roughness” and “Provtryckning 2000”. 3.2.5 Quality factors: A large study has allowed to find out the relevant quality factors for the printability in flexography. Two test forms with 13 test elements have been printed and evaluated. The evaluation has been made at 2 levels: a called “subjective evaluation” carried out by experts and non-experts

Laurent, Girard Leloup ∗ Royal Institute of Technology ∗ 2002 113
panels and an objective evaluation done by several measurements and measurement technologies. The selection of the quality factors has been realised by first looking at all the measured parameters and then eliminating the non relevant or with less influence for the flexographic process. The result is a confirmation of the by the flexographic experts expected result. The quality factors, which passed the tests are the following: density, dot gain, dot deformation, mottling and edge sharpness. 3.2.6 Modelling of the Print / Modelling of the Substrate: Both modelling are complementary and must be considered as a level itself in the flow diagram. They will allow to jump over the printing trials and measurement of the quality factors steps and consequently to reach the prediction stage of the project. By choosing a “Printability Coefficient” and using the modelling boxes, it will be possible to define the substrate characteristics and printing parameters corresponding to the wished quality. 3.2.7 Printability Coefficient: “P” is THE final result, the output and at the same time centre of the flow diagram. The “Printability Coefficient” should be seen as an instrument for evaluating or previewing (in this case “P” is simultaneously playing an output and input function) the printability in flexography. It is a number without unit to resume a lot of parameters, which interact together. A high value of “P” corresponds to a high printability. The user will define for is company the acceptable ∆P and be able to control his production.
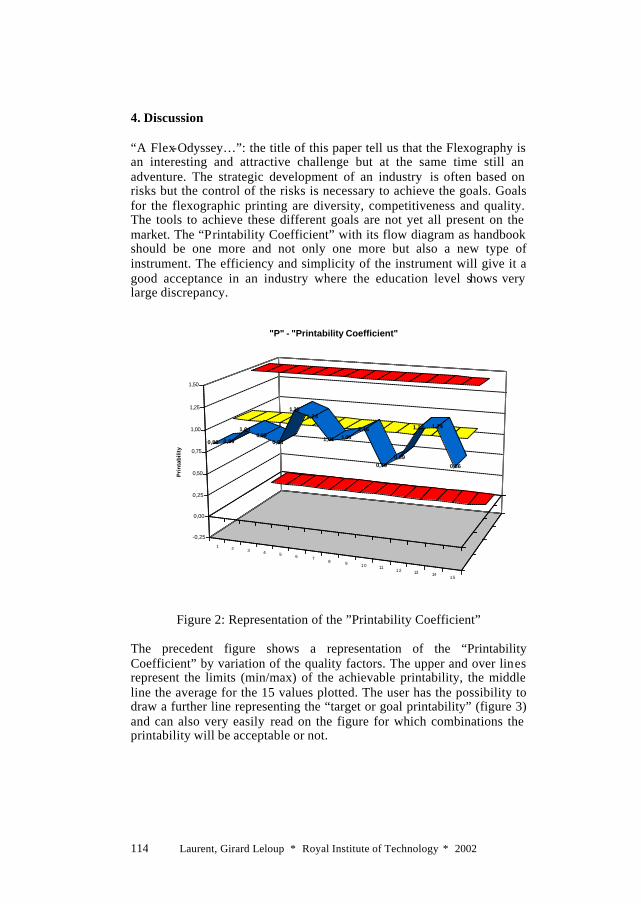
Laurent, Girard Leloup ∗ Royal Institute of Technology ∗ 2002 114
4. Discussion “A Flex-Odyssey…”: the title of this paper tell us that the Flexography is an interesting and attractive challenge but at the same time still an adventure. The strategic development of an industry is often based on risks but the control of the risks is necessary to achieve the goals. Goals for the flexographic printing are diversity, competitiveness and quality. The tools to achieve these different goals are not yet all present on the market. The “Printability Coefficient” with its flow diagram as handbook should be one more and not only one more but also a new type of instrument. The efficiency and simplicity of the instrument will give it a good acceptance in an industry where the education level shows very large discrepancy.
1 2 3 4 5 6 78 9 10 11
12 13 1415
S1
S2
S3
S4
0,86 0,89
1,040,99
0,93
1,301,24
1,01 1,051,16
0,790,89
1,22 1,24
0,86
-0,25
0,00
0,25
0,50
0,75
1,00
1,25
1,50
Pri
nta
bili
ty
"P" - "Printability Coefficient"
Figure 2: Representation of the ”Printability Coefficient”
The precedent figure shows a representation of the “Printability Coefficient” by variation of the quality factors. The upper and over lines represent the limits (min/max) of the achievable printability, the middle line the average for the 15 values plotted. The user has the possibility to draw a further line representing the “target or goal printability” (figure 3) and can also very easily read on the figure for which combinations the printability will be acceptable or not.

Laurent, Girard Leloup ∗ Royal Institute of Technology ∗ 2002 115
0,00
0,20
0,40
0,60
0,80
1,00
1,20
1,40
1,60
1 2 3 4 5 6 7 8 9 10 11 12 13 14 15
P u
nits
Measured Average Max Min Target
Figure 3: Representation of the printability with the “Target Printability”
5. Conclusion
The existence of instruments for a measurement and prevision of the printability by a “Printability Coefficient” has been presented. The flow diagram explains the way “P” will be calculated and proves the logical and at the same time closed to the real work way it is based on. The establishment of the equation has been shown previously and the figures in the discussion part illustrate it. The only part missing is the procedure “How to use it?” for “P”, the “Printability Coefficient”. This and further improvement of the equation will be presented in the final results of the work.

Laurent, Girard Leloup ∗ Royal Institute of Technology ∗ 2002 116
References: (1) Girard Leloup, L. “Analysis of the correlation between the print quality required in Flexography and the tolerances in materials and paper manufacturing in terms of printability.” FFTA Y2K Forum - Orlando (USA)
(2) Girard Leloup, L. “Statistical Analysis of the possibilities and limits of Flexographic Process Modelling.” TAGA 2000 - Colorado Springs (USA)
(3) Girard Leloup, L. “Study of paper printability in flexography by controlled variation of the surface roughness.” - IARIGAI 2000 - Graz (A)Steadman, R., Woodall M. and Lesniak M. (4) “Provtryckning 2000” Research project (Sweden) “The flexographic printability of linerboard” - Appita’93 Steadman, R., Woodall M. and Lesniak M. “Evaluating the printability of liner board for flexography” - Paper Technology (10/94) Lindström, C., Dölling, R., Poustis, J.

Laurent, Girard Leloup ∗ Royal Institute of Technology ∗ 2002 117

Laurent, Girard Leloup ∗ Royal Institute of Technology ∗ 2002 118

Laurent, Girard Leloup ∗ Royal Institute of Technology ∗ 2002 119
Establishment and Comparison of Different Definitions and Equations for a “Printability
Coefficient” for the Flexographic Process.
Girard Leloup, Laurent*
Keywords: Flexography - Printability Coefficient - Equation - Quality Control
Abstract: The Flexographic Process has the last years noted a great improvement of the achievable quality. The quote part of the market for the flexographic printing process is still growing; working groups meet to achieve standards for this process at an international level. The industrial partners: paper manufacturers, peripheries suppliers, printers and converters are today looking for a common language to be able to judge, measure the print quality. The following paper will propose solutions for a universal language with the help of a “Printability Coefficient” for the Flexographic Process. The results of the research present different approaches for a mathematical modelling of the parameters influencing the printability and their interactions.
1. Objectives of the investigation The work presented in this paper should be seen as a contribution to the actual effort for a standardisation of the flexographic process. The main objective of the investigation is to deliver the different actors in the packaging industry a key number to be able to objectively and with a guaranty of repeatability evaluate the quality of a printed product. This number called “Printability coefficient” is going in a first time to be used as an instrument in the quality control stage of the process and in a second time to be a tool for the conception phase of a new printed product. It will facilitate the dialogue between the different partners and also reduce the lost of time and money due to a luck of a universal quality language. _________________ *Research Corporation Media and Communication Technology (Framkom), Royal Institute of Technology (KTH), Stockholm, Sweden

Laurent, Girard Leloup ∗ Royal Institute of Technology ∗ 2002 120
2. Methodology of the investigations The present work can be divided in different steps. Theses steps are the following: preparation of the printing trials, printing of the samples, measurement of the printability parameters, establishment and comparison of different equations for a printability coefficient. The first 3 steps are very time expensive in both the elaboration and realisation but are very important to achieve a valuable result in the final stage. The data collection (steps 1-3) results partially from the work achieved in preview research (1)(2) and (3). 2.1 Preparation of the printing trials: The printing trials have been done on full-scale printing presses. These presses are located for the flexographic process at research centres in Germany (DFTA-TZ) and in Sweden (Framkom). The LEMO flexopress is a six-year-old six-colour CI-Press, with a width of 1300 mm and equipped with chambered doctor blades, CNC motors for the adjustment of the nip pressures and an automatic regulation of ink viscosity. The Aquaflex fle xopress is a one-year-old, five-colour production stack press, with a 18” width. In the difference to the 2 others presses run with water based ink, the Aquaflex press was run with UV-ink. The third press, a Flexocompact eight-year-old, two-colour press with a 600 mm width is a modified production press used for research work. The capability and repeatability of the press have been tested in the past and show very good results (1). In this study will be mentioned other printing processes like lithography, electrophotography and inkjet. These processes are not the main focus of the present report but have been used as references for the establishment of the different printability coefficients. Some of the printing trials evaluated for the work are described in details in a project called “Provtryckning 2000” (4). The preparation of the trials consists to a selection of different substrates, a definition of the printing parameters, an elaboration of the printing procedure and the coordination of the different research resources involved. The substrates range covers with 11 qualities (figure 1) from matt and gloss paper, uncoated liquid packaging board, liner to high coated boards a broad palette of the flexographic products.
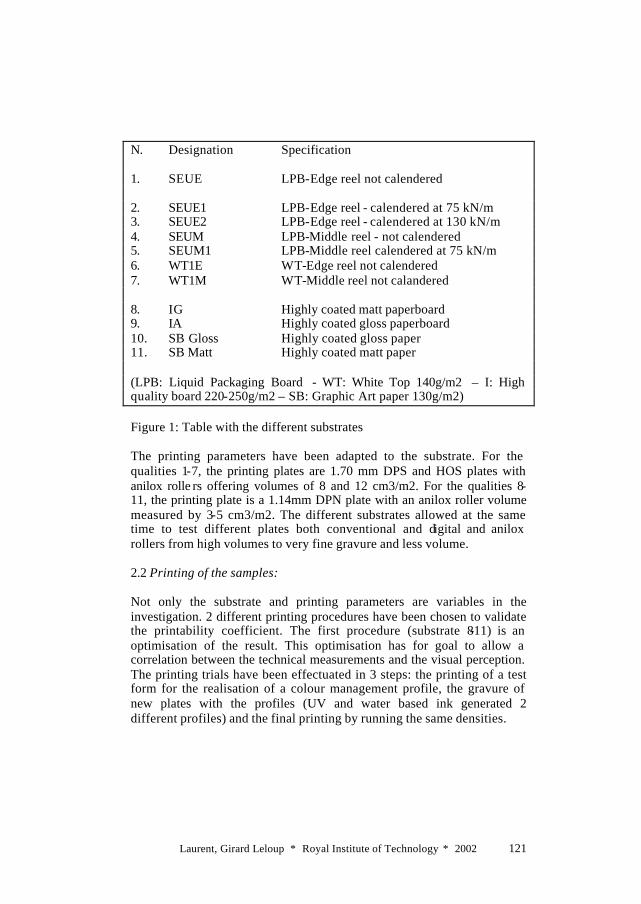
Laurent, Girard Leloup ∗ Royal Institute of Technology ∗ 2002 121
N. Designation Specification 1. SEUE LPB-Edge reel not calendered 2. SEUE1 LPB-Edge reel - calendered at 75 kN/m 3. SEUE2 LPB-Edge reel - calendered at 130 kN/m 4. SEUM LPB-Middle reel - not calendered 5. SEUM1 LPB-Middle reel calendered at 75 kN/m 6. WT1E WT-Edge reel not calendered 7. WT1M WT-Middle reel not calandered 8. IG Highly coated matt paperboard 9. IA Highly coated gloss paperboard 10. SB Gloss Highly coated gloss paper 11. SB Matt Highly coated matt paper (LPB: Liquid Packaging Board - WT: White Top 140g/m2 – I: High quality board 220-250g/m2 – SB: Graphic Art paper 130g/m2) Figure 1: Table with the different substrates The printing parameters have been adapted to the substrate. For the qualities 1-7, the printing plates are 1.70 mm DPS and HOS plates with anilox rolle rs offering volumes of 8 and 12 cm3/m2. For the qualities 8-11, the printing plate is a 1.14mm DPN plate with an anilox roller volume measured by 3-5 cm3/m2. The different substrates allowed at the same time to test different plates both conventional and digital and anilox rollers from high volumes to very fine gravure and less volume. 2.2 Printing of the samples: Not only the substrate and printing parameters are variables in the investigation. 2 different printing procedures have been chosen to validate the printability coefficient. The first procedure (substrate 8-11) is an optimisation of the result. This optimisation has for goal to allow a correlation between the technical measurements and the visual perception. The printing trials have been effectuated in 3 steps: the printing of a test form for the realisation of a colour management profile, the gravure of new plates with the profiles (UV and water based ink generated 2 different profiles) and the final printing by running the same densities.

Laurent, Girard Leloup ∗ Royal Institute of Technology ∗ 2002 122
The second procedure (qualities 1-7) is the direct printing of a known test form by varying the ink transfer parameters. For different ink quantity, a range of nip pressure has been printed with a cyan water based ink. The results are “good”, “less good” and “bad” samples, which allow a scaling of the printability coefficient. 2.3 Measurement of the printability parameters: To be able to establish a printability coefficient a large volume of measurements are necessary. The measurements methods are already described in precedent papers (3) and (4). The results of the measurements are going to be presented with diagrams and tables will show the principle values. All the values are available but not presented here! The measured parameters are:
- For the qualities 1-7: densities in 2%, 50% ton value and in the solid area, edge sharpness divided in wicking and bleeding components, dot gain by a densitometric (for the 50 %) and optical way (for the 2, 30 and 50%), mottling in 30% screen and in the solid area, dot quality (roundness) for 2 and 30% dots.
- For the qualities 8-11: densities CMYK in the solid area, edge sharpness divided in blurriness and raggedness components, dot gain by a densitometric way in 40 and 80% for CMYK, mottling for C and K as for Red (R=100%M+100%Y), Green (G=100%C+100%Y) and 40% K, gloss, colour gamut, colour failure and grey balance.
Not all the parameters will be retained in the “final” printability coefficients but all of them have been available and tested to find the best compromise. 2.4 Establishment and comparison of different equations: The first stage of the work is to test different equations for a printability coefficient and to look at the correlation with the visual perception data for all the printing processes. In a second step the equation will be optimise for the flexographic process. This optimisation has for goals to get a better correlation with the visual perception data and to simplify the equation. The simplification will put in relief the components of first priority, the printability parameters specific for the flexographic printing

Laurent, Girard Leloup ∗ Royal Institute of Technology ∗ 2002 123
process. The obtained result will then confronted to the qualities 1-7 by varying the printing parameters and comparing the values with the expected results.
3. Results 3.1 The results of the measurements: In this part will be presented the results of the different measurements. The goal of this study is not to find the combination substrate / printing parameters to obtain the best quality but to establish a relevant printability coefficient. Therefore it does not appear necessary to present the results of the measurement as raw data but more interesting to show the variation in the results for the different measurements. The amplitude of the variation should be seen as a quality factor for the printability coefficient. All the following diagrams (figures 2 to 6) has been build on the same principle: the minimum, the maximum and the mean value of each measured parameters have been picked up, then the difference between the max and min to the mean value have been calculated in % of the mean value and plotted by property for the different substrate quality groups.
Dot Gain
119,78
110,26
134,67
93,1798,95
82,25
102,02
61,02
85,42
36,88
48,16
121,98
94,87
121,33
90,58
131,41
100,00
120,20
100,00 100,00
37,34
96,75
0,00
20,00
40,00
60,00
80,00
100,00
120,00
140,00
160,00
DG40C DG40M DG40Y DG40K DG80C DG80M DG80Y DG80K DG2C DG30C DG50C
Qualities 8-11 Qualities 1-7
MA
X a
nd
MIN
in %
to
mea
n v
alu
e
Figure 2: Amplitude of the Dot Gain variation for the different substrates

Laurent, Girard Leloup ∗ Royal Institute of Technology ∗ 2002 124
The dot gain diagram shows a regular repartition of the amplitude on both side of the mean value for all the measurement except for DG80K and DG50C. The summed amplitude is about 200%.
Density
54,76
32,39 30,41
40,14
90,34
39,40
12,69
24,9321,39 21,30
28,12
100,00
40,43
12,87
0,00
20,00
40,00
60,00
80,00
100,00
120,00
C M Y K C2% C50% C100%
Qualities 8-11 Qualities 1-7
MA
X a
nd
MIN
in %
to
mea
n v
alu
e
Figure 3: Amplitude of the Density variation for the different substrates
The results for the density are as expected: about the same variations in CMYK, for the minimums and larger variation for the maximums due to the inkjet process and its very high densities. C 2% with values around 100% can be explained with the small nominal value.

Laurent, Girard Leloup ∗ Royal Institute of Technology ∗ 2002 125
Edge Sharpness
119,15
88,25
437,68
29,2347,84
30,29
72,52
20,15
0,00
50,00
100,00
150,00
200,00
250,00
300,00
350,00
400,00
450,00
Raggedness Blurriness Bleeding Wicking
Qualities 8-11 Qualities 1-7
MA
X a
nd
MIN
in %
to
mea
n v
alu
e
Figure 4: Amplitude of the Edge Sharpness variation The edge sharpness is a typical quality characteristic for the inkjet and flexographic processes. Raggedness, blurriness and wicking are quantifications of the quality for positive lines and bleeding for negative lines. One more time the extreme values are the maximum values. The over 400% in bleeding correspond to a for low nip pressure. The minimum values are between 20.15 and 72.52%.
Mottling
223,48
488,01
236,03
423,86
160,70
13,53 17,63
71,6584,67
71,05 76,03 67,38
14,27 15,07
0
50
100
150
200
250
300
350
400
450
500
C K R G K40% C C30%
Qualities 8-11 Qualities 1-7
MA
X a
nd
MIN
in %
to
mea
n v
alu
e
Figure 5: Amplitude of the Mottling variation for the different substrates

Laurent, Girard Leloup ∗ Royal Institute of Technology ∗ 2002 126
The mottling diagram can be interpreted at 3 levels. The first conclusion is only a confirmation of the large influence of the printing process on the mottling values: the max values are very far away from the mean values. A second observation is that the minimisation of the mottling is not quantitatively dependent from the colour, trapping or screening of the measured surface. Moreover the mottling is a factor, which is for a specific process (flexography in this case), very stable in the amplitude of the variation: 13.53 - 17.63% for min/max C and C30%.
Other Parameters
75,1245,43
773,13
50,98
153,70
808,86
18,34 16,69
98,4752,17
100,00
985,55
0,00
100,00
200,00
300,00
400,00
500,00
600,00
700,00
800,00
900,00
1000,00
Roundness 2% Roundness 30% Gloss Colour Gamut Colour Failure Grey Balance
Qualities 1-7 Qualities 8-11
MA
X a
nd
MIN
in %
to
mea
n v
alu
e
Figure 6: Amplitude of “other parameters” variation
To measure the roundness is a method to look at the dot quality (the ideal circular point has a 1.00 roundness). This measurement gives together with the dot gain a very good characterisation of the dots. The other parameters presented in this diagram are more relevant to compare the different printing processes than to judge each one separate. Grey balance notices very surprising results: the use of ICC profile has been done for the trials! 3.2 The establishment of the printability coefficient:
3.2.1 Definition of the printability
The printability of a substrate has different definitions depending who is speaking and in which context. The paper industry has of course not the same definition as the IT industry but not either the same as the printing

Laurent, Girard Leloup ∗ Royal Institute of Technology ∗ 2002 127
industry. However are these 3 industries (at least 2 of them) working in very eng connection. The admitted definition of printability for this work is the following: Measurement of the printed result quality related to the substrate properties and the printing parameters.
3.2.2 Different equations
a. correlation to the virtual perception data: The establishment of a printability coefficient for the flexographic process has been done in successive steps. The first step was to find the best linear combination of the measured printing quality parameters, which fits with the visual perception (VP) quality evaluated for the flexographic samples. The goal was to obtain an equation valid for the flexographic process by minimising the distance between both printability (measured/calculated and visual) but at the same time keeping the shape of the printability curves parallel for the other processes. The results of the different printability values (P) are presented in the figures 7 to 17.
P1 - VP
0,00
0,20
0,40
0,60
0,80
1,00
1,20
1,40
C10M
C14H
C16U I05
HI08
HI10
MK0
4HK1
0M K14H
K16U
O02H
O04H O06U V0
4HV14
HW04
HW14H X0
6UX1
1UX13
H
Pri
nta
bili
ty
P1 VP
Figure 7: Plot P1 – Visual Perception

Laurent, Girard Leloup ∗ Royal Institute of Technology ∗ 2002 128
P1 is a linear combination of all the quality parameters measured for the substrates 8-11. For the parameters with several measurements, like densities, mottling, … the arithmetic mean has been calculated and used as input for the equation.
P1=1- [(1/(max ∑αiAi )) * ∑αiAi ] (5)
with α i = +/ - 1 +1 for mottling, blurriness, raggedness, dot gain, colour failure, grey balance -1 for density, colour gamut, gloss Ai printability parameters
P2 - VP
0,00
0,20
0,40
0,60
0,80
1,00
1,20
C10M
C14H
C16U I05
HI08
HI10
MK0
4HK1
0M K14H
K16U
O02H
O04H O06U V0
4HV14
HW04
HW14H X0
6UX1
1UX13
H
Pri
nta
bili
ty
P2 VP
Figure 8: Plot P2 – Visual Perception

Laurent, Girard Leloup ∗ Royal Institute of Technology ∗ 2002 129
Distance to VP printability.
-0,25
-0,20
-0,15
-0,10
-0,05
0,00
0,05
0,10
0,15
0,20
0,25
1 2 3 4 5 6 7 8
Figure 9: Distance P2 to the Virtual Perception printability
P2 is a simplification of P1. The parameters qualified as “other parameters”: gloss, colour gamut, colour failure and grey balance has been eliminated from the equation. The αi coefficients are still +/- 1. The figure 9 shows the distance of P2 to the visual perception printability. All the values are in a range between -0.16 and + 0.15. These values show that the equation can be used as basis for a credible printability coefficient.
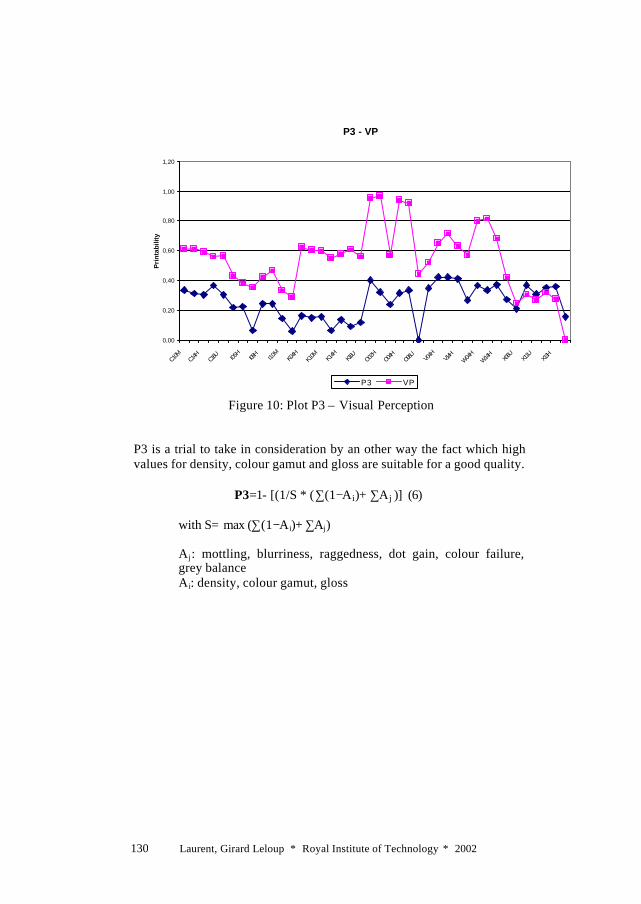
Laurent, Girard Leloup ∗ Royal Institute of Technology ∗ 2002 130
P3 - VP
0,00
0,20
0,40
0,60
0,80
1,00
1,20
C10M C14H
C16U I05
HI08
HI10
MK0
4HK1
0M K14H
K16U
O02H
O04H O06U V0
4HV14
HW04
HW14H X0
6UX1
1UX13
H
Pri
nta
bili
ty
P3 VP
Figure 10: Plot P3 – Visual Perception
P3 is a trial to take in consideration by an other way the fact which high values for density, colour gamut and gloss are suitable for a good quality.
P3=1- [(1/S * (∑(1−Ai)+ ∑Aj )] (6)
with S= max (∑(1−Ai)+ ∑Αj) Aj: mottling, blurriness, raggedness, dot gain, colour failure, grey balance Ai: density, colour gamut, gloss

Laurent, Girard Leloup ∗ Royal Institute of Technology ∗ 2002 131
P4 - VP
0,00
0,20
0,40
0,60
0,80
1,00
1,20
C10M C14H
C16U I05
HI08
HI10
MK0
4HK1
0M K14H
K16U
O02H
O04H
O06U
V04H
V14H
W04H W14H
X06U
X11U
X13H
Pri
nta
bili
ty
P4 VP
Figure 11: Plot P4 – Visual Perception
P4 is built on the P3 model by the same principle as P2 on P1.
P5 - VP
0,00
0,20
0,40
0,60
0,80
1,00
1,20
C10M
C14H
C16U I05
HI08
HI10
MK0
4HK1
0M K14H
K16U
O02H O04H O06U V04H
V14H
W04H W14H X06U
X11U
X13H
Pri
nta
bili
ty
P5 VP
Figure 12: Plot P5 – Visual Perception

Laurent, Girard Leloup ∗ Royal Institute of Technology ∗ 2002 132
P5=1- [(1/(max ∑αiAi )) * ∑αiAi ] (7) with αi = +1 for mottling, dot gain αi = -1 for density αi = 1/2 for blurriness, raggedness Ai printability parameters
P6 - VP
0,00
0,20
0,40
0,60
0,80
1,00
1,20
1,40
1,60
C05H
C11U
C15H I04
HI06
UI09
HI11
UK0
5HK1
1UK1
5HO01
HO03
MO05
HO07M V0
5HV1
5HW05H W15H X10
MX1
2HS1
7H
Pri
nta
bili
ty
P6 VP
Figure 13: Plot P6 – Visual Perception
P6=1- [(1/(max( ∑αιΑι )) ∗ ∑αιΑι ] (8) with αi = +3 for mottling αi = +4 for dot gain αi = -4 for density αi = +1 for blurriness, raggedness Ai printability parameters
P5 and P6 are both using the same raw data as P4 but the difference is the weighting of the different quality parameters. P5 is a trial to regroup raggedness and blurriness under a sharpness factor by weighting both parameters with 0.5. P6 is more ambitious and is recalculation of the printability coefficient by distribution of 13 weighting. The weighting corresponds to the number of measured fields for each parameter (CMYK=4, mottling 40%, one colour, overprint = 3).

Laurent, Girard Leloup ∗ Royal Institute of Technology ∗ 2002 133
b. Definition of a flexographic specific printability coefficient: The second step was to confront the best model to the flexographic process. This has been done by varying printing parameters like plate, volume of the anilox roller, nip pressure for different substrates.
Parameters plots
0,00
0,20
0,40
0,60
0,80
1,00
1 3 5 7 9
11 13 15 17 19 21 23 25 27 29 31 33 35 37 39 41 43 45 47 49 51
Qu
alit
y in
dex
Mottling 30% Mottling Solid area Bleeding Wicking
Dot Gain 50% Density 2% Density 50% Density 100%
Roundness 2% Roundness 30%
Figure 14: Plot of the different quality parameters for the flexography The figure 14 is only here to show the necessity of a printability coefficient. The interpretation of such a diagram is impossible and a method is needed to visualise the results.

Laurent, Girard Leloup ∗ Royal Institute of Technology ∗ 2002 134
P7
0,00
0,50
1,00
1,50
2,00
2,50
3,00
3,50
4,00
4,50
5,00
5,50
6,00
6,50
7,00
7,50
8,00
WT1E-H
OS081
00
WT1E-HO
S1210
0
WT1E-D
PS081
00
WT1E-D
PS121
00
WT1M-HO
S0810
0
WT1M-HO
S1220
0
WT1M-DP
S0820
0
WT1M-DP
S12200
SEUE
-HOS0
8200
SEUE
-HOS1
2200
SEUE
-DPS1
2100
SEUE
1HOS0
8100
SEUE
1HOS1
2100
SEUE
1DPS
08100
SEUE
1DPS
12200
SEUE
2HOS0
8200
SEUE
2HOS1
2200
SEUE
2DPS
12100
SEUM
-HOS0
8100
SEUM
-HOS1
2100
SEUM
-DPS0
8100
SEUM
-DPS1
2100
SEUM
1HOS0
8200
SEUM
1HOS
12200
SEUM
1DPS
08200
SEUM
1DPS
12200
Pri
nta
bili
ty
Figure 15: P7 for different plate/anilox/nip pressure/substrate combinations P7 is an adaptation of the P2 model for the quality 1-7. The equation has a similar construction. Moreover the quality parameters are this time specific for the flexography: - uniform coverage: density, mottling solid area, mottling 30% - line quality/edge sharpness: bleeding, wicking - dot quality: dot gain, roundness
P7 = ∑αi (1−(Αi/max Αi)) (9) with α i = +/ - 1 +1 for mottling 30% and solid area, wicking, bleeding, dot gain 2%, 30% and 50%, roundness 2% and 30% -1 for density 2%, 50% and full tone Ai printability parameters

Laurent, Girard Leloup ∗ Royal Institute of Technology ∗ 2002 135
MAX: 4.02 – MIN 1.14
P8
0,00
0,50
1,00
1,50
2,00
2,50
WT
1E-H
OS
0810
0
WT
1E-H
OS
0820
0
WT
1E-H
OS
1210
0
WT
1E-H
OS
1220
0
WT1
E-D
PS
0810
0
WT1
E-D
PS
0820
0
WT1
E-D
PS
1210
0
WT1
E-D
PS
1220
0
WT
1M-H
OS
0810
0
WT
1M-H
OS
1210
0
WT
1M-H
OS
1220
0
WT
1M-D
PS
0810
0
WT
1M-D
PS
0820
0
WT
1M-D
PS
1210
0
WT
1M-D
PS
1220
0
SE
UE
-HO
S08
100
SE
UE
-HO
S08
200
SE
UE
-HO
S12
100
SE
UE
-HO
S12
200
SE
UE
-DP
S08
200
SE
UE
-DP
S12
100
SE
UE
-DP
S12
200
SE
UE
1HO
S08
100
SE
UE
1HO
S08
200
SE
UE
1HO
S12
100
SE
UE
1HO
S12
200
SE
UE
1DP
S08
100
SE
UE
1DP
S08
200
SE
UE
1DP
S12
200
SE
UE
2HO
S08
100
SE
UE
2HO
S08
200
SE
UE
2HO
S12
100
SE
UE
2HO
S12
200
SE
UE
2DP
S08
200
SE
UE
2DP
S12
100
SE
UE
2DP
S12
200
SE
UM
-HO
S08
100
SE
UM
-HO
S08
200
SE
UM
-HO
S12
100
SE
UM
-HO
S12
200
SE
UM
-DP
S08
100
SE
UM
-DP
S08
200
SE
UM
-DP
S12
100
SE
UM
1HO
S08
100
SE
UM
1HO
S08
200
SE
UM
1HO
S12
100
SE
UM
1HO
S12
200
SE
UM
1DP
S08
100
SE
UM
1DP
S08
200
SE
UM
1DP
S12
100
SE
UM
1DP
S12
200
Pri
nta
bili
ty
Figure 16: P8 for different plate/anilox/nip pressure/substrate
combinations
P8 is a moderation of the printability coefficient P7 by weighting of the quality parameters. The principle of the weighting is to regroup factors of same contribution for a quality quantification and to give them together the same weighting (=1).
P8 = ∑αi (1−(Αi/max Αi)) (10)
with α i = +1/2 for mottling 30% and solid area, wicking, bleeding, roundness 2% and 30% +1 for dot gain -1/3 for density 2%, 50% and full tone Ai printability parameters

Laurent, Girard Leloup ∗ Royal Institute of Technology ∗ 2002 136
MAX: 1.52 – MIN: 0.60
P7 - P8
0,00
0,20
0,40
0,60
0,80
1,00
1,20
WT1E-H
OS0810
0
WT1E-H
OS1210
0
WT1E-DP
S0810
0
WT1E-D
PS121
00
WT1M-HO
S0810
0
WT1M-HO
S1220
0
WT1M-DP
S08200
WT1M-DP
S12200
SEUE
-HOS08
200
SEUE
-HOS12
200
SEUE
-DPS1
2100
SEUE
1HOS0
8100
SEUE
1HOS1
2100
SEUE
1DPS
08100
SEUE
1DPS
12200
SEUE
2HOS0
8200
SEUE
2HOS1
2200
SEUE
2DPS
12100
SEUM
-HOS0
8100
SEUM
-HOS1
2100
SEUM
-DPS0
8100
SEUM
-DPS1
2100
SEUM
1HOS0
8200
SEUM
1HOS1
2200
SEUM
1DPS
08200
SEUM
1DPS
12200
Pri
nta
bili
ty
P7 P8
Figure 17: Comparison P7-P8 printability for different plate/anilox/nip pressure/substrates combinations
4. Discussion The investigation has delivered 8 equations for a printability coefficient. The way the work has been conduced gives a logical orientation to the discussion for the establishment of a printability coefficient for the flexographic process. But before to study in details the final propositions P7 and P8, it is interesting to have a look at the P1-P6 coefficients. P1-P6 has been obtained by trying different linear combination of selected print quality parameters. The amplitude of the variation (see results part I) and the large number of substrates tested allow to make a credible analysis. P1 is for example very well adapted to the offset process (O). The shape of the curves are parallel and the distance between the plots are very limited. P2 has been used to construct the flexographic printability coefficient. P3 shows a very accurate compatibility with the Inkjet process (X). P4 and P5 can be qualified as neutral equations which can be used for example comparing to printing process: the curves do not correlate as well as for the other equations but the point for point

Laurent, Girard Leloup ∗ Royal Institute of Technology ∗ 2002 137
deviation is almost constant. P6 finally seems to be the right alternative for the digital printing technology (I and K). The flexographic specific part of the diagrams (U and V) is described by the equation P2. The form of the equation has also been kept for the second phase of the work and the establishment of the coefficient P7 and P8. The modification brought to P2 to obtain P7 and P8 had for objective to more precisely take care of the different flexographic specific parameters, both printing and quality parameters. The results confirm both the expected results and the visual judgement. The choice to use P7 or P8 depends of the panel of substrates to be tested: P8 could be employed for a first approach and P7 for a finer study.
5. Conclusion The present study has delivered valuable results. The most interesting result for the flexographic industry is that the possibility to have an objective quantification of the printability has been proved. This quantification called “Printability Coefficient” offers the printing and paper industries a simple comparison instrument. The numbers obtained can in the future be scaled and conduced to new development of the P7-P8 equations but it has been shown that the choose of the parameters and the form of the equation should be kept. The next step of the work should be to use these equations for a prevision of the printability and not only as a quality control instrument.

Laurent, Girard Leloup ∗ Royal Institute of Technology ∗ 2002 138
References: (1) Girard Leloup, L. “Analysis of the correlation between the print quality required in Flexography and the tolerances in materials and paper manufacturing in terms of printability.” FFTA Y2K Forum - Orlando (USA)
(2) Girard Leloup, L. “Statistical Analysis of the possibilities and limits of Flexographic Process Modelling.” TAGA 2000 - Colorado Springs (USA)
(3) Girard Leloup, L. “Study of paper printability in flexography by controlled variation of the surface roughness.” - IARIGAI 2000 - Graz (A) (4) “Provtryckning 2000” Research project (Sweden) Steadman, R., Woodall M. and Lesniak M. “The flexographic printability of linerboard” - Appita’93 Lindström, C., Dölling, R., Poustis, J. “Evaluating the printability of liner board for flexography” - Paper Technology (10/94)

Laurent, Girard Leloup ∗ Royal Institute of Technology ∗ 2002 139

Laurent, Girard Leloup ∗ Royal Institute of Technology ∗ 2002 140

Laurent, Girard Leloup ∗ Royal Institute of Technology ∗ 2002 141
Prediction of the Substrate Printability in Flexography by using a new established
“Printability Coefficient” LAURENT, GIRARD LELOUP
Research Corporation Media and Communication Technology (Framkom), Royal Institute of Technology (KTH), Stockholm, Sweden
Keywords: Flexography - Printability Coefficient - Prediction - Quality Control - Objectivity – Measurement – Printing parameters – Paper
Characteristics
INTRODUCTION The present paper is the last one of a series of papers regarding the results of a research work, which had for final goal to obtain an objective measurement and a prediction of the printability of different substrates (paper/board) for the flexographic process. After an analysis of the correlation between the different printing presses and modelling devices, a study of the influence of the different printing parameters onto the ink transfer, a quantification of the influence of the different paper characteristics on the printability, a definition, establishment and test for validation of different equations for a printability coefficient, the last part of the work was to look at the possibility to use the chosen coefficient for prediction of the printability of different substrates in flexography. This paper is a presentation of the method used and results obtained for different substrates, papers and boards printed in flexography. The elaborated method should help the paper and printing industries to a better communication and a common understanding of the word “printability”. The use of a “Printability Coefficient” and the expected generalisation of the method for all kind of peripheries and substrates should be a big step in the standardisation of a flexographic printing process still in development.

Laurent, Girard Leloup ∗ Royal Institute of Technology ∗ 2002 142
OBJECTIVE OF THE INVESTIGATION The objective of this research is to achieve the last step to an objective prediction of the printability for the flexographic process. The work is based on the equations presented at the TAGA conference in Mai 2001 (4). The equations has been improved and P9 / P10 will be used as final version. The research will look at the influence of the different parameters onto the printability, define the limits between the theoretical and practical results and at the end propose a procedure to reach the final goal. The procedure will contain an equation and “How to use it” method. RESULTS Equations for a “Printability Coefficient” The equations P9 and P10 have been established specific for the objective evaluation of the printability by flexographic printing. The correlation with subjective evaluation has been successful tested.
P9 = ∑αi (1−(Αi/max Αi )) (1)
with α i = +/ - 1 +1 for mottling 30% and solid area, wicking, bleeding, dot gain 50%, roundness 2% and 30% -1 for density full tone Ai printability parameters (printing and paper)
P10 = ∑αi (1−(Αi/max Αi )) (2)
with α i = +1/2 for mottling 30% and solid area, wicking, bleeding, roundness 2% and 30% +1 for dot gain -1 for density full tone Ai printability parameters (printing and paper)
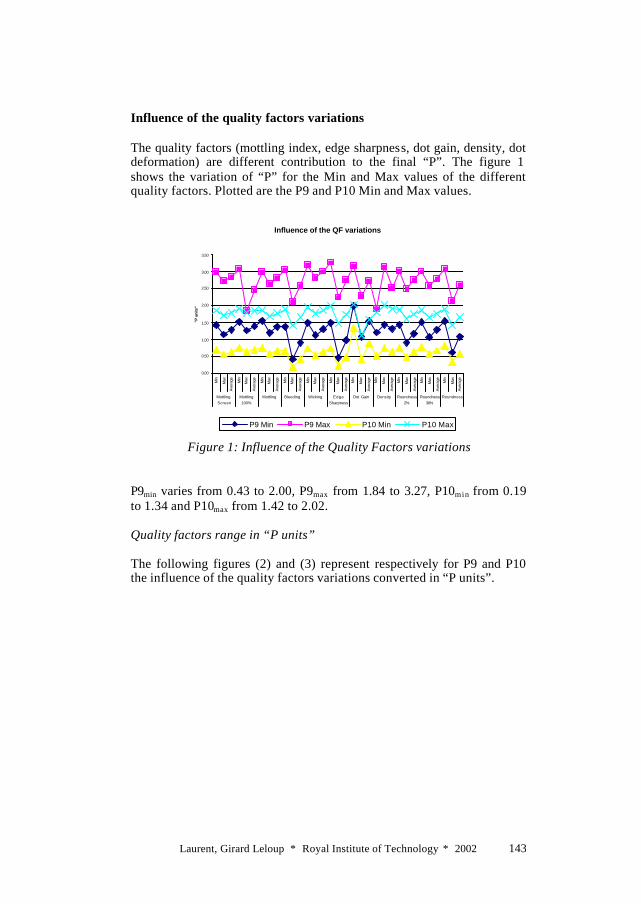
Laurent, Girard Leloup ∗ Royal Institute of Technology ∗ 2002 143
Influence of the quality factors variations The quality factors (mottling index, edge sharpness, dot gain, density, dot deformation) are different contribution to the final “P”. The figure 1 shows the variation of “P” for the Min and Max values of the different quality factors. Plotted are the P9 and P10 Min and Max values.
Influence of the QF variations
0,00
0,50
1,00
1,50
2,00
2,50
3,00
3,50
Min
Max
Ave
rage Min
Max
Ave
rage Min
Max
Ave
rage Min
Max
Ave
rage Min
Max
Ave
rage Min
Max
Ave
rage Min
Max
Ave
rage Min
Max
Ave
rage Min
Max
Ave
rage Min
Max
Ave
rage Min
Max
Ave
rage
MottlingScreen
Mottling100%
Mottling Bleeding Wicking EdgeSharpness
Dot Gain Density Roundness2%
Roundness30%
Roundness
"P u
nits
"
P9 Min P9 Max P10 Min P10 Max
Figure 1: Influence of the Quality Factors variations
P9min varies from 0.43 to 2.00, P9max from 1.84 to 3.27, P10min from 0.19 to 1.34 and P10max from 1.42 to 2.02. Quality factors range in “P units” The following figures (2) and (3) represent respectively for P9 and P10 the influence of the quality factors variations converted in “P units”.
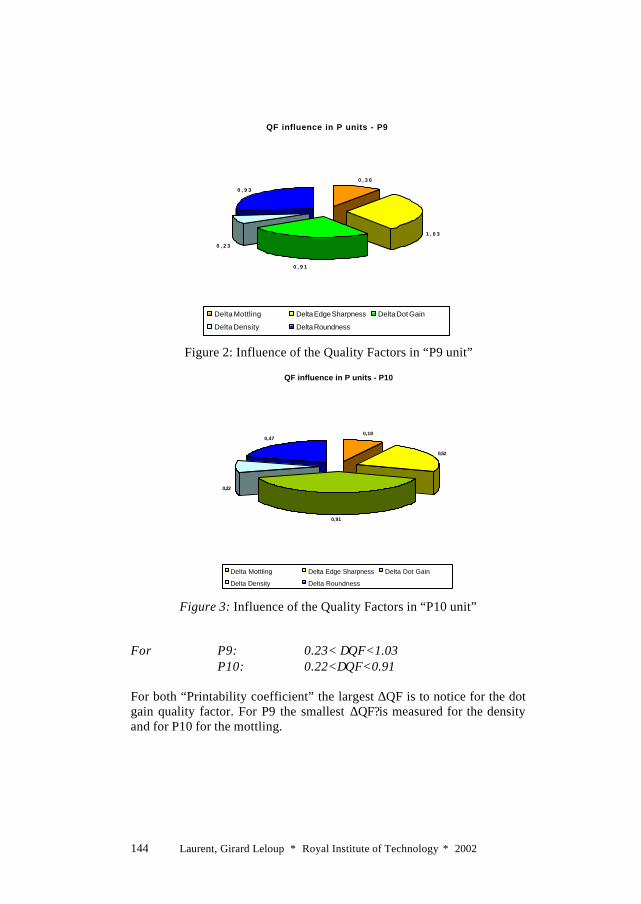
Laurent, Girard Leloup ∗ Royal Institute of Technology ∗ 2002 144
QF influence in P units - P9
0 , 3 6
1 , 0 3
0 , 9 1
0 , 2 3
0 , 9 3
Delta Mottling Delta Edge Sharpness Delta Dot Gain
Delta Density Delta Roundness
Figure 2: Influence of the Quality Factors in “P9 unit”
Figure 3: Influence of the Quality Factors in “P10 unit” For P9: 0.23< ∆QF<1.03 P10: 0.22<∆QF<0.91 For both “Printability coefficient” the largest ∆QF is to notice for the dot gain quality factor. For P9 the smallest ∆QF? is measured for the density and for P10 for the mottling.
QF influence in P units - P10
0,18
0,52
0,91
0,22
0,47
Delta Mottling Delta Edge Sharpness Delta Dot Gain
Delta Density Delta Roundness

Laurent, Girard Leloup ∗ Royal Institute of Technology ∗ 2002 145
Percentage of each QF range from the total P variation The figure 4 is a more detailed representation of the results of the influence of the quality factors. The mottling, edge sharpness and dot deformation quality factors are decomposed in their primary components. All the factors are related to the total “P” variation and the results are plotted in percentage of ∆P.
Figure 4: Influence of the Quality Factors in % The figure 4 confirms the precedent results and gives indications about the contribution of the primary factors. For mottling (17.07/15.24%) and dot deformation [roundness] (32.32/26.22%) the contribution are similar. For the edge sharpness the component bleeding with 57.93 - 39.67% to compare with 22.56 - 15.70% for wicking is the major contributor. Influence of the primary parameters variations onto the quality factors (QF) To reach the final goal, a prediction of the printability, it is necessary to go further down in the hierarchy and to look at the influence of the primary printing and paper parameters. By transitivity it will then be possible to calculate the global contribution of the primary parameters (printing and paper) to the “Printability Coefficient” variations. The first step is to calculate the influence in percent for each seven parameters. The results are obtained by dividing the ∆parameter (∆parameter =ParaMax-ParaMin) by the correspondent ∆printability.
QF influence in %
0,00
10,00
20,00
30,00
40,00
50,00
60,00
70,00
80,00
M30M1
00
Delta M
ottling
Bleedin
g
Wicking
Delta Edg
e Sha
rpnes
s
Delta D
ot Gain
Delta D
ensity
Round
ness 2
%
Round
ness
30%
Delta R
ound
ness
%
P9 P10

Laurent, Girard Leloup ∗ Royal Institute of Technology ∗ 2002 146
The printing parameters (PP) variations
Figure 5: Contribution of the printing parameters
Both positive and negative values are noticed for all the printing parameters. This has for consequence an improvement or a deterioration of one or other quality factors and also point one more time the complexity of the interaction between the different parameters. The trends are the same for three factors: mottling 30%, dot gain and roundness 30%. The range of the influence is varying from 50.81% for the nip pressure to 63.04% for the plate hardness. The influence onto the global mottling for the plate hardness is close to 0% (2.14%).
-30,00
-20,00
-10,00
0,00
10,00
20,00
30,00
40,00
50,00
% Anilox % Pressure % Hardness
%
Mottling 30% Mottling 100% Mottling % Bl Sharp
% W Sharp Sharpness Dot Gain Density
Round 2% Round 30% Roundness

Laurent, Girard Leloup ∗ Royal Institute of Technology ∗ 2002 147
The paper characteristics (PC) variations
-30,00
-20,00
-10,00
0,00
10,00
20,00
30,00
40,00
50,00
% Surface Roughness % Density P % Absorption % Porosity
%
Mottling 30% Mottling 100% Mottling % Bl Sharp
% W Sharp Sharpness Dot Gain Density
Round 2% Round 30% Roundness
Figure 6: Contribution of the paper characteristics
Against positive and negative values are read on the figure. Moreover for the porosity the trend is clear: only the influence on the wicking shows a significant positive value. The influence of the surface roughness and absorption are positive for the mottling and edge sharpness quality factors. It is also interesting to remark the similarity of the values. The range of the influence is varying from 30.41% for porosity to 44.44% for the surface roughness . The surface roughness, density and absorption notice values around 0% for respectively the dot deformation, wicking and mottling solid area/density quality factors. Partial contribution of each parameter to the final “Printability Coefficient” The printing parameters The following figures represent the results for the printing parameters: Anilox roller volume, plate/paper nip pressure and hardness of the printing plate. The results are presented for P9 and P10.

Laurent, Girard Leloup ∗ Royal Institute of Technology ∗ 2002 148
The results are given is percent per unit. The intermediate results from the precedent chapter are reduced to a “united result”. The units for the printing parameters can be read in the table below. Table 1: Units for the printing parameters
Unit
Anilox Roller Volume 0.5 cm3/ m2
Plate/Paper Nip Pressure 10 µm
Hardness of the plate 1 Shore A
-3,5
-3,0
-2,5
-2,0
-1,5
-1,0
-0,5
0,0
0,5
1,0
1,5
2,0
2,5
3,0
3,5
4,0
% Anilox / P9 % Pressure / P9 % Hardness / P9
Mottling 30% Mottling 100% Mottling % Bl Sharp
% W Sharp Sharpness Dot Gain Density
Round 2% Round 30% Roundness
Figure 7: Partial contribution of the PP on the QF (P9)

Laurent, Girard Leloup ∗ Royal Institute of Technology ∗ 2002 149
-3,5
-3,0
-2,5
-2,0
-1,5
-1,0
-0,5
0,0
0,5
1,0
1,5
2,0
2,5
3,0
3,5
4,0
% Anilox / P10 % Pressure / P10 % Hardness / P10
Mottling 30% Mottling 100% Mottling % Bl Sharp
% W Sharp Sharpness Dot Gain Density
Round 2% Round 30% Roundness
Figure 8: Partial contribution of the PP on the QF (P10)
To be able to interpret the different figures a scale has been established. The scale allows a correspondence between the proportional unit influence and the greatness of the influence. The table should be compared to the, for ∆E, known table. The scale is using the nominal values. Table 2: Degree of importance
% Degree
< 0.25 minimal
0,25<βi<1 important
1<βi<2 very important
>2 principal The dot gain with values over 1% seems to be the common factor to all the printing parameters for both P9 and P10. The nip pressure shows as well a great influence (-1.4%) on the bleeding. Comparable is the influence of the anilox roller on the density (0.9%). For P9 the variations are between –1.4 and +1.5 %, for P10 between –0.9 and +2.0 %, what means the same 2.9% range.

Laurent, Girard Leloup ∗ Royal Institute of Technology ∗ 2002 150
The paper parameters The following figures represent the results for the printing parameters: Surface Roughness, Density, Absorption and Porosity. The results are presented for P9 and P10. Table 3: Units for the paper characteristics
Unit
Surface Roughness 100 ml/min
Density 100 kg/m3
Absorption 0.1 cm3/ m2
Porosity 5 ml/min
-3,5
-3,0
-2,5
-2,0
-1,5
-1,0
-0,5
0,0
0,5
1,0
1,5
2,0
2,5
3,0
3,5
4,0
% Surface Roughness /P9
% Density P / P9 % Absorption / P9 % Porosity / P9
Mottling 30% Mottling 100% Mottling % Bl Sharp
% W Sharp Sharpness Dot Gain Density
Round 2% Round 30% Roundness
Figure 9: Partial contribution of the PC on the QF (P9)

Laurent, Girard Leloup ∗ Royal Institute of Technology ∗ 2002 151
-3 ,5
-3 ,0
-2 ,5
-2 ,0
-1,5
-1,0
-0 ,5
0 ,0
0 ,5
1,0
1,5
2 ,0
2 ,5
3 ,0
3 ,5
4 ,0
% SurfaceRoughness / P10
% Density P / P10 % Absorption /P10
% Porosity / P10
Mottling 30% Mottling 100% Mottling % Bl Sharp
% W Sharp Sharpness Dot Gain Density
Round 2% Round 30% Roundness
Figure 10: Partial contribution of the PC on the QF (P10)
The first observation is that the proportional united influences are larger for the paper parameters than for the printing parameters. For the density, absorption and porosity, the influence onto the dot gain is over 2%. The bleeding shows as well values around 2% for the surface roughness, the density and the absorption (around 1.5% for P10). For the same parameters give the mottling 30% values around 1%. A further value over 1% (1.2%) is the wicking for the porosity parameter. For P9 the variations are between –2.4 and +2.7 %, for P10 between –3.2 and +3.7 %. Global contribution of each parameter to the final “Printability Coefficient” Each parameter influences the different quality factors positively or negatively. By acting of one or more primary parameters it is possible to control one or more quality factors. If the goal is to control the whole printability it is interesting to look at the global contribution of each primary parameter. The user can then decide at which level to work and which are the parameters with a principal importance.

Laurent, Girard Leloup ∗ Royal Institute of Technology ∗ 2002 152
2,53,0
-0,3
0,7
2,1 2,32,6
2,1
-0,5
1,2
5,15,3
-4,1-4,5
-6,0
-5,0
-4,0
-3,0
-2,0
-1,0
0,0
1,0
2,0
3,0
4,0
5,0
6,0
7,0
% A
nilo
x / P
9
% A
nilo
x / P
10%
Pres
sure
/ P9
% P
ress
ure /
P10
% H
ardn
ess
/ P9
% H
ardn
ess /
P10
% S
urfa
ce R
ough
ness
/ P9
% S
urfa
ce R
ough
ness
/ P1
0%
Den
sity
P / P
9%
Den
sity
P / P
10%
Abs
orpt
ion
/ P9
% A
bsor
ptio
n / P
10
% P
oros
ity /
P9%
Por
osity
/ P1
0
"P u
nits
" %
Figure 11: Global contribution of the PP and PC on “P”
The study of the figure 11 suggests to divide the primary parameters in 3 categories. The first one will regroup the porosity and the absorption and will be called “first importance parameters”, the second one the anilox roller volume, the plate hardness and surface roughness, called “priority parameters” and finally the third one the nip pressure and the density, called “less important parameters”. The parameters in the last category are qualified as “less important” parameters and not as non-important parameters. The influence below 1% is not to underestimate and means only that the influences on the different quality factors are neutralizing themselves. The plotted values are the results for a decrease of one unit from the standard value. This means for example: the surface roughness will be improved with 100 ml/min and the absorption with 0.1 cm3/ m2:
P10p = Pav * (1+ 0.26 + 0.53) = 1.29

Laurent, Girard Leloup ∗ Royal Institute of Technology ∗ 2002 153
DISCUSSION Establishment of a prediction procedure for the printability Definition of a reference (average values) To be able to predict the printability without any trials it is necessary to have a reference. This reference will be constructed by taking the average values for both the printing and paper parameters. As printability for the reference configuration will be associated the mean value of P calculated in the experimental phase of the project. The reference shows also the following characteristics: Printing parameters: Anilox roller volume: 10 cm3/m2 Nip (plate/substrate) pressure: 150 µm Printing Plate Hardness: 64 Shore A Paper parameters: Paper Density: 735 kg/m3 Surface Roughness (Bendtsen): 550 ml/min Absorption (Bristow): 13,55 cm3/m2 Porosity (Bendtsen): 152,5 ml/min The mean values for P are: P=2.22 for P9 and P=1.20 for P10. Determination of the Min and Max values The Min and Max values will serve the user to judge the quality of the combinations, she/he has simulated and calculated the “Printability Coefficient” for. P9min= 7*0 + (-1)*1= -1 P10min= 4*0 + (-1)*1= -1 P9max= 7*1 + (-1)*0= 7 P10max= 4*1 + (-1)*0= 4 Min and Max values are calculated by giving the (Ai/max Αi ) (9) the values 1 (worst) or 0 (best). Theoretical and practical optimal quality The theoretical achievable quality is the quality calculated in the precedent chapter: 7 and 4 respectively for P9 and P10. Moreover the

Laurent, Girard Leloup ∗ Royal Institute of Technology ∗ 2002 154
process has certain limitation and tolerances, which has to be reflected in the judgement. The correction is effectuated by considering the tolerances for the quality factors. Mottling: a mottling of 2 will be considered as good as a 0 mottling, 12 as the maximum => 2/12=0.17 Edge Sharpness: an edge sharpness of 1 is to assimilate to an ideal result and 10 to the worst case => 1/10=0.10 Density: 1.6 is the target fixed for the density, it is to compare to the 2.2 max value => 1-(1.6/2.2)=0.28 Dot Gain: 15% is fixed as the top quality limits, 40% are expected as maximum => 15/40=0.38 Dot Deformation (Roundness): 1.15 will be seen as a non-significant deformation and 2.30 as a maximum deformation => 1.15/2.30=0.50 The restriction defined give for P9 / P10 the following results: P9best = 7 – (0.17*2+0.10*2+0.38+0.28+0.50*2) = 4.80 P10best = 4 – (0.17+0.10+0.38+0.28+0.50) = 2.57 The same approach allows to fix the worst achievable quality by 0 for both P9 and P10. This is a logical consequence of the interaction of the quality factors. => 0.0 < P9 < 4.80 0.0 < P10 < 2.57 Judgement of the quality The limits for P are now known. The centre of the variation interval will be considered as the “at least to achieve quality” (Pg) for the prediction stage.
P9g = 2.40 P10g = 1.29

Laurent, Girard Leloup ∗ Royal Institute of Technology ∗ 2002 155
0,00
5,00
1
2
3
45
6
7
Pp Pm Pav
Pmin Pmax Pg
Figure 12: Visualisation of the Printability for different calculated Pp
The figure 12 is a proposition for a representation of the different Pp calculated. The points located in the area between Pg and Pmax are the points researched. Prediction of the Printability The next step is to make the calculation of a prediction for P (Pp). For the calculation the user needs to know or choose values for the printing and paper parameters. These values (xi) are the input for the evaluation of the deviation to the standard values (a i). The deviation will then be divided by the unit coefficient (c i) and multiply by (fi), the, in percent, influence coefficient. The sum on the i indexes of the results for the different (a i) will be called “p”. Pp is then the result of the multiplication of (p/100 + 1) by the average value of P (Pav).
p = ∑ {[ (xi - ai) / c i] * f i } (3)
Pp = Pav * (p/100 +1) (4)

Laurent, Girard Leloup ∗ Royal Institute of Technology ∗ 2002 156
After printing The last step of the process takes place after the printing stage. To personalize the Pp the user has the possibility to calculate a ∆P, which will give him an idea of the accuracy of his prediction. The ∆P can be used to adjust with an iterative procedure more precisely the f i to his production.
∆P = Pp – Pm (5)
Pm is with the P9 or P10 equations measured “Printability Coefficient”. CONCLUSION The demand of High Quality Flexography is growing very fast and the exigencies are becoming higher and higher. All the sectors of the flexographic fields work to improve their products. The luck of standardisation and the diversity of the products on the market are responsible for difficulties in the right choice of the materials. The research work presented in this paper proposes a tool to solve this problem. With the help of the “Printability Coefficient” and the prediction procedure will the flexography manage the challenge of the future! REFERENCES (1) Girard Leloup, L. “Analysis of the correlation between the print quality required in Flexography and the tolerances in materials and paper manufacturing in terms of printability.” - FFTA Y2K Forum - Orlando (USA)
(2) Girard Leloup, L. “Statistical Analysis of the possibilities and limits of Flexographic Process Modelling.” - TAGA 2000 - Colorado Springs (USA)
(3) Girard Leloup, L. “Study of paper printability in flexography by controlled variation of the surface roughness.” - IARIGAI 2000 - Graz (A)

Laurent, Girard Leloup ∗ Royal Institute of Technology ∗ 2002 157
(4) Girard Leloup, L. “Establishment and Comparison of Different Definitions and Equations for a “Printability Coefficient” for the Flexographic Process.” – TAGA 2001 – San Diego (USA) (5) Girard Leloup, L. ”A Flex-Odyssey…” - FFTA Forum 2001 – Nashville (USA) “Provtryckning 2000” DPC-FRAMKOM-STFI Research project (Sweden) “Minutes” - Paptac Printing and Graphic Arts Committee Meeting – 10/1998 – Québec (Canada) Prof. Dr.-Ing. Dr.H.C.L. Göttsching, Dr.-Ing. C. Ness, “Two-Dimensional Characterisation on the Surface of Paper with reference to its Printability” – Institute für Papierfabrikation, Darmstadt (D) Armel, D., Cusdin, G., “ Plates & Printability ” – FQC FLEXO 04/2001