measurement equivalence of paper-and-pencil and …users.ugent.be/~flievens/internetpaper.pdf ·...
TRANSCRIPT

APPLIED PSYCHOLOGY: AN INTERNATIONAL REVIEW, 2009,
58
(2), 336–361doi: 10.1111/j.1464-0597.2008.00350.x
© 2008 The Authors. Journal compilation © 2008 International Association of AppliedPsychology. Published by Blackwell Publishing, 9600 Garsington Road, Oxford OX4 2DQ,UK and 350 Main Street, Malden, MA 02148, USA.
Blackwell Publishing LtdOxford, UKAPPSApplied Psychology0269-994X1464-0597© International Association for Applied Psychology, 2008XXX Original ArticlesPAPER-AND-PENCIL AND INTERNET SURVEYSDE BEUCKELAER AND LIEVENS
Measurement Equivalence of Paper-and-Pencil and Internet Organisational Surveys: A Large Scale
Examination in 16 Countries
Alain De Beuckelaer*
Radboud University Nijmegen, The Netherlands
Filip Lievens
Ghent University, Belgium
In multinational surveys, mixed-mode administration modes (e.g. combiningInternet and paper-and-pencil administration) are increasingly used. To date,no studies have investigated whether measurement equivalence exists betweenInternet data collection and data collection using the conventional paper-and-pencil method in organisational surveys which include a large number ofcountries. This paper examined the measurement equivalence of a truly globalorganisational survey across Internet and paper-and-pencil survey administrations.Data from an organisational survey in 16 countries (
N
= 52,461) across theglobe were used to assess the measurement equivalence of an organisationalclimate measure within each country in which the survey was administered.The empirical data provided strong indications which support the measurementequivalence of the multi-item survey instrument across Internet and paper-and-pencil surveys in virtually all countries in which the survey was conducted.These findings suggest that merging data obtained through Internet andpaper-and-pencil data administration in a particular country is legitimate asno evidence was found for differential effects across both modes of data collection.
Dans les enquêtes internationales, les modalités d’administration mixtes, c’est-à-dire combinant les solution Internet et papier-crayon, sont de plus en plusutilisées. Jusqu’à présent, on ignore si le recueil de données par Internet estméthodologiquement équivalent au recueil traditionnel sur papier dans lesenquêtes organisationnelles qui couvrent un grand nombre de pays. Dans cetarticle, on analyse l’analogie des mesures d’une enquête organisationnellevéritablement universelle utilisant à la fois une administration Internet etpapier-crayon. Des données provenant de seize pays (
N
= 52,461) répartis
* Address for correspondence: Alain De Beuckelaer, Radboud University Nijmegen,Thomas van Aquinostraat 1, P.O. Box 9108, 6500 HK Nijmegen, The Netherlands. Email:[email protected]
The authors would like to thank Martine van Sehm, Csilla Horvath, Olivier Furrer and threeanonymous reviewers for their useful comments on earlier versions of this paper.
PAPER-AND-PENCIL AND INTERNET SURVEYS
337
© 2008 The Authors. Journal compilation © 2008 International Association of AppliedPsychology.
sur l’ensemble de la planète ont été exploitées pour évaluer l’équivalenceméthodologique d’une mesure du climat organisationnel dans chacun de cespays. Les résultats empiriques sont en faveur de l’équivalence méthodologiquede l’ensemble des items pour les recueils Internet et papier-crayon danspratiquement tous les pays retenus pour l’enquête. Ces résultats montrent qu’ilest légitime de traiter ensemble les données obtenues par Internet et parpapier-crayon dans un même pays puisque rien ne nous permet d’affirmerl’existence d’un effet différentiel dû aux deux modes d’administration.
INTRODUCTION
The globalisation of the marketplace is arguably the most importantchallenge companies face today. The globalisation process affects all aspectsof policy-making in multinational companies, including Human Resource(HR) management. Global organisational surveys (also known as employeeattitude surveys or employee opinion surveys) constitute a specific instrumentwhich allows HR professionals to evaluate whether the global humanresource management policy is effective. Given their global reach, organisa-tional surveys are typically distributed to a wide variety of employeesworking in different countries all over the world.
Nowadays, organisations are increasingly making use of a “mixed-mode”administration approach. That is, organisational surveys typically combinesurvey administration using the Internet (i.e. web-based surveys) and itsconventional equivalent, namely survey administration by means of thepaper-and-pencil (PP) method. It is expected that this particular type ofmixed-mode survey will account for a substantial proportion of organisationalsurveys in the foreseeable future (Fenlason & Suckow-Zimberg, 2006). Inmixed-mode surveying, the choice of a specific data collection method istypically an individual (e.g. respondents have the discretion to choose aspecific data collection method) and/or organisational decision (e.g. in somedivisions and departments, Internet access is restricted by the organisationto specific groups of employees).
A key methodological assumption underlying such mixed-mode organisationalsurveys is that data from paper-and-pencil and Internet surveys can bemeaningfully combined and compared. That is, to enable a meaningfulsubstantive interpretation of the overall results, measurement equivalenceacross the two modes of data collection (e.g. Fenlason & Suckow-Zimberg,2006, pp. 185–187) should be established. The establishment of measure-ment equivalence implies the absence of measurement effects (i.e. biases) ofcollecting survey data through the Internet as compared to using the PPmethod.
The purpose of this paper is to examine whether survey questions used tomeasure work-related constructs exhibit measurement equivalence across

338
DE BEUCKELAER AND LIEVENS
© 2008 The Authors. Journal compilation © 2008 International Association of AppliedPsychology.
PP and Internet administrations of a global organisational survey. Althoughprior studies have examined the measurement equivalence across PP andInternet administrations within a given country (Stanton, 1998; Buchanan &Smith, 1999), this study is the first one to examine measurement equivalenceof a mixed-mode administration format in a large number of countries.
STUDY BACKGROUND
Paper-and-Pencil, Internet, and Mixed-Mode Organisational Surveys
In recent years, an increasing number of organisations have started to usethe Internet as a medium for collecting data (Thompson, Surface, Martin,& Sanders, 2003). Generally, it has been argued that Internet surveying hasseveral advantages over the more conventional PP method (Yun & Trumbo,2000). As compared to PP surveys, Internet surveys are less costly (Dillman,2000; Kraut & Saari, 1999; Schaeffer & Dillman, 1998; Sproull, 1986; Yun& Trumbo, 2000), lead to faster survey responses (Schaeffer & Dillman,1998; Sproull, 1986), allow for greater flexibility in survey design (Dillman,2000), and offer a wider variety of response formats (Simsek & Veiga, 2001).In addition, Internet surveys have a wider geographical reach (Epstein,Klinkenberg, Wiley, & McKinley, 2001), do not suffer from human (coding)errors (Cook, Heath, Thompson, & Thompson, 2001; Roberts, Konczak, &Macan, 2004), are free of experimenter bias (Birnbaum, 2001; Reips, 2000),are less sensitive to order of question effects due to the ease of randomisingquestions (see Bowling, 2005), and do not have that many missing values(i.e. they are more “complete”; Stanton, 1998).
1
As far as organisationalsurveys are concerned, the most important reasons for using Internetsurveying (in addition to paper-and-pencil surveys) may be: (1) increasedefficiency of the data collection process (e.g. faster data collection throughthe use of available PC technology), (2) the elimination of human codingerrors, and (3) a cost-reduction (at least, if it concerns a truly large surveyin many regions of the world).
However, Internet surveying has some drawbacks as well. Disadvantagesof Internet surveying may include higher non-response rates (Schaeffer &Dillman, 1998; Sproull, 1986), a higher probability of getting dishonestanswers (Booth-Kewley, Edwards, Rosenfeld, 1992; Lautenschlager &Flaherty, 1990), potential technological problems (Kraut & Saari, 1999),
1
Some of the advantages of Internet surveying mentioned in the text may not always apply.Initial start-up costs, for instance, may reduce or even completely eliminate anticipated cost-savings. Similarly, technical problems may cause additional delays in the completion of thedata collection process (Mann & Stewart, 2000; van Selm & Jankowski, 2006).
PAPER-AND-PENCIL AND INTERNET SURVEYS
339
© 2008 The Authors. Journal compilation © 2008 International Association of AppliedPsychology.
decreased item reliability due to somewhat higher measurement errors(Stanton, 1998), and the possibility of multiple submissions (Reips, 2000).In addition, Internet survey methods are somewhat restricted in that theymay not provide sufficient coverage of all occupational groups representedin the organisation being studied (Bowling, 2005). As indicated by Stantonand Rogelberg (2001), individuals belonging to different occupationalgroups may have varying access to computers, e-mail, the Internet (or theIntranet) during working hours. Employees from different occupationalgroups may also differ from one another in terms of their computer literacy.Furthermore, regional differences may also exist as the use of Internetsurveys may not be feasible in some specific regions in the world (e.g. insome of the developing countries) in which the organisation has businessactivities.
Given the limitations of Internet surveying just mentioned, it is oftennecessary to combine Internet surveys with more conventional modes ofdata collection such as the PP method. As such, the response rate of thetotal sample might improve (Yun & Trumbo, 2000). As noted above, ifmultinational organisations want to compare survey data from such mixed-mode (data collection) procedures, it is crucial that there are no measurementeffects of collecting survey data through Internet as compared to using thePP method. In fact, establishing measurement equivalence across surveyadministration modes is necessary to enable meaningful interpretation ofthe substantive results in all countries participating in the research (see, forinstance, Vandenberg, 2002; Vandenberg & Lance, 2000).
Research on Measurement Equivalence of Survey Measures across Internet and Paper-and-Pencil Administrations
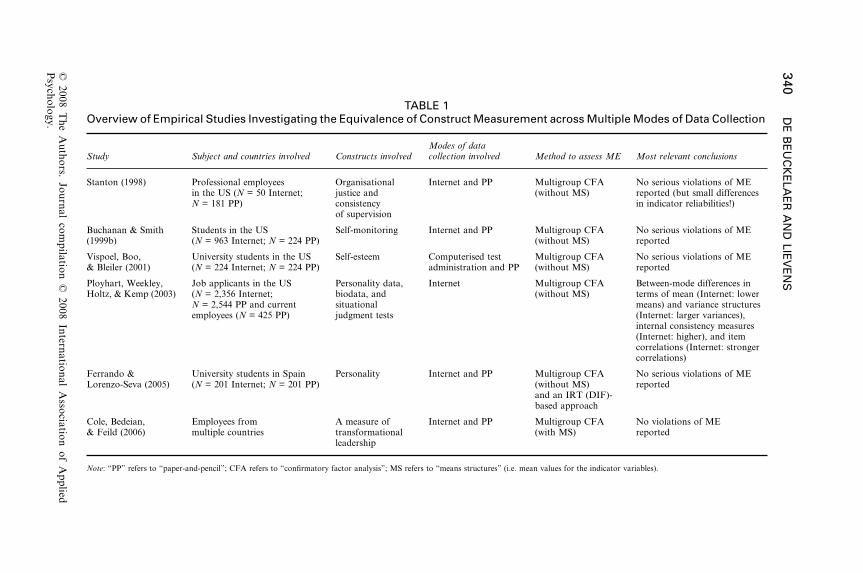
In the past, various studies examined whether survey questions used tomeasure work-related constructs exhibit measurement equivalence acrossInternet and PP surveys. As shown in Table 1, prior studies used a widevariety of surveys including (but not limited to) organisational surveys.Note that Table 1 presents only those studies that used “advanced” analyticalmethods (i.e. confirmatory factor analysis and item response models) fortesting for measurement equivalence across data collection modes.
One group of studies examined measurement equivalence of general psy-chological measures (thus not in an organisational context). Buchanan andSmith (1999) and Ferrando and Lorenzo-Seva (2005) relied on samples ofstudents in the US and Spain, respectively. In the former study, the surveyinstrument comprised items measuring self-monitoring, whereas the lattersurvey instrument contained items of the Eysenck Personality Questionnaire.Both studies demonstrated measurement equivalence across different data
340
DE
BE
UC
KE
LAE
R A
ND
LIEV
EN
S
© 2008 T
he Authors. Journal com
pilation © 2008 International A
ssociation of Applied
Psychology.
TABLE 1Overview of Empirical Studies Investigating the Equivalence of Construct Measurement across Multiple Modes of Data Collection
Study Subject and countries involved Constructs involvedModes of data collection involved Method to assess ME Most relevant conclusions
Stanton (1998) Professional employees in the US (
N
= 50 Internet;
N
= 181 PP)
Organisational justice and consistency of supervision
Internet and PP Multigroup CFA (without MS)
No serious violations of ME reported (but small differences in indicator reliabilities!)
Buchanan & Smith (1999b)
Students in the US (
N
= 963 Internet;
N
= 224 PP)Self-monitoring Internet and PP Multigroup CFA
(without MS)No serious violations of ME reported
Vispoel, Boo, & Bleiler (2001)
University students in the US (
N
= 224 Internet;
N
= 224 PP)Self-esteem Computerised test
administration and PPMultigroup CFA(without MS)
No serious violations of ME reported
Ployhart, Weekley, Holtz, & Kemp (2003)
Job applicants in the US (
N
= 2,356 Internet;
N
= 2,544 PP and current employees (
N
= 425 PP)
Personality data, biodata, and situational judgment tests
Internet Multigroup CFA (without MS)
Between-mode differences in terms of mean (Internet: lower means) and variance structures (Internet: larger variances), internal consistency measures (Internet: higher), and item correlations (Internet: stronger correlations)
Ferrando & Lorenzo-Seva (2005)
University students in Spain (
N
= 201 Internet;
N
= 201 PP)Personality Internet and PP Multigroup CFA
(without MS) and an IRT (DIF)- based approach
No serious violations of ME reported
Cole, Bedeian, & Feild (2006)
Employees from multiple countries
A measure of transformationalleadership
Internet and PP Multigroup CFA (with MS)
No violations of ME reported
Note
: “PP” refers to “paper-and-pencil”; CFA refers to “confirmatory factor analysis”; MS refers to “means structures” (i.e. mean values for the indicator variables).
PAPER-AND-PENCIL AND INTERNET SURVEYS
341
© 2008 The Authors. Journal compilation © 2008 International Association of AppliedPsychology.
collection modes. Similar conclusions were drawn by Vispoel, Boo andBleiler (2001). Conversely, Ployhart, Weekley, Holtz, and Kemp (2003)reported some differences across Internet surveys and PP surveys usingpsychological measures and other measures (e.g. biodata) in terms of meanstructures, variance structures, internal consistency measures, and itemcorrelations. Another study by Stanton (1998) examined measurementequivalence in an organisational survey context. US employees completed asurvey related to fairness and organisational justice perceptions. Data fromemployees who responded via the Internet (
N
= 50) were compared to datafrom a comparable sample of employees (
N
= 181) who used the PPmethod. Apart from small differences in item reliabilities, confirmatoryfactor analyses revealed no measurement effects across data collectionmodes.
Although the results of these prior studies are insightful, they share severallimitations. First, most studies relied on survey data from only one country(i.e. either the US or Spain). Accordingly, these studies are relevant only forsurveys conducted in a national context and do not generalise to internationalsurveys. The study by Cole, Bedeian, and Field (2006) is an exception as ithad an international scope. Unfortunately, the study offered only a roughtentative test on possible violations of measurement equivalence of thesurvey instrument across Internet and PP surveys. Cole et al. (2006) had torely on two aggregate samples (i.e. an Internet sample [
N
= 4,244] and aPP sample [
N
= 665]), each of which included survey responses from a largenumber of countries (50) in unequal proportions. As the Internet and PPsamples were not homogeneous, their approach to measurement equivalencetesting may have led to a biased comparison between the Internet and thePP sample. A related issue concerns the size of the sample used in Coleet al. (2006). As the PP sample by Cole et al. (2006) had only 13 observationsper country on average (i.e.
N
= 665/50), it did not allow for making validmeasurement equivalence tests between Internet and PP surveys at thecountry level. This is a serious limitation as most organisational surveys areconducted in a large number of countries, and results are typically reportedat country level. Hence, country-specific assessments of systematic differ-ences between Internet and PP surveys would be a welcome addition to theliterature on organisational surveys. To the best of our knowledge, thisstudy will be the first to make a large number of country-specific com-parisons across Internet and PP surveys using comparable Internet andPP samples. The examination of mixed-mode differences within a largenumber of countries is critical as one should account for the possibility ofcross-country differences in the establishment of measurement equivalenceacross PP and Internet administrations. In particular, a recent study in themarketing domain (Weijters, 2006) demonstrated that in Internet surveysrespondents provide a “no answer” less frequently to an item (regardless of
342
DE BEUCKELAER AND LIEVENS
© 2008 The Authors. Journal compilation © 2008 International Association of AppliedPsychology.
item content). In addition, in Internet surveys respondents tend to use theextreme points of a scale less frequently. Cross-cultural research has shownthat response tendencies (e.g. choosing the extreme rating points) differfrom culture to culture (Johnson, Kulesa, Ik Cho, & Shavitt, 2005; VanHerk, Poortinga, & Verhallen, 2004). Therefore, it is crucial to assessmeasurement equivalence across both modes of data collection within awide variety of countries.
Most previous studies are also limited because they did not use organisationalmembers from different occupational groups (see Table 1). In most studies,students, job applicants, or employees were used to test for measurementequivalence between PP and Internet surveys. It is very likely that higher-level organisational members may show a stronger tendency to respond viathe Internet than lower-level organisational members. The reason for thismay be that the former group has more frequent access to the Internet thanthe latter group. Hence, an adequate assessment of measurement equivalence ofan organisational measure should take into account organisational members’job level.
A third limitation relates to the use of the analytical technique for testingmeasurement equivalence. In all prior studies (with the exception of Coleet al., 2006), multigroup confirmatory factor analysis (CFA) was used. InCFA, only covariances between observed variables (i.e. items) are modeled.Mean values of the observed variables (items) are not modeled. As such,multigroup CFA may detect differences in factor loadings of survey itemsacross modes of data collection (i.e. the groups under study). Yet, it fails todetect differences in item intercepts. The equality of factor loadings
and
itemintercepts (also known as
scalar equivalence
) is required whenever (estimated)construct means are to be compared across groups or countries (see Chan,2000; Little, 1997; Meredith, 1993). To test for scalar equivalence, using amultigroup Mean and Covariance Structure (MACS) analysis is generallyrecommended (Sörbom, 1974, 1978). A MACS analysis differs from amultigroup CFA in that item intercepts are modeled in addition to thecovariances between the items.
Purpose and Contributions of Present Study
The purpose of this study is to examine the measurement equivalence ofsurvey data across modes of data collection (PP and Internet) in mixed-mode surveys conducted in a large number of countries. This study contributesto the existing literature on survey research in three key ways. First, weexamine whether the data from a truly global organisational survey showmeasurement equivalence across modes of data collection using data from
multiple countries
(16) based on disaggregate observations. As arguedbefore, measurement invariance tests are conducted on a country-by-country
PAPER-AND-PENCIL AND INTERNET SURVEYS
343
© 2008 The Authors. Journal compilation © 2008 International Association of AppliedPsychology.
basis. Second, we examine the measurement equivalence across data collectionmodes while controlling for differences in employees’
job level
. Third, weuse
Mean and Covariance Structure Analysis
to formally test the assumptionof
scalar
equivalence as part of the series of measurement equivalence testsconducted.
METHOD
Sample and Procedure
Data from 52,461 respondents in 16 countries were collected in 2004 withina multinational company in the fast-moving consumer goods sector. Themultinational has business operations in more than 70 countries across theworld. The actual survey contains data on more than 16 countries butcountries were only selected for inclusion in this study if the sample size ofInternet and PP responses exceeded
N
= 90. As shown later in this paper,this minimum sample size resulted in a subject–variable ratio of about 7.0.
In principle, all employees (with different job levels) were surveyed. In theUnited States, however, some lower-level employees were not surveyed (dueto union restrictions). The people surveyed were informed in advance aboutthe purpose of the survey, the content coverage, and the confidentiality ofthe data provided. The goal of the organisational survey was (1) to enhanceemployees’ involvement and motivation and (2) to provide baseline data fororganisational change efforts. Data collection through the Internet startedafter all employees having regular access to the Internet received a massmail. They responded to the survey at their individual work site. Reminderswere sent to people who did not respond within a period of two weeks afterdata collection had started, and just before closing the survey administrationphase. Human Resource professionals made hardcopies of the surveyavailable to those employees who had no access to the Internet at their worksite or to employees who explicitly asked to receive a hardcopy. In thisorganisational survey, employees providing their responses on paper weretypically employees with the lowest job level working: (1) in sales (77%versus 23%), (2) in manufacturing, maintenance, quality and engineering(90% versus 10%), and (3) in warehouses and coldstores (88% versus 12%).Most of them did not have access to the Internet during working hours. Next,most top-level managers (e.g. CEOs in countries, business group directors,etc.) also provided their answers on paper (63%). Responding through theInternet was popular among all other types of employees. The averagepercentage of Internet and paper-and-pencil responses across countrieswas 35.6 per cent and 64.4 per cent, respectively. The lowest percentageof Internet responses was found in Vietnam (i.e. 9.1%), whereas the highestpercentage of Internet responses was found in the United States (i.e. 60.2%).
344
DE BEUCKELAER AND LIEVENS
© 2008 The Authors. Journal compilation © 2008 International Association of AppliedPsychology.
Across countries the average percentage of employees having the lowestjob level was 81.7 per cent (
SD
= 7.9). These employees do not have anystaff reporting to them. The average percentage of employees occupying anintermediate job level (i.e. team leaders or head of a department) acrosscountries was 12.3 per cent (
SD
= 5.8). The average percentage of employeeswith a high job level (i.e. all positions above head of the department) was6.0 per cent (
SD
= 2.7).In total, data collection took about four months. The overall response
rate across countries was 86.0 per cent, which is above the average surveyresponse rate given by Church and Waclawski (2001) and Kraut (1996).Unfortunately, no response rates per country were made available to theauthors.
Development of Organisational Survey
The organisational survey under investigation in this study was constructedanalogously to corporate-sponsored global surveys (see Johnson, 1996).This means that the HR staff at the corporate headquarters led thedevelopment and administration of the survey. In addition, a commonmethodology and framework to survey all employees was followed, whileallowing for country customisation. In a first step, a global survey team wascomposed. This global survey team consisted of (1) a broad cross-section ofemployees from different levels, functional areas, and backgrounds of themultinational company and (2) survey consultants. Next, the global surveyteam developed the original English items. Some of the items had been usedbefore by the survey consultants. Others were added by the global surveyteam. The closed-ended items of the survey used a 5-point Likert-typeresponse format. The response format ranged from “
strongly disagree
” (1)to “
strongly agree
” (5). In the following step, regional survey leaders weremade responsible for the translations in their region. They supervised andmonitored the different translations which were checked by local surveycoordinators using the English survey as the basis for comparison. Next,professional interpreters back-translated the surveys into English. As anadditional check, English-speaking masters students compared the back-translation to the original English version and indicated whether themeaning of each item had remained similar. Generally, results were satisfactory.The final surveys were pilot-tested in each individual country, and—ifnecessary—modifications were made.
The final survey included 89 items and consisted of several parts. One partasked for organisational members’ reports and perceptions on dimensionswhich were of key importance to the HR policy of the multinationalcompany. Specifically, the following five organisational climate factors wereconsidered to be of key importance: team commitment, supervisor support,
PAPER-AND-PENCIL AND INTERNET SURVEYS
345
© 2008 The Authors. Journal compilation © 2008 International Association of AppliedPsychology.
goal clarity, decision-making, and environmental and societal responsibility.The Appendix presents the definitions of these organisational climatefactors. A second part of the survey included country-specific questions,whereas the last part dealt with background information (e.g. age, gender,tenure).
In this study, we focused on a specific set of items (13) of this globalsurvey (see Appendix). Consistent with Ryan, Chan, Ployhart, and Slade (1999),we retained only items that were clearly linked
2
to the five work climatefactors. Hence, items dealing with either country-specific or organisation-specific initiatives (instead of attitudes or opinions) were not retained.
Although the five work climate factors measured in this organisationalsurvey were specific to this company, two comments are in order. First, itshould be noted that they generalise well to factors typically included inorganisational climate surveys (James & Jones, 1974; Kopelman, Brief, &Guzzo, 1990; Ostroff, 1993). For example, a well-known comprehensivemodel of organisational climate (James & Jones, 1974; James & Sells, 1981;James & McIntyre, 1996; Parker, Baltes, Young, Huff, Altmann, Lacost, &Roberts, 2003) makes a distinction between five primary domains of workclimate: job characteristics, role characteristics, leadership characteristics,work group/social characteristics, and organisational characteristics. Theorganisational survey of this study measured four of these five core organ
-
isational climate dimensions, namely work group/social characteristics (i.e.team commitment), leadership characteristics (i.e. supervisor support anddecision-making), role characteristics (i.e. goal clarity), and organisationalcharacteristics (i.e. environmental and societal responsibility). Only jobcharacteristics were not measured in this study’s organisational survey.
2
We began by screening the 89 survey items in terms of content. We removed seven itemsthat measured other substantive variables (e.g. job satisfaction and affective organisationalcommitment) and 61 items that were not tied to the five work climate factors discussed in thetext (i.e. one-item measures that were designed to assess employees’ appreciation of a widediversity of company-related policies and practices [e.g. training and development plans, target-setting and performance reviews, the job posting system, etc.], departmental goals). Second, westatistically screened the items because CFA is a restrictive statistical technique that puts verystrong demands on the psychometric properties of the items used to operationalise the con-struct. Therefore, we conducted an exploratory factor analysis (EFA) on the remaining 21items as precursor to the CFA (Gerbing & Hamilton, 1996; Hurley, Scandura, Schriesheim,Brannick, Seers, Vandenberg, & Williams, 1997). The total sample (with data from all 16countries) was randomly split into two equally sized subsamples. Principal axis factoring (SPSSfor Windows 14) followed by an oblique rotation method (orthogonal factors were notexpected) was conducted using the data from the first subsample. Based on the “eigenvalue-greater-than-one” criterion we selected five factors and 13 items measuring these factors (i.e.they all had factor loadings exceeding .50; see Hair, Black, Babin, Anderson, & Tatham, 2006).The five-factor structure was confirmed (i.e. showing identical patterns of factor loadings)using the data from the other subsample.

346
DE BEUCKELAER AND LIEVENS
© 2008 The Authors. Journal compilation © 2008 International Association of AppliedPsychology.
Second, results of a previous wave of the climate survey (see Discussion)showed that the five factors under study show substantial correlations(ranging from .40 to .61) with a measure of key importance, namely acomposite measure of job satisfaction (alpha value = .82).
ANALYSES
Sequence of Models Tested
We used structural equation modeling in the form of MACS models to testfor measurement equivalence across modes of data collection. Mplus 2(Muthén and Muthén, 1999, 2003) was used to evaluate all MACS models.
We started by testing a confirmatory factor analysis model whichimposed the hypothesised five-factor structure (i.e. the key factors of theorganisation’s business model) onto the data. Strictly speaking, this modelis not a MACS model as indicator mean scores are not needed to test thehypothesised dimensionality of the factor model. The five-factor model wasevaluated using the samples from all individual countries.
Provided that the five-factor model fit the data well, a hierarchicalsequence of nested statistical models (e.g. Vandenberg & Lance, 2000) canbe used to assess measurement equivalence of indicator variables acrossmodes of data collection. In this study, we investigated whether Meredith’s(1993) strong definition of measurement equivalence would be realistic forthe data. According to Meredith, factor loadings and indicator intercepts ofobserved variables should be identical across groups (modes of data collection).Unique variances of indicators (i.e. unreliabilities) may, however, varyacross the alternative modes of data collection. The same is true for factormeans, factor variances, and factor covariances. Meredith’s equivalencecondition is referred to as “scalar equivalence” across groups.
Taking Meredith’s (1993) scalar equivalence model as measurementequivalence criterion, we conducted the following set of increasingly restrictivetests of measurement equivalence. First, we specified a baseline model inwhich no parameters (i.e. factor loadings, indicator intercepts, uniquevariances, factor means, and factor variances and covariances), except forthe factor loading of the reference indicator, were constrained to be equalacross modes of data collection. Conceptually, the baseline model assumesthat the data exhibit (factor) “form equivalence” across modes of datacollection. In other words, the observed variables are assumed to be relatedto the same number of factors and the factors are measured by the same setof observed variables regardless of the mode of data collection used.Conceptually, this means that employees use a similar frame-of-referencewhen completing the items of the organisational survey (Riordan &Vandenberg, 1994). An additional constraint in our baseline model is that
PAPER-AND-PENCIL AND INTERNET SURVEYS
347
© 2008 The Authors. Journal compilation © 2008 International Association of AppliedPsychology.
all observed variables load on just one factor (i.e. cross-loadings are notspecified).
The second model in the sequence constrains all factor loadings to beidentical across modes of data collection while all other parameters (i.e.indicator intercepts, unique variances, factor means, and factor variancesand covariances) are freely estimated. This model is called the “metricequivalence model”. Conceptually, equivalence of factor loadings impliesthat respondents calibrate the intervals used on the measurement scale insimilar ways (Riordan & Vandenberg, 1994).
The third model in the sequence, the scalar equivalence model, constrainsall factor loadings and indicator intercepts
3
to be identical across modes ofdata collection. The remaining parameters (i.e. unique variances, factormeans, and factor variances and covariances) are not constrained acrossmodes of data collection. This model provides sufficient evidence to concludethat the measurement scale used to score the observed variables (i.e. theindicators of constructs) is identical across modes of data collection(Drasgow, 1984, 1987). Non-equivalence of indicator intercepts acrossmodes of data collection may be caused by differences in “yea saying” (i.e.agreement bias, also known as “acquiescence response style bias”) acrossthese modes of data collection. It may well be that some data collectionmethods invoke a higher frequency of positive responses to items, regardlessof item content (i.e. acquiescence bias).
Assessment of Model Fit
Apart from traditional fit indices (Chi-square statistic and Chi-square/df),we relied on four measures of model fit. In particular, the following goodness-of-fit measures were used: (1) the Comparative Fit Index (Bentler, 1990), (2)the Tucker-Lewis Index (TLI), which is also referred to as the Bentler-Bonett Non-Normed Fit Index (NNFI; Bentler & Bonett, 1980), (3) theRoot Mean Square Error of Approximation (RMSEA; Steiger, 1990), and(4) the Standardized Root Mean Square Residual (SRMR; Bentler, 1995).These goodness-of-fit measures were suggested by the extensive simulationstudy of Hu and Bentler (1999). Hu and Bentler also proposed the followingcutoff values: .95 (i.e. minimum values for CFI and TLI), .08 and .06 (i.e.maximum values for SRMR and RMSEA, respectively).
To statistically compare alternative measurement equivalence models wedid not use the traditional Chi-square difference statistic. As this statistic is
3
As indicated by one of the reviewers, when variable means are unequal across groups,constraining intercept differences to be equal across groups leads to factor mean differences,and conversely, constraining factor means to be equal will lead to differences in the indicatorintercepts.

348
DE BEUCKELAER AND LIEVENS
© 2008 The Authors. Journal compilation © 2008 International Association of AppliedPsychology.
sensitive to sample size (Brannick, 1995; Kelloway, 1995), we used thedifference in Comparative Fit Index (CFI) between nested equivalence modelsbecause a recent simulation study (Cheung & Rensvold, 2002) found thatthe difference in Comparative Fit Index was a reliable (and robust) measureof model fit (in measurement equivalence testing using MACS models).Specifically, the difference in CFI between (successive) equivalence modelsmight not be higher than .01.
RESULTS
Test of the Baseline Five-Factor Model
Confirmatory factor analyses were run to test the adequacy of the five-factor structure using the data from each individual country. From Table 2it may be concluded that, in general, the five-factor model provided anadequate representation of the data in all countries. For some countries, theTLI measure reported fell somewhat below the critical level of .95. TheRMSEA measure was slightly too high in Sweden (.062) and in the UnitedStates (.064). As no other problems were encountered, we decided to pro-ceed with an assessment of measurement equivalence across Internet and PPsurveys in all (i.e. 16) countries.
TABLE 2SEM Models Specifying a Five-factor Structure
Country Chi2 (d.f.) CFI TLI RMSEA SRMR
Australia 331.4 (55) .970 .957 .060 .043Brazil 1,798.5 (55) .966 .952 .057 .045PR China 579.3 (55) .969 .956 .058 .043Czech Republic 252.7 (55) .961 .945 .059 .050France 569.0 (55) .965 .950 .055 .042Germany 1,081.6 (55) .962 .946 .055 .039The Netherlands 617.5 (55) .966 .952 .052 .039Nigeria 195.4 (55) .964 .950 .051 .044Pakistan 188.5 (55) .968 .955 .054 .041Puerto Rico 144.2 (55) .975 .965 .051 .036Russian Federation 314.1 (55) .960 .943 .060 .041Spain 327.7 (55) .969 .955 .059 .044Sweden 247.7 (55) .964 .949 .062 .037United Kingdom 1,612.2 (55) .967 .954 .060 .037United States 2,096.7 (55) .965 .950 .064 .040Vietnam 276.7 (55) .965 .950 .054 .047
PAPER-AND-PENCIL AND INTERNET SURVEYS
349
© 2008 The Authors. Journal compilation © 2008 International Association of AppliedPsychology.
Measurement Equivalence of PP and Internet across Countries
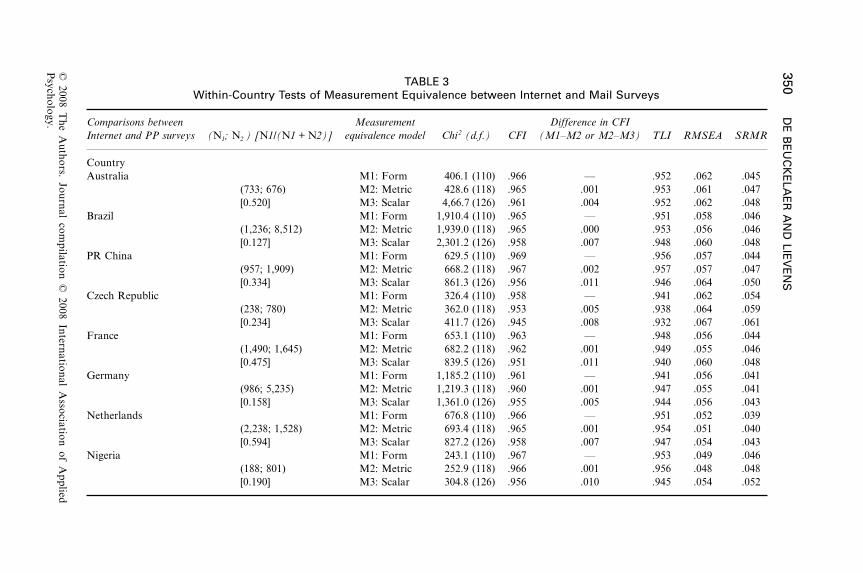
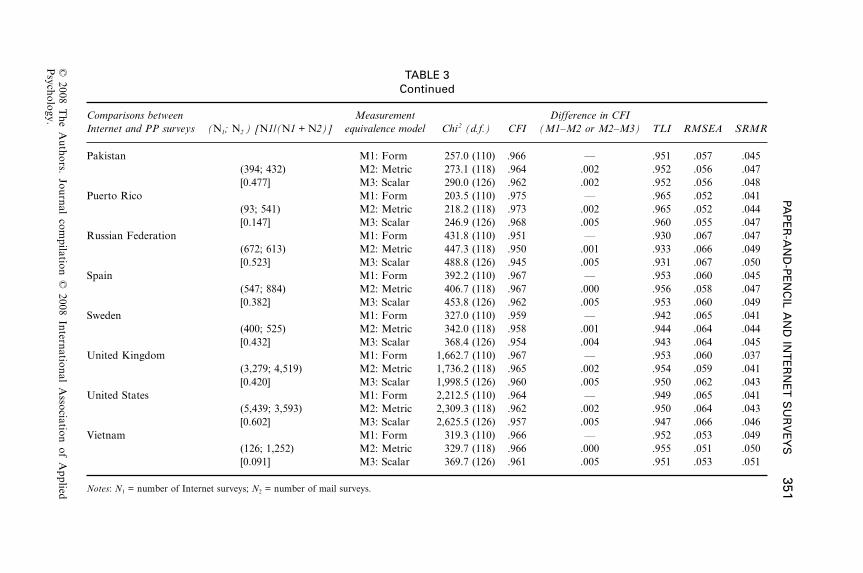
Our hypothesis posited that, in every country, measurement equivalencewould be established across Internet and PP surveys. Table 3 shows that theassumption of form equivalence of the constructs measured was supportedfor the majority of countries as all model fit values (except for, occasionally,the TLI measure) did not exceed the critical values of Hu and Bentler(1999). In some cases (i.e. Australia, Czech Republic, Sweden, and the US),the RMSEA measure was somewhat too high (RMSEA = .062 in Australiaand Czech Republic and RMSEA = .065 in Sweden and the US). In addition,the RMSEA measure was rather high in the Russian Federation (.067).
As indicated in Table 3, the assumption of metric equivalence was supportedin all countries. The difference in CFI between the form equivalence modeland the metric model is consistently below the critical difference proposedby Cheung and Rensvold (2002) (i.e. CFI should not drop by more than.01). As a result, one may conclude that Internet and PP respondents cali-brate the intervals used on the measurement scale in a similar way (seeRiordan & Vandenberg, 1994).
The next model comparison involves a statistical comparison between themetric equivalence model and the scalar equivalence model. Based on thedifferences in CFI reported, the scalar equivalence model is acceptable in allcountries except the People’s Republic of China and France. However, theactual difference in CFI (.011) is only slightly above the critical differenceof .01 in both countries. We therefore conclude that, in general, scalarequivalence is supported across the two modes of data collection which werecombined in this mixed-mode organisational survey.
Measurement Equivalence of PP and Internet across Countries while Controlling for Job Level
Differences in job level may partially account for differences in responsebehavior across modes of data collection (see Roberts et al., 2004; Stanton& Rogelberg, 2001). Employees with a higher job level may show a strongertendency to respond via the Internet than employees with a lower job levelas the former group tends more often to have direct access to the Internet (and/or the Intranet) than the latter group. The data (aggregated across countries)show that employees with the highest and intermediate job level, in particular,respond more frequently via the Internet. The percentages of Internet responsesare 66.4 per cent, 76.4 per cent, and 26.7 per cent within the highest, theintermediate and the lowest job levels, respectively. Because of the existingdifferences in Internet responding behavior, the earlier analyses were repeatedusing
matched subsamples
of Internet and PP surveys within each country.
350
DE
BE
UC
KE
LAE
R A
ND
LIEV
EN
S
© 2008 T
he Authors. Journal com
pilation © 2008 International A
ssociation of Applied
Psychology.
TABLE 3Within-Country Tests of Measurement Equivalence between Internet and Mail Surveys
Comparisons between Internet and PP surveys (
N
1
;
N
2
) [N1/(N1 + N2)]Measurement
equivalence model Chi2 (d.f.) CFIDifference in CFI
(M1–M2 or M2–M3) TLI RMSEA SRMR
CountryAustralia M1: Form 406.1 (110) .966 — .952 .062 .045
(733; 676) M2: Metric 428.6 (118) .965 .001 .953 .061 .047[0.520] M3: Scalar 4,66.7 (126) .961 .004 .952 .062 .048
Brazil M1: Form 1,910.4 (110) .965 — .951 .058 .046(1,236; 8,512) M2: Metric 1,939.0 (118) .965 .000 .953 .056 .046[0.127] M3: Scalar 2,301.2 (126) .958 .007 .948 .060 .048
PR China M1: Form 629.5 (110) .969 — .956 .057 .044(957; 1,909) M2: Metric 668.2 (118) .967 .002 .957 .057 .047[0.334] M3: Scalar 861.3 (126) .956 .011 .946 .064 .050
Czech Republic M1: Form 326.4 (110) .958 — .941 .062 .054(238; 780) M2: Metric 362.0 (118) .953 .005 .938 .064 .059[0.234] M3: Scalar 411.7 (126) .945 .008 .932 .067 .061
France M1: Form 653.1 (110) .963 — .948 .056 .044(1,490; 1,645) M2: Metric 682.2 (118) .962 .001 .949 .055 .046[0.475] M3: Scalar 839.5 (126) .951 .011 .940 .060 .048
Germany M1: Form 1,185.2 (110) .961 — .941 .056 .041(986; 5,235) M2: Metric 1,219.3 (118) .960 .001 .947 .055 .041[0.158] M3: Scalar 1,361.0 (126) .955 .005 .944 .056 .043
Netherlands M1: Form 676.8 (110) .966 — .951 .052 .039(2,238; 1,528) M2: Metric 693.4 (118) .965 .001 .954 .051 .040[0.594] M3: Scalar 827.2 (126) .958 .007 .947 .054 .043
Nigeria M1: Form 243.1 (110) .967 — .953 .049 .046(188; 801) M2: Metric 252.9 (118) .966 .001 .956 .048 .048[0.190] M3: Scalar 304.8 (126) .956 .010 .945 .054 .052
PAP
ER
-AN
D-P
EN
CIL A
ND
INT
ER
NE
T S
UR
VE
YS
351
© 2008 T
he Authors. Journal com
pilation © 2008 International A
ssociation of Applied
Psychology.
Pakistan M1: Form 257.0 (110) .966 — .951 .057 .045(394; 432) M2: Metric 273.1 (118) .964 .002 .952 .056 .047[0.477] M3: Scalar 290.0 (126) .962 .002 .952 .056 .048
Puerto Rico M1: Form 203.5 (110) .975 — .965 .052 .041(93; 541) M2: Metric 218.2 (118) .973 .002 .965 .052 .044[0.147] M3: Scalar 246.9 (126) .968 .005 .960 .055 .047
Russian Federation M1: Form 431.8 (110) .951 — .930 .067 .047(672; 613) M2: Metric 447.3 (118) .950 .001 .933 .066 .049[0.523] M3: Scalar 488.8 (126) .945 .005 .931 .067 .050
Spain M1: Form 392.2 (110) .967 — .953 .060 .045(547; 884) M2: Metric 406.7 (118) .967 .000 .956 .058 .047[0.382] M3: Scalar 453.8 (126) .962 .005 .953 .060 .049
Sweden M1: Form 327.0 (110) .959 — .942 .065 .041(400; 525) M2: Metric 342.0 (118) .958 .001 .944 .064 .044[0.432] M3: Scalar 368.4 (126) .954 .004 .943 .064 .045
United Kingdom M1: Form 1,662.7 (110) .967 — .953 .060 .037(3,279; 4,519) M2: Metric 1,736.2 (118) .965 .002 .954 .059 .041[0.420] M3: Scalar 1,998.5 (126) .960 .005 .950 .062 .043
United States M1: Form 2,212.5 (110) .964 — .949 .065 .041(5,439; 3,593) M2: Metric 2,309.3 (118) .962 .002 .950 .064 .043[0.602] M3: Scalar 2,625.5 (126) .957 .005 .947 .066 .046
Vietnam M1: Form 319.3 (110) .966 — .952 .053 .049(126; 1,252) M2: Metric 329.7 (118) .966 .000 .955 .051 .050[0.091] M3: Scalar 369.7 (126) .961 .005 .951 .053 .051
Notes: N1 = number of Internet surveys; N2 = number of mail surveys.
Comparisons between Internet and PP surveys (N1; N2 ) [N1/(N1 + N2)]
Measurement equivalence model Chi2 (d.f.) CFI
Difference in CFI (M1–M2 or M2–M3) TLI RMSEA SRMR
TABLE 3Continued
352 DE BEUCKELAER AND LIEVENS
© 2008 The Authors. Journal compilation © 2008 International Association of AppliedPsychology.
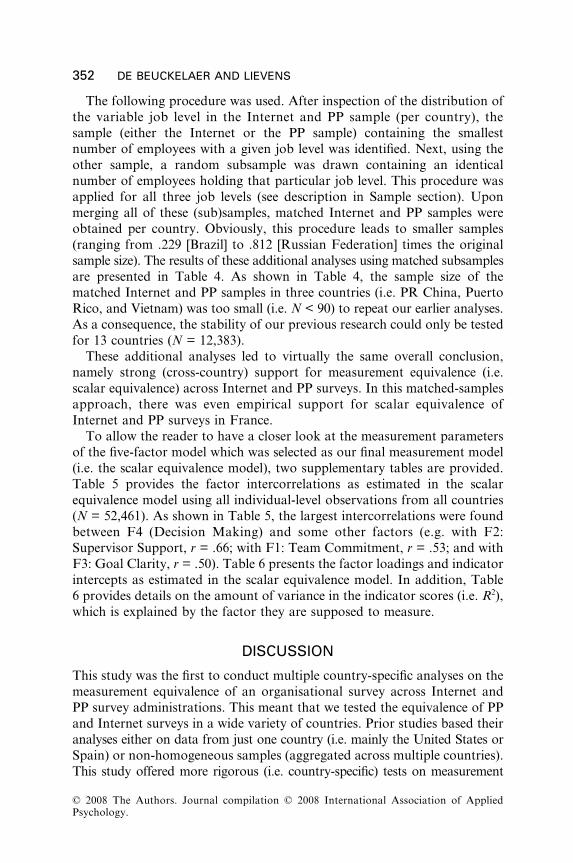
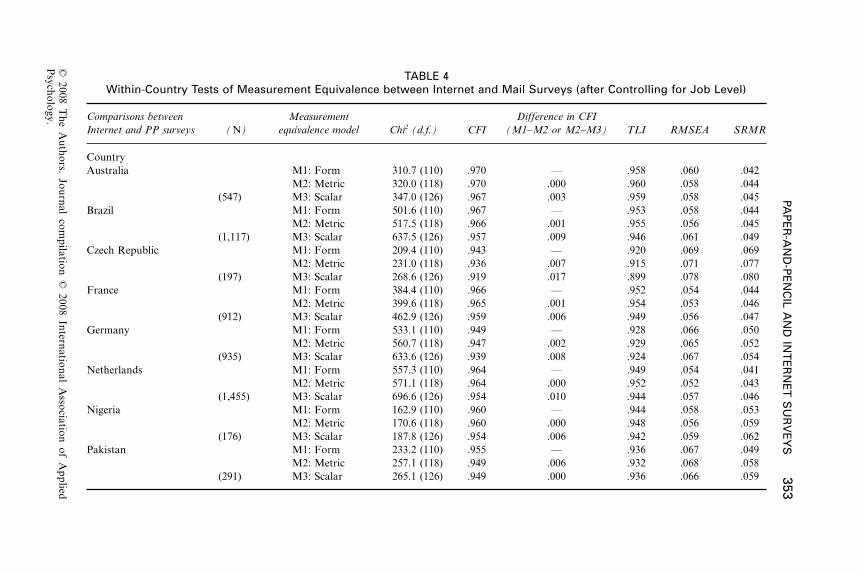
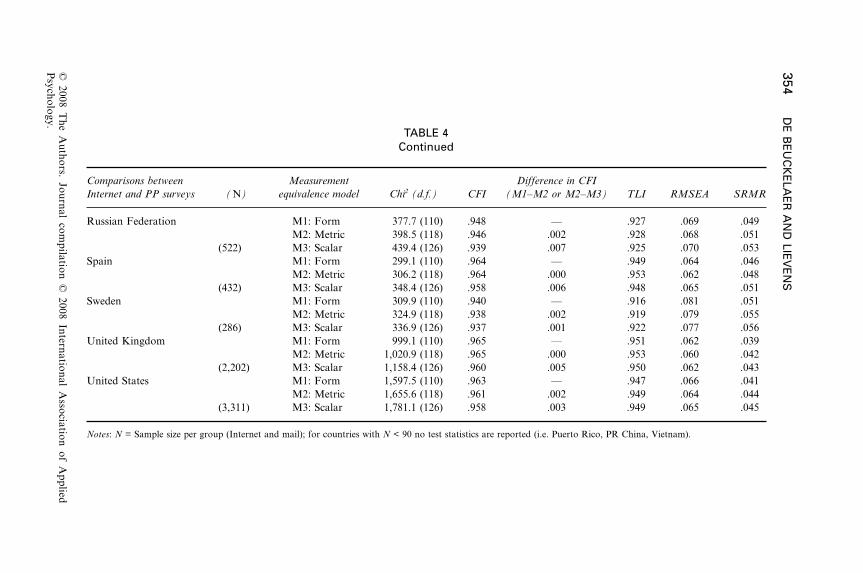
The following procedure was used. After inspection of the distribution ofthe variable job level in the Internet and PP sample (per country), thesample (either the Internet or the PP sample) containing the smallestnumber of employees with a given job level was identified. Next, using theother sample, a random subsample was drawn containing an identicalnumber of employees holding that particular job level. This procedure wasapplied for all three job levels (see description in Sample section). Uponmerging all of these (sub)samples, matched Internet and PP samples wereobtained per country. Obviously, this procedure leads to smaller samples(ranging from .229 [Brazil] to .812 [Russian Federation] times the originalsample size). The results of these additional analyses using matched subsamplesare presented in Table 4. As shown in Table 4, the sample size of thematched Internet and PP samples in three countries (i.e. PR China, PuertoRico, and Vietnam) was too small (i.e. N < 90) to repeat our earlier analyses.As a consequence, the stability of our previous research could only be testedfor 13 countries (N = 12,383).
These additional analyses led to virtually the same overall conclusion,namely strong (cross-country) support for measurement equivalence (i.e.scalar equivalence) across Internet and PP surveys. In this matched-samplesapproach, there was even empirical support for scalar equivalence ofInternet and PP surveys in France.
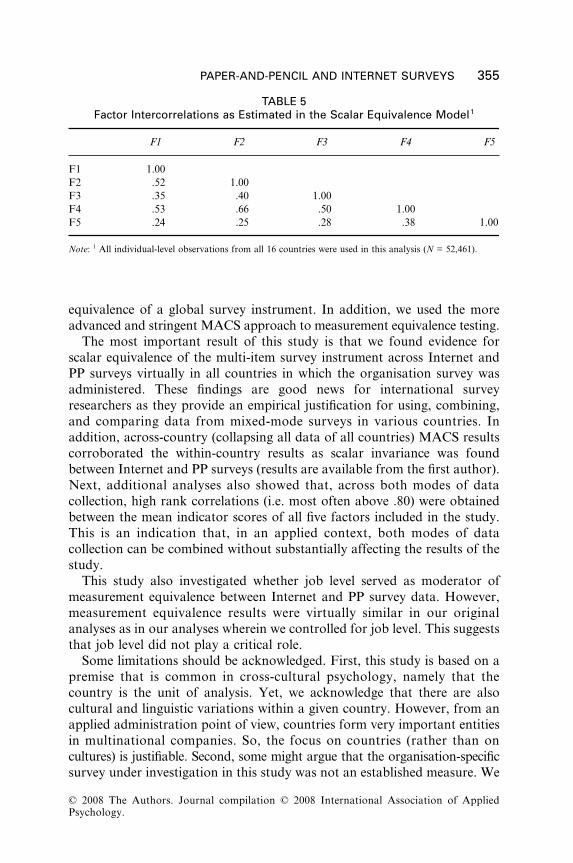
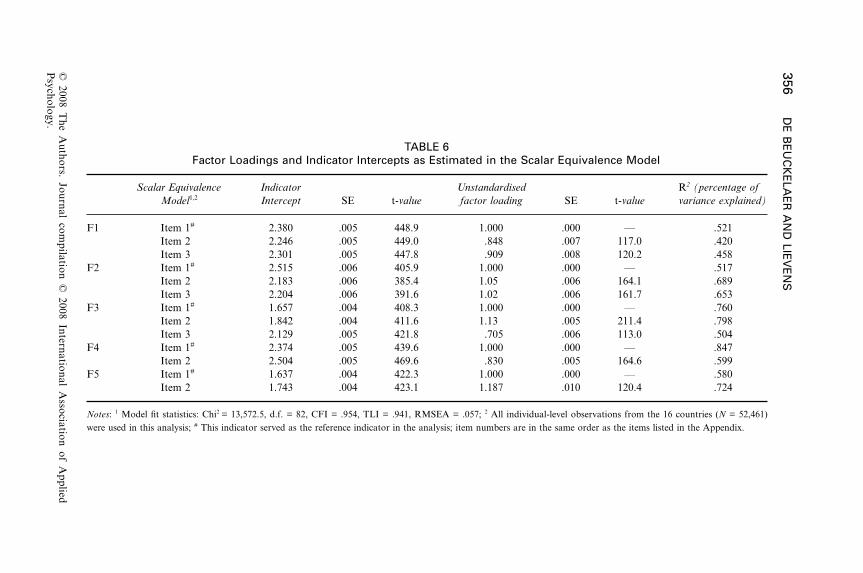
To allow the reader to have a closer look at the measurement parametersof the five-factor model which was selected as our final measurement model(i.e. the scalar equivalence model), two supplementary tables are provided.Table 5 provides the factor intercorrelations as estimated in the scalarequivalence model using all individual-level observations from all countries(N = 52,461). As shown in Table 5, the largest intercorrelations were foundbetween F4 (Decision Making) and some other factors (e.g. with F2:Supervisor Support, r = .66; with F1: Team Commitment, r = .53; and withF3: Goal Clarity, r = .50). Table 6 presents the factor loadings and indicatorintercepts as estimated in the scalar equivalence model. In addition, Table6 provides details on the amount of variance in the indicator scores (i.e. R2),which is explained by the factor they are supposed to measure.
DISCUSSION
This study was the first to conduct multiple country-specific analyses on themeasurement equivalence of an organisational survey across Internet andPP survey administrations. This meant that we tested the equivalence of PPand Internet surveys in a wide variety of countries. Prior studies based theiranalyses either on data from just one country (i.e. mainly the United States orSpain) or non-homogeneous samples (aggregated across multiple countries).This study offered more rigorous (i.e. country-specific) tests on measurement
PAP
ER
-AN
D-P
EN
CIL A
ND
INT
ER
NE
T S
UR
VE
YS
353
© 2008 T
he Authors. Journal com
pilation © 2008 International A
ssociation of Applied
Psychology.
TABLE 4Within-Country Tests of Measurement Equivalence between Internet and Mail Surveys (after Controlling for Job Level)
Comparisons between Internet and PP surveys (N)
Measurement equivalence model Chi2 (d.f.) CFI
Difference in CFI (M1–M2 or M2–M3) TLI RMSEA SRMR
CountryAustralia M1: Form 310.7 (110) .970 — .958 .060 .042
M2: Metric 320.0 (118) .970 .000 .960 .058 .044(547) M3: Scalar 347.0 (126) .967 .003 .959 .058 .045
Brazil M1: Form 501.6 (110) .967 — .953 .058 .044M2: Metric 517.5 (118) .966 .001 .955 .056 .045
(1,117) M3: Scalar 637.5 (126) .957 .009 .946 .061 .049Czech Republic M1: Form 209.4 (110) .943 — .920 .069 .069
M2: Metric 231.0 (118) .936 .007 .915 .071 .077(197) M3: Scalar 268.6 (126) .919 .017 .899 .078 .080
France M1: Form 384.4 (110) .966 — .952 .054 .044M2: Metric 399.6 (118) .965 .001 .954 .053 .046
(912) M3: Scalar 462.9 (126) .959 .006 .949 .056 .047Germany M1: Form 533.1 (110) .949 — .928 .066 .050
M2: Metric 560.7 (118) .947 .002 .929 .065 .052(935) M3: Scalar 633.6 (126) .939 .008 .924 .067 .054
Netherlands M1: Form 557.3 (110) .964 — .949 .054 .041M2: Metric 571.1 (118) .964 .000 .952 .052 .043
(1,455) M3: Scalar 696.6 (126) .954 .010 .944 .057 .046Nigeria M1: Form 162.9 (110) .960 — .944 .058 .053
M2: Metric 170.6 (118) .960 .000 .948 .056 .059(176) M3: Scalar 187.8 (126) .954 .006 .942 .059 .062
Pakistan M1: Form 233.2 (110) .955 — .936 .067 .049M2: Metric 257.1 (118) .949 .006 .932 .068 .058
(291) M3: Scalar 265.1 (126) .949 .000 .936 .066 .059
354D
E B
EU
CK
ELA
ER
AN
D LIE
VE
NS
© 2008 T
he Authors. Journal com
pilation © 2008 International A
ssociation of Applied
Psychology.
Russian Federation M1: Form 377.7 (110) .948 — .927 .069 .049M2: Metric 398.5 (118) .946 .002 .928 .068 .051
(522) M3: Scalar 439.4 (126) .939 .007 .925 .070 .053Spain M1: Form 299.1 (110) .964 — .949 .064 .046
M2: Metric 306.2 (118) .964 .000 .953 .062 .048(432) M3: Scalar 348.4 (126) .958 .006 .948 .065 .051
Sweden M1: Form 309.9 (110) .940 — .916 .081 .051M2: Metric 324.9 (118) .938 .002 .919 .079 .055
(286) M3: Scalar 336.9 (126) .937 .001 .922 .077 .056United Kingdom M1: Form 999.1 (110) .965 — .951 .062 .039
M2: Metric 1,020.9 (118) .965 .000 .953 .060 .042(2,202) M3: Scalar 1,158.4 (126) .960 .005 .950 .062 .043
United States M1: Form 1,597.5 (110) .963 — .947 .066 .041M2: Metric 1,655.6 (118) .961 .002 .949 .064 .044
(3,311) M3: Scalar 1,781.1 (126) .958 .003 .949 .065 .045
Notes: N = Sample size per group (Internet and mail); for countries with N < 90 no test statistics are reported (i.e. Puerto Rico, PR China, Vietnam).
Comparisons between Internet and PP surveys (N)
Measurement equivalence model Chi2 (d.f.) CFI
Difference in CFI (M1–M2 or M2–M3) TLI RMSEA SRMR
TABLE 4Continued
PAPER-AND-PENCIL AND INTERNET SURVEYS 355
© 2008 The Authors. Journal compilation © 2008 International Association of AppliedPsychology.
equivalence of a global survey instrument. In addition, we used the moreadvanced and stringent MACS approach to measurement equivalence testing.
The most important result of this study is that we found evidence forscalar equivalence of the multi-item survey instrument across Internet andPP surveys virtually in all countries in which the organisation survey wasadministered. These findings are good news for international surveyresearchers as they provide an empirical justification for using, combining,and comparing data from mixed-mode surveys in various countries. Inaddition, across-country (collapsing all data of all countries) MACS resultscorroborated the within-country results as scalar invariance was foundbetween Internet and PP surveys (results are available from the first author).Next, additional analyses also showed that, across both modes of datacollection, high rank correlations (i.e. most often above .80) were obtainedbetween the mean indicator scores of all five factors included in the study.This is an indication that, in an applied context, both modes of datacollection can be combined without substantially affecting the results of thestudy.
This study also investigated whether job level served as moderator ofmeasurement equivalence between Internet and PP survey data. However,measurement equivalence results were virtually similar in our originalanalyses as in our analyses wherein we controlled for job level. This suggeststhat job level did not play a critical role.
Some limitations should be acknowledged. First, this study is based on apremise that is common in cross-cultural psychology, namely that thecountry is the unit of analysis. Yet, we acknowledge that there are alsocultural and linguistic variations within a given country. However, from anapplied administration point of view, countries form very important entitiesin multinational companies. So, the focus on countries (rather than oncultures) is justifiable. Second, some might argue that the organisation-specificsurvey under investigation in this study was not an established measure. We
TABLE 5Factor Intercorrelations as Estimated in the Scalar Equivalence Model1
F1 F2 F3 F4 F5
F1 1.00F2 .52 1.00F3 .35 .40 1.00F4 .53 .66 .50 1.00F5 .24 .25 .28 .38 1.00
Note: 1 All individual-level observations from all 16 countries were used in this analysis (N = 52,461).
356D
E B
EU
CK
ELA
ER
AN
D LIE
VE
NS
© 2008 T
he Authors. Journal com
pilation © 2008 International A
ssociation of Applied
Psychology.
TABLE 6Factor Loadings and Indicator Intercepts as Estimated in the Scalar Equivalence Model
Scalar Equivalence Model1,2
Indicator Intercept SE t-value
Unstandardised factor loading SE t-value
R2 (percentage of variance explained)
F1 Item 1# 2.380 .005 448.9 1.000 .000 — .521Item 2 2.246 .005 449.0 .848 .007 117.0 .420Item 3 2.301 .005 447.8 .909 .008 120.2 .458
F2 Item 1# 2.515 .006 405.9 1.000 .000 — .517Item 2 2.183 .006 385.4 1.05 .006 164.1 .689Item 3 2.204 .006 391.6 1.02 .006 161.7 .653
F3 Item 1# 1.657 .004 408.3 1.000 .000 — .760Item 2 1.842 .004 411.6 1.13 .005 211.4 .798Item 3 2.129 .005 421.8 .705 .006 113.0 .504
F4 Item 1# 2.374 .005 439.6 1.000 .000 — .847Item 2 2.504 .005 469.6 .830 .005 164.6 .599
F5 Item 1# 1.637 .004 422.3 1.000 .000 — .580Item 2 1.743 .004 423.1 1.187 .010 120.4 .724
Notes: 1 Model fit statistics: Chi2 = 13,572.5, d.f. = 82, CFI = .954, TLI = .941, RMSEA = .057; 2 All individual-level observations from the 16 countries (N = 52,461)were used in this analysis; # This indicator served as the reference indicator in the analysis; item numbers are in the same order as the items listed in the Appendix.
PAPER-AND-PENCIL AND INTERNET SURVEYS 357
© 2008 The Authors. Journal compilation © 2008 International Association of AppliedPsychology.
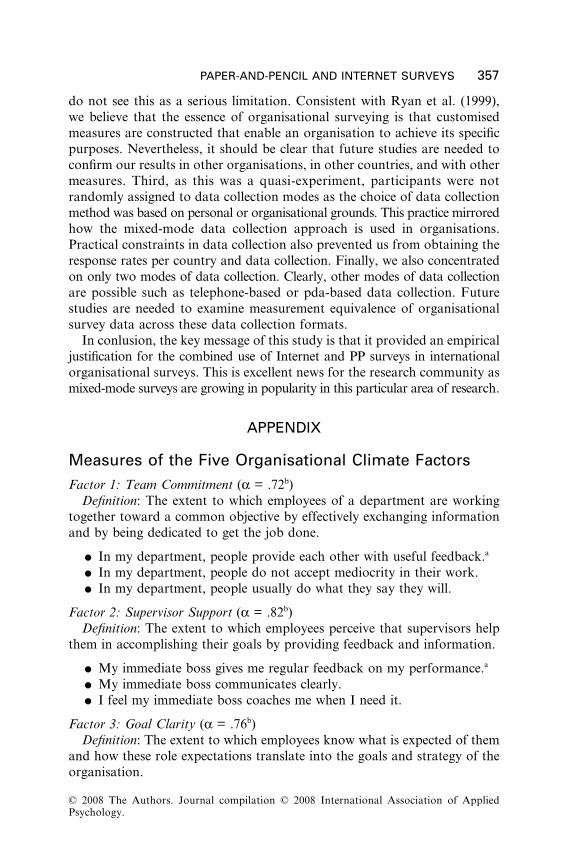
do not see this as a serious limitation. Consistent with Ryan et al. (1999),we believe that the essence of organisational surveying is that customisedmeasures are constructed that enable an organisation to achieve its specificpurposes. Nevertheless, it should be clear that future studies are needed toconfirm our results in other organisations, in other countries, and with othermeasures. Third, as this was a quasi-experiment, participants were notrandomly assigned to data collection modes as the choice of data collectionmethod was based on personal or organisational grounds. This practice mirroredhow the mixed-mode data collection approach is used in organisations.Practical constraints in data collection also prevented us from obtaining theresponse rates per country and data collection. Finally, we also concentratedon only two modes of data collection. Clearly, other modes of data collectionare possible such as telephone-based or pda-based data collection. Futurestudies are needed to examine measurement equivalence of organisationalsurvey data across these data collection formats.
In conlusion, the key message of this study is that it provided an empiricaljustification for the combined use of Internet and PP surveys in internationalorganisational surveys. This is excellent news for the research community asmixed-mode surveys are growing in popularity in this particular area of research.
APPENDIX
Measures of the Five Organisational Climate FactorsFactor 1: Team Commitment (α = .72b)
Definition: The extent to which employees of a department are workingtogether toward a common objective by effectively exchanging informationand by being dedicated to get the job done.
• In my department, people provide each other with useful feedback.a
• In my department, people do not accept mediocrity in their work. • In my department, people usually do what they say they will.
Factor 2: Supervisor Support (α = .82b)Definition: The extent to which employees perceive that supervisors help
them in accomplishing their goals by providing feedback and information.
• My immediate boss gives me regular feedback on my performance.a
• My immediate boss communicates clearly. • I feel my immediate boss coaches me when I need it.
Factor 3: Goal Clarity (α = .76b)Definition: The extent to which employees know what is expected of them
and how these role expectations translate into the goals and strategy of theorganisation.

358 DE BEUCKELAER AND LIEVENS
© 2008 The Authors. Journal compilation © 2008 International Association of AppliedPsychology.
• I have a clear understanding of the goals and objectives of my department.a
• I have a clear understanding of the goals and objectives of my organisation. • I have a clear understanding of the goals and objectives of the multi-
national as a whole.
Factor 4: Decision Making (α = .83b)Definition: The extent to which employees have confidence in the decisions
made by direct supervisors and higher level managers.
• I have confidence in the decisions made by managers of my organisation.a
• I have confidence in the decisions made by managers of my businessgroup / region.
Factor 5: Environmental and Societal Responsibility (α = .79b)Definition: The extent to which employees perceive the organisation to
adopt business practices that embody environmental protection and respon-sibility to the society.
• I believe that my organisation is environmentally responsible.a
• I believe that my organisation is a socially responsible member of thecommunity.
Notes: a This item was arbitrarily chosen as reference indicator in the analyses.b The calculation is based on all observations (i.e. all country samples
merged together).
REFERENCES
Bentler, P.M. (1990). Comparative fit indexes in structural models. PsychologicalBulletin, 107, 238–246.
Bentler, P.M. (1995). EQS structural equations program manual. Encino, CA:Multivariate Software.
Bentler, P.M., & Bonett, D.G. (1980). Significance tests and goodness of fit in theanalysis of covariance structure. Psychological Bulletin, 88, 588–606.
Birnbaum, M.H. (2001). Introduction to behavioral research on the internet. UpperSaddle River, NJ: Prentice Hall.
Booth-Kewley, S., Edwards, J.E., & Rosenfeld, P. (1992). Impression management,social desirability, and computer administration of attitude questionnaires: Doesthis make a difference? Journal of Applied Psychology, 77, 562–566.
Bowling, A. (2005). Mode of questionnaire administration can have serious effectson data quality. Journal of Public Health, 27, 281–291.
Brannick, M.T. (1995). Critical comments on applying covariance structure modeling.Journal of Organizational Behavior, 16, 201–213.
Buchanan, T., & Smith, J.L. (1999). Using the internet for psychological research:Personality testing on the World Wide Web. British Journal of Psychology,90, 125–144.
PAPER-AND-PENCIL AND INTERNET SURVEYS 359
© 2008 The Authors. Journal compilation © 2008 International Association of AppliedPsychology.
Chan, D. (2000). Detection of differential item functioning on the Kirton adaption-innovation inventory using multi-group mean and covariance structure analyses.Multivariate Behavioral Research, 35, 169–199.
Cheung, G.W., & Rensvold, R.B. (2002). Evaluating goodness-of-fit indexes fortesting measurement invariance. Structural Equation Modeling: An Interdiscipli-nary Journal, 9, 233–255.
Church, A.H., & Waclawski, J. (2001). Designing and using organizational surveys:A seven-step process. San Francisco, CA: Jossey-Bass.
Cole, M.S., Bedeian, A.G., & Field, H.S. (2006). The measurement equivalence ofweb-based and paper-and-pencil measures of transformational leadership.Organizational Research Methods, 9, 339–368.
Cook, C., Heath, F., Thompson, R.L., & Thompson, B. (2001). Score reliability inWeb-or-Internet-based surveys: Unnumbered graphic rating scales versus Likert-type scales. Educational and Psychological Measurement, 61, 697–706.
Dillman, D. (2000). Mail and internet surveys: The tailored design method (2nd edn.).New York: J. Wiley.
Drasgow, F. (1984). Scrutinizing psychological tests: Measurement equivalence andequivalent relations with external variables are central issues. PsychologicalBulletin, 95, 134–135.
Drasgow, F. (1987). Study of measurement bias of two standardized psychologicaltests. Journal of Applied Psychology, 72, 19–29.
Epstein, J., Klinkenberg, W.D., Wiley, D., & McKinley, L. (2001). Ensuring samplingequivalence across Internet and paper-and-pencil assessments. Computers inHuman Behavior, 17, 339–346.
Fenlason, K.J., & Suckow-Zimberg, K. (2006). Online surveys: Critical issues in usingthe web to conduct surveys. In A.I. Kraut (Ed.), Getting action from organizationalsurveys (pp. 183–212). San Francisco, CA: Jossey-Bass.
Ferrando, P.J., & Lorenzo-Seva, U. (2005). IRT-based factor analytic proceduresfor testing the equivalence of paper-and-pencil and internet-administeredquestionnaires. Psychological Methods, 10, 193–205.
Gerbing, D.W., & Hamilton, J.G. (1996). Viability of exploratory factor analysis asa precursor to confirmatory factor analysis. Structural Equation Modeling: AnInterdisciplinary Journal, 3, 62–72.
Hair J.F., Jr., Black, W.C., Babin, B.J., Anderson, R.E., & Tatham, R.L. (2006).Multivariate data analysis (6th edn.). Upper Saddle River, NJ: Pearson Prentice Hall.
Hu, L., & Bentler, P.M. (1999). Cutoff criteria for fit indexes in covariance structureanalysis: Conventional criteria versus new alternatives. Structural Equation Modeling:An Interdisciplinary Journal, 6, 1–55.
Hurley, A.E., Scandura, T.A., Schriesheim, C.A., Brannick, M.T., Seers, A.,Vandenberg, R.J., & Williams, L.J. (1997). Exploratory and confirmatory factoranalysis: Guidelines, issues, and alternatives. Journal of Organizational Behavior,18, 667–683.
James, L.R., & Jones, A.P. (1974). Organizational climate: A review of theory andresearch. Psychological Bulletin, 81, 1096–1112.
James, L.R., & McIntyre, M.D. (1996). Perceptions of organizational climate. InK. Murphy (Ed.), Individual differences and behavior in organizations (pp. 416–450).San Francisco, CA: Jossey-Bass.

360 DE BEUCKELAER AND LIEVENS
© 2008 The Authors. Journal compilation © 2008 International Association of AppliedPsychology.
James, L.R., & Sells, S.B. (1981). Psychological climate: Theoretical perspectives andempirical research. In D. Magnusson (Ed.), Toward a psychology of situations: Aninteractional perspective (pp. 275–295). Hillsdale, NJ: Erlbaum.
Johnson, S.R. (1996). The multinational opinion survey. In A.I. Kraut (Ed.),Organizational surveys: Tools for assessment and change (pp. 310–329). San Francisco,CA: Jossey-Bass.
Johnson, T., Kulesa, P., Ik Cho, P., & Shavitt, S. (2005). The relation betweenculture and response styles: Evidence from 19 countries. Journal of Cross-CulturalPsychology, 36, 264–277.
Kelloway, E.K. (1995). Structural equation modeling in perspective. Journal ofOrganizational Behavior, 16, 215–224.
Kopelman, R.E., Brief, A.P., & Guzzo, R.A. (1990). The role of climate and cul-ture in productivity. In B. Schneider (Ed.), Organisational climate and culture(pp. 282–318). San Francisco, CA: Jossey-Bass.
Kraut, A.I. (1996). Organizational surveys: Tools for assessment and change. SanFrancisco, CA: Jossey-Bass, Little.
Kraut, A.I., & Saari, L.M. (1999). Organizational surveys: Coming of age for a newera. In A.I. Kraut & A.K. Korman (Eds.), Evolving practices in human resourcemanagement (pp. 302–327). San Francisco, CA: Jossey-Bass.
Lautenschlager, G.J., & Flaherty, V.L. (1990). Computer administration of questions:More desirable or more social desirability? Journal of Applied Psychology, 75,310–314.
Little, T.D. (1997). Mean and covariance (MACS) analysis of cross-cultural data:Practical and theoretical issues. Multivariate Behavioural Research, 32, 53–76.
Mann, C., & Stewart, F. (2000). Internet communication and qualitative research: Ahandbook for researching online. London: Sage.
Meredith, W. (1993). Measurement invariance, factor analysis and factorial invariance.Psychometrika, 58, 525–543.
Muthén, L.K., & Muthén, B.O. (1999). Mplus: The comprehensive modeling programfor applied researchers (User’s guide—2nd printing). Los Angeles, CA: Muthénand Muthén.
Muthén, L.K., & Muthén, B.O. (2003). Mplus version 2.13: Addendum to the Mplususer’s guide. Los Angeles, CA: Muthén and Muthén.
Ostroff, C. (1993). The effects of climate and personal influences on individualbehavior and attitudes in organizations. Organizational Behavior and HumanDecision Processes, 56, 56–90.
Parker, C.P., Baltes, B.B., Young, S.A., Huff, J.W., Altmann, R.A., Lacost, H.A.,& Roberts, J.E. (2003). Relationships between psychological climate perceptionsand work outcomes: A meta-analytic review. Journal of Organizational Behavior,24, 389–416.
Ployhart, R.E., Weekley, J.A., Holtz, B.C., & Kemp, C. (2003). Web-based andpaper-and-pencil testing of applicants in a proctored setting: Are personality,biodata, and situational judgment tests comparable? Personnel Psychology, 56,733–752.
Reips, U.D. (2000). The web experiment method: Advantages, disadvantages andsolutions. In M.H. Birnbaum (Ed.), Psychological experiments on the internet(pp. 89–117). San Diego, CA: Academic Press.
PAPER-AND-PENCIL AND INTERNET SURVEYS 361
© 2008 The Authors. Journal compilation © 2008 International Association of AppliedPsychology.
Riordan, C.R., & Vandenberg, R.J. (1994). A central question in cross-culturalresearch: Do employees of different cultures interpret work-related measures inan equivalent manner? Journal of Management, 20, 643–671.
Roberts, L.L., Konczak, L.J., & Macan, T.H. (2004). Effects of data collectionmethod on organizational climate survey results. Applied HRM Research, 9, 13–26.
Ryan, A.M., Chan, D., Ployhart, R.E., & Slade, A.L. (1999). Employee attitudesurveys in a multinational organization: Considering language and culture inassessing measurement equivalence. Personnel Psychology, 52, 37–58.
Schaeffer, D., & Dillman, D. (1998). Development of a standard e-mail methodology:Results of an experiment. Public Opinion Quarterly, 62, 378–397.
Simsek, Z., & Veigha, J.F. (2001). A primer on internet organizational surveys.Organizational Research Methods, 4, 218–235.
Sörbom, D. (1974). A general method for studying differences in factor means andfactor structure across groups. British Journal of Mathematical and StatisticalPsychology, 27, 229–239.
Sörbom, D. (1978). An alternative to the methodology for analysis of covariance.Psychometrika, 43, 381–396.
Sproull, L.S. (1986). Using electronic mail for data collection in organizationalresearch. Academy of Management Journal, 29, 159–169.
Stanton, J.M. (1998). An empirical assessment of data collection using the internet.Personnel Psychology, 51, 709–725.
Stanton, J.M., & Rogelberg, S.G. (2001). Using internet/intranet web pages to collectorganizational research data. Organizational Research Methods, 4, 200–217.
Steiger, J.H. (1990). Structural model evaluation and modification: An intervalestimation approach. Multivariate Behavioral Research, 25, 173–180.
Thompson, L.F., Surface, E.A., Martin, D.L., & Sanders, M.G. (2003). From paper topixels: Moving personnel surveys to the web. Personnel Psychology, 56, 197–227.
Vandenberg, R.J. (2002). Toward a further understanding of and improvement inmeasurement invariance methods and procedures. Organizational Research Methods,5, 139–158.
Vandenberg, R.J., & Lance, C.E. (2000). A review and synthesis of the measurementinvariance literature: Suggestions, practices, and recommendations for organizationalresearch. Organizational Research Methods, 3, 4–70.
Van Herk, H., Poortinga, Y.H., & Verhallen, T.M.M. (2004). Response styles inrating scales: Evidence of method bias in data from six EU countries. Journal ofCross-Cultural Psychology, 35, 346–360.
Van Selm, M., & Jankowski, N.W. (2006). Conducting online surveys. Quality &Quantity, 40, 435–456.
Vispoel, W.P., Boo, J., & Bleiler, T. (2001). Computerized and paper-and-pencilversions of the Rosenberg self-esteem scale: A comparison of psychometric featuresand respondent preferences. Educational and Psychological Measurement, 61, 461–474.
Weijters, B. (2006). Response styles in consumer research. Unpublished doctoraldissertation, University of Ghent, Belgium.
Yun, G.W., & Trumbo, C.W. (2000). Comparative response to a survey executed bypost, email and web form. Journal of Computer-Mediated Communication, 6, 1–26.