measurement equivalence of the patient reported … · psychological test and assessment ... the 11...
TRANSCRIPT

Psychological Test and Assessment Modeling, Volume 58, 2016 (1), 183-219
Measurement equivalence of the Patient Reported Outcomes Measurement Information System® (PROMIS®) Anxiety short forms in ethnically diverse groups
Jeanne A. Teresi1,2,3,4, Katja Ocepek-Welikson3, Marjorie Kleinman2, Mildred Ramirez3,4 & Giyeon Kim5
Abstract
This is the first study of the measurement equivalence of the Patient Reported Outcomes Measure-ment Information System® (PROMIS®) Anxiety short forms in a large ethnically diverse sample. The psychometric properties and differential item functioning (DIF) were examined across different racial/ethnic, educational, age, gender and language groups.
Methods: These data are from individuals selected from cancer registries in the United States. For the analyses of race/ethnicity the reference group was non-Hispanic Whites (n = 2,263), the studied groups were non-Hispanic Blacks (n = 1,117), Hispanics (n = 1,043) and Asians/Pacific Islanders (n = 907). Within the Hispanic subsample, there were 335 interviews conducted in Spanish and 703 in English. The 11 anxiety items were from the PROMIS emotional disturbance item bank.
DIF hypotheses were generated by content experts who rated whether or not they expected DIF to be present, and the direction of the DIF with respect to several comparison groups. The primary method used for DIF detection was the Wald test for examination of group differences in item response theory (IRT) item parameters accompanied by magnitude measures. Expected item scores were examined as measures of magnitude. The method used for quantification of the difference in the average expected item scores was the non-compensatory DIF (NCDIF) index. DIF impact was examined using expected scale score functions. Additionally, precision and reliabilities were exam-ined using several methods.
Results: Although not hypothesized to show DIF for Asians/Pacific Islanders, every item evidenced DIF by at least one method. Two items showed DIF of higher magnitude for Asians/Pacific Is-
1 Correspondence concerning this article should be addressed to: Jeanne A. Teresi, Ed.D, Ph.D., Columbia
University Stroud Center at New York State Psychiatric Institute, 1051 Riverside Drive, Box 42, Room 2714, New York, New York, 10032-3702, USA; email: [email protected]; [email protected] 2 New York State Psychiatric Institute
3 Research Division, Hebrew Home at Riverdale; RiverSpring Health
4 Department of Geriatrics and Palliative Medicine, Weill Cornell Medical Center
5 Center for Mental Health and Aging, Department of Psychology, University of Alabama, Tuscaloosa

J. A. Teresi, K. Ocepek-Welikson, M. Kleinman, M. Ramirez & G. Kim 184
landers vs. Whites: “Many situations made me worry” and “I felt anxious”. However, the magni-tude of DIF was small and the NCDIF statistics were not above threshold. The impact of DIF was negligible. For education, six items were identified with consistent DIF across methods: fearful, anxious, worried, hard to focus, uneasy and tense. However, the NCDIF was not above threshold and the impact of DIF on the scale was trivial. No items showed high magnitude DIF for gender. Two items showed slightly higher magnitude for age (although not above the cutoff): worried and fearful. The scale level impact was trivial. Only one item showed DIF with the Wald test after the Bonferroni correction for the language comparisons: “I felt fearful”. Two additional items were flagged in sensitivity analyses after Bonferroni correction, anxious and many situations made me worry. The latter item also showed DIF of higher magnitude, with an NCDIF value (0.144) above threshold. Individual impact was relatively small.
Conclusions: Although many items from the PROMIS short form anxiety measures were flagged with DIF, item level magnitude was low and scale level DIF impact was minimal; however, three items: anxious, worried and many situations made me worry might be singled out for further study. It is concluded that the PROMIS Anxiety short form evidenced good psychometric properties, was relatively invariant across the groups studied, and performed well among ethnically diverse sub-groups of Blacks, Hispanic, White non-Hispanic and Asians/Pacific Islanders. In general more research with the Asians/Pacific Islanders group is needed. Further study of subgroups within these broad categories is recommended.
Key words: anxiety, PROMIS, item response theory, differential item functioning, ethnic diversity
Introduction
Item banks developed using item response theory (IRT) are being promoted for efficient assessment of health-related constructs, particularly as applied to physically frail popula-tions. Some of these banks have focused on anxiety. For example, Walter et al. (2007) established an anxiety item bank with 50 items, calibrated with the generalized partial credit model. Precise estimates were obtained with as few as six to eight items adminis-tered. Somatic anxiety symptoms such as dizziness, dyspnea and palpitations were ex-cluded. Another well-known collection of item banks is from the Patient Reported Out-comes Measurement Information System® (PROMIS®), developed as a part of the U.S. National Institutes of Health (NIH) roadmap initiative (see www.nihpromis.org) to measure self-reported health for clinical research and practice. As a subdomain to meas-ure emotional distress, the PROMIS Anxiety item bank consists of 29 items and several short forms (Cella et al., 2010; Pilkonis, Choi, Reise, Stover, Riley, & Cella, 2011). Originally developed in English, the PROMIS Anxiety item bank has been translated into several languages including: Spanish, German, Mandarin (short form only) and Dutch (short form only). According to the NIH PROMIS webpage (http://www. nihpromis.org/measures/translations), translation of the PROMIS Anxiety item bank into several other languages (e.g., Portuguese, Hebrew) is currently in progress.

Measurement equivalence of the PROMIS® Anxiety short forms 185
Differential Item Functioning (DIF) analyses of the PROMIS Anxiety item bank
Given that systematic measurement bias in measures used for research and practice could lead to misleading group comparisons and inaccurate prevalence rates, a critical first step for the PROMIS Anxiety item bank is to establish measurement equivalence across diverse groups. Despite the importance of measurement equivalence, differential item functioning analyses have not been performed widely in studies using PROMIS measures. Only a few studies examined DIF for PROMIS measures and even fewer studies of DIF are available for the PROMIS anxiety measure (e.g., Choi, Gibbons, & Crane, 2011). Choi et al. evaluated the 29 item PROMIS Anxiety bank for age DIF using a sample of 766 adults. Five of 29 items evidenced modest levels of DIF: “I felt fearful”; “I was anxious if my normal routine was disturbed”; “I was easily startled”; “I worried about other people’s reactions to me”; and “Many situations made me worry.” Magni-tude of DIF was small. Aggregate DIF impact was very small; however, based on exam-ination of the standard error of measurement, salient score changes for some subjects were observed such that there was some individual level impact. Given that the sample used in the analyses by Choi et al. did not permit analyses by race or ethnicity, there is a need for DIF analyses of the PROMIS Anxiety item bank in patient populations from diverse cultural backgrounds.
DIF Analyses of general anxiety measures
Several recent studies have examined DIF in the Hospital Anxiety and Depression Scale (HADS; Zigmond & Snaith, 1983) in different populations, such as primary care (Cam-eron, Scott, Adler, & Reid, 2014); Parkinson’s disease (Forjaz, Rodrigues-Blázquez, & Martinez-Martin, 2009); spinal cord injury (Müller, Cieza, & Geyh, 2012); motor neu-rone disease (Gibbons et al. 2011); chronic obstructive pulmonary disease (Tang, Wong, Shiu, Lum, & Ungvari, 2008); musculoskeletal rehabilitation (Pallant & Tennant, 2007); breast cancer (Osborne et al., 2004), and caregivers to cancer patients (Lambert, Pallant, & Girgis, 2011). Nearly all investigators used the Rasch model for analyses, and most concluded that little DIF was observed. In one study (Cameron et al., 2014) of the HADS, DIF was observed for gender or age for three items. Only one item with gender DIF was identified (Guillén-Riqueime & Buela-Casal, 2011) in the State-Trait Anxiety Inventory (Spielberger, Gorsuch, Lushene, Vagg, & Jacobs, 1983). It was also concluded by most authors that the impact of DIF in these measures of anxiety was small. For ex-ample, Osborne and colleagues (2004), discussing the impact of DIF in the HADS (Zig-mond & Snaith), did not recommend adjustments for cancer patients. However, one study (Forjaz et al., 2013) concluded that none of the anxiety measures studied, including the HADS, performed well psychometrically in samples with Parkinson’s disease. A more detailed review of DIF in depression, anxiety and quality-of-life measures can be found in Teresi, Ramirez, Lai, and Silver (2008).

J. A. Teresi, K. Ocepek-Welikson, M. Kleinman, M. Ramirez & G. Kim 186
Aim of the analyses
Given the limited literature on DIF in the PROMIS Anxiety item bank, and more specifi-cally the short forms, the aim of this study was to generate DIF hypotheses and examine the item-level performance of the short form anxiety items among different racial/ethnic, age, gender, educational, and language groups. The analytic focus was to examine the item- and scale-level equivalence among cancer patients from diverse ethnic and cultural backgrounds in order to increase knowledge about its use in clinical research and prac-tice among such groups.
Methods
Sample
These data are from individuals with cancer who were selected from cancer registries in regions of the United States. Details are provided in the overview article on the sample characteristics (Jensen et al., 2016). The overall sample sizes were 1,053 Hispanics, 917 Asians/Pacific Islanders, 1,122 non-Hispanic Blacks and 2,278 non-Hispanic Whites; 2,248 were aged 65 and over and 975 had less than a high school education. The studied (also called the focal) group was males in the analyses of gender; the sample sizes for the groups were 3,243 females and 2,187 males. In the analyses of education, the reference group was graduate degree (n = 640). The studied groups were less than high school (n = 965), high school (n = 1,050), some college (n = 1,752) and college degree (n = 985). The reference group for age was 21 to 49 (n = 1,200); the studied groups were 50 to 64 (n = 2,005) and 65 to 84 (n = 2,225). For the analyses of ethnicity the reference group was non-Hispanic Whites (n = 2,263); the studied groups were non-Hispanic Blacks (n = 1,117), Hispanics (n = 1,043) and Asians/Pacific Islanders (n = 907). Within the Hispan-ic sub-sample, there were 335 interviews conducted in Spanish and 703 in English.
Measures
The 11 anxiety items were part of a subdomain of emotional distress (Choi, Reise, Pilko-nis, Hays, & Cella, 2010). Short form items were selected from the item bank based on rank-order of IRT information provided and frequency of administration in the comput-erized adaptive test. The timeframe for all items was the past seven days. Items were administered using a five point response scale ranging from one to five across response categories: never, rarely, sometimes, often, and always. In addition to the eight item short form (identified in Table 1), three other items were selected for inclusion based on in-formation and coverage across the latent attribute continuum, or their inclusion in other short form measures.

Measurement equivalence of the PROMIS® Anxiety short forms 187
Table 1: DIF hypotheses generated by nine content experts for anxiety (Italicized entries are those with
two or more ratings in the same direction. The first number indicates the number of hypotheses for the item; the second number in parentheses indicates how many provided a
direction, if different from the first number.) The PROMIS anxiety short form items corresponding to different short form versions are identified under the item stem
Stem Gender Age Race/Ethnicity Language Education Diagnosis
1 I felt fearful (4a, 6a, 7a, 8a)
5 Women more fearful
2 Younger more fearful
4 Latino (2)b more Blacks(2) more fearful
2 Japanese [no direction]
2 Chronic; Cancer (1) more fearful
2 I felt anxious (7a, 8a)
4 Women more anxious
3 Younger more anxious (2)
4 Blacks (2) Latino more anxious (2)
2 Japanese [no direction]
2
3 I felt worried (7a)
4 Women more worried
2 Inconsistent Direction
3 Black (1), Latino (1) more worried
3 Spanish more worried(2)
4 I found it hard to focus on anything other than my anxiety (4a, 6a, 7a, 8a)
2 Women more anxious
2 2 Cancer more anxious
5 I felt nervous (6a, 7a, 8a)
6 Women more nervous
3 Younger (2) more nervous
4 White (1), Latino (3) more nervous
3 Spanish more nervous
2 Cancer, Chronic more nervous
6 I felt uneasy (4a, 6a, 7a, 8a)
3 Black more uneasy(1)
3
7 I felt tense (7a, 8a)
2 Women more tense
2 Black/minority more tense
2 Spanish more tense
8 My worries overwhelmed me (4a, 6a, 8a)
5 Women more overwhelmed
2 Older more overwhelmed
2 Black more overwhelmed; Latino more overwhelmed
3
2
9 I felt like I needed help for my anxiety (6a, 8a)
4 Women more needed help
2 5 Asian (1), Minority (1) less needed help White more help (2)
2 Spanish more needed help
2 Higher education more help
10 Many situations made me worry
3 Women more worried
2
11 I had difficulty calming down

J. A. Teresi, K. Ocepek-Welikson, M. Kleinman, M. Ramirez & G. Kim 188
Qualitative analyses and hypotheses generation
DIF hypotheses were generated for these analyses by content experts who rated whether or not they expected DIF to be present, and the direction of the DIF with respect to sev-eral comparison groups: gender, age, race/ethnicity, language and education. A grid containing a row for each of the items and separate columns for each of the referenced groups was distributed to the experts for completion in order to facilitate the rating.
A definition of DIF was provided, and the following instructions related to hypotheses generation were given.
Differential item functioning means that individuals from different sociodemographic groups with the same underlying trait (state) level will have different probabilities of endorsing an item. Put another way, reporting a symptom (e.g., feeling worried) should depend only on the level of the trait (state), e.g., anxiety and not on member-ship in a group, e.g., older or younger.
Rating forms were completed by nine expert raters who were clinical or counseling psy-chologists (two), public health professionals (five), epidemiologists (one) and gerontolo-gists (one). The goal was to identify items that might have a different meaning or not be understood well and/or equivalently by individuals in the groups referenced. A summary of the DIF hypotheses is shown in Table 1.
Quantitative analyses
Tests of model assumptions
Model assumptions and fit were tested. Unidimensionality was examined using split samples, constructed by selection of two random halves in order to use one sample for cross-validation of results. The random first half of the sample was used for the explora-tory factor analyses with principal components estimation and tests of scree; and the second half was used to obtain a confirmatory solution. Traditional methods of examin-ing essential unidimensionality were applied (Asparouhov & Muthén, 2009) in which confirmatory factor analysis was performed fitting a unidimensional model with poly-choric correlations using MPlus (Muthén & Muthén, 2011). As an additional test of dimensionality, a bifactor model was examined using the second random half of the sample. These analyses were conducted in part with R (Revelle, 2015; Rizopoulus, 2009; R Core Team, 2013) and MPlus (Muthén & Muthén). Details of the methods are provid-ed in the paper on depression in this issue. Finally, a measure of dimensionality, the explained common variance (ECV) was examined. The assumption of local dependency (LD) was examined using the generalized, standardized local dependency chi-square statistics (Chen & Thissen, 1997) provided in Item Response Theory for Patient Reported Outcomes (IRTPRO), version 2.1 (Cai, Thissen, & du Toit, 2011).

Measurement equivalence of the PROMIS® Anxiety short forms 189
IRT model fit
Model fit for the IRT models was examined using the root mean square error of approx-imation (RMSEA) from IRTPRO (Cai et al., 2011) software.
Reliability and information
McDonald’s (McDonald, 1999) omega total (ωt), a reliability estimate based on the pro-portion of total common variance explained was also calculated. Both Cronbach’s alpha and ordinal alpha based on polychoric correlations (Gadermann, Guhn, & Zumbo, 2012; Zumbo, Gradermann, & Zeisser, 2007) were calculated. Additionally, IRT-based relia-bility measures were examined at selected points along the underlying latent continuum. IRT-based information functions were also examined.
Tests of DIF hypotheses
Model: The graded response model (Samejima, 1969) was used for DIF detection. The item characteristic curve (ICC) that relates the probability of an item response to the underlying state, e.g., anxiety, measured by the item set is characterized by two parame-ters: a discrimination parameter, proportional to the slope of the curve (denoted a) and location (severity) parameters (denoted b). An item shows DIF if people from different subgroups but at the same level of the attribute (denoted θ) have unequal probabilities of endorsement. The presence of DIF is demonstrated by ICCs that are different across comparison subgroups.
DIF detection and anchor item selection: Group differences in IRT item parameters were examined using the Wald test (Lord, 1980), accompanied by magnitude measures. An-chor items that are DIF free were selected iteratively. For each studied item, a model was constructed with all parameters (except the studied item) constrained to be equal across comparison groups for the anchor items, and item parameters for the studied item freed to be estimated distinctly. An overall simultaneous joint test of differences in the a or b parameters was performed followed by step down tests for group differences in the a parameters, followed by conditional tests of the b parameters. Uniform DIF was detected when the b parameters differ and non-uniform DIF when the a parameters differ among groups. Non-orthogonal contrasts were used. The final p values were adjusted using Bonferroni (1936) methods. In this case, the p value was adjusted for examination of 11 anxiety items (p = 0.0045). Sensitivity analyses were conducted with latent variable ordinal logistic regression analyses using lordif (Choi et al., 2011).
Evaluation of DIF magnitude and impact
The magnitude of DIF refers to the degree of difference in item performance between or among groups, conditional on the trait or state being examined. Expected item scores were examined as measures of magnitude. (See Figure 1 for examples.) An expected item score is the sum of the weighted (by the response category value) probabilities of scoring in each of the possible categories for the item. The non-compensatory DIF (NCDIF) index (Raju, van der Linden, & Fleer, 1995) in DFIT (Raju, Fortmann-Johnson,

J. A. Teresi, K. Ocepek-Welikson, M. Kleinman, M. Ramirez & G. Kim 190
Kim, Morris, Nering, & Oshima, 2009) was used to quantify the difference in the aver-age expected item scores. An additional magnitude measure used in these analyses is the T1 statistic (Wainer, 1993). Details of the methods are presented in the paper on magni-tude and impact in this issue (Kleinman & Teresi, 2016). Aggregate impact was evaluat-ed by comparing expected scale score functions between groups. Individual impact was measured by fixing and freeing parameters based on DIF analyses and comparing theta estimates before and after DIF adjustment.
Results
Qualitative analyses
Table 1 shows the hypotheses generated for the anxiety items. Conditional on anxiety, it was hypothesized that women would report being more fearful, anxious, worried, nerv-ous, tense, overwhelmed, and need more help for anxiety. Younger people were posited to be more fearful, anxious, nervous, and older people were posited to feel more over-whelmed than younger people.
Minority group members (Latinos/Hispanics and Blacks) were posited to express more feelings of fear, anxiety, worry, and states of tension, nervousness, and being over-whelmed than their White Non-Hispanic counterparts, conditional on anxiety. Spanish speakers were posited to express more feelings of being worried, nervous, tense, and in need of help. No consistent hypotheses were generated with respect to education and patients with cancer were posited to express greater levels of anxiety and nervousness, conditional on anxiety.
Quantitative results for anxiety
Tests of model assumptions
Unidimensionality and Local Independence: As shown in Table 2, there was support for essential unidimensionality across groups. The principal components analyses showed that the ratio of component one to two was large (17.6 to 28.3) across groups. (See Appendix6 Figure 1 for the scree plot for the total sample.) The first component accounted for between 81 % and 86 % of the variance across comparison groups. Examination of the confirmatory factor analyses results in Table 3 shows that the loadings on the general factor from the bifactor model ranged from 0.85 to 0.94, and were very similar (within 0 to 0.02) to those observed based on the single common factor solution. Additionally, the communalities were large, ranging from 0.80 to 0.92. The Comparative Fit Index (CFI; Bentler, 1990) from the unidimensional CFA model estimated using MPlus ranged from 0.988 to 0.993 (see Appendix, Table 1); the ECVs ranged from 70.21 to 78.30 (see Table 4).
6 To access online appendices, please use the following url: http://www.research-hhar.org/Tables/DEP-
PTAM-appendix.htm

Measurement equivalence of the PROMIS® Anxiety short forms 191
Table 2: PROMIS anxiety short form item set: Tests of dimensionality from principal components
analysis (eigenvalues by subgroup)
Statistic Component 1
Component 2
Component 3
Component 4
Ratio Component 1/ Component 2
Total Sample (n = 5466)
Eigenvalues 9.285 0.366 0.273 0.239 25.4
Explained Variance 84.4 % 3.3 % 2.5 % 2.2 %
Random First Half Sample (n = 2733)
Eigenvalues 9.274 0.362 0.279 0.230 25.6
Explained Variance 84.3 % 3.3 % 2.5 % 2.1 %
Females (n = 3243)
Eigenvalues 9.236 0.383 0.279 0.244 24.1
Explained Variance 84.0 % 3.5 % 2.5 % 2.2 %
Males (n = 2187)
Eigenvalues 9.309 0.352 0.272 0.235 26.4
Explained Variance 84.6 % 3.2 % 2.5 % 2.1 %
Age 21 to 49 (n = 1200)
Eigenvalues 9.152 0.403 0.307 0.258 22.7
Explained Variance 83.2 % 3.7 % 2.8 % 2.3 %
Age 50 to 64 (n = 2005)
Eigenvalues 9.339 0.356 0.271 0.233 26.2
Explained Variance 84.9 % 3.2 % 2.5 % 2.1 %
Age 65 to 84 (n = 2225)
Eigenvalues 9.183 0.387 0.285 0.238 23.7
Explained Variance 83.5 % 3.5 % 2.6 % 2.2 %
Race/Ethnicity: Non-Hispanic White (n = 2263)
Eigenvalues 9.197 0.399 0.304 0.231 23.1
Explained Variance 83.6 % 3.6 % 2.8 % 2.1 %
Race/Ethnicity: Non-Hispanic Black (n = 1117)
Eigenvalues 9.372 0.331 0.273 0.245 28.3
Explained Variance 85.2 % 3.0 % 2.5 % 2.2 %
Race/Ethnicity: Hispanic (n = 1043)
Eigenvalues 9.157 0.38 0.317 0.273 24.1
Explained Variance 83.3 % 3.5 % 2.9 % 2.5 %
Race/Ethnicity: Non-Hispanic Asians/Pacific Islanders (n = 907)
Eigenvalues 9.454 0.366 0.254 0.21 25.8
Explained Variance 85.9 % 3.3 % 2.3 % 1.9 %
Education: Less Than High School (n = 965)
Eigenvalues 9.14 0.375 0.309 0.276 24.4
Explained Variance 83.1 % 3.4 % 2.8 % 2.5 %

J. A. Teresi, K. Ocepek-Welikson, M. Kleinman, M. Ramirez & G. Kim 192
Statistic Component 1
Component 2
Component 3
Component 4
Ratio Component 1/ Component 2
Education: High School (n = 1050)
Eigenvalues 9.259 0.344 0.302 0.237 26.9
Explained Variance 84.2 % 3.1 % 2.7 % 2.2 %
Education: Some College (n = 1752)
Eigenvalues 9.348 0.366 0.28 0.23 25.5
Explained Variance 85.0 % 3.3 % 2.5 % 2.1 %
Education: College Degree (n = 985)
Eigenvalues 9.163 0.396 0.311 0.25 23.1
Explained Variance 83.3 % 3.6 % 2.8 % 2.3 %
Education: Graduate Degree (n = 640)
Eigenvalues 8.95 0.459 0.352 0.244 19.5
Explained Variance 81.4 % 4.2 % 3.2 % 2.2 %
Hispanics Interviewed in English (n = 703)
Eigenvalues 9.198 0.383 0.304 0.242 24.0
Explained Variance 83.6 % 3.5 % 2.8 % 2.2 %
Hispanics Interviewed in English (n = 335)
Eigenvalues 9.059 0.515 0.319 0.261 17.6
Explained Variance 82.4 % 4.7 % 2.9 % 2.4 %
A few items evidenced relatively high local dependency values: uneasy, with nervous and tense (not shown); however, as shown in Appendix Table 2, the effects of the higher LD values on the discrimination parameters were minimal. The highest value was 5.94, and most values were below five. However, these items were tested further in sensitivity analyses for the possible impact of high LD values on DIF results.
Tests of model fit
The fit statistics (RMSEA’s) from IRTPRO for the IRT models (see Appendix, Table 1) ranged from 0.04 to 0.07 across DIF comparison subgroup models, indicating good to adequate fit.
Reliability estimates
The reliability estimates were high. The Omega total values (Table 4) ranged from 0.977 to 0.984, and the Cronbach’s alphas from 0.956 to 0.972; the ordinal alpha values ranged from 0.977 to 0.984. Finally, the reliability estimates (precision) at points along the latent trait (theta) reflective of where respondents were observed were high. Most estimates were in the 0.90’s, except for at the lowest values of theta (-1.2 and -1.6) where the esti-mates were lower, ranging from 0.50 to 0.90. The overall reliability estimate was 0.91 for the total sample, ranging from 0.89 to 0.98 across individual subgroups (see Table 5).

Measurement equivalence of the PROMIS® Anxiety short forms 193T
able
3:
PR
OM
IS a
nxie
ty s
hort
for
m it
em s
et: I
tem
load
ings
(λ)
fro
m th
e un
idim
ensi
onal
con
firm
ator
y fa
ctor
ana
lysi
s (M
Plu
s) f
or f
irst
hal
f of
the
rand
om s
ampl
e (n
= 2
733)
, Sch
mid
-Lei
man
bif
acto
r m
odel
wit
h tw
o an
d th
ree
grou
p fa
ctor
s (p
erfo
rmed
wit
h R
) fo
r se
cond
ran
dom
hal
f sa
mpl
e an
d M
Plu
s bi
fact
or th
ree
grou
p fa
ctor
sol
utio
n fo
r se
cond
ran
dom
hal
f sa
mpl
e (n
= 2
733)
* G
eom
in (
obli
que)
rot
atio
n **
Sch
mid
-Lei
man
bif
acto
r m
odel
; h2 is
the
com
mun
alit
y; G
λ a
nd F
1 λ
- F
3 λ
are
load
ings
on
the
gene
ral a
nd g
roup
fac
tors
Item
Des
crip
tion
MPl
us
One
Fact
.*λ
(s.e
.)
Schm
id-L
eim
an B
ifact
or S
olut
ion
MPl
us B
ifact
or S
olut
ions
(B
ased
on
S-L
** R
esul
t)
Gλ
(var
.)F1
λF2
λF3
λh2
Gλ
(s.e
.) F1
λ(s
.e.)
F2λ
(s.e
.) F3
λ(s
.e.)
I fel
t fea
rful
0.
87(0
.006
)0.
830.
300.
800.
85(0
.007
)0.
37(0
.026
)I f
elt a
nxio
us
0.90
(0.0
05)
0.88
0.20
0.83
0.90
(0.0
05)
0.15
(0.0
14)
I fel
t wor
ried
0.91
(0.0
04)
0.88
0.30
0.87
0.90
(0.0
05)
0.23
(0.0
16)
I fou
nd it
har
d to
focu
s on
anyt
hing
ot
her t
han
my
anxi
ety
0.93
(0.0
04)
0.91
0.86
0.94
(0.0
04)
I fel
t ner
vous
0.
93(0
.003
)0.
910.
240.
890.
92(0
.004
)0.
23(0
.013
)I f
elt u
neas
y 0.
95(0
.003
)0.
930.
240.
920.
93(0
.004
)0.
26(0
.014
)I f
elt t
ense
0.
93(0
.003
)0.
910.
230.
870.
91(0
.004
)0.
22(0
.012
)M
y w
orrie
s ove
rwhe
lmed
me
0.91
(0.0
04)
0.90
0.23
0.88
0.93
(0.0
04)
0.11
(0.0
16)
I fel
t lik
e I n
eede
d he
lp fo
r my
anxi
ety
0.92
(0.0
05)
0.89
0.25
0.86
0.91
(0.0
05)
0.18
(0.0
21)
Man
y si
tuat
ions
mad
e m
e w
orry
0.
90(0
.004
)0.
870.
230.
820.
89(0
.005
)0.
15(0
.020
)I h
ad d
iffic
ulty
cal
min
g do
wn
0.90
(0.0
05)
0.89
0.24
0.86
0.90
(0.0
06)
0.27
(0.0
26)

J. A. Teresi, K. Ocepek-Welikson, M. Kleinman, M. Ramirez & G. Kim 194
Table 4: PROMIS anxiety short form item set: Reliability statistics (Cronbach’s alpha, ordinal alpha, McDonald’s Omega Total) and explained common variance (ECV) for the total sample and
demographic subgroups (“Psych” R package)
Cronbach's Alpha
Ordinal Alpha
McDonald’s Omega
ECV
Total Sample 0.969 0.981 0.982 76.418
Random First Half Sample 0.969 0.982 0.982 76.568
Age 21 to 49 years 0.968 0.980 0.980 75.994
Age 50 to 64 years 0.971 0.982 0.982 77.419
Age 65 to 84 years 0.965 0.980 0.980 74.162
Male 0.968 0.982 0.982 75.931
Female 0.969 0.981 0.981 76.334
Non-Hispanic Whites 0.965 0.980 0.980 74.452
Non-Hispanic Blacks 0.970 0.983 0.983 77.218
Hispanics 0.968 0.980 0.980 76.177
Non-Hispanic Asians/Pacific Islanders 0.972 0.984 0.984 78.295
Less Than High School 0.969 0.980 0.980 76.207
High School Degree 0.969 0.981 0.981 76.311
Some College 0.970 0.982 0.983 76.958
College Graduate 0.963 0.980 0.980 73.581
Graduate Degree 0.956 0.977 0.977 70.207
Hispanics Interviewed in English 0.969 0.980 0.980 76.189
Hispanics Interviewed in Spanish 0.967 0.978 0.979 75.722

Measurement equivalence of the PROMIS® Anxiety short forms 195
Tab
le 5
: P
RO
MIS
anx
iety
sho
rt f
orm
item
set
: Ite
m r
espo
nse
theo
ry (
IRT
) re
liab
ility
est
imat
es a
t var
ying
leve
ls o
f th
e at
trib
ute
(the
ta)
estim
ate
base
d on
res
ults
of
the
IRT
ana
lysi
s (I
RT
PR
O)
for
the
tota
l sam
ple
and
dem
ogra
phic
sub
grou
ps
Not
e: R
elia
bili
ty e
stim
ates
wer
e ca
lcul
ated
for
thet
a le
vels
for
whi
ch th
ere
are
resp
onde
nts
N
HW
= N
on-H
ispa
nic
Whi
tes;
NH
B =
Non
-His
pani
c B
lack
s; H
isp.
= H
ispa
nic;
NH
AP
I =
Non
-His
pani
c A
sian
s/P
acif
ic I
slan
ders
C
oll.
= c
olle
ge; L
ang.
= la
ngua
ge; E
ngl.
= E
ngli
sh; S
pan.
= S
pani
sh
Anx
iety
(T
heta
)IR
T R
elia
bilit
y T
otal
FM
Age
21-4
9A
ge50
-64
Age
65-8
4N
H WN
HB
His
p.N
HA
PI<H
S H
SSo
me
Col
l.C
oll.
Gra
d.L
ang.
Eng
l.L
ang.
Span
.-1
.6
0.58
0.
63
0.54
0.
70
0.55
0.
54
0.56
0.
55
0.68
0.
57
0.66
0.
50
0.57
0.
55
0.56
0.
64
0.78
-1
.2
0.74
0.
80
0.63
0.
86
0.69
0.
64
0.70
0.
69
0.85
0.
73
0.84
0.
51
0.72
0.
67
0.69
0.
82
0.90
-0
.8
0.90
0.
92
0.83
0.
95
0.87
0.
83
0.87
0.
88
0.94
0.
90
0.95
0.
53
0.89
0.
85
0.85
0.
93
0.96
-0
.4
0.96
0.
97
0.94
0.
97
0.95
0.
94
0.95
0.
96
0.98
0.
97
0.98
0.
59
0.96
0.
95
0.94
0.
97
0.98
0.
0 0.
98
0.98
0.
98
0.98
0.
98
0.98
0.
98
0.98
0.
98
0.98
0.
98
0.75
0.
98
0.98
0.
97
0.98
0.
98
0.4
0.98
0.
98
0.98
0.
98
0.98
0.
98
0.98
0.
98
0.98
0.
98
0.98
0.
91
0.98
0.
98
0.97
0.
98
0.98
0.
8 0.
98
0.98
0.
98
0.98
0.
98
0.98
0.
98
0.98
0.
98
0.98
0.
98
0.97
0.
98
0.98
0.
98
0.98
0.
98
1.2
0.98
0.
98
0.98
0.
98
0.98
0.
98
0.98
0.
98
0.98
0.
98
0.98
0.
98
0.98
0.
98
0.98
0.
98
0.98
1.
6 0.
98
0.98
0.
98
0.98
0.
98
0.98
0.
98
0.98
0.
98
0.98
0.
98
0.98
0.
98
0.98
0.
98
0.98
0.
98
2.0
0.98
0.
98
0.98
0.
98
0.98
0.
98
0.98
0.
98
0.98
0.
98
0.97
0.
98
0.98
0.
98
0.98
0.
98
0.97
2.
4 0.
97
0.97
0.
98
0.94
0.
97
0.98
0.
98
0.96
0.
93
0.98
0.
90
0.98
0.
98
0.98
0.
97
0.94
0.
90
2.8
0.90
0.
89
0.93
0.
83
0.89
0.
96
0.96
0.
86
0.79
0.
93
0.75
0.
98
0.92
0.
97
0.98
0.
82
0.74
O
vera
ll(A
vera
ge)
0.91
0.
92
0.89
0.
93
0.90
0.
90
0.91
0.
90
0.92
0.
91
0.91
0.
98
0.91
0.
90
0.90
0.
92
0.93
J. A. Teresi, K. Ocepek-Welikson, M. Kleinman, M. Ramirez & G. Kim 196
Anchor Item Selection
Similar to the depression analysis reported in this issue, the number of selected anchors was small for all DIF analyses. For the race/ethnicity analysis only two items showing no DIF were selected as anchor items: “I felt nervous” and “I had difficulty calming down.” Simi-larly for the education groups the items: “My worries overwhelmed me” and “I had diffi-culty calming down” were selected. For the age groups, three anchors were selected: “I found it hard to focus on anything other than my anxiety”; “I felt nervous” and “I felt like I needed help for my anxiety.” For the language groups, three anchor items were selected: “I found it hard to focus on anything other than my anxiety”; “I felt tense” and “I felt like I needed help for my anxiety.” The only analysis with four or more anchor items was for the gender comparisons that included the following items: “I felt worried”; “I felt nervous”; “I felt tense”; “My worries overwhelmed me”; and “Many situations made me worry.”
IRT parameter estimates
Shown in Table 6 are the graded response item parameters and their standard errors for the total sample. Appendix Table 2 shows the discrimination (a) parameters across sub-group comparisons. As shown, the a parameters vary somewhat across items and groups, ranging from 3.17 to 5.48 across items for the total sample. For the individual subgroups, the a parameters ranged from 2.80 (fearful for age 21 to 49) to 6.06 (uneasy for those with a high school education; See Appendix Table 2.)
DIF results
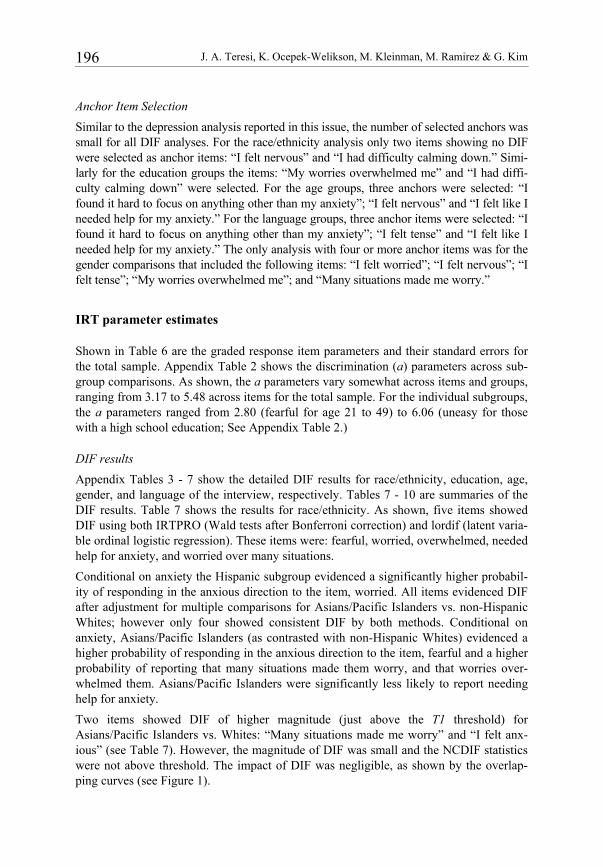
Appendix Tables 3 - 7 show the detailed DIF results for race/ethnicity, education, age, gender, and language of the interview, respectively. Tables 7 - 10 are summaries of the DIF results. Table 7 shows the results for race/ethnicity. As shown, five items showed DIF using both IRTPRO (Wald tests after Bonferroni correction) and lordif (latent varia-ble ordinal logistic regression). These items were: fearful, worried, overwhelmed, needed help for anxiety, and worried over many situations.
Conditional on anxiety the Hispanic subgroup evidenced a significantly higher probabil-ity of responding in the anxious direction to the item, worried. All items evidenced DIF after adjustment for multiple comparisons for Asians/Pacific Islanders vs. non-Hispanic Whites; however only four showed consistent DIF by both methods. Conditional on anxiety, Asians/Pacific Islanders (as contrasted with non-Hispanic Whites) evidenced a higher probability of responding in the anxious direction to the item, fearful and a higher probability of reporting that many situations made them worry, and that worries over-whelmed them. Asians/Pacific Islanders were significantly less likely to report needing help for anxiety.
Two items showed DIF of higher magnitude (just above the T1 threshold) for Asians/Pacific Islanders vs. Whites: “Many situations made me worry” and “I felt anx-ious” (see Table 7). However, the magnitude of DIF was small and the NCDIF statistics were not above threshold. The impact of DIF was negligible, as shown by the overlap-ping curves (see Figure 1).

Measurement equivalence of the PROMIS® Anxiety short forms 197
Table 6: PROMIS anxiety short form item set: Item response theory (IRT) item parameters and
standard error estimates (using IRTPRO) for the total sample (n = 5459)
Item Description a s.e. of a
b1 s.e. b2 s.e. b3 s.e. b4 s.e.
I felt fearful 3.17 0.07 0.07 0.02 0.67 0.02 1.56 0.03 2.27 0.05
I felt anxious 3.91 0.09 -0.13 0.02 0.46 0.02 1.32 0.02 2.09 0.04
I felt worried 3.95 0.09 -0.44 0.02 0.22 0.02 1.11 0.02 1.80 0.03
I found it hard to focus on anything other than my anxiety
4.69 0.12 0.27 0.02 0.87 0.02 1.54 0.03 2.19 0.04
I felt nervous 4.89 0.12 -0.03 0.02 0.57 0.02 1.40 0.02 2.06 0.04
I felt uneasy 5.48 0.14 -0.04 0.02 0.58 0.02 1.39 0.02 2.04 0.04
I felt tense 4.63 0.11 -0.12 0.02 0.50 0.02 1.32 0.02 2.09 0.04
My worries overwhelmed me
4.43 0.11 0.20 0.02 0.73 0.02 1.43 0.03 2.05 0.04
I felt like I needed help for my anxiety
4.22 0.11 0.39 0.02 0.87 0.02 1.51 0.03 2.01 0.04
Many situations made me worry
3.68 0.09 -0.11 0.02 0.52 0.02 1.29 0.02 1.89 0.04
I had difficulty calming down
3.87 0.10 0.29 0.02 0.91 0.02 1.63 0.03 2.23 0.04
a = item discrimination; b = item severity, s.e. = standard error
J. A. Teresi, K. Ocepek-Welikson, M. Kleinman, M. Ramirez & G. Kim 198T
able
7:
PR
OM
IS a
nxie
ty s
hort
for
m it
em s
et: D
iffe
rent
ial i
tem
fun
ctio
n (D
IF)
resu
lts:
Rac
e/E
thni
city
sub
grou
p co
mpa
riso
ns
All
NC
DIF
val
ues
wer
e sm
alle
r th
an th
e th
resh
old
(0.0
960)
. † In
dica
tes
valu
e ab
ove
thre
shol
d of
0.1
0; b
olde
d va
lues
are
abo
ve 0
.15.
*A
ster
isks
indi
cate
sig
nifi
canc
e af
ter
adju
stm
ent f
or m
ulti
ple
com
pari
sons
. H
isp.
= H
ispa
nic;
NH
AP
I =
Non
-His
pani
c A
sian
s/ P
acif
ic I
slan
ders
N
U=
Non
-uni
form
DIF
invo
lvin
g th
e di
scri
min
atio
n pa
ram
eter
s; U
=U
nifo
rm D
IF in
volv
ing
the
loca
tion
par
amet
ers.
F
or t
he l
ordi
f an
alys
es,
the
Uni
form
and
non
-uni
form
DIF
was
det
erm
ined
usi
ng t
he l
ikel
ihoo
d ra
tio
chi-
squa
re t
est.
Uni
form
DIF
is
obta
ined
by
com
pari
ngth
e lo
g li
keli
hood
val
ues
from
mod
els
one
and
two.
Non
-uni
form
DIF
is o
btai
ned
by c
ompa
ring
the
log
likel
ihoo
d va
lues
fro
m m
odel
s tw
o an
d th
ree.
DIF
was
not d
etec
ted
usin
g th
e ps
eudo
R2
mea
sure
s or
the
chan
ge in
Bet
a cr
iter
ion.
Item
des
crip
tion
IRT
PRO
lo
rdif
Mag
nitu
de (N
CD
IF)
Eff
ect S
ize
T1W
hite
vs.
B
lack
Whi
tevs
. H
isp.
Whi
te v
s.
NH
API
Whi
te v
s.
Bla
ck
Whi
tevs
. H
isp.
Whi
tevs
. N
HA
PI
Whi
tevs
. B
lack
Whi
tevs
. H
isp.
Whi
tevs
. N
HA
PI
Whi
tevs
. B
lack
Whi
tevs
. H
isp.
Whi
tevs
. N
HA
PI ;*
UN
U
*
U
l ufr ae f tl ef I
U*
0.00
280.
0028
0.
0018
0.
0277
-0
.024
8 -0
.033
1
I fel
t anx
ious
U
U
U
N
U;
U*
U*
NU
*;
U*
0.02
370.
0203
0.
0449
0.
1181
† 0.
1125
†0.
1805
†
I fel
t wor
ried
U
*
U*
N
U*;
U
*0.
0072
0.01
52
0.00
37
0.07
09
0.09
87
0.02
67
I fou
nd it
har
d to
focu
s on
anyt
hing
oth
er th
an m
y an
xiet
y U
U
U*
N
U*
0.00
600.
0182
0.
0021
-0
.061
9 -0
.104
9†0.
0315
I fel
t ner
vous
U
N
U*;
U
*0.
0014
0.00
09
0.00
17
-0.0
195
0.00
42
-0.0
257
I fel
t une
asy
N
U*;
U
*0.
0012
0.00
19
0.00
18
0.00
98
0.01
16
0.02
80
;*U
N
U esn et tl ef I
U*
0.00
200.
0058
0.
0009
0.
0140
0.
0638
0.
0201
My
wor
ries o
verw
helm
ed m
e
U
* U
* N
U;
U*;
NU
* 0.
0046
0.01
27
0.00
86
-0.0
516
-0.0
788
-0.0
689
I fel
t lik
e I n
eede
d he
lp fo
r my
anxi
ety
U*
U
U*
NU
*;
U*
0.00
480.
0077
0.
0008
-0
.051
3 -0
.049
8 0.
0037
Man
y si
tuat
ions
mad
e m
e w
orry
U
* U
*
NU
* 0.
0099
0.00
82
0.03
86
-0.0
776
-0.0
683
-0.1
791†
I had
diff
icul
ty c
alm
ing
dow
n
NU
*;
U*
0.00
030.
0029
0.
0003
0.
0076
-0
.031
9 -0
.001
1

Measurement equivalence of the PROMIS® Anxiety short forms 199
For education (Table 8), six items were consistently identified with DIF after Bonferroni correction using the Wald test and latent variable ordinal logistic regression tests (fearful, anxious, worried, hard to focus, uneasy, tense). Conditional on anxiety, those with less than high school education in contrast to those with a graduate degree evidenced a lower likelihood of an anxious response to the items: feeling fearful, anxious, worried, tense, uneasy, and difficulty focusing on anything. The item, anxious showed DIF of higher magnitude for the graduate school vs. no high school groups as did the item, many situa-tions made me worry for the graduate school vs. the groups with high school or no high school. However, the NCDIF was not above threshold and the impact of DIF on the scale was trivial (see Table 8 and Figure 1).
Figure 1: PROMIS anxiety short form item set: Expected scale and item scores for race/ethnicity
subgroups
PROMIS Anxiety Item SetScale Response Function
Based on IRTPRO EstimatesComparing Race/Ethnic Groups
0
10
20
30
40
50
-3.0 -2.5 -2.0 -1.5 -1.0 -0.5 0.0 0.5 1.0 1.5 2.0 2.5 3.0
Anxiety (Theta)
Exp
ecte
d S
cale
Sco
re
NHW
NHB
Hisp
NHAPI
Expected Item Score Function by Race/Ethnicity PROMIS Anxiety Item Set
Item 1: I felt fearful(For k = categories 0, 1, 2, 3, 4)
0.0
0.5
1.0
1.5
2.0
2.5
3.0
3.5
4.0
-3.0 -2.5 -2.0 -1.5 -1.0 -0.5 0.0 0.5 1.0 1.5 2.0 2.5 3.0
Anxiety (Theta)
Ex
pec
ted
Item
Sco
re
NHW
NHB
Hisp
NHAPI

J. A. Teresi, K. Ocepek-Welikson, M. Kleinman, M. Ramirez & G. Kim 200
Expected Item Score Function by Race/Ethnicity PROMIS Anxiety Item Set
Item 3: I felt worried (For k = categories 0, 1, 2, 3, 4)
0.0
0.5
1.0
1.5
2.0
2.5
3.0
3.5
4.0
-3.0 -2.5 -2.0 -1.5 -1.0 -0.5 0.0 0.5 1.0 1.5 2.0 2.5 3.0
Anxiety (Theta)
Exp
ecte
d I
tem
Sco
reNHW
NHB
Hisp
NHAPI
Expected Item Score Function by Race/Ethnicity PROMIS Anxiety Item Set
Item 8: My worries overwhelmed me (For k = categories 0, 1, 2, 3, 4)
0.0
0.5
1.0
1.5
2.0
2.5
3.0
3.5
4.0
-3.0 -2.5 -2.0 -1.5 -1.0 -0.5 0.0 0.5 1.0 1.5 2.0 2.5 3.0
Anxiety (Theta)
Ex
pec
ted
Item
Sco
re
NHW
NHB
Hisp
NHAPI
Expected Item Score Function by Race/Ethnicity PROMIS Anxiety Item Set
Item 9: I felt like I needed help for my anxiety (For k = categories 0, 1, 2, 3, 4)
0.0
0.5
1.0
1.5
2.0
2.5
3.0
3.5
4.0
-3.0 -2.5 -2.0 -1.5 -1.0 -0.5 0.0 0.5 1.0 1.5 2.0 2.5 3.0
Anxiety (Theta)
Exp
ecte
d I
tem
Sco
re
NHW
NHB
Hisp
NHAPI

Measurement equivalence of the PROMIS® Anxiety short forms 201
Figure 1: - cont. PROMIS anxiety short form item set: Expected scale and item scores for education subgroups
Expected Item Score Function by Race/Ethnicity PROMIS Anxiety Item Set
Item 10: Many situations made me worry (For k = categories 0, 1, 2, 3, 4)
0.0
0.5
1.0
1.5
2.0
2.5
3.0
3.5
4.0
-3.0 -2.5 -2.0 -1.5 -1.0 -0.5 0.0 0.5 1.0 1.5 2.0 2.5 3.0
Anxiety (Theta)
Exp
ecte
d I
tem
Sco
reNHW
NHB
Hisp
NHAPI
PROMIS Anxiety Item SetScale Response Function
Based on IRTPRO EstimatesComparing Education Groups
0
10
20
30
40
50
-3.0 -2.5 -2.0 -1.5 -1.0 -0.5 0.0 0.5 1.0 1.5 2.0 2.5 3.0
Anxiety (Theta)
Exp
ecte
d S
cale
Sco
re
Graduate
College
Some College
High School
< High School
Expected Item Score Function by Education Groups PROMIS III, Anxiety item set
Item 1: I felt fearful (For k = categories 0, 1, 2, 3, 4)
0.0
0.5
1.0
1.5
2.0
2.5
3.0
3.5
4.0
-3.0 -2.5 -2.0 -1.5 -1.0 -0.5 0.0 0.5 1.0 1.5 2.0 2.5 3.0
Anxiety (Theta)
Ex
pec
ted
Ite
m S
core
Graduate
College
Some College
High School
< High School

J. A. Teresi, K. Ocepek-Welikson, M. Kleinman, M. Ramirez & G. Kim 202
Expected Item Score Function by Education Groups PROMIS Anxiety Item Set
Item 2: I felt anxious (For k = categories 0, 1, 2, 3, 4)
0.0
0.5
1.0
1.5
2.0
2.5
3.0
3.5
4.0
-3.0 -2.5 -2.0 -1.5 -1.0 -0.5 0.0 0.5 1.0 1.5 2.0 2.5 3.0
Anxiety (Theta)
Exp
ecte
d I
tem
Sco
re
Graduate
College
Some College
High School
< High School
Expected Item Score Function by Education Groups PROMIS III, Anxiety Item Set
Item 3: I felt worried (For k = categories 0, 1, 2, 3, 4)
0.0
0.5
1.0
1.5
2.0
2.5
3.0
3.5
4.0
-3.0 -2.5 -2.0 -1.5 -1.0 -0.5 0.0 0.5 1.0 1.5 2.0 2.5 3.0
Anxiety (Theta)
Exp
ecte
d I
tem
Sco
re
Graduate
College
Some College
High School
< High School
Expected Item Score Function by Education Groups PROMIS Anxiety Item Set
Item 4: I found it hard to focus on anything other than my anxiety (For k = categories 0, 1, 2, 3, 4)
0.0
0.5
1.0
1.5
2.0
2.5
3.0
3.5
4.0
-3.0 -2.5 -2.0 -1.5 -1.0 -0.5 0.0 0.5 1.0 1.5 2.0 2.5 3.0
Anxiety (Theta)
Exp
ecte
d It
em S
core
Graduate
College
Some College
High School
< High School

Measurement equivalence of the PROMIS® Anxiety short forms 203
Figure 1: - cont. PROMIS anxiety short form item set: Expected scale and item scores for education subgroups
Figure 1: - cont. PROMIS anxiety short form item set: Expected scale and item scores for age subgroups
Expected Item Score Function by Education Groups PROMIS Anxiety Item Set
Item 6: I felt uneasy (For k = categories 0, 1, 2, 3, 4)
0.0
0.5
1.0
1.5
2.0
2.5
3.0
3.5
4.0
-3.0 -2.5 -2.0 -1.5 -1.0 -0.5 0.0 0.5 1.0 1.5 2.0 2.5 3.0
Anxiety (Theta)
Exp
ect
ed I
tem
Sco
re
Graduate
College
Some College
High School
< High School
Expected Item Score Function by Education Groups PROMIS Anxiety Item Set
Item 7: I felt tense (For k = categories 0, 1, 2, 3, 4)
0.0
0.5
1.0
1.5
2.0
2.5
3.0
3.5
4.0
-3.0 -2.5 -2.0 -1.5 -1.0 -0.5 0.0 0.5 1.0 1.5 2.0 2.5 3.0
Anxiety (Theta)
Ex
pec
ted
Ite
m S
co
re
Graduate
College
Some College
High School
< High School
PROMIS Anxiety Item SetScale Response Function
Based on IRTPRO EstimatesComparing Age Groups
0
10
20
30
40
50
-3.0 -2.5 -2.0 -1.5 -1.0 -0.5 0.0 0.5 1.0 1.5 2.0 2.5 3.0
Anxiety (Theta)
Exp
ecte
d S
cale
Sco
re
Age 21-49
Age 50-64
Age 65-84
J. A. Teresi, K. Ocepek-Welikson, M. Kleinman, M. Ramirez & G. Kim 204
Expected Item Score Function by Age PROMIS Anxiety Item Set
Item 1: I felt fearful (For k = categories 0, 1, 2, 3, 4)
0.0
0.5
1.0
1.5
2.0
2.5
3.0
3.5
4.0
-3.0 -2.5 -2.0 -1.5 -1.0 -0.5 0.0 0.5 1.0 1.5 2.0 2.5 3.0
Anxiety (Theta)
Exp
ecte
d I
tem
Sco
re
Age 21-49
Age 50-64
Age 65-84
Expected Item Score Function by Age PROMIS Anxiety Item Set
Item 2: I felt anxious (For k = categories 0, 1, 2, 3, 4)
0.0
0.5
1.0
1.5
2.0
2.5
3.0
3.5
4.0
-3.0 -2.5 -2.0 -1.5 -1.0 -0.5 0.0 0.5 1.0 1.5 2.0 2.5 3.0
Anxiety (Theta)
Ex
pec
ted
Item
Sco
re
Age 21-49
Age 50-64
Age 65-84
Expected Item Score Function by Age PROMIS Anxiety Item Set
Item 3: I felt worried (For k = categories 0, 1, 2, 3, 4)
0.0
0.5
1.0
1.5
2.0
2.5
3.0
3.5
4.0
-3.0 -2.5 -2.0 -1.5 -1.0 -0.5 0.0 0.5 1.0 1.5 2.0 2.5 3.0
Anxiety (Theta)
Exp
ecte
d I
tem
Sco
re
Age 21-49
Age 50-64
Age 65-84

Measurement equivalence of the PROMIS® Anxiety short forms 205
Expected Item Score Function by Age PROMIS Anxiety Item Set
Item 6: I felt uneasy (For k = categories 0, 1, 2, 3, 4)
0.0
0.5
1.0
1.5
2.0
2.5
3.0
3.5
4.0
-3.0 -2.5 -2.0 -1.5 -1.0 -0.5 0.0 0.5 1.0 1.5 2.0 2.5 3.0
Anxiety (Theta)
Ex
pec
ted
Item
Sco
re
Age 21-49
Age 50-64
Age 65-84
Expected Item Score Function by Age PROMIS Anxiety Item Set
Item 7: I felt tense (For k = categories 0, 1, 2, 3, 4)
0.0
0.5
1.0
1.5
2.0
2.5
3.0
3.5
4.0
-3.0 -2.5 -2.0 -1.5 -1.0 -0.5 0.0 0.5 1.0 1.5 2.0 2.5 3.0
Anxiety (Theta)
Exp
ecte
d I
tem
Sco
re
Age 21-49
Age 50-64
Age 65-84
Expected Item Score Function by Age PROMIS Anxiety Item Set
Item 11: I had difficulty calming down (For k = categories 0, 1, 2, 3, 4)
0.0
0.5
1.0
1.5
2.0
2.5
3.0
3.5
4.0
-3.0 -2.5 -2.0 -1.5 -1.0 -0.5 0.0 0.5 1.0 1.5 2.0 2.5 3.0
Anxiety (Theta)
Exp
ecte
d I
tem
Sco
re
Age 21-49
Age 50-64
Age 65-84

J. A. Teresi, K. Ocepek-Welikson, M. Kleinman, M. Ramirez & G. Kim 206
Figure 1: - cont. PROMIS anxiety short form item set: Expected scale and item scores for
gender subgroups
PROMIS Anxiety Item SetScale Response Function
Based on IRTPRO EstimatesComparing Gender Groups
0
10
20
30
40
50
-3.0 -2.5 -2.0 -1.5 -1.0 -0.5 0.0 0.5 1.0 1.5 2.0 2.5 3.0
Anxiety (Theta)
Exp
ecte
d S
cale
Sco
re
Females
Males
Expected Item Score Function by Gender PROMIS Anxiety Item Set
Item 11: I had difficulty calming down (For k = categories 0, 1, 2, 3, 4)
0.0
0.5
1.0
1.5
2.0
2.5
3.0
3.5
4.0
-3.0 -2.5 -2.0 -1.5 -1.0 -0.5 0.0 0.5 1.0 1.5 2.0 2.5 3.0
Anxiety (Theta)
Exp
ect
ed
Ite
m S
core
Females
Males

Measurement equivalence of the PROMIS® Anxiety short forms 207
Expected scale and item scores for interview language for Hispanic subgroups
PROMIS Anxiety Item SetScale Response Function
Based on IRTPRO EstimatesBy the Interview Language for Hispanics
0
10
20
30
40
50
-3.0 -2.5 -2.0 -1.5 -1.0 -0.5 0.0 0.5 1.0 1.5 2.0 2.5 3.0
Anxiety (Theta)
Ex
pec
ted
Sc
ale
Sc
ore
English Interview
Spanish Interview
Expected Item Score Function by the Interview Language for Hispanics PROMIS Anxiety Item Set
Item 1: I felt fearful (For k = categories 0, 1, 2, 3, 4)
0.0
0.5
1.0
1.5
2.0
2.5
3.0
3.5
4.0
-3.0 -2.5 -2.0 -1.5 -1.0 -0.5 0.0 0.5 1.0 1.5 2.0 2.5 3.0
Anxiety (Theta)
Ex
pec
ted
Ite
m S
core
English Interview
Spanish Interview
Expected Item Score Function by the Interview Language for Hispanics PROMIS Anxiety Item Set
Item 10: Many situations made me worry (For k = categories 0, 1, 2, 3, 4)
0.0
0.5
1.0
1.5
2.0
2.5
3.0
3.5
4.0
-3.0 -2.5 -2.0 -1.5 -1.0 -0.5 0.0 0.5 1.0 1.5 2.0 2.5 3.0
Anxiety (Theta)
Ex
pe
cte
d I
tem
Sc
ore
English Interview
Spanish Interview

J. A. Teresi, K. Ocepek-Welikson, M. Kleinman, M. Ramirez & G. Kim 208T
able
8:
PR
OM
IS a
nxie
ty s
hort
for
m it
em s
et: D
iffe
rent
ial i
tem
fun
ctio
n (D
IF)
resu
lts:
Edu
cati
on s
ubgr
oup
com
pari
sons
All
NC
DIF
val
ues
wer
e sm
alle
r th
an th
e th
resh
old
(0.0
960)
† I
ndic
ates
val
ue a
bove
thre
shol
d of
0.1
0; b
olde
d va
lues
are
abo
ve 0
.15.
*A
ster
isks
indi
cate
sig
nifi
canc
e af
ter
adju
stm
ent f
or m
ulti
ple
com
pari
sons
. N
U=
Non
-uni
form
DIF
invo
lvin
g th
e di
scri
min
atio
n pa
ram
eter
s; U
=U
nifo
rm D
IF in
volv
ing
the
loca
tion
par
amet
ers.
G
D =
gra
duat
e de
gree
; CD
= c
olle
ge d
egre
e; C
oll.
= c
olle
ge; H
S =
hig
h sc
hool
F
or th
e lo
rdif
ana
lyse
s, th
e U
nifo
rm a
nd n
on-u
nifo
rm D
IF w
as d
eter
min
ed u
sing
the
like
liho
od r
atio
chi
-squ
are
test
. Uni
form
DIF
is o
btai
ned
by c
ompa
ring
the
log
like
liho
od v
alue
s fr
om m
odel
s on
e an
d tw
o. N
on-u
nifo
rm D
IF i
s ob
tain
ed b
y co
mpa
ring
the
log
lik
elih
ood
valu
es f
rom
mod
els
two
and
thre
e. D
IF w
as n
ot
dete
cted
usi
ng th
e ps
eudo
R2
mea
sure
s or
the
chan
ge in
Bet
a cr
iter
ion.
Item
des
crip
tion
IRTP
RO
lo
rdif
Mag
nitu
de (N
CD
IF)
Effe
ct S
ize T
1G
D vs.
CD
GD vs.
Som
e C
oll.
GD vs.
HS
GD vs.
No
HS
GD vs.
CD
GD vs.
Som
e C
oll.
GD vs.
HS
GD vs.
No
HS
GD vs.
CD
GD
vs.
Som
e C
oll.
GD vs.
HS
GD vs.
No
HS
GD vs.
CD
GD
vs.
Som
e C
oll.
GD vs.
HS
GD vs.
No
HS
I fel
t fea
rful
N
U;
U*
U
* 0.
0004
0.
0026
0.
0063
0.
0142
-0
.007
9 0.
0307
0.
0605
0.
0982
I fel
t anx
ious
U
U
* U
* N
U*;
U
*U
*
U*
U*
0.00
60
0.01
99
0.03
52
0.09
05
0.05
14
0.09
98
0.14
23†
0.24
68†
I fel
t wor
ried
N
U
U*
NU
*;
U*
U
* 0.
0000
0.
0020
0.
0037
0.
0100
-0
.000
5 0.
0066
0.
0439
0.
0790
I fou
nd it
har
d to
fo
cus o
n an
ythi
ng
othe
r tha
n m
y an
xiet
y
N
U;
U*
U*
NU
; U
*0.
0028
0.
0029
0.
0156
0.
0164
-0
.035
3 -0
.032
0-0
.097
9 -0
.084
7
I fel
t ner
vous
NU
U
* U
* 0.
0006
0.
0003
0.
0031
0.
0172
-0
.003
8 -0
.006
8-0
.033
6 -0
.115
9†I f
elt u
neas
y
U
U
*
NU
; U
*0.
0009
0.
0035
0.
0039
0.
0035
0.
0155
0.
0401
0.
0338
0.
0219
I fel
t ten
se
U
U
* U
* U
U
* 0.
0023
0.
0063
0.
0117
0.
0110
0.
0356
0.
0587
0.
0821
0.
0864
M
y w
orrie
s ov
erw
helm
ed m
e
N
U;
U*
NU
;U
*0.
0024
0.
0028
0.
0127
0.
0173
-0
.033
8 -0
.039
9-0
.086
3 -0
.105
2†
I fel
t lik
e I n
eede
d he
lp fo
r my
anxi
ety
NU
N
U
NU
NU
U
* 0.
0077
0.
0066
0.
0175
0.
0054
0.
0132
0.
0359
0.
0471
0.
0290
Man
y sit
uatio
ns
mad
e m
e w
orry
NU
; U
U
U
* U
* 0.
0068
0.
0141
0.
0370
0.
0354
-0
.051
4 -0
.096
6-0
.160
5†-0
.159
0†
I had
diff
icul
ty
calm
ing
dow
n
U
* N
U;
U*
0.00
27
0.00
38
0.01
05
0.02
00
-0.0
310
-0.0
227
-0.0
660
-0.1
141†

Measurement equivalence of the PROMIS® Anxiety short forms 209
One item, “I had difficulty calming down,” showed gender DIF with the Wald test after Bonferroni correction, and five showed consistent age DIF (fearful, anxious, worried, tense, and difficulty calming down). Conditional on anxiety, females were less likely to admit to difficulty calming down; males had a higher propensity to endorse the item. Conditional on anxiety, older respondents were less likely to express feelings of fearful-ness, anxiety, and feeling worried and tense. However, they were more likely to admit to difficulty calming down than the youngest (reference) group.
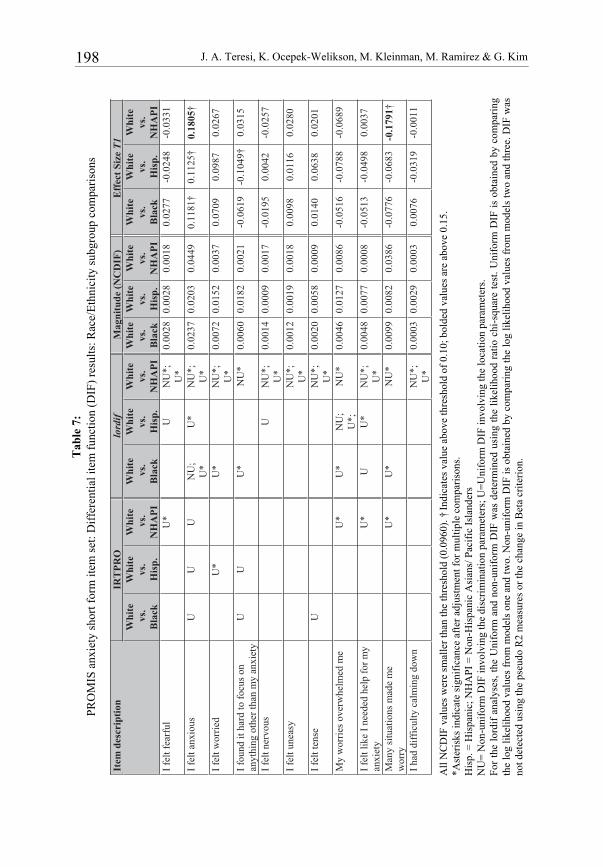
No items showed high magnitude DIF for gender. Two items showed slightly higher magnitude of DIF for age: fearful and worried; however, the NCDIF magnitude measure was not above threshold. The scale level impact was trivial (see Table 9 and Figure 1).
Only one item showed DIF with the Wald test after the Bonferroni correction for the Spanish vs. English language comparisons: “I felt fearful” (see Table 10). Two addition-al items were flagged by lordif after Bonferroni correction, anxious and many situations made me worry. The latter item also showed DIF of higher magnitude, with an NCDIF value (0.144) above threshold.
Sensitivity analyses
Because a small number of anchors were selected for the majority of the comparisons, sensitivity DIF analyses were performed with four anchor items for the race/ethnicity and education demographic groups. These results were compared to those with two anchor items. The DIF results changed somewhat for race/ethnicity with the inclusion of the following additional two items as anchors: “I felt uneasy” and “I felt I needed help for my anxiety.” For these comparisons, the following items then showed DIF after the Bonferroni correction: “I felt anxious” for Hispanics and non-Hispanic Asians/Pacific Islanders; “I felt worried” for non-Hispanic Asians/Pacific Islanders; and “Many situa-tions made me worry” for Hispanics compared to the earlier results showing significant DIF only before the correction. For the education groups, the additional anchor items were: “I felt tense” and “I felt I needed help for my anxiety.” Changes in DIF results were observed for the following items: “I felt anxious” showed less DIF for the group with some college and “Many situations made me worry” showed more DIF for high school graduates and the group with less than high school education. Because DIF in the anchor set and lack of purification can result in type I error (false DIF detection), it can-not be said with certainty if the results of these sensitivity analyses have identified addi-tional items with DIF or are artifacts of potential DIF in the anchor set.
Because local dependencies can result in over-identification of DIF, sensitivity analyses were performed by removing the item, “I felt uneasy” which evidenced the highest LD values with the item, “I felt nervous” for the Black (33.5) and low education – no high school (36.6) subgroups and with the item, “I felt tense” for the Black (32.1) and low education (25.8) subgroups. The results of the DIF analyses after item removal varied only slightly in terms of the parameter estimates for the education subgroups except for the discrimination - a parameter estimates and their standard errors for the items, “I felt nervous” and “I felt tense” which decreased. The discrimination parameter estimates for

J. A. Teresi, K. Ocepek-Welikson, M. Kleinman, M. Ramirez & G. Kim 210
Tab
le 9
: P
RO
MIS
anx
iety
sho
rt f
orm
item
set
: Dif
fere
ntia
l ite
m f
unct
ion
(DIF
) re
sult
s. G
ende
r an
d ag
e su
bgro
up c
ompa
riso
ns
All
non
-com
pens
ator
y di
ffer
enti
al it
em f
unct
ioni
ng (
NC
DIF
) va
lues
wer
e sm
alle
r th
an th
e th
resh
old
(0.0
960)
† In
dica
tes
valu
e ab
ove
thre
shol
d of
0.1
0; b
olde
dva
lues
are
abo
ve 0
.15.
*A
ster
isks
ind
icat
e si
gnif
ican
ce a
fter
adj
ustm
ent
for
mul
tipl
e co
mpa
riso
ns. N
U=
Non
-uni
form
DIF
inv
olvi
ng t
he d
iscr
imin
atio
n pa
ram
eter
s; U
=U
nifo
rm D
IFin
volv
ing
the
loca
tion
par
amet
ers.
F
or t
he l
ordi
f an
alys
es,
the
Uni
form
and
non
-uni
form
DIF
was
det
erm
ined
usi
ng t
he l
ikel
ihoo
d ra
tio
chi-
squa
re t
est.
Uni
form
DIF
is
obta
ined
by
com
pari
ngth
e lo
g li
keli
hood
val
ues
from
mod
els
one
and
two.
Non
-uni
form
DIF
is o
btai
ned
by c
ompa
ring
the
log
like
liho
od v
alue
s fr
om m
odel
s tw
o an
d th
ree.
DIF
was
no
t det
ecte
d us
ing
the
pseu
do R
2 m
easu
res
or th
e ch
ange
in B
eta
crit
erio
n.
Item
des
crip
tion
IRT
PRO
Lo
rdif
Mag
nitu
de (N
CD
IF)
Eff
ect S
ize
T1G
ende
rA
geG
ende
rA
geG
ende
rA
geG
ende
rA
ge21
-49
vs.
50-6
4
21-4
9 vs
. 65
-84
21-4
9 vs
. 50
-64
21-4
9 vs
. 65
-84
21-4
9 vs
. 50
-64
21-4
9 vs
. 65
-84
21-4
9 vs
. 50
-64
21-4
9 vs
. 65
-84
;*U
N *
U
UN
lu fr ae f tl ef IU
*N
U;
U*
U*
NU
*;
U*
0.00
87
0.01
12
0.02
13
0.07
70
0.09
29
0.12
19† 9660.0
3370.0 8440.0
9600.0 9700.0
0400.0 *
U *
U *
U *
U *
U
su oi xna t le f I †5711.0
9180.0 3740.0
8710.0 1800.0
0300.0 *
U *
U *
U *
U *
U
dei rr ow t le f I I f
ound
it h
ard
to fo
cus o
n an
ythi
ng
othe
r tha
n m
y an
xiet
y N
U
U*
U
U*
0.00
68
0.00
52
0.00
72
-0.0
564
-0.0
547
-0.0
604
;*U
N
suov ren tlef IU
*
NU
; U
*0.
0001
0.
0010
0.
0044
0.
0007
-0
.017
9 -0
.048
4
;U
N
U
ysa enu t lef IU
U*
U
* 0.
0049
0.
0052
0.
0092
-0
.046
4 -0
.042
3 -0
.062
9
;*U
N
es net t lef IU
*N
U*;
U*
NU
;U
*U
U
* 0.
0016
0.
0017
0.
0024
0.
0213
0.
0260
0.
0244
My
wor
ries o
verw
helm
ed m
e
U
U
*
U*
0.00
11
0.00
07
0.00
08
0.01
87
0.02
10
0.02
04
I fel
t lik
e I n
eede
d he
lp fo
r my
anxi
ety
U
* U
U
* 0.
0017
0.
0062
0.
0038
-0
.028
2 -0
.057
7 -0
.040
4
Man
y si
tuat
ions
mad
e m
e w
orry
NU
N
U
U*
U
* 0.
0006
0.
0014
0.
0020
0.
0108
-0
.022
3 -0
.028
8 I h
ad d
iffic
ulty
cal
min
g do
wn
U*
U*
U
NU
U
* U
* 0.
0126
0.
0122
0.
0182
-0
.081
0 -0
.080
9 -0
.099
1

Measurement equivalence of the PROMIS® Anxiety short forms 211
Table 10: PROMIS anxiety short form item set: Differential item function (DIF) results. Language
subgroup comparison, English vs. Spanish for Hispanics only (n = 703; n = 335)
Item description IRTPRO lordif Magnitude(NCDIF)
Effect Size T1
I felt fearful U* U 0.0260 -0.1357†
I felt anxious U* 0.0493 0.1980†
I felt worried NU; U
0.0026 -0.0433
I found it hard to focus on anything other than my anxiety
U 0.0063 0.0497
I felt nervous U 0.0110 -0.0844
I felt uneasy 0.0050 -0.0577
I felt tense 0.0062 0.0244
My worries overwhelmed me U 0.0089 0.0621
I felt like I needed help for my anxiety
0.0059 0.0595
Many situations made me worry U NU*; U*
0.1440 -0.3508†
I had difficulty calming down U U 0.0285 -0.1328†
Item 10 has the non-compensatory differential item functioning (NCDIF) value larger than the threshold (0.0960). † Indicates value above threshold of 0.10; bolded values are above 0.15. *Asterisks indicate significance after adjustment for multiple comparisons. NU= Non-uniform DIF involving the discrimination parameters; U=Uniform DIF involving the location parameters. For the lordif analyses, the Uniform and non-uniform DIF was determined using the likelihood ratio chi-square test. Uniform DIF is obtained by comparing the log likelihood values from models one and two. Non-uniform DIF is obtained by comparing the log likelihood values from models two and three. DIF was not detected using the pseudo R2 measures or the change in Beta criterion.
the same two items for all race/ethnicity groups decreased; however, the a parameter standard errors for all items increased. For the non-Hispanic Asians/Pacific Islanders all a parameters increased; however, the model fit statistic RMSEA decreased from 0.03 to 0.02 indicating a slightly better fit. The DIF results were similar for education group comparisons after removing the items with high LD values and applying the Bonferroni correction. The exceptions were for the item, “I found it hard to focus on anything other than my anxiety,” which became non-significant for the group with no high school, compared to the reference group after Bonferroni adjustment, and the item, “I need help for my anxiety” which then evidenced non-uniform DIF for the high school graduates vs. the group of graduate degree holders. For the race/ethnic group comparisons, the item, “I felt anxious” then showed uniform DIF after the Bonferroni adjustment for all compari-

J. A. Teresi, K. Ocepek-Welikson, M. Kleinman, M. Ramirez & G. Kim 212
sons. For the language comparison, one more item showed non-uniform DIF after the Bonferroni adjustment: “I felt worried.” There was no change in DIF designation for the age and gender comparisons.
Aggregate impact
There was no aggregate impact for most of the comparisons. However, there appears to be small aggregate impact for Spanish vs. English speakers in the Hispanic group. For example, at theta level 1.0 where the difference of the scale response functions is the largest, the estimated sum score for the respondents interviewed in English is 24 and for those interviewed in Spanish, 25. (See Figure 1.)
Individual impact
The individual impact for both the education and race/ethnicity subgroups was small. The correlations of the two theta estimates were 1.0 for both subgroup comparisons. All the absolute values of the changes were less than 0.5 standard deviations, the theta values were slightly higher after the DIF adjustment for 78 % of respondents. Using an arbitrary cutoff point of theta ≥ 1.0 to classify respondents as anxious 136 (2.5 % of total) re-spondents changed to the classification of anxious in the education comparison analysis and 45 (< 1.0 % of total) in the race/ethnic group comparison. Some differences were observed across subgroups. For example, the designation change was observed for 2.6 % (23/901) Asians/Pacific Islanders, 2.0 % (22/1,117) non-Hispanic Blacks, 5.6 % (54/965) respondents with less than a high school education, 2.3 % (41/1,752) with some college, 2.1 % (22/1,050) with a high school diploma and 1.9 % (19/985) with a college degree. As stated above, the absolute value of these threshold changes in theta estimates were small (< 0.5 standard deviations).
Information
The item-level information functions were examined for the total sample (see Appendix, Figure 2). As shown, the item estimated to be most informative was “I felt uneasy” with the peak information = 7.75 at theta level 0. The two items with the next highest peak information estimates were: “I felt nervous” (information = 6.31 at theta = 0) and “I found it hard to focus on anything other than my anxiety” (information = 5.94 at theta = 0.8). The least informative items were: “I felt fearful” (information = 2.94 at theta = 0.4) and “Many situations made me worry” (information = 3.75 at theta = 1.2). These two items also evidenced DIF for some subgroup comparisons. Shown in Figure 2 is the scale-level information function for the total sample. Peak information was provided in the middle and upper (anxiety) tail of the theta distribution ranging from theta = 0 to 2.0.

Measurement equivalence of the PROMIS® Anxiety short forms 213
Figure 2:
PROMIS anxiety short form item set: Test information function (IRTPRO; Total sample)
Discussion
As with depression, while DIF was evidenced for many PROMIS short form items, few of the findings were of high magnitude, and all were of low impact at the scale level. Examined across all groups the hypotheses were that conditional on anxiety, women, younger adults, and racial/ethnic minorities (i.e., Latino/Hispanic and Black people) would report more feelings of being anxious, fearful, and nervous than their counterparts. Women, Latino/Hispanic, Black people and Spanish speakers were posited to express greater worry and feelings of being tense. In comparison to the respective reference groups, women, older people and Black and Latino/Hispanic people were posited to express greater feelings of being overwhelmed, conditional on anxiety.
Conditional on anxiety, it was hypothesized that women would report being more fear-ful, anxious, worried, nervous, tense, overwhelmed and need more help for anxiety. Contrary to the hypotheses, the findings were of very little DIF by gender group, and one item found to evidence DIF, “I had difficulty calming down,” was not one of the items hypothesized to show DIF. Moreover, the magnitude of DIF was very small.
The item, anxious evidenced elevated magnitude of DIF for the highest vs. the lowest level of education; however, no consistent hypotheses were generated with respect to education. Younger people were posited to be more fearful, anxious, nervous and older people were posited to feel more overwhelmed than younger people. Consistent with previous research (Choi et al., 2011), this hypothesis was confirmed for the items fearful and anxious. Conditional on anxiety, older respondents (aged 65 to 84) were less likely
PROMIS Anxiety Short Form Item SetTest Information Function with 95% Confidence Interval
0
10
20
30
40
50
60
-2.8 -2.4 -2.0 -1.6 -1.2 -0.8 -0.4 0.0 0.4 0.8 1.2 1.6 2.0 2.4 2.8
Anxiety (Theta)
Tes
t In
form
atio
n

J. A. Teresi, K. Ocepek-Welikson, M. Kleinman, M. Ramirez & G. Kim 214
to express feelings of fearfulness and anxiety than younger age cohorts. Conditional on anxiety, the youngest age group in contrast to the oldest was more likely to express feel-ings of worry, and this item evidenced slightly higher magnitude of DIF; however, this item was not hypothesized to evidence DIF.
Previous research examining DIF for general anxiety measures showed some substantial differences in measures of worry and social anxiety between racial/ethnic minorities and non-minorities (Hambrick et al., 2010). These authors specifically suggested that the use of these measures in African American and Asian American populations may lead to biased conclusions. In the current study, minority group members (particularly Latinos and Blacks) were posited, conditional on anxiety, to express more feelings of fear, anxie-ty, worry, and states of tension, nervousness and being overwhelmed, conditional on anxiety. As hypothesized, Hispanics evidenced a significantly higher probability of re-sponding in the anxious direction to the item, worried. Although not specifically hypoth-esized for this group, but rather for minority groups in general, as hypothesized, condi-tional on anxiety, Asians/Pacific Islanders (as contrasted with non-Hispanic Whites) evidenced a higher probability of responding in the anxious direction to the items: fear-ful, that many situations made them worry, and that worries overwhelmed them. Asians/Pacific Islanders were significantly less likely to report needing help for anxiety. Only the item, “Many situations made me worry,” showed DIF of higher magnitude (just above threshold) for Asians/Pacific Islanders vs. Whites. However, the magnitude of DIF was small and the NCDIF statistic was not significant or large. One item, anxious evi-denced significant DIF for the IRTOLR method and with the Wald test in sensitivity analyses. This item was hypothesized to show DIF for Japanese; however no direction was given. Larger magnitude of DIF was also observed for this item. The scale level impact of DIF was negligible.
Spanish speakers were posited to express more feelings of being worried, tense, and in need of help for anxiety; significant, consistent DIF was observed after adjustment for multiple comparisons for the latter item. The items, worried and tense evidenced signifi-cant DIF only for the IRTOLR method. However, the findings were not consistent with the hypotheses, and these items did not evidence an elevated magnitude of DIF. Spanish speakers were more likely to express feelings of being fearful, anxious and worried in many situations. The latter item might be singled out for further study because the mag-nitude of NCDIF was above threshold. Moreover, this item showed consistent DIF of higher magnitude for Asians/Pacific Islanders in contrast to the reference group. Addi-tionally, the item, anxious evidenced an elevated T1 magnitude measure for Spanish speakers and for all ethnic group comparisons.
The item, worried might also be singled out for more study, given that there was a con-firmatory hypothesis regarding this item for Hispanics, who were hypothesized to ex-press feeling worried, for reasons unrelated to anxiety, and DIF was observed for this item.
In general, more DIF was observed for Asians/Pacific Islanders; albeit of low magnitude. Although not hypothesized to show DIF for Asians/Pacific Islanders, every item evi-denced DIF by at least one method (IRTOLR). Consistent DIF was observed for several

Measurement equivalence of the PROMIS® Anxiety short forms 215
items for this group in contrast to the reference group: fearful, anxious, worries were overwhelming, needed help for anxiety, many situations made me nervous. The item, anxious was also hypothesized to show DIF for Blacks and Hispanics and was observed to show DIF with both methods (although not with the Wald test after corrections for multiple comparisons). This item was observed to have slightly elevated DIF magnitude for Asians/Pacific Islanders, although it was not hypothesized to show DIF for this group. The item, anxious also evidenced higher magnitude of DIF for two of the educa-tion comparisons and might also be studied further. In general more research with the Asians/Pacific Islanders group is needed, and several items might be singled out for further study or when used in clinical practice among ethnically diverse groups: anxious, worried, and worried in many situations.
Limitations
Two evidence-based methods for DIF detection were used in these analyses; however, congruency between the methods although generally high was sometimes less than desir-able. More DIF was detected using IRTOLR; however, the methods were in agreement with the findings of low magnitude and impact of DIF. Second, a potential limitation is that the sample was of cancer patients; thus it is not possible to know how well findings may generalize to other groups. Third, although the effect of language was examined, only Spanish and English speaking Hispanics were available in large enough numbers for DIF analyses. Given the diversity of different racial/ethnic and language groups in terms of culture, other language options such as Chinese, Korean, and Vietnamese should be considered for future investigation. Finally, the analyses did not examine DIF across different Asian and Hispanic subgroups due to the small sample sizes of these subgroups. Although census definitions were used to classify self-reported race/ethnicity, it is acknowledged that such monolithic classifications may mask cultural and other differences. Moreover the manner in which race and ethnicity is being self-reported is changing, with many individuals reluctant to identify with a specific group. Finally it has been recommended that race be deconstructed and measured using variables such as educational quality and acculturation (Manly, 2006). Nonetheless, it has been concluded that although race is a complex social construct, the definition of which is evolving, data on race and ethnicity should continue to be collected and included in policy research (National Research Council, 2004). Given that previous studies reported sub-ethnic group differences among Asians and Latinos/Hispanics (Kim et al., 2010); it may be important to test for potential measurement bias across these different subgroups.
Conclusion
Despite these limitations, the results provide evidence of little DIF of high magnitude in the PROMIS Anxiety short form across ethnically diverse groups. Moreover, reliability estimates were high across methods and groups, although precision estimates were lower at the lower tail of the theta distribution. It is concluded that the findings support the general usefulness and applicability of the PROMIS Anxiety short form measure among

J. A. Teresi, K. Ocepek-Welikson, M. Kleinman, M. Ramirez & G. Kim 216
patients from diverse backgrounds. Despite the minimal impact of DIF observed in the PROMIS Anxiety measure, researchers and clinicians should recognize the potential risk of response bias among patients from diverse backgrounds when their anxiety is evaluat-ed. In particular, the items, anxious, worried, and worried in many situations might be singled out for more study. This is one of the first studies of PROMIS short forms among a large sample of ethnically diverse groups. Overall, the findings regarding the perfor-mance of the PROMIS anxiety items in diverse samples were encouraging.
Acknowledgements
Partial funding for these analyses was provided by the National Institute of Arthritis & Musculoskeletal & Skin Diseases, U01AR057971 (PI: M. Potosky), by the National Institute on Aging, 1P30AG028741-01A2 (PI: A. Siu), by the National Institute on Ag-ing, K01AG045342 (PI: G. Kim), and by the NIA Resource Centers for Minority Aging Research, 5P30AG031054-09 (PI: K. Burgio and M. Fouad). The authors thank Stepha-nie Silver, MPH for editorial assistance in the preparation of this manuscript.
References
Asparouhov, T., & Muthén, B. (2009). Exploratory structural equation modeling. Structural Equation Modeling, 16, 397-438. doi:10.1080/10705510903008204
Bentler, P. M. (1990). Comparative fit indexes in structural models. Psychological Bulletin, 107(2), 238-246. doi: 10.1037/0033-2909.107.2.238
Bonferroni, C. E. (1936). Teoria statistica delle classi e calcolo delle probabilità. Pubblicazio-ni del R Istituto Superiore di Scienze Economiche e Commerciali di Firenze, 8, 3-62.
Cai, L., Thissen, D., & du Toit, S. H. C. (2011). IRTPRO: Flexible, multidimensional, multi-ple categorical IRT Modeling [Computer software]. Chicago, IL: Scientific Software In-ternational, Inc.
Cameron, I. M., Scott, N. W., Adler, M., & Reid, I. C. (2014). A comparison of three methods of assessing differential item functioning (DIF) in the Hospital Anxiety Depression Scale: Ordinal logistic regression, Rasch analysis and the Mantel chi-square procedure. Quality of Life Research, 23, 2883-2888. doi: 10.1007/s11136-014-0719-3
Cella, D., Riley, W., Stone, A., Rothrock, N., Reeve, B., Yount, S., & Hays, R. (2010). The Patient-Reported Outcomes Measurement Information System (PROMIS) developed and tested its first wave of adult self-reported health outcome item banks: 2005–2008. Journal of Clinical Epidemiology, 63(11), 1179-1194. doi: 10.1016/j.jclinepi.2010.04.011
Chen, W. H., & Thissen, D. (1997). Local dependence indexes for item pairs using item re-sponse theory. Journal of Educational and Behavioral Statistics, 22, 265-289. doi: 10.3102/10769986022003265
Choi, S. W., Gibbons, L. E., & Crane, P. K. (2011). lordif: An R package for detecting differ-ential item functioning using iterative hybrid ordinal logistic regression / item response

Measurement equivalence of the PROMIS® Anxiety short forms 217
theory and Monte Carlo simulations. Journal of Statistical Software, 39, 1-30. doi: 10.18637/jss.v039.i08
Choi, S. W., Reise, S. P., Pilkonis, P. A., Hays, R. D., & Cella, D. (2010). Efficiency of static and computer adaptive short forms compared to full-length measures of depressive symp-toms. Quality of Life Research, 19, 125-136. doi: 10.1007/s11136-009-9560-5
Forjaz, M. J., Martinez-Martin, P., Dujardin, K., Marsh, L., Richard, I. H., Starkstein, S. E., & Leentjens, A. F. (2013). Rasch analysis of anxiety scales in Parkinson's disease. Journal of Psychosomatic Research, 74(5), 414-419. doi: 10.1016/j.jpsychores.2013.02.009.
Forjaz, M. J., Rodrigues-Blázquez, C., & Martinez-Martin, P. for the Longitudinal Parkin-son’s Disease Patient Study Group (2009). Rasch analysis of the hospital anxiety and de-pression scale in Parkinson’s Disease. Movement Disorders, 15, 526-532. doi: 10.1002/mds.22409
Gadermann, A. M., Guhn, M., & Zumbo, B. D. (2012). Estimating ordinal reliability of Lik-ert-type and ordinal response data: A conceptual, empirical and practical guide. Practical Assessment, Research and Evaluation, 17, 1-13.
Gibbons, C. J., Mills, R. J., Thornton, E. W., Ealing, J., Mitchell, J. D., Shaw, P. J., & Young, C. A. (2011). Rasch analysis of the Hospital Anxiety and Depression scale (HADS) for use in motor neurone disease. Health Quality of Life Outcomes, 9, 82. doi: 10.1186/1477-7525-9-82
Guillén-Riqueime, A., & Buela-Casal, G. (2011). Psychometric revision and differential item functioning in the State Trait Anxiety Inventory (STAI). Psichothema, 23, 510-515.
Hambrick, J. P., Rodebaugh, T. L., Balsis, S., Woods, C. M., Mendez, J. L., & Heimberg, R. G. (2010). Cross-ethnic measurement equivalence of measures of depression, social anxi-ety, and worry. Assessment, 17(2), 155-171. doi: 10.1177/1073191109350158
Jensen, R. E., Moinpour, C. M., Keegan, T. H. M., Cress, R. D., Wu, X.-C., Paddock, L. A., & Potosky, A. L. (2016). The Measuring Your Health Study: leveraging community-based cancer registry recruitment to establish a large, diverse cohort of cancer survivors. Psychological Test and Assessment Modeling.
Kim, G., Chiriboga, D. A., Jang, Y., Lee, S., Huang, C. H., & Parmelee, P. (2010). Health status of older Asian Americans in California. Journal of the American Geriatrics Society, 58(10), 2003-2008. doi: 10.1111/j.1532-5415.2010.03034.x
Kleinman, M., & Teresi, J. A. (2016). Differential item functioning magnitude and impact measures from item response theory models. Psychological Test and Assessment Model-ing, 58.
Lambert, S., Pallant, J. F., & Girgis, A. (2011). Rasch analysis of the Hospital Anxiety and Depression scale among caregivers of cancer survivors: Implications for its use in psycho-oncology. Psychooncology, 20, 919-925. doi: 10.1002/pon.1803
Lord, F. M. (1980). Applications of item response theory to practical testing problems. Hills-dale, NJ: Lawrence Erlbaum.
Manly, J. J. (2006). Deconstructing race and ethnicity: implications for measurement of health outcomes. Medical Care, 44, Suppl. 3, S10-S16. doi: 10.1097/01.mlr.0000245427. 22788.be

J. A. Teresi, K. Ocepek-Welikson, M. Kleinman, M. Ramirez & G. Kim 218
McDonald, R. P. (1999). Test theory: a unified treatment. Mahwah, NJ: L. Erlbaum Associ-ates.
Müller, R., Cieza, A., & Geyh, S. (2012). Rasch analysis of the Hospital Anxiety and Depres-sion scale in spinal cord injury. Rehabilitation Psychology, 57, 214-223. doi: 10.1037/ a0029287
Muthén, L. K. & Muthén, B. O. (1998-2011). MPlus User’s Guide. Sixth Edition. Los Ange-les, CA: Muthén & Muthén.
National Research Council. (2004). Measuring racial discrimination. Panel on methods for assessing discrimination. Committee on National Statistics, Division of Behavioral and Social Sciences and Education. Washington DC: The National Academies Press.
Osborne, R. H., Elsworth, G. R., Sprangers, M. A. G., Oort, F. J., & Hopper, J. L. (2004). The value of the Hospital Anxiety and Depression Scale (HADS) for comparing women with early onset breast cancer with population-based reference women. Quality of Life Re-search, 13, 191-206. doi: 10.1023/B:QURE.0000015292.56268.e7
Pallant, J. F., & Tennant, A. (2007). An introduction to the Rasch measurement model: An example using the Hospital Anxiety and Depression Scale (HADS). British Journal of Clinical Psychology, 46, 1-18. doi: 10.1348/014466506X96931
Pilkonis, P. A., Choi, S. W., Reise, S. P., Stover, A. M., Riley, W. T., & Cella, D. (2011). Item banks for measuring emotional distress from the patient-reported outcomes meas-urement information system (PROMIS): depression, anxiety and anger. Assessment, 18, 263-283. doi: 10.1177/1073191111411667
Raju, N. S., Fortmann-Johnson, K. A., Kim, W., Morris, S. B., Nering, M., L., & Oshima, T.C. (2009). The item parameter replication method for detecting differential functioning in the DFIT framework. Applied Measurement in Education, 33, 133-147. doi: 10.1177/0146621608319514
Raju, N. S., van der Linden, W. J., & Fleer, P. F. (1995). IRT-based internal measures of differential functioning of items and tests. Applied Psychological Measurement, 19, 353-368.doi: 10.1177/014662169501900405.
R Core Team (2013). R: A language and environment for statistical computing. R Foundation for Statistical Computing, Vienna, Austria. URL http://www.R-project.org/.
Revelle, W. (2015). Psych: package Psych. Retrieved from http://cran.r-project.org/package= psych
Rizopoulus, D. (2009). ltm: Latent Trait Models under IRT. http://cran.r-project.org/web/ packages/ltm/index.html.
Samejima, F. (1969). Estimation of latent ability using a response pattern of graded scores. Psychometrika Monograph Supplement, 34, 100-114. doi: 10.1007/BF02290599
Schmid, L., & Leiman, J. (1957). The development of hierarchical factor solutions. Psycho-metrika, 22, 53-61. doi: 10.1007/BF02289209
Spielberger, C. D., Gorsuch, R. L., Lushene, R., Vagg, P. R., & Jacobs, G. A. (1983). Manual for the State-Trait Anxiety Inventory. Palo Alto, CA: Consulting Psychologists Press.
Measurement equivalence of the PROMIS® Anxiety short forms 219
Tang, W. K., Wong, E., Shiu, H. F., Lum, C. M., & Ungvari, G. S. (2008). Examining item bias in the anxiety subscale of the Hospital Anxiety and Depression Scale in patients with chronic obstructive pulmonary disease. International Journal of Methods in Psychiatric Research, 17, 104-110. doi: 10.1002/mpr.234
Teresi, J. A., Ramirez, M., Lai, J. -S., & Silver, S. (2008). Occurrences and sources of differ-ential item functioning (DIF) in patient-reported outcome measures: description of DIF methods, and review of measures of depression, quality of life and general health. Psy-chology Science Quarterly, 50, 538-612.
Wainer, H. (1993). Model-based standardization measurement of an item's differential impact. In P. W. Holland & H. Wainer (Eds.). Differential Item Functioning (pp. 123-135). Hills-dale NJ: Lawrence Erlbaum, Inc.
Walter, O. B., Becker, J., Bjorner, J. B., Fliege, H., Klapp, B. F., & Rose, M. (2007). Devel-opment and evaluation of a computer adaptive test for ‘Anxiety’ (Anxiety-CAT). Quality of Life Research, 16, 143-155. doi: 10.1007/s11136-007-9191-7
Zigmond, A. S., & Snaith, R. P. (1983). The Hospital Anxiety and Depression Scale. Acta Psychiarica Scandinavica, 67, 361-370. doi: 10.1111/j.1600-0447.1983.tb09716.x
Zumbo, B. D., Gadermann, A. M., & Zeisser, C. (2007). Ordinal versions of coefficient alpha and theta for Likert rating scales. Journal of Modern Applied Statistical Methods, 6, 21-29. Available at: http://digitalcommons.wayne.edu/jmasm/vol6/iss1/4