measurement issues in commissioning and benchmarking … · measurement issues in commissioning and...
TRANSCRIPT

Measurement Issues in Commissioning and Benchmarking of Monte Carlo Treatment
Planning Systems
Jan SeuntjensMcGill University
Montreal, Canada, H3G [email protected]
AAPM Summer School, 2006 1
Outline
• Dosimetric accuracy requirements in treatment planning
• Measurement dosimetry fundamentals• Measurement issues in commissioning• Measurement issues in verification• Conclusions
AAPM Summer School, 2006 2
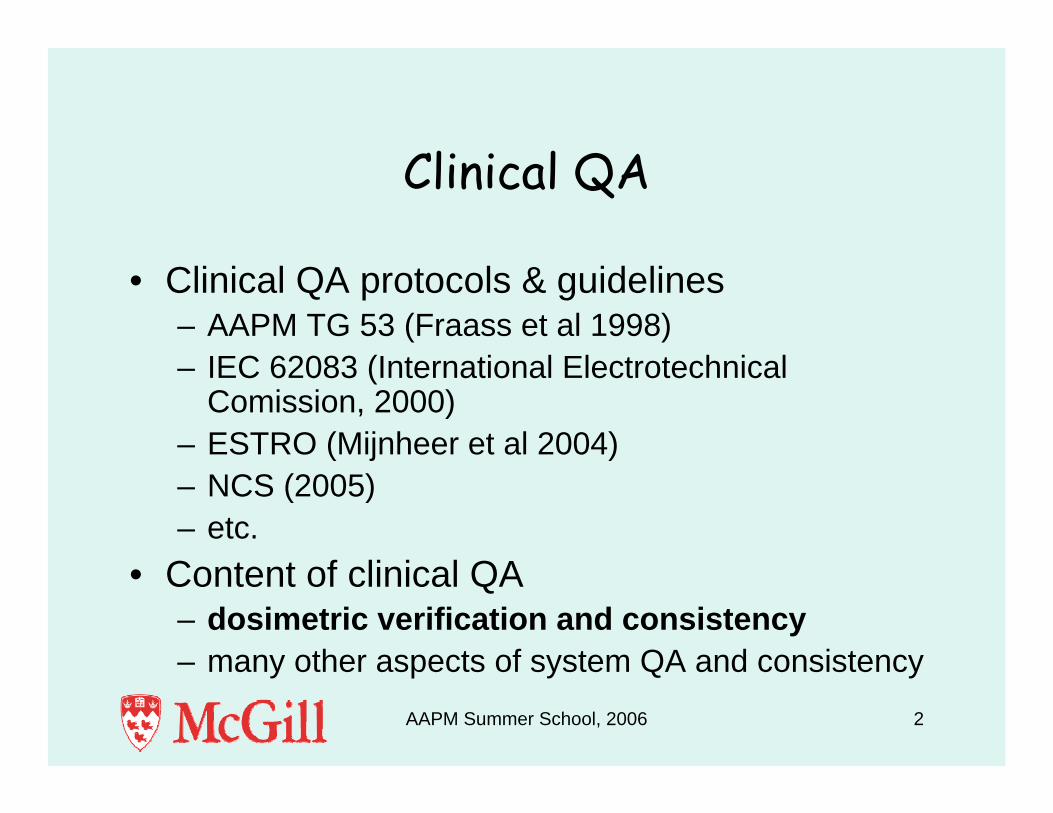
Clinical QA
• Clinical QA protocols & guidelines– AAPM TG 53 (Fraass et al 1998)– IEC 62083 (International Electrotechnical
Comission, 2000)– ESTRO (Mijnheer et al 2004)– NCS (2005)– etc.
• Content of clinical QA– dosimetric verification and consistency– many other aspects of system QA and consistency
AAPM Summer School, 2006 3
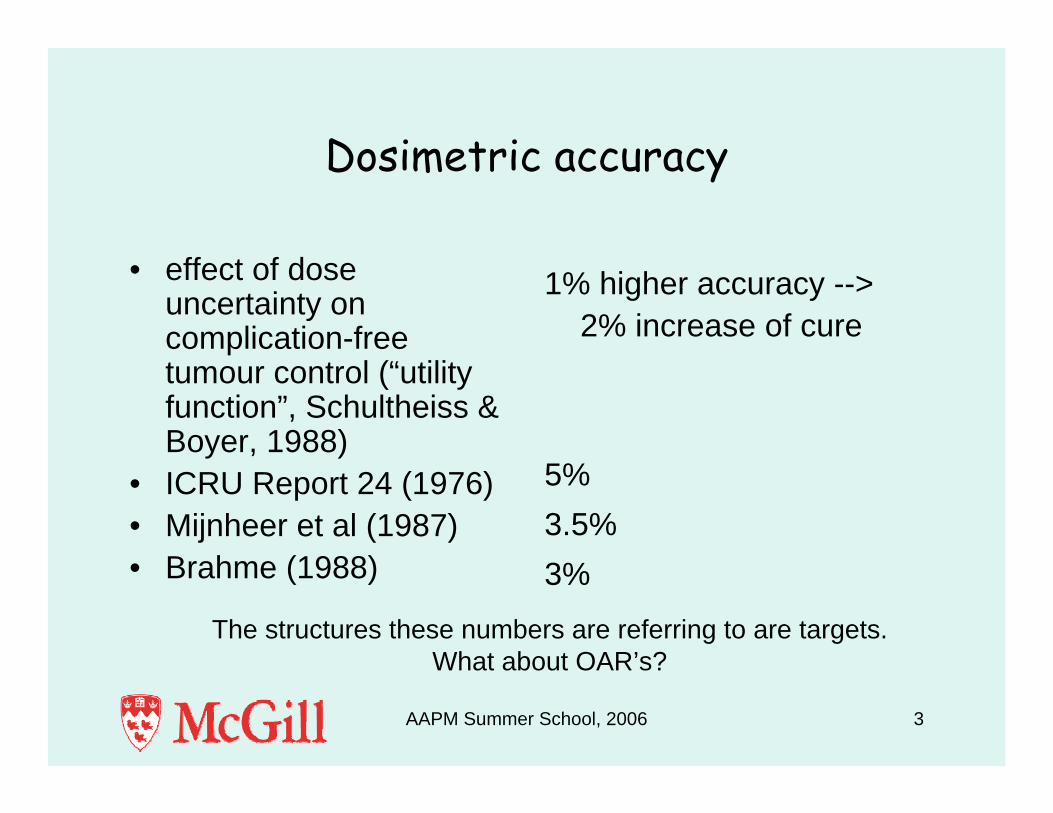
Dosimetric accuracy
• effect of dose uncertainty on complication-free tumour control (“utility function”, Schultheiss & Boyer, 1988)
• ICRU Report 24 (1976)• Mijnheer et al (1987)• Brahme (1988)
1% higher accuracy --> 2% increase of cure
5%3.5%3%
The structures these numbers are referring to are targets.What about OAR’s?
AAPM Summer School, 2006 4
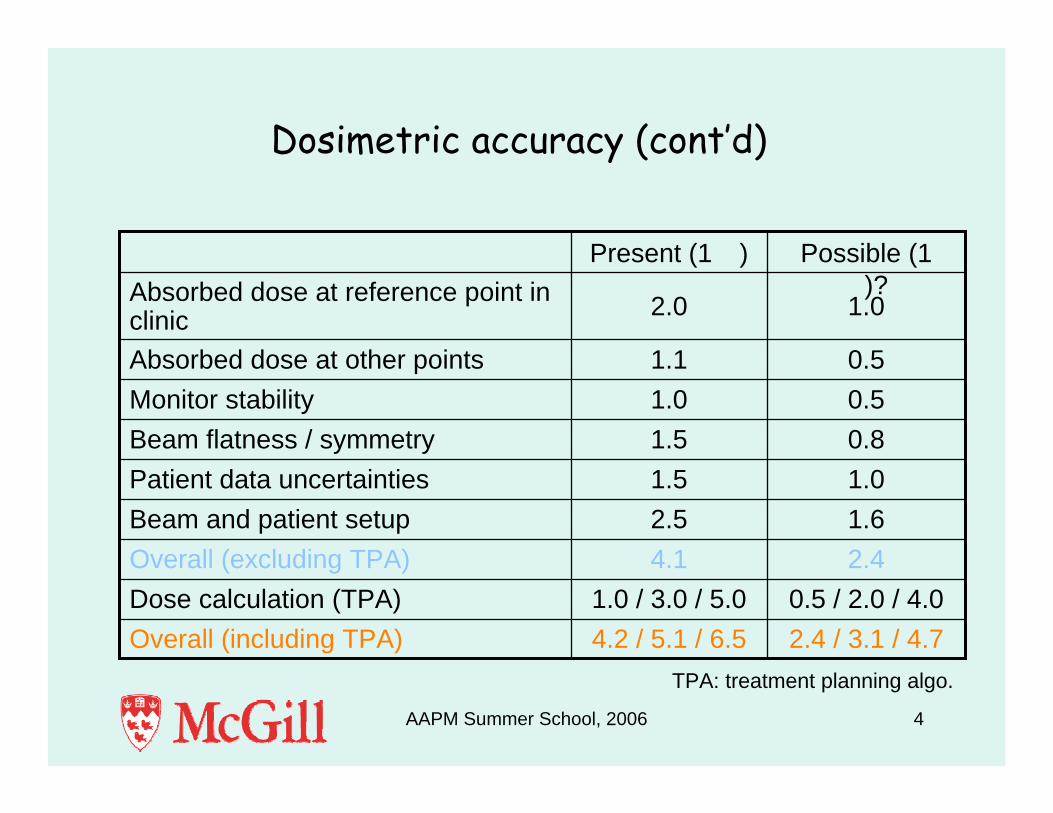
Dosimetric accuracy (cont’d)
0.5 / 2.0 / 4.01.0 / 3.0 / 5.0Dose calculation (TPA)2.4 / 3.1 / 4.74.2 / 5.1 / 6.5Overall (including TPA)
2.44.1Overall (excluding TPA)1.62.5Beam and patient setup1.01.5Patient data uncertainties0.81.5Beam flatness / symmetry0.51.0Monitor stability0.51.1Absorbed dose at other points
1.02.0Absorbed dose at reference point in clinic
Possible (1 �)?
Present (1 �)
TPA: treatment planning algo.
AAPM Summer School, 2006 5
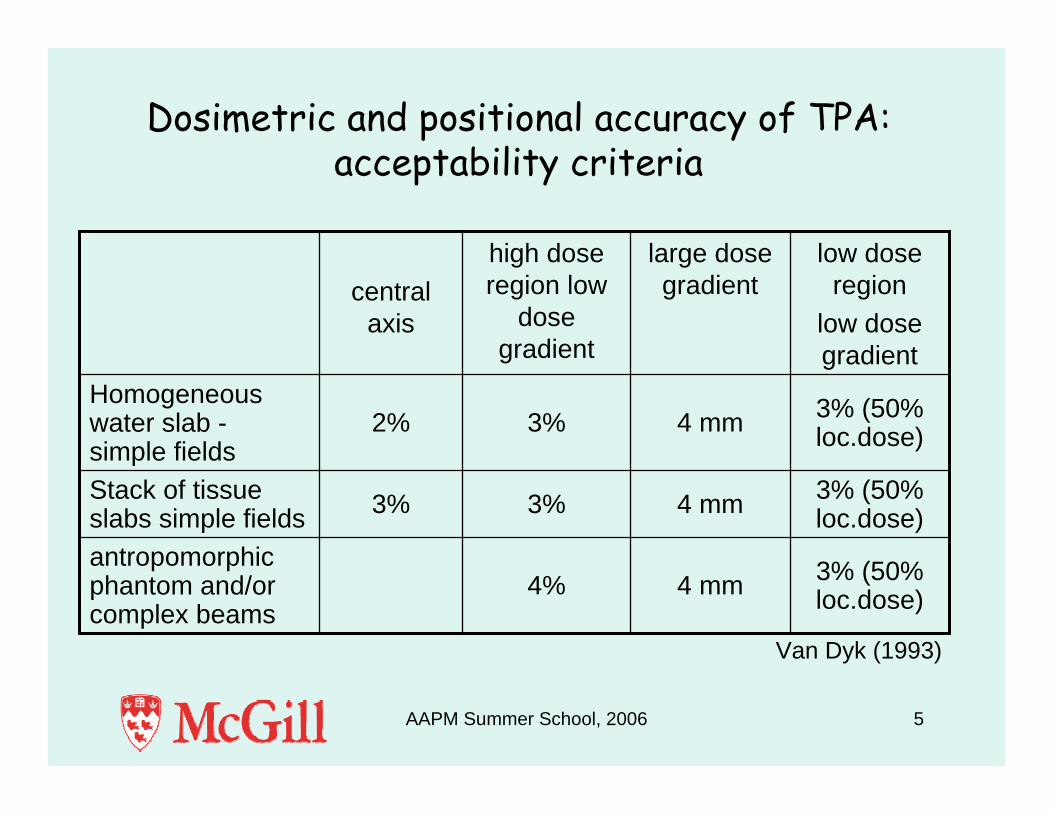
Dosimetric and positional accuracy of TPA: acceptability criteria
4 mm
4 mm
4 mm
large dose gradient
4%
3%
3%
high dose region low
dose gradient
3% (50% loc.dose)
antropomorphic phantom and/or complex beams
3% (50% loc.dose)3%Stack of tissue
slabs simple fields
3% (50% loc.dose)2%
Homogeneous water slab -simple fields
low dose region
low dose gradient
central axis
Van Dyk (1993)
AAPM Summer School, 2006 6
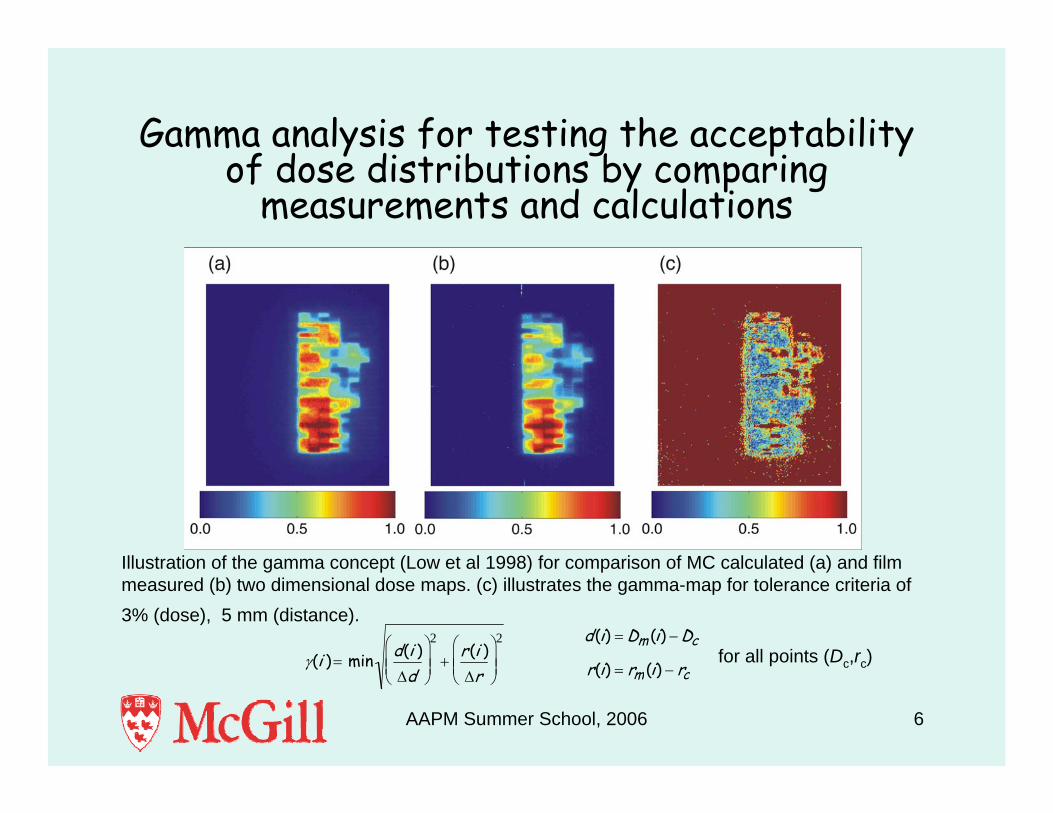
Gamma analysis for testing the acceptability of dose distributions by comparing
measurements and calculations
Illustration of the gamma concept (Low et al 1998) for comparison of MC calculated (a) and film measured (b) two dimensional dose maps. (c) illustrates the gamma-map for tolerance criteria of 3% (dose), 5 mm (distance).
γ(i )= min d(i )
Δd
⎛
⎝ ⎜ ⎜
⎞
⎠ ⎟ ⎟
2
+r(i )Δr
⎛
⎝ ⎜ ⎜
⎞
⎠ ⎟ ⎟
2 d(i) = Dm (i) − Dc
r(i) = rm (i) − rcfor all points (Dc,rc)

Clinical measurement dosimetry
AAPM Summer School, 2006 8
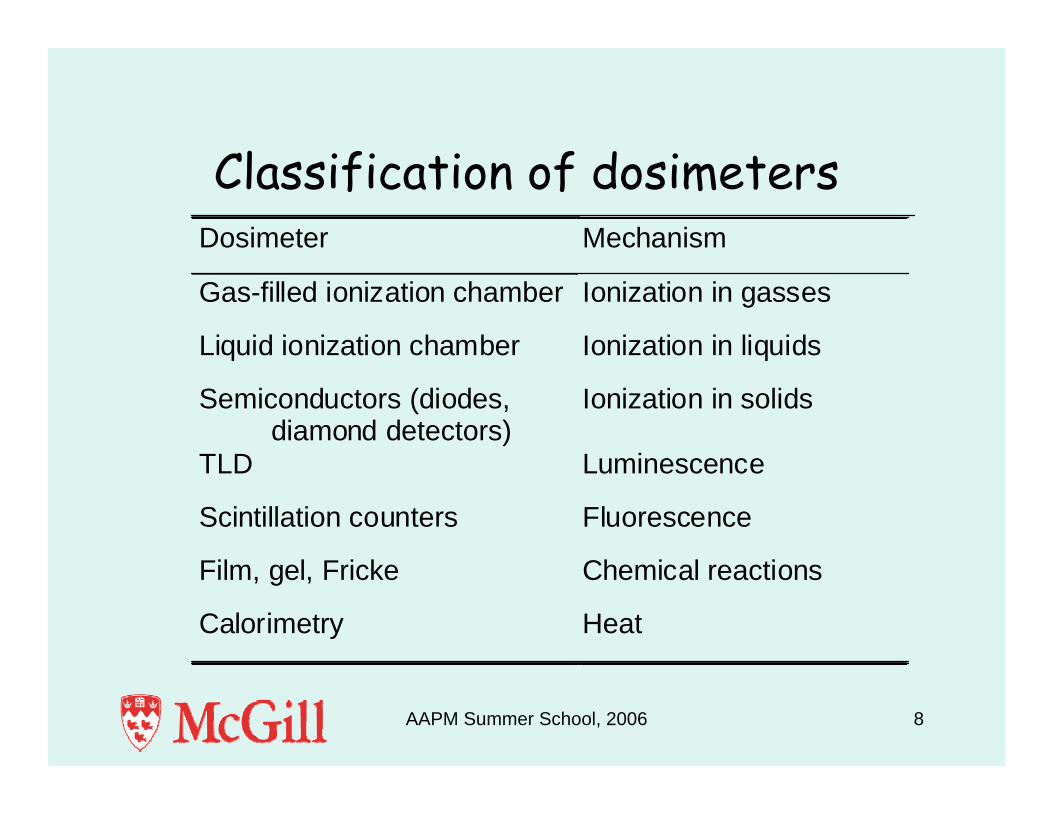
Classification of dosimetersDosimeter Mechanism
Gas-filled ionization chamber Ionization in gasses
Liquid ionization chamber Ionization in liquids
Semiconductors (diodes, diamond detectors)
Ionization in solids
TLD Luminescence
Scintillation counters Fluorescence
Film, gel, Fricke Chemical reactions
Calorimetry Heat
AAPM Summer School, 2006 9
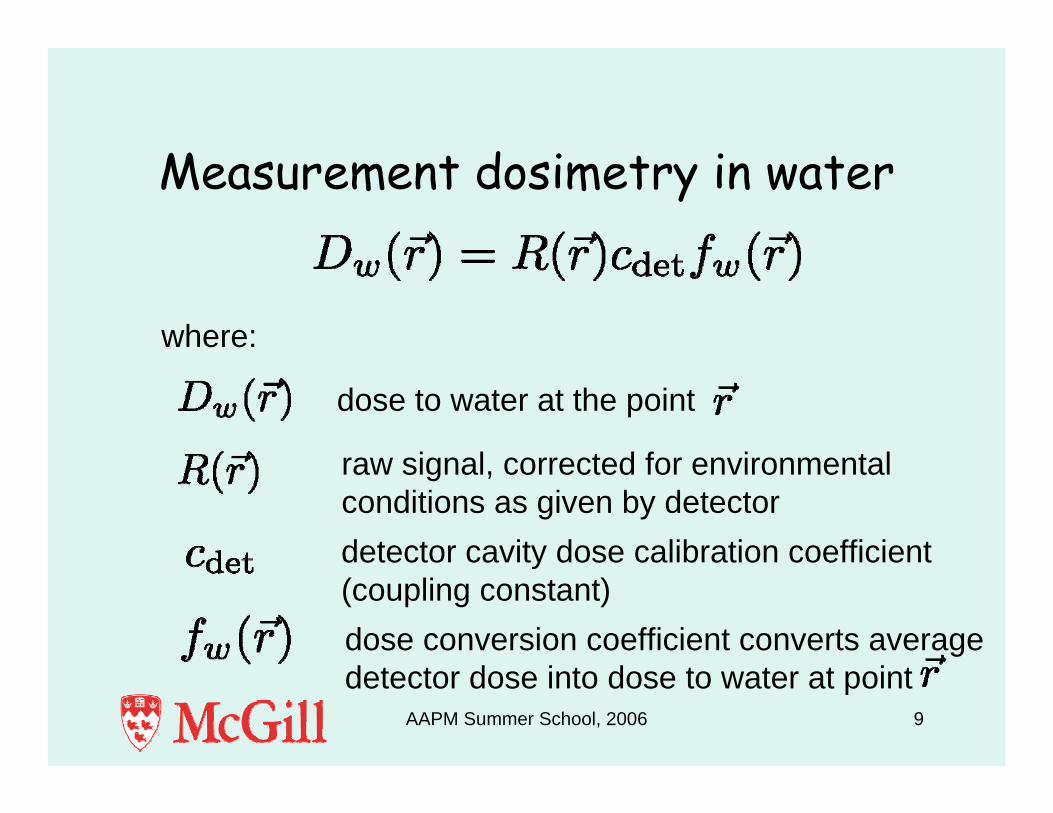
Measurement dosimetry in water
where:
dose to water at the point
raw signal, corrected for environmentalconditions as given by detectordetector cavity dose calibration coefficient(coupling constant) dose conversion coefficient converts averagedetector dose into dose to water at point
AAPM Summer School, 2006 10
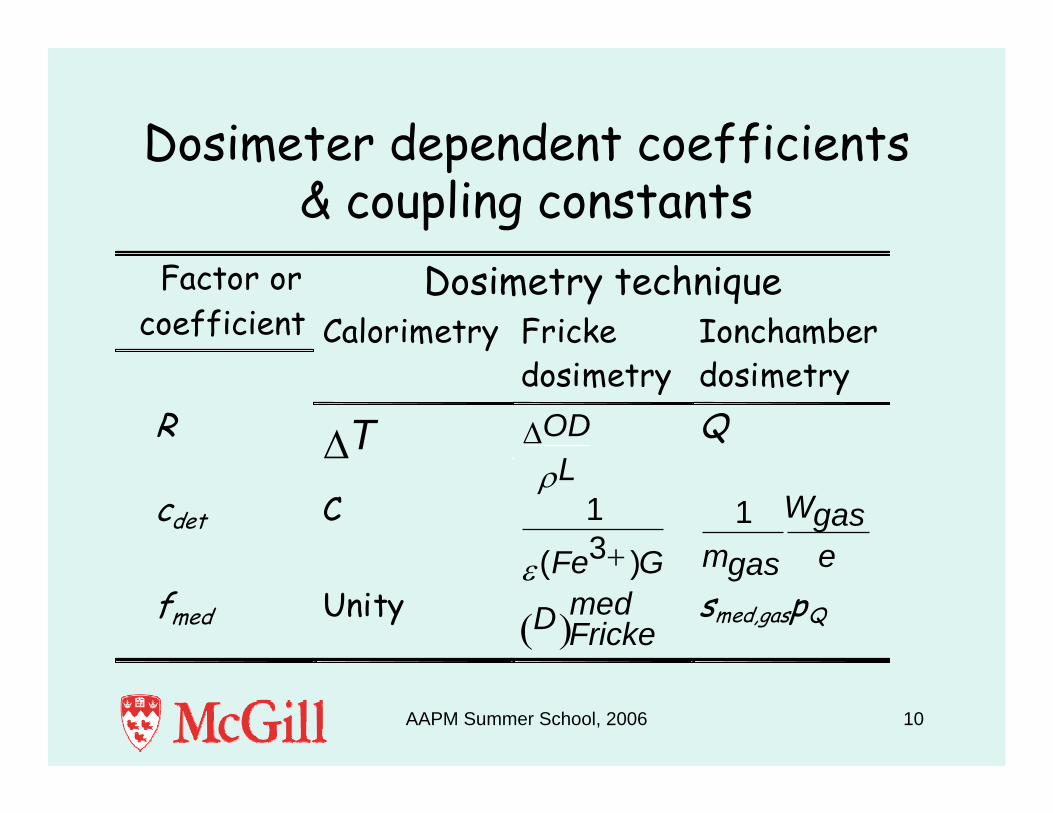
Dosimeter dependent coefficients & coupling constants
Factor orcoefficient
Dosimetry techniqueCalorimetry Fricke
dosimetryIonchamberdosimetry
R TΔ ODLρ
Δ Q
cdet C 13( )Fe Gε +
1 Wgasm egas
fmed Unity( )
medD Frickesmed,gaspQ
AAPM Summer School, 2006 11
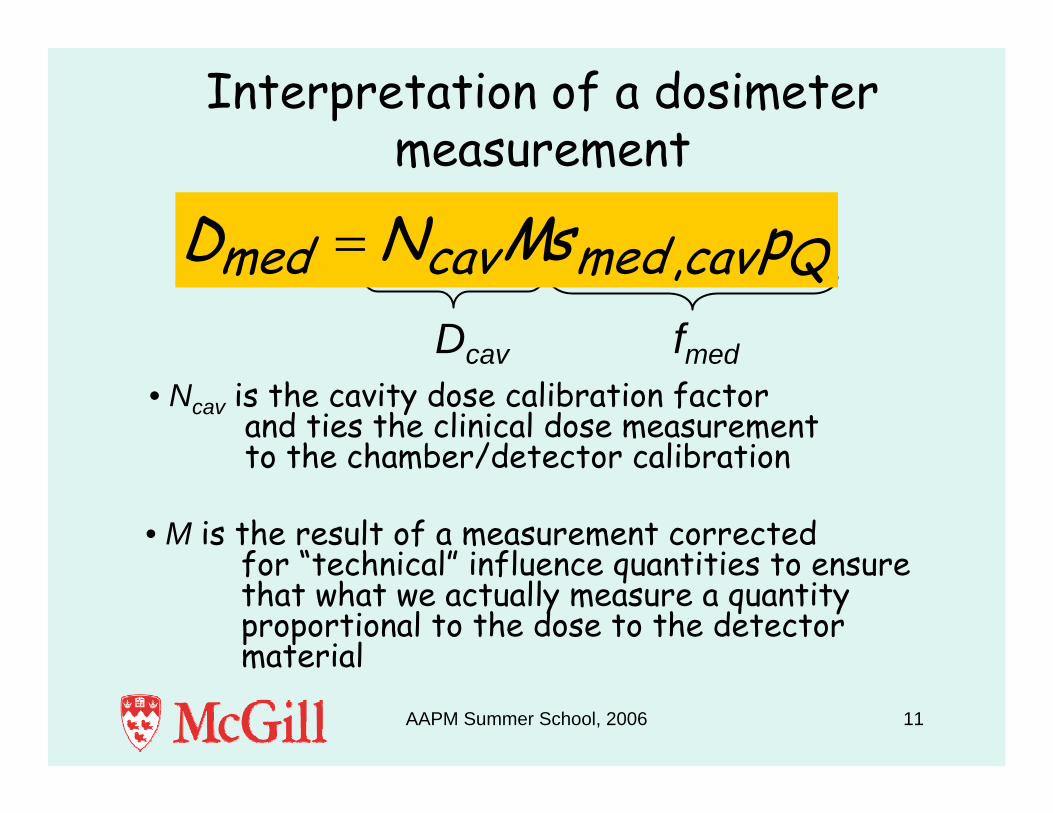
Interpretation of a dosimeter measurement
Dcav• Ncav is the cavity dose calibration factor
and ties the clinical dose measurement to the chamber/detector calibration
• M is the result of a measurement corrected for “technical” influence quantities to ensure that what we actually measure a quantity proportional to the dose to the detector material
fmed
Dmed = NcavMsmed,cavpQ
AAPM Summer School, 2006 12
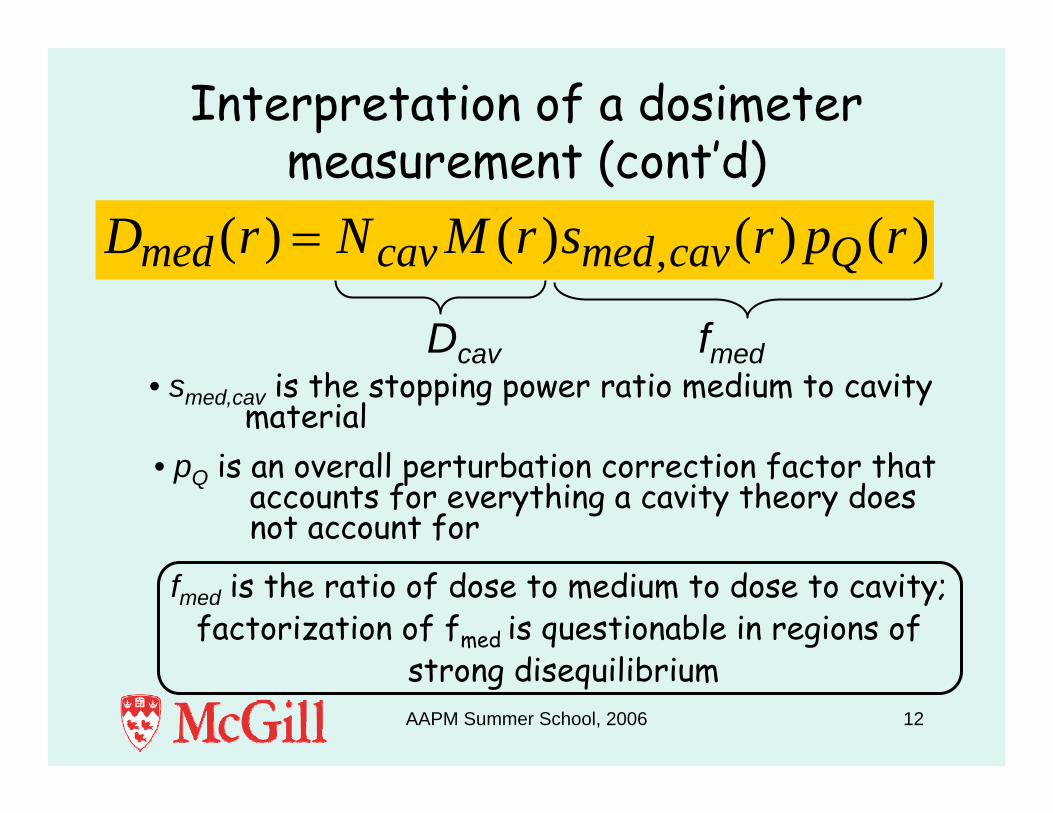
Interpretation of a dosimeter measurement (cont’d)
Dcav• smed,cav is the stopping power ratio medium to cavity
material• pQ is an overall perturbation correction factor that
accounts for everything a cavity theory does not account for
fmed
fmed is the ratio of dose to medium to dose to cavity; factorization of fmed is questionable in regions of
strong disequilibrium
Dmed (r) = Ncav M (r)smed,cav(r ) pQ(r )
AAPM Summer School, 2006 13
Practical complications• The outlined interpretation depends on our
ability to convert cavity dose to medium dose– CPE or TCPE and detector is small compared to the
range of secondary electrons:• fmed can be factorized in a stopping power ratio +
correction factors– If these conditions are not fulfilled:
• Monte Carlo calculations (within the constraints of the algorithm and basic cross-section datasets)
AAPM Summer School, 2006 14
Why is this important for commissioning and accuracy verification of TPS?
For the measurement of a dose distribution:• In regions of CPE and TCPE: SPR corrections
accurately represent detector response (and are small for air-filled chambers in photon beams)
• In regions of non-CPE: SPR corrections DO NOT accurately reflect changes in detector response and additional, sometimes large, corrections are needed– build-up regions in any field, interface-proximal points in
heterogeneous phantoms (build-up and build-down)– narrow fields– modulated fields
AAPM Summer School, 2006 15
Stopping power ratios (SPR’s)
• SPR’s are depth, field size, and radiation quality dependent– for reference dosimetry using ionization
chambers: values based on Monte Carlo calculations and well documented
– for relative dosimetry in TCPE: their variation relative to the reference point needs to be established

Andreo and Brahme, PMB, 31, 839 (1986)
sw,air(z) for plane parallel bremsstrahlung spectra
10 MV
20 MV
30 MV
60Co
AAPM Summer School, 2006 17
Perturbation correction factors: traditional factorization for ionization
chambers:
• Pwall: wall perturbation • Pgr: gradient effect due to displacement
of phantom material by cavity• Pfl: fluence perturbation• Pcel: central electrode perturbation
PQ = Pwall PgrPfl Pcel
AAPM Summer School, 2006 18
Perturbation correction factors• depth, field size, and radiation quality
dependent– for reference dosimetry using ionization
chambers: based on Monte Carlo calculations and relatively well documented
– for relative dosimetry: their variation relative to the reference point is usually ignored but can be very significant
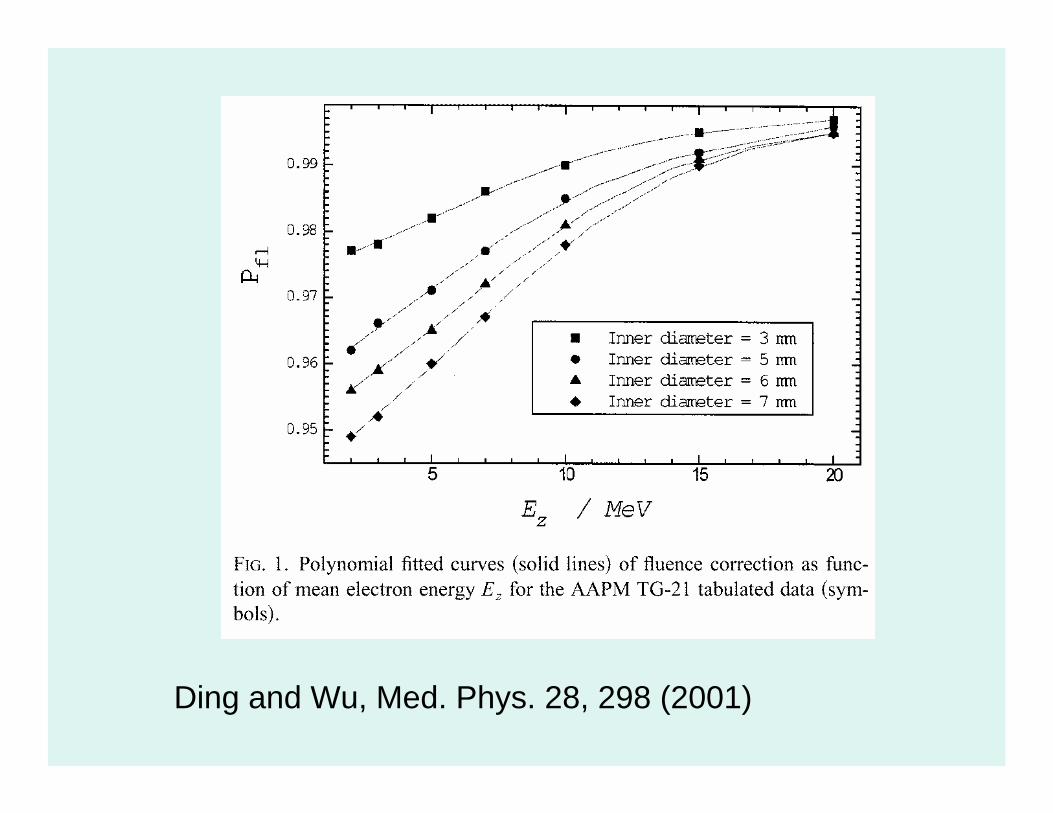
Ding and Wu, Med. Phys. 28, 298 (2001)
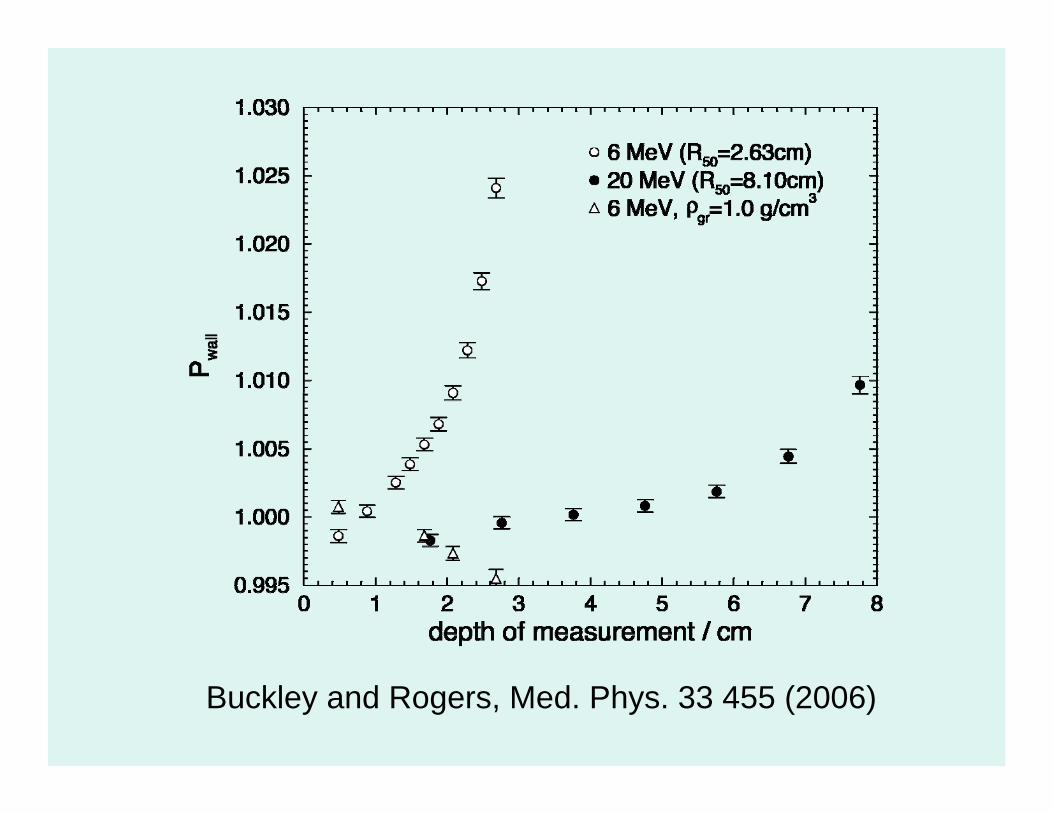
Buckley and Rogers, Med. Phys. 33 455 (2006)

Buckley and Rogers, Med. Phys. 33 1788 (2006)
AAPM Summer School, 2006 22
Commissioning measurements
• beam model verification– in-air measurements– in-water measurements
• in-phantom verification– heterogeneous measurements
• reference dose measurements / system calibration
AAPM Summer School, 2006 23
In-air measurements
• Parameters of primary source determined– mean energy of electrons exiting the vacuum
window– FWHM of intensity distribution of electron beam
exiting the vacuum window• Measurement issues?
– detector response can change as a function of off axis distance
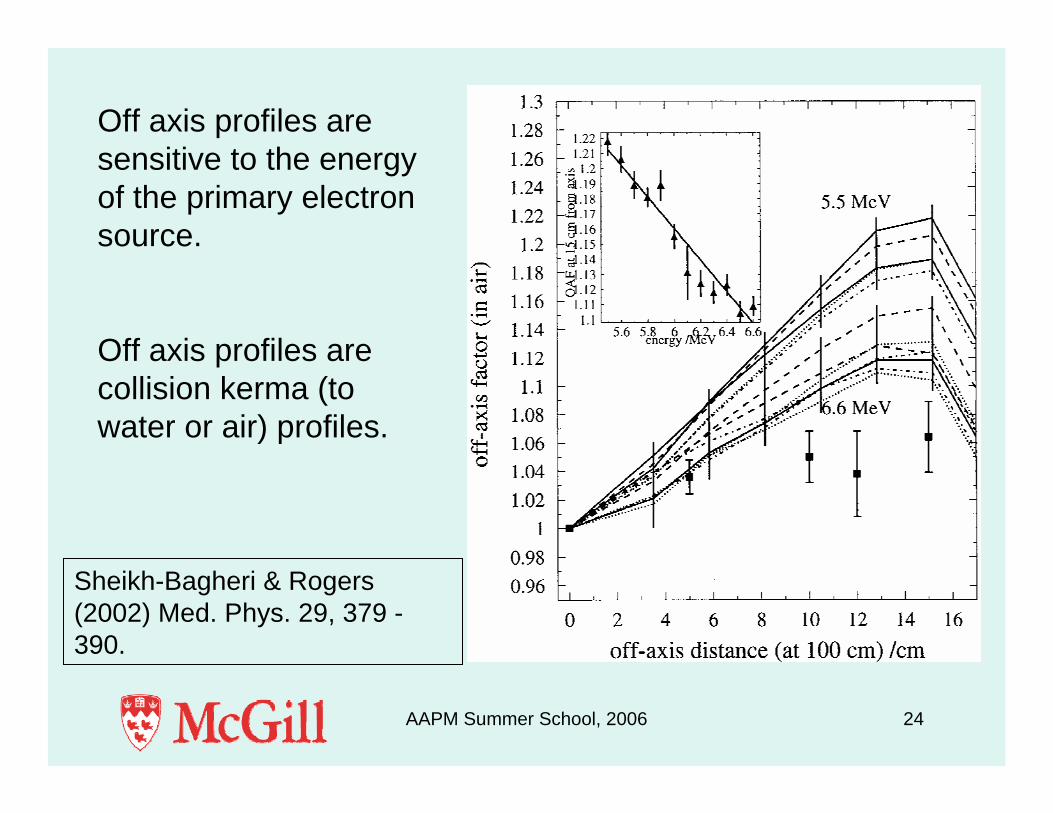
AAPM Summer School, 2006 24
Sheikh-Bagheri & Rogers (2002) Med. Phys. 29, 379 -390.
Off axis profiles are sensitive to the energy of the primary electron source.
Off axis profiles are collision kerma (to water or air) profiles.
AAPM Summer School, 2006 25
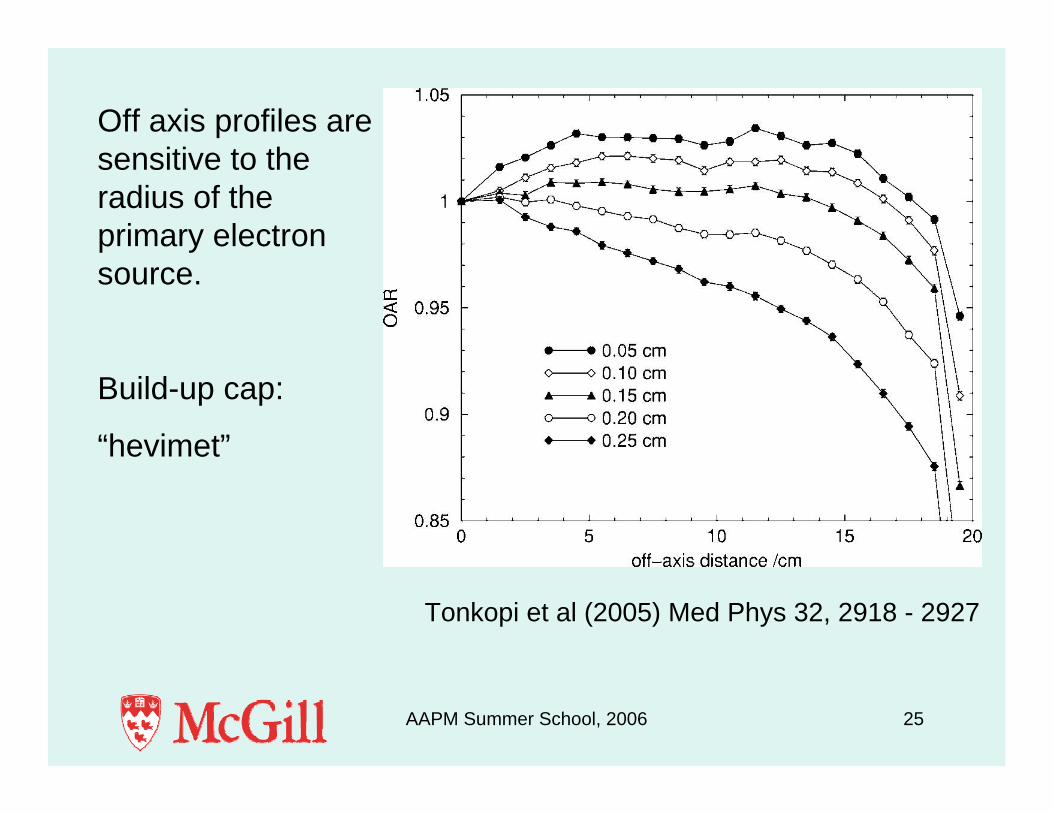
Tonkopi et al (2005) Med Phys 32, 2918 - 2927
Off axis profiles are sensitive to the radius of the primary electron source.
Build-up cap:
“hevimet”
AAPM Summer School, 2006 26
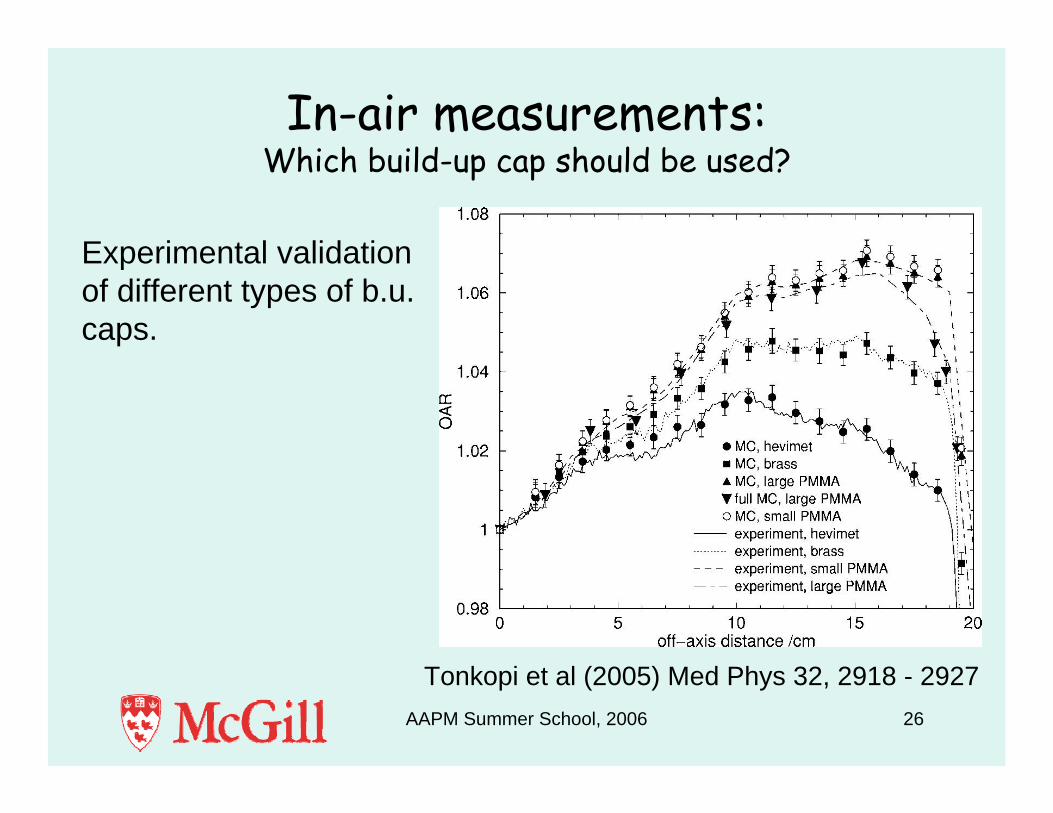
In-air measurements:Which build-up cap should be used?
Tonkopi et al (2005) Med Phys 32, 2918 - 2927
Experimental validationof different types of b.u.caps.
AAPM Summer School, 2006 27
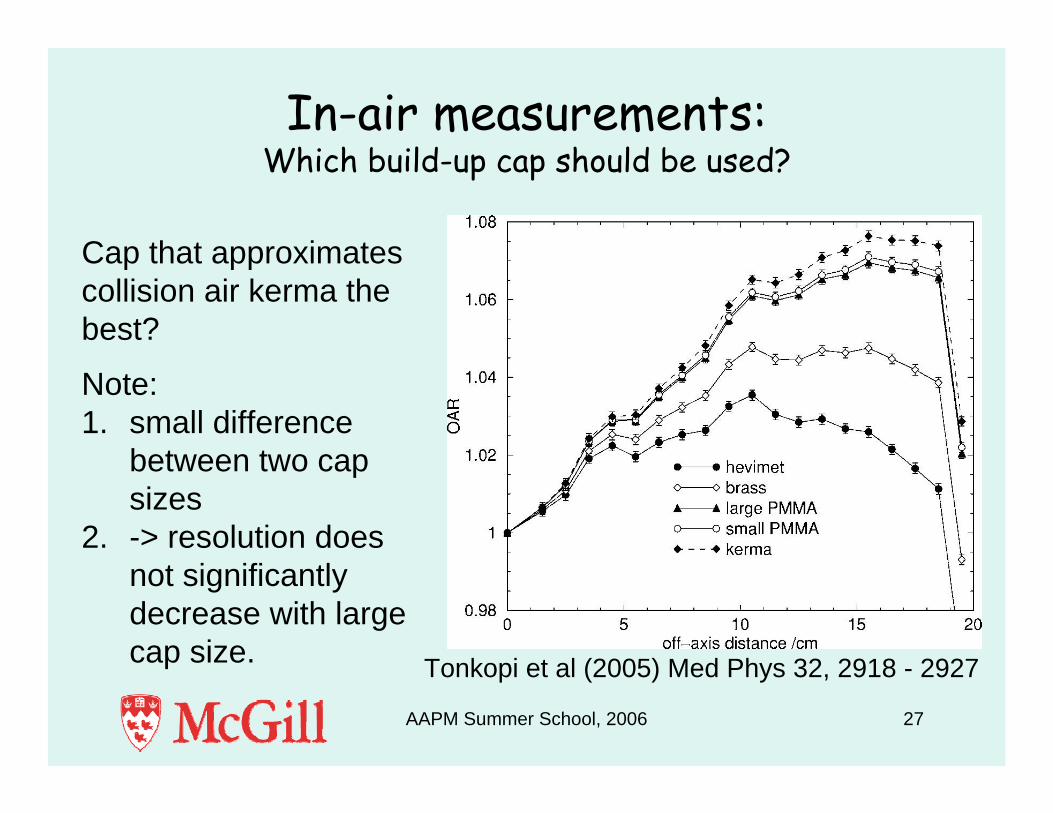
In-air measurements:Which build-up cap should be used?
Tonkopi et al (2005) Med Phys 32, 2918 - 2927
Cap that approximatescollision air kerma thebest?
Note:1. small difference
between two cap sizes
2. -> resolution does not significantly decrease with large cap size.

AAPM Summer School, 2006 28
In-air measurements, wide beam profiles for electrons
• in-air wide-field open beam profiles uncover details about– electron source parameters– scattering foils– filters in the beam

AAPM Summer School, 2006 29
Wide beam profile measurements for Total Skin Electron Therapy
• Total skin electron therapy is an external beam technique for treating mycosis fungoides. The complicated set-up makes commissioning and treatment planning time consuming.
• Monte Carlo electron beam modeling for large field size has poor agreement. • In this work, we investigated the electron focal spot size by measuring with a slit camera. • The MC linac model uses the measured FWHM as the source parameter for the simulation.
Alternating lead (0.152 mm) and paper (0.0889 mm) sheets
4 cm
20 cm
4 cm
-0.1
0
0.1
0.2
0.3
0.4
20 24 28 32
Relative distance (mm)
Rel
ativ
e O
D
FitMeasurement
FWHM
In-air profile for 40 x 40 cm2 at 100 cm SSD
0
0.2
0.4
0.6
0.8
1
1.2
-40 -30 -20 -10 0 10 20 30 40
Off axis distance (cm)
Rel
ativ
e do
se
Measurement
MC
Primary scattering foil at Z = 9.5 cm
Secondary scattering foil at Z = 12.9 cm
Lucite scatterer
Rotating platform
Electron beam
Jaws
Ion chamber
Collimator
Scattering filter
Isocenter
Scattering foils
AAPM Summer School, 2006 30
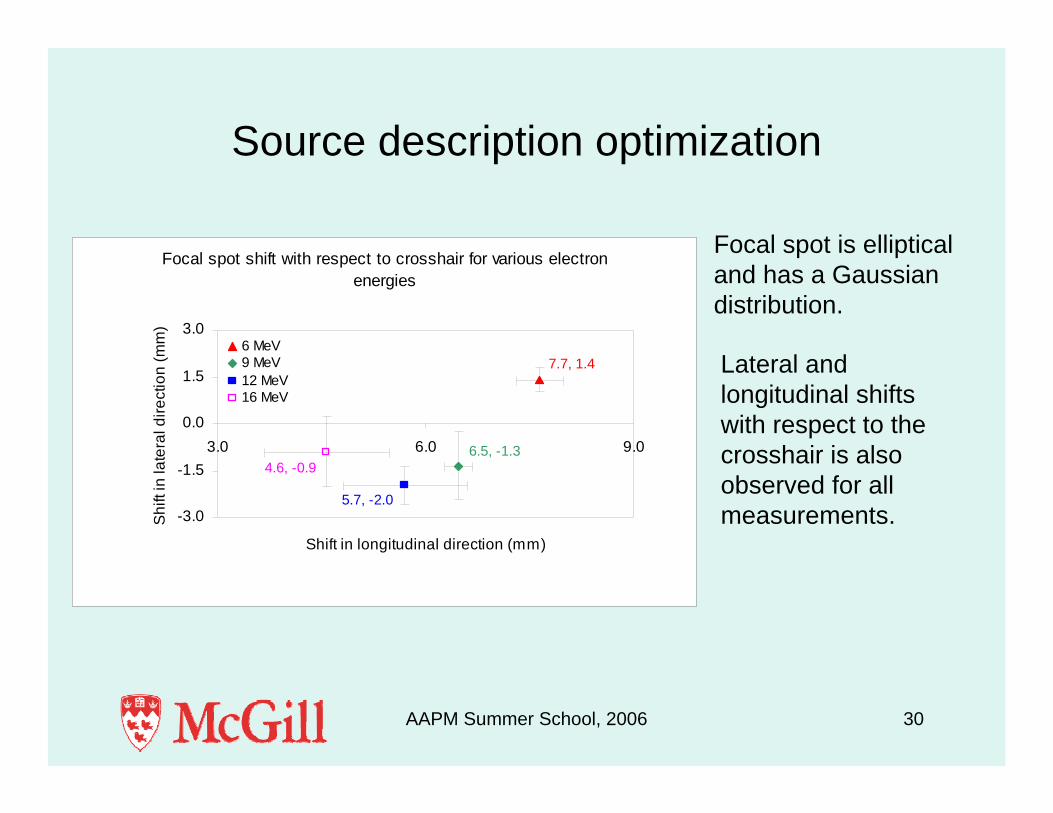
Source description optimization
Focal spot size for various electron energies
1.87, 2.14
2.11, 2.24
1.69, 2.09
1.73, 1.75
1.50
1.80
2.10
2.40
1.30 1.80 2.30FWHM in longitudinal direction (mm)
FWH
M in
late
ral d
irect
ion
(mm
)
6 MeV
9 MeV
12 MeV
16 MeV
Focal spot is elliptical and has a Gaussian distribution.
Lateral and longitudinal shifts with respect to the crosshair is also observed for all measurements.
Focal spot shift with respect to crosshair for various electron energies
7.7, 1.4
6.5, -1.3
5.7, -2.0
4.6, -0.9
-3.0
-1.5
0.0
1.5
3.0
3.0 6.0 9.0
Shift in longitudinal direction (mm)
Shi
ft in
late
ral d
irect
ion
(mm
)
6 MeV9 MeV12 MeV16 MeV
AAPM Summer School, 2006 31
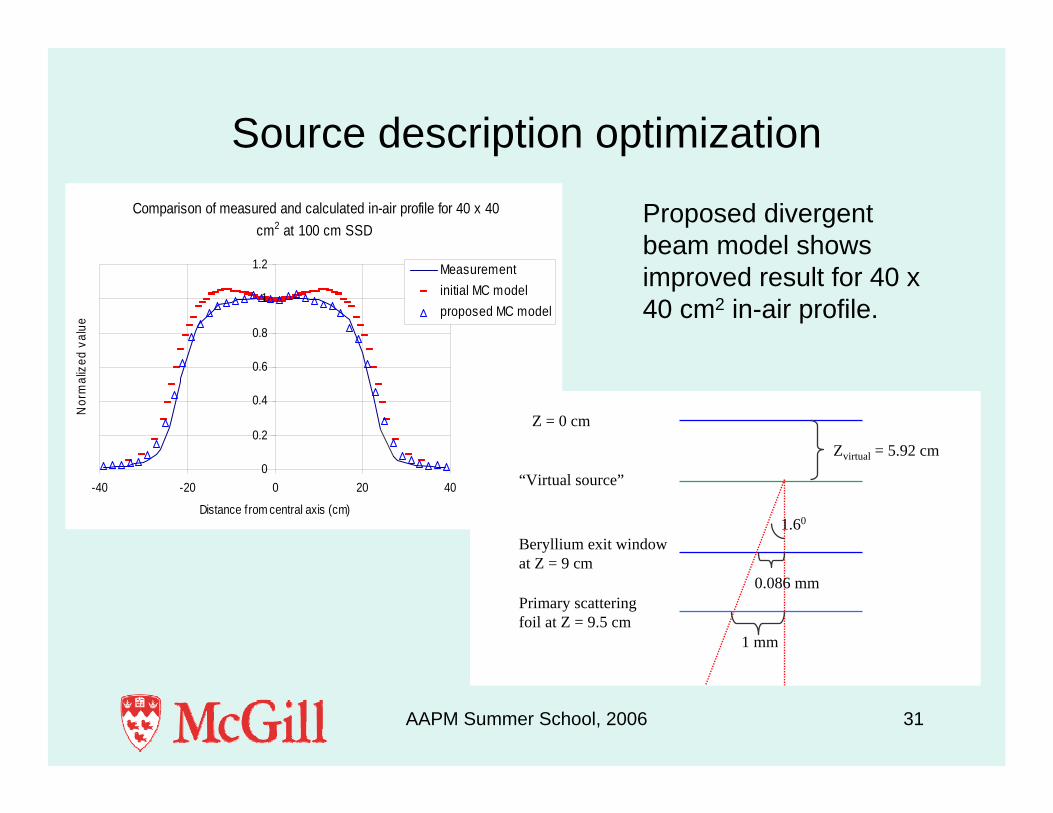
Source description optimization
Proposed divergent beam model shows improved result for 40 x 40 cm2 in-air profile.
Comparison of measured and calculated in-air profile for 40 x 40 cm2 at 100 cm SSD
0
0.2
0.4
0.6
0.8
1
1.2
-40 -20 0 20 40
Distance from central axis (cm)
Nor
mal
ized
val
ue
Measurementinitial MC modelproposed MC model
Z = 0 cm
“Virtual source”
Beryllium exit window at Z = 9 cm
Primary scattering foil at Z = 9.5 cm
1 mm
0.086 mm
1.60
Zvirtual = 5.92 cm
AAPM Summer School, 2006 32
In-water beam model verification measurements
• In-water measurements are frequently used for beam model optimization since:– these measurements are performed as part of a
standard commissioning.– reproduction of these measurements by the MC
planning system forms a core consistency test of the system’s commissioning.
– reference dosimetry is carried out in water (e.g., TG-51 or IAEA TRS-398) and thus allows to link the output measured to the source’s energy and fluence parameters.

AAPM Summer School, 2006 33
Different measurement issues in open photon fields in water
• in-field, CPE or TCPE– standard measurement, SPR is nearly constant and represents
detector response well; detector perturbations are small (point-of-measurement shift is 0.6*rinner upstream)
• in-field, non-CPE (build-up)– non standard measurement, SPR varies modestly but does not
represent variation in detector response well; detector perturbations are large, detector dependent.
• penumbra (non-CPE)– detector size must be small relative to field-size and penumbra
width, SPR does not represent detector response well, lateral fluence perturbations, detector dependent.
• out-of-field (CPE or TCPE)– detector size must be sufficiently large to collect sufficiently large
signal. SPE represents detector response well.
AAPM Summer School, 2006 34
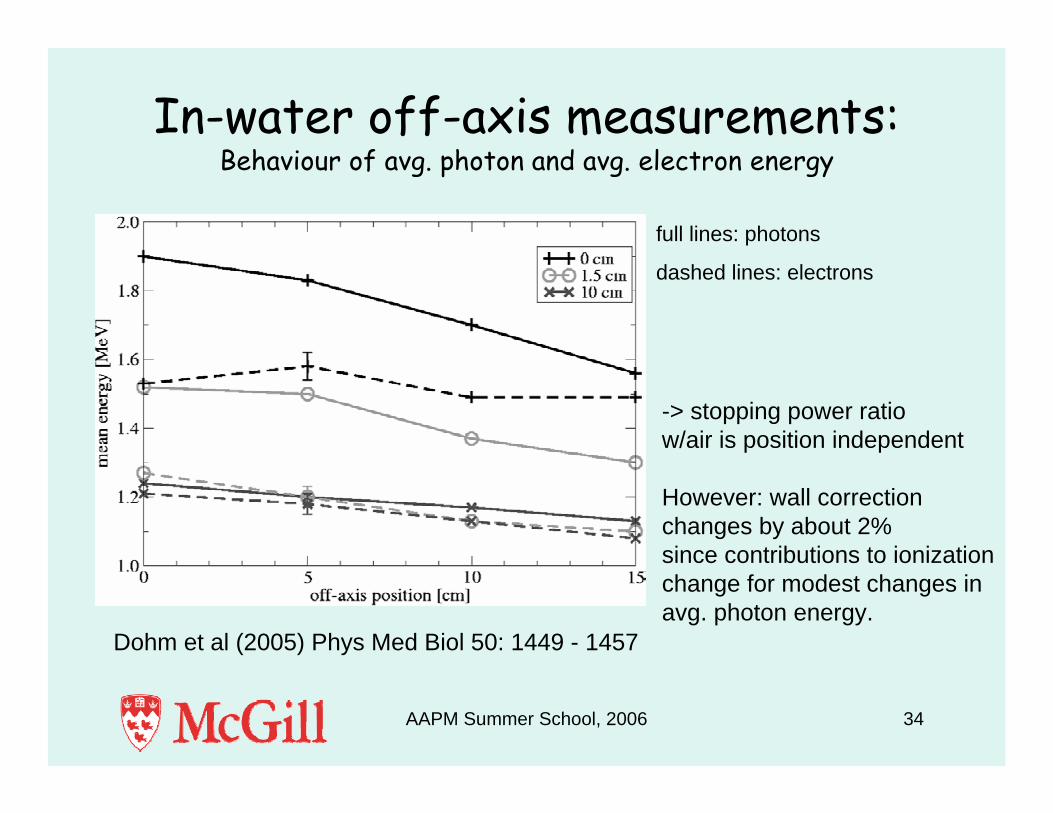
In-water off-axis measurements:Behaviour of avg. photon and avg. electron energy
Dohm et al (2005) Phys Med Biol 50: 1449 - 1457
full lines: photons
dashed lines: electrons
-> stopping power ratiow/air is position independent
However: wall correctionchanges by about 2%since contributions to ionizationchange for modest changes inavg. photon energy.

AAPM Summer School, 2006 35
A14P ExRadin ionization chamberGeometry of the measuring volume
Laplace equation: ∇ =2 0UBoundary condition: Surface potential
Collecting electrode diameter: 1.5 mm
Separation: 1 mm
Effective volume of the chamber determined by electricfield in chamber.
AAPM Summer School, 2006 36
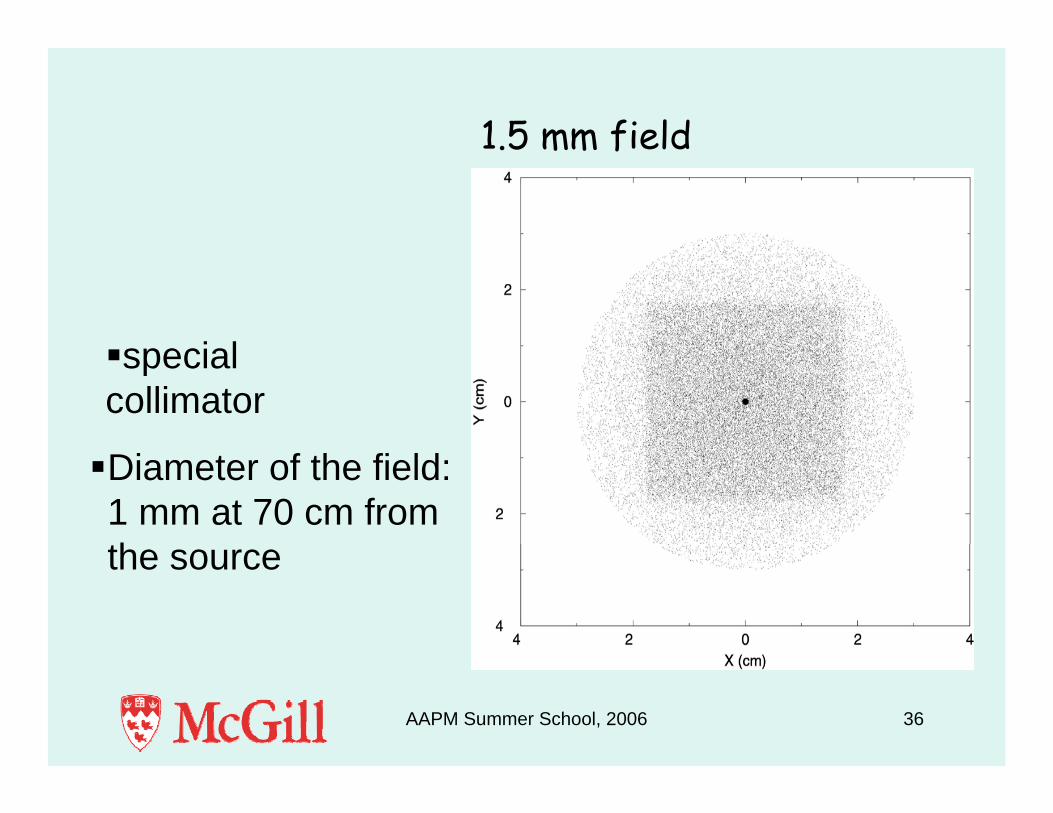
1.5 mm field
specialcollimator
Diameter of the field: 1 mm at 70 cm from the source
AAPM Summer School, 2006 37
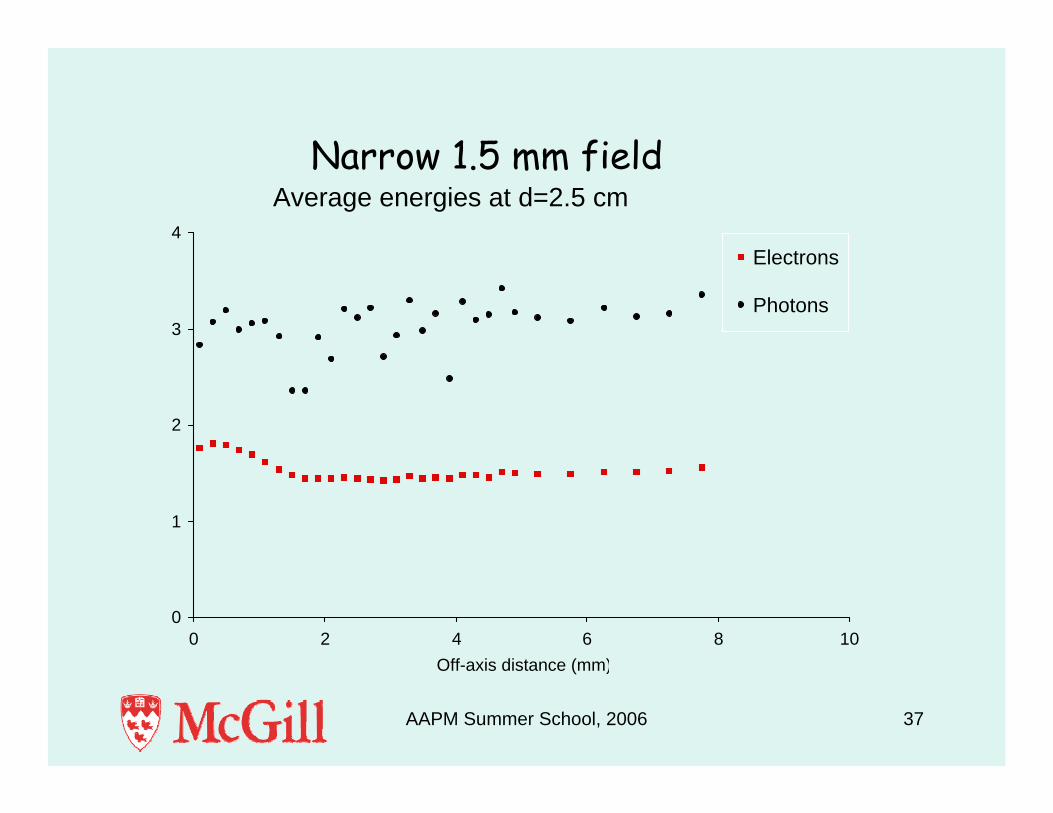
Average energies at d=2.5 cm
0
1
2
3
4
0 2 4 6 8 10Off-axis distance (mm)
Electrons
Photons
Narrow 1.5 mm field
AAPM Summer School, 2006 38
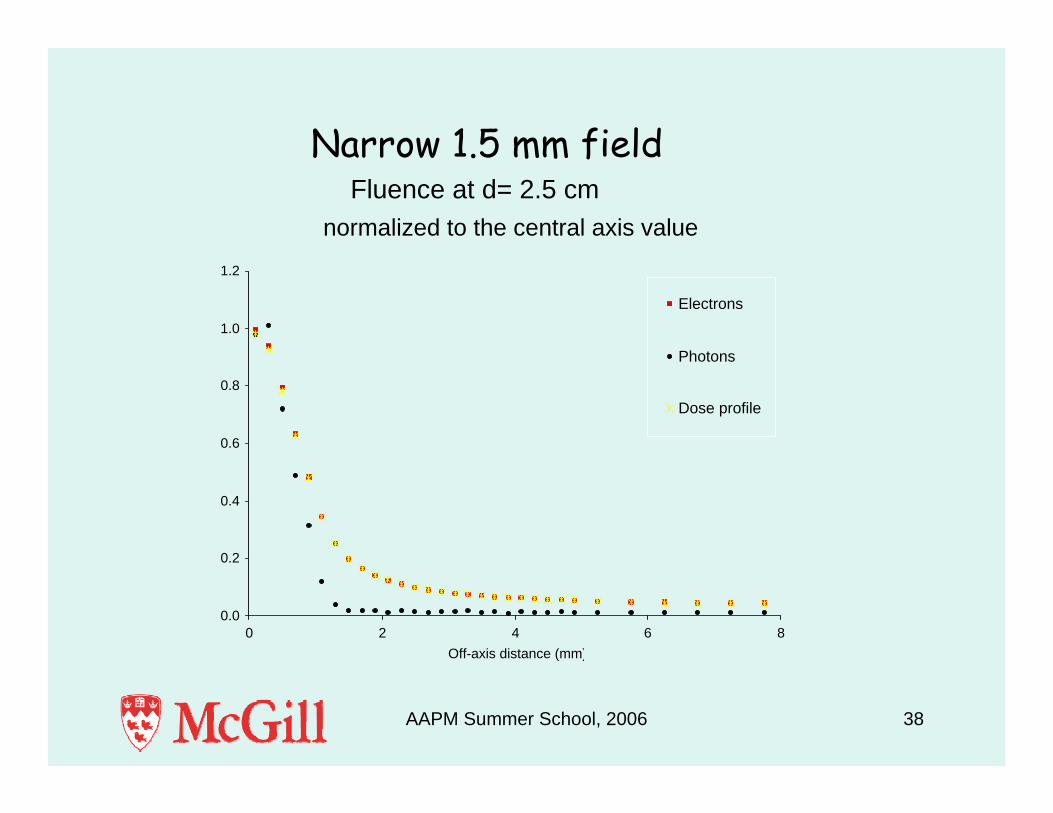
Narrow 1.5 mm fieldFluence at d= 2.5 cm
normalized to the central axis value
0.0
0.2
0.4
0.6
0.8
1.0
1.2
0 2 4 6 8Off-axis distance (mm)
Electrons
Photons
Dose profile

AAPM Summer School, 2006 39
Narrow 1.5 mm fieldDose water-to-air ratio
0.8
0.9
1
1.1
1.2
1.3
1.4
1.5
1.6
1.7
0 2 4 6 8Off-axis distance (mm)
AAPM Summer School, 2006 40
0
0.2
0.4
0.6
0.8
1
1.2
-8 -6 -4 -2 0 2 4 6 8Off-axis distance (mm)
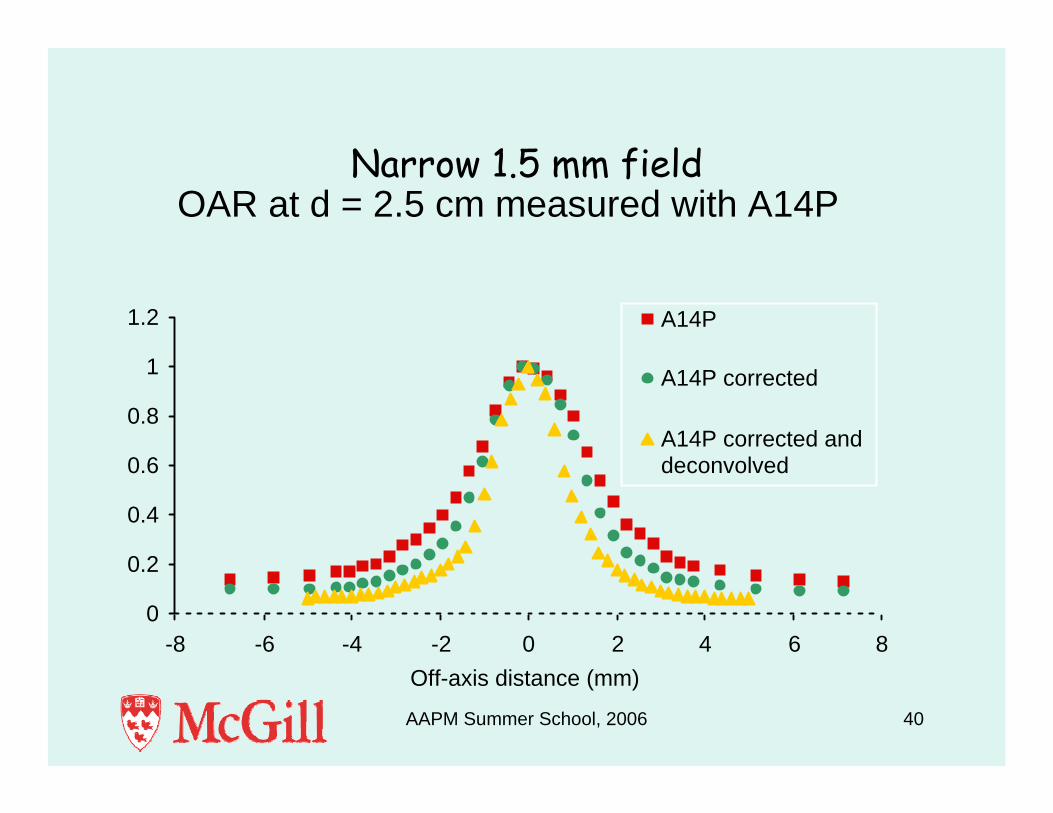
A14P
A14P corrected
A14P corrected anddeconvolved
OAR at d = 2.5 cm measured with A14PNarrow 1.5 mm field
AAPM Summer School, 2006 41
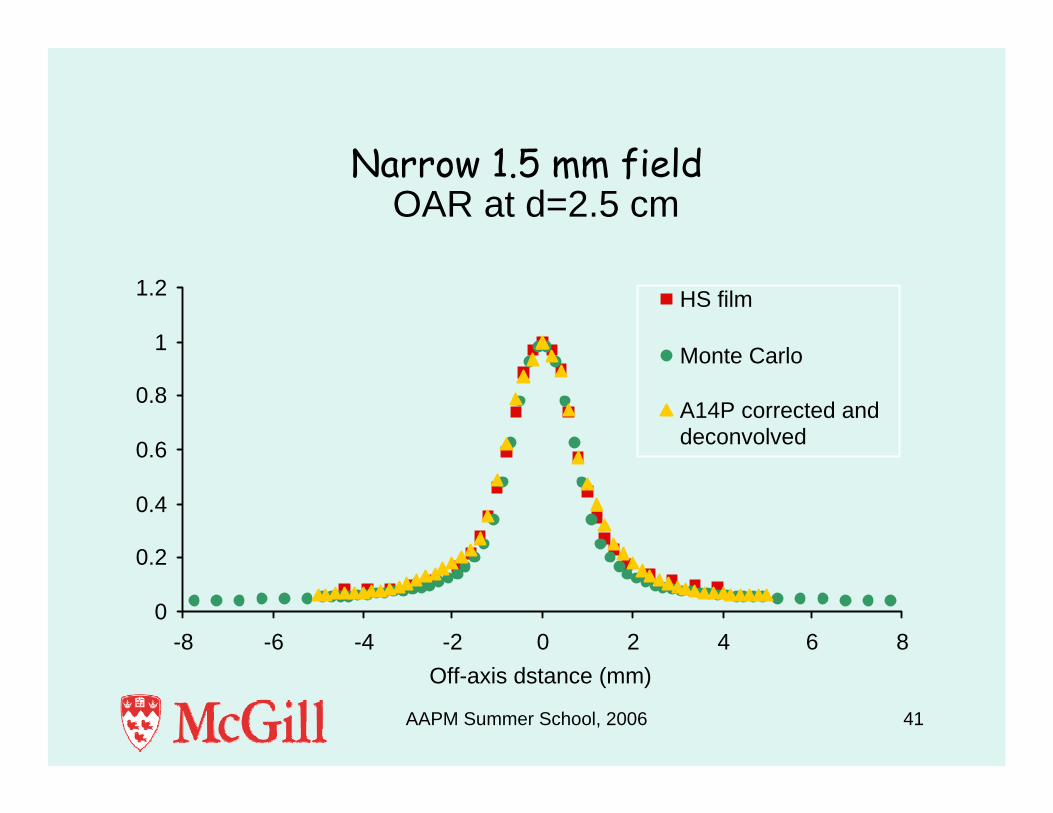
OAR at d=2.5 cm
0
0.2
0.4
0.6
0.8
1
1.2
-8 -6 -4 -2 0 2 4 6 8Off-axis dstance (mm)
HS film
Monte Carlo
A14P corrected anddeconvolved
Narrow 1.5 mm field

AAPM Summer School, 2006 42
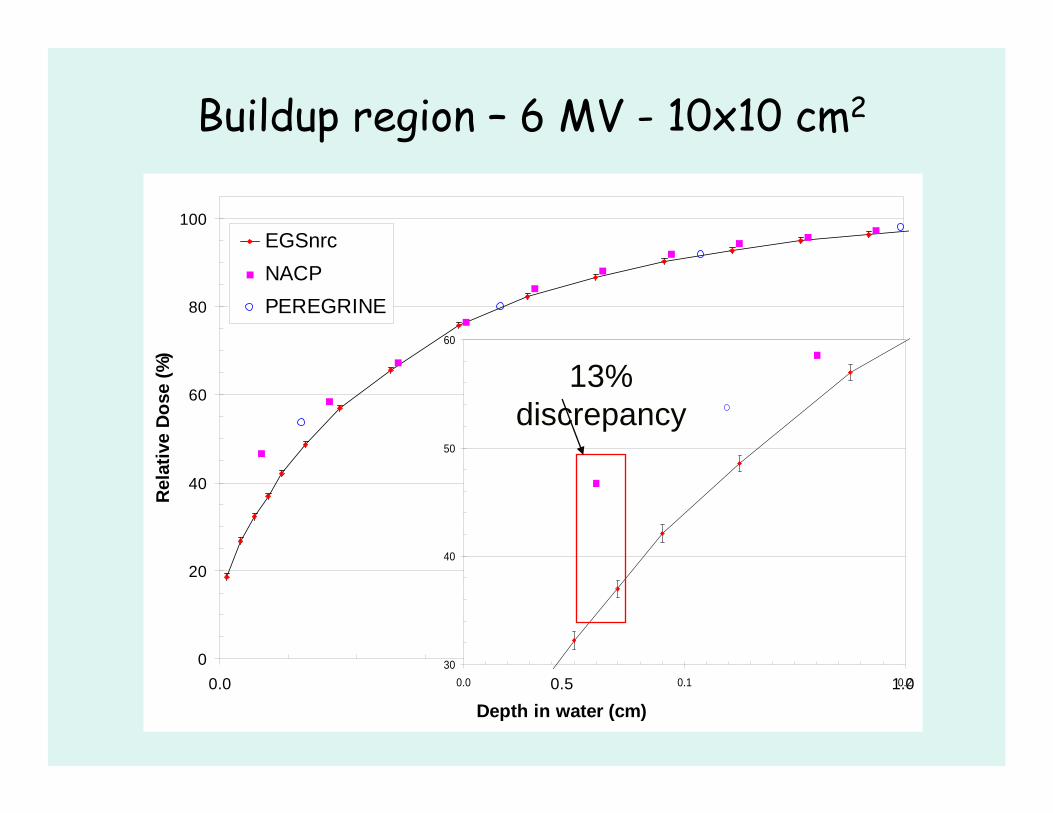
Build-up dose measurements• Build-up dose calculations are challenging
but may be clinically important for DVH’s of superficial structures. However:– Discrepancies have been reported between
measured and calculated build-up doses at high photon energies.
– Benchmark measurements are needed to ensure the system accurately calculates dose in the build-up region.
– Benchmark measurements are prone to uncertainties ranging up to 50% of the local dose.
0
20
40
60
80
100
0.0 0.5 1.0
Depth in water (cm)
Rel
ativ
e D
ose
(%)
EGSnrcNACPPEREGRINE
Buildup region – 6 MV - 10x10 cm2
30
40
50
60
0.0 0.1 0.2
13% discrepancy

0
20
40
60
80
100
0.0 0.5 1.0 1.5
Depth in water (cm)
Rel
ativ
e D
ose
(%)
NACPEGSnrcPEREGRINE
Buildup region – 6 MV- 40x40 cm2
50
60
70
80
0.0 0.1 0.2
10% discrepancy
AAPM Summer School, 2006 45
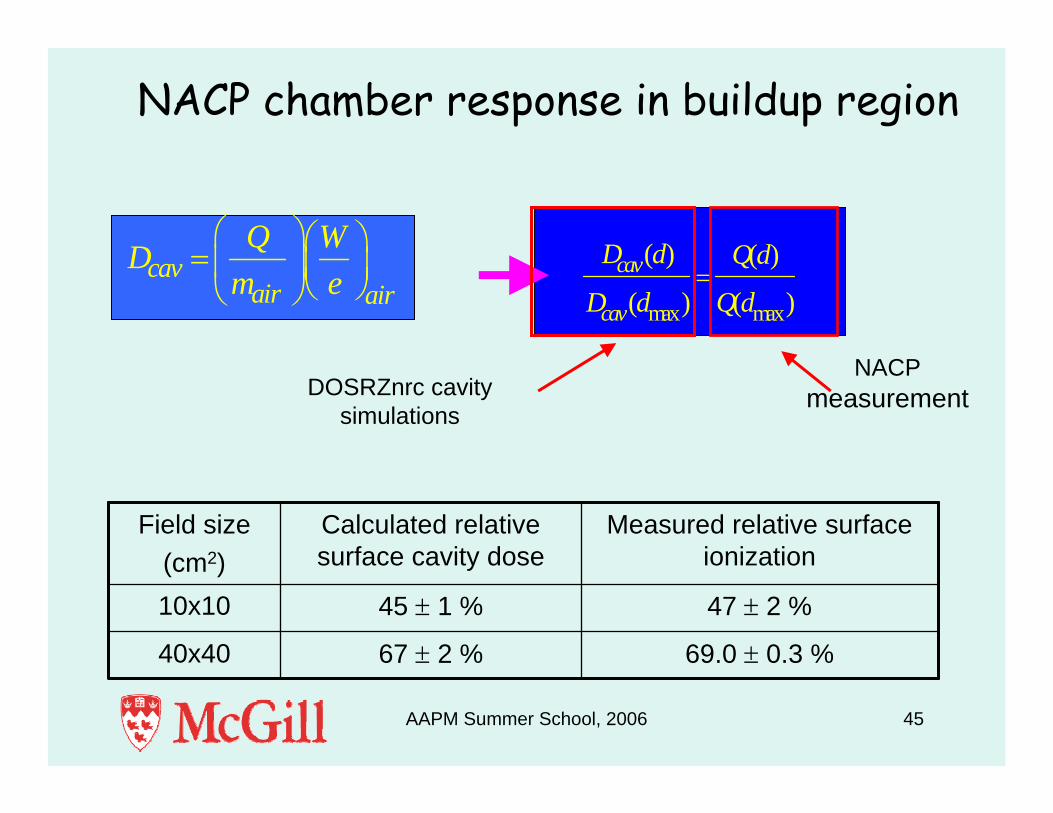
NACP chamber response in buildup region
cavair air
Q WDm e
⎛ ⎞⎛ ⎞=⎜ ⎟⎜ ⎟⎝ ⎠⎝ ⎠
max max
( ) ( )
( ) ( )cav
cav
D d Q d
D d Q d=
NACPmeasurementDOSRZnrc cavity
simulations
69.0 ± 0.3 %67 ± 2 %40x40
47 ± 2 %45 ± 1 %10x10
Measured relative surface ionization
Calculated relative surface cavity dose
Field size (cm2)
AAPM Summer School, 2006 46
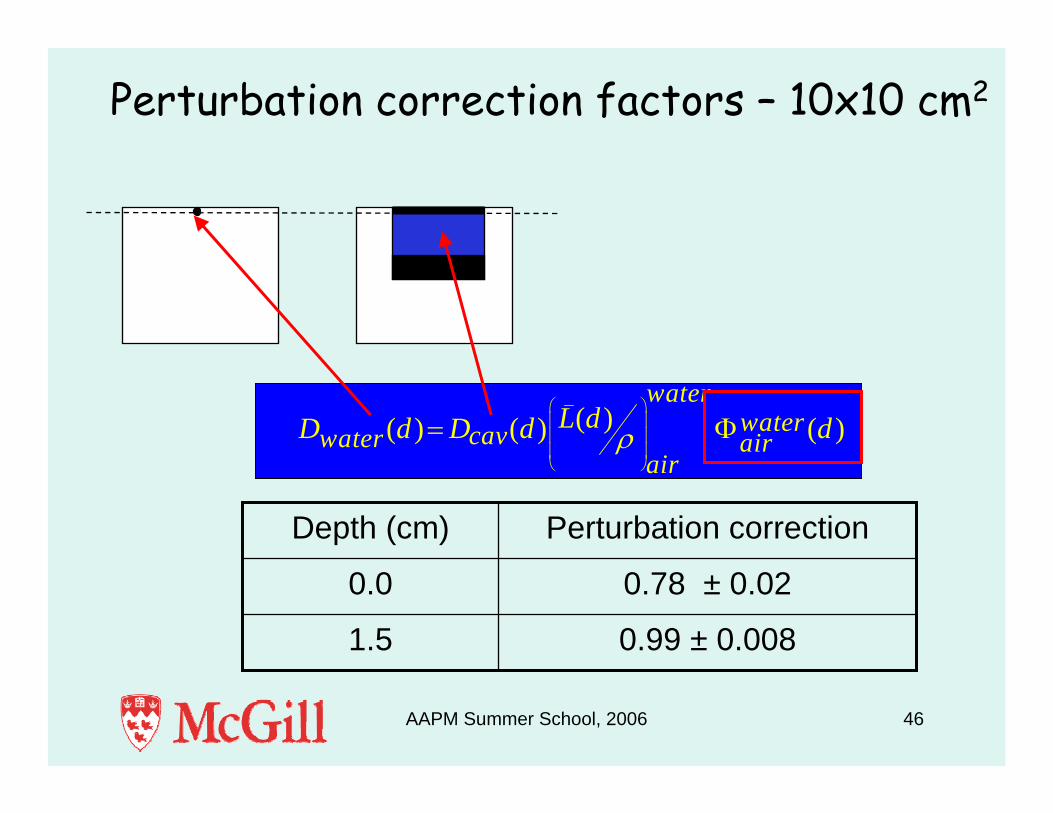
Perturbation correction factors – 10x10 cm2
( )( ) ( ) ( )water
watercavwater airair
L dD d D d dρ⎛ ⎞⎜ ⎟⎜ ⎟⎜ ⎟⎝ ⎠
= Φ
0.78 ± 0.020.0
0.99 ± 0.0081.5
Perturbation correctionDepth (cm)
AAPM Summer School, 2006 47
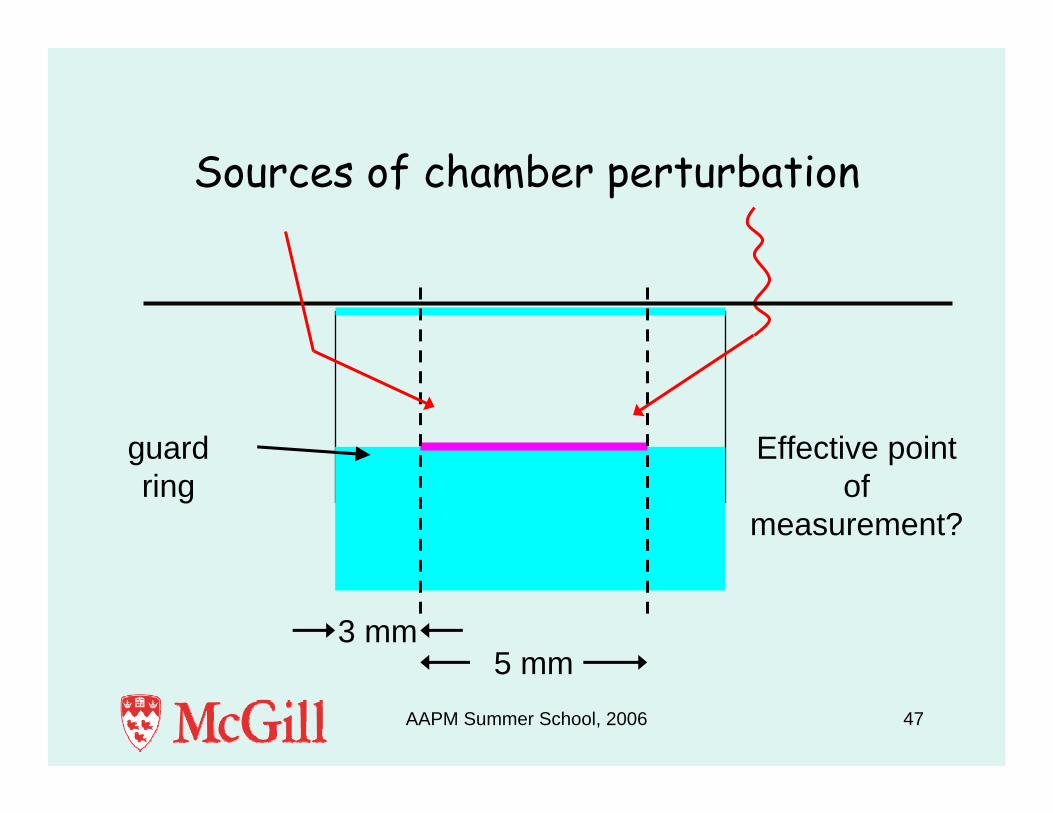
Sources of chamber perturbation
guard ring
Effective point of
measurement?
3 mm5 mm

0
20
40
60
80
100
0.0 0.5 1.0
Depth in water (cm)
Rel
ativ
e D
ose
(%)
EGSnrc
PEREGRINE
Buildup region – 10x10 cm2
PEREGRINE overestimates dose near surface by 6%
AAPM Summer School, 2006 49
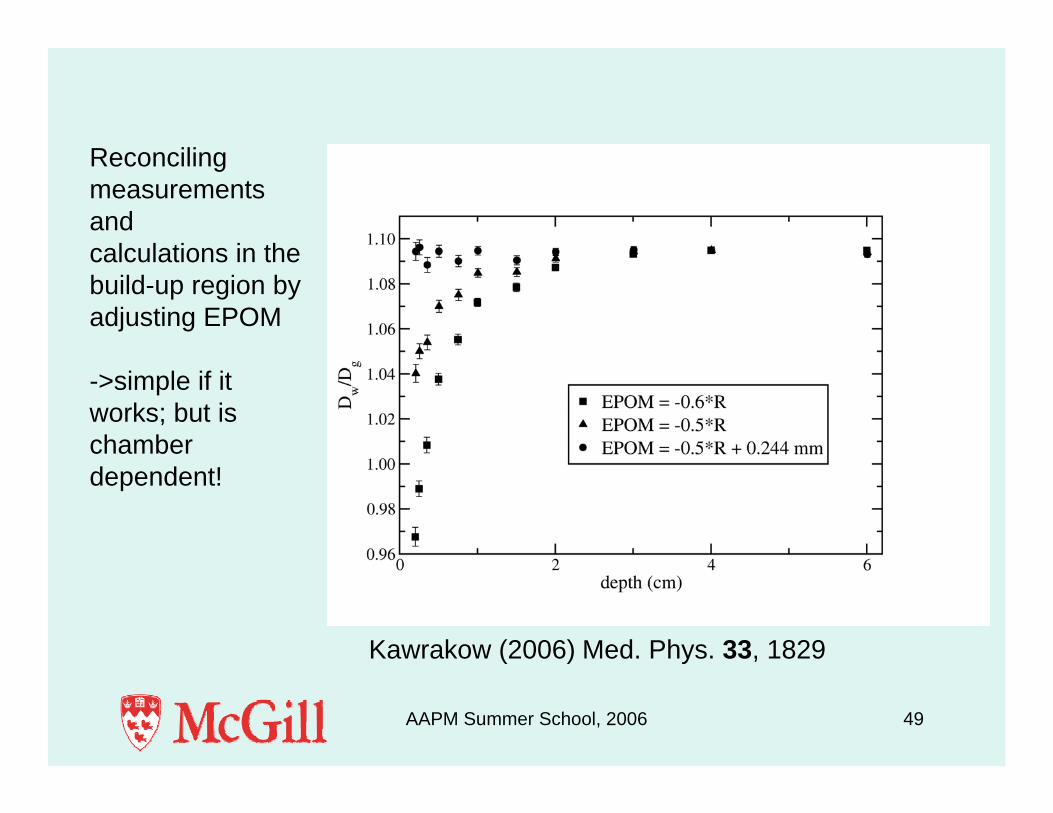
Kawrakow (2006) Med. Phys. 33, 1829
Reconciling measurements andcalculations in the build-up region by adjusting EPOM
->simple if it works; but is chamber dependent!
AAPM Summer School, 2006 50
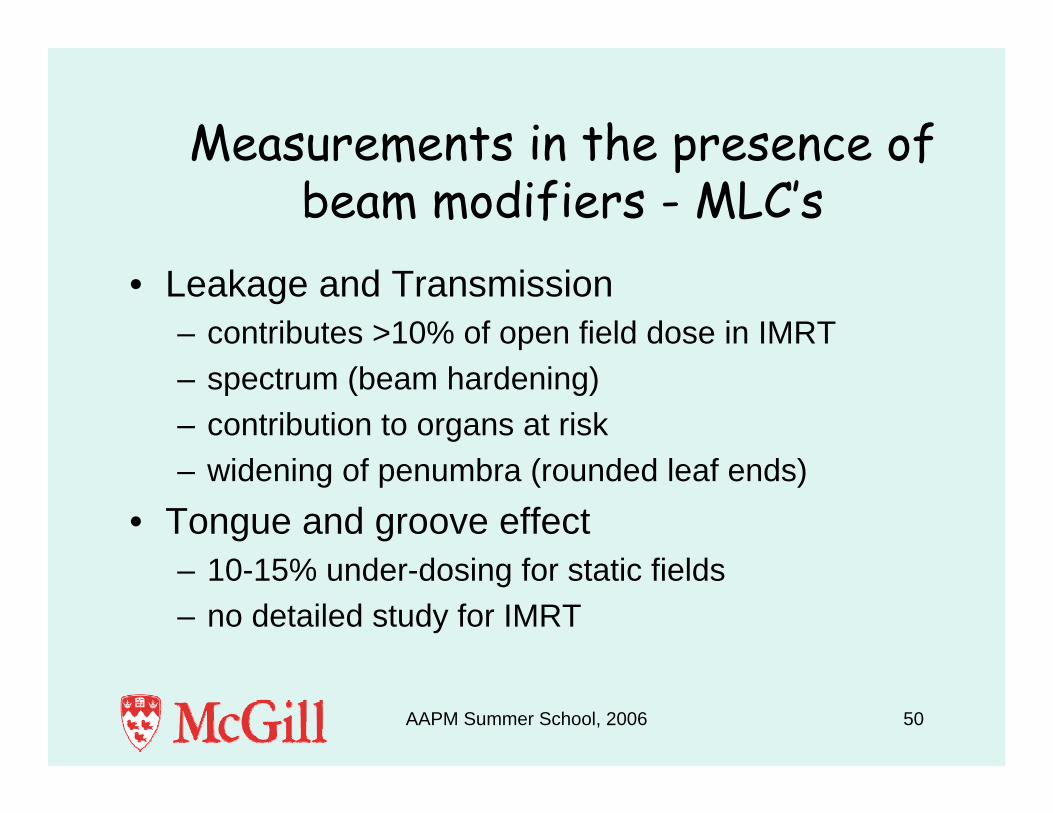
Measurements in the presence of beam modifiers - MLC’s
• Leakage and Transmission– contributes >10% of open field dose in IMRT– spectrum (beam hardening)– contribution to organs at risk– widening of penumbra (rounded leaf ends)
• Tongue and groove effect– 10-15% under-dosing for static fields– no detailed study for IMRT
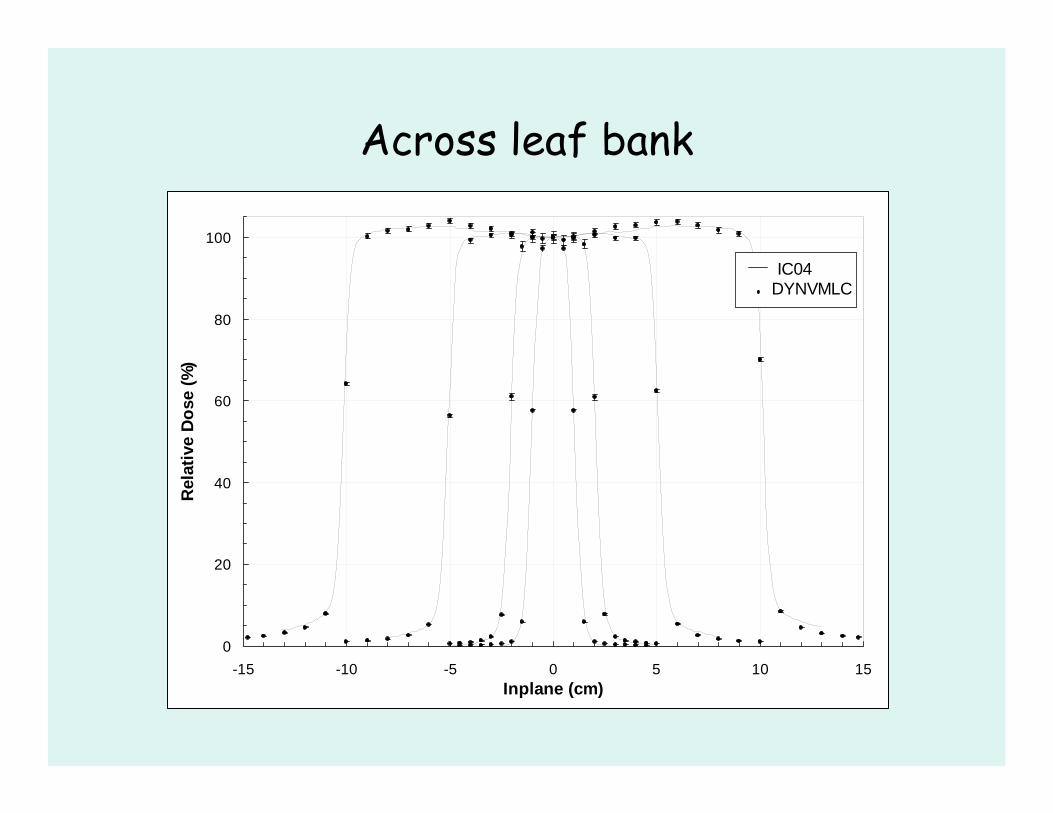
Across leaf bank
0
20
40
60
80
100
-15 -10 -5 0 5 10 15Inplane (cm)
Rel
ativ
e D
ose
(%)
IC04DYNVMLC
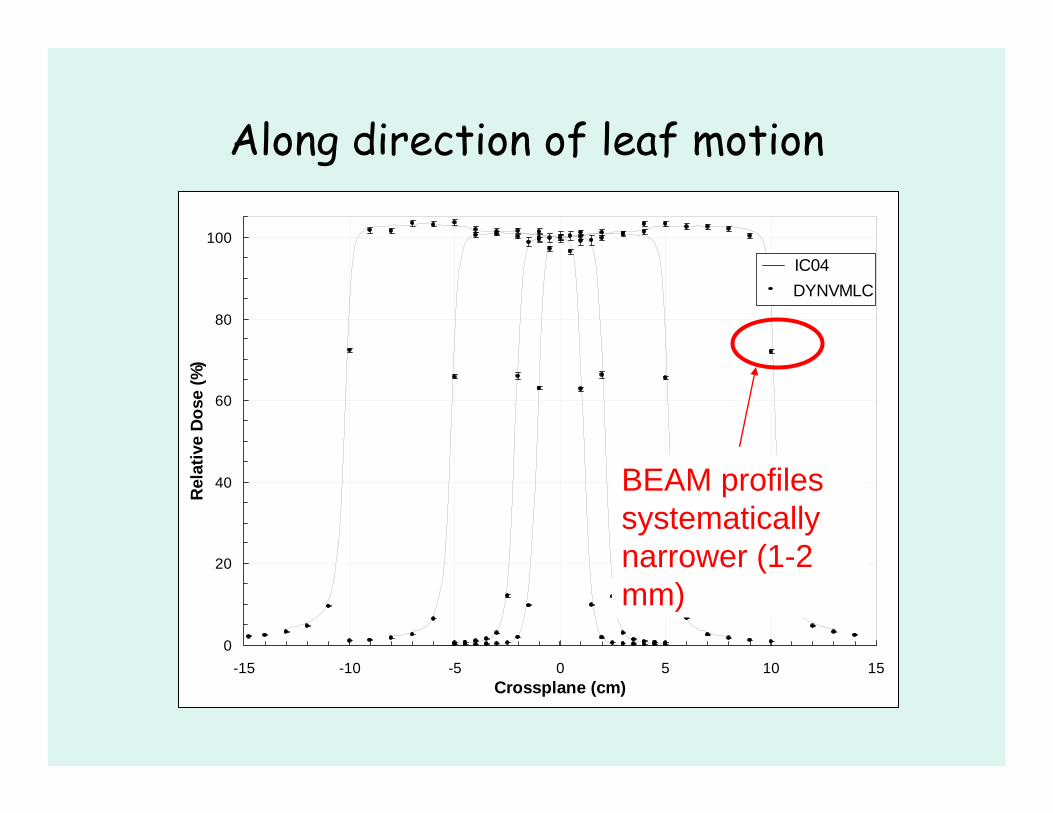
Along direction of leaf motion
0
20
40
60
80
100
-15 -10 -5 0 5 10 15Crossplane (cm)
Rel
ativ
e D
ose
(%)
IC04DYNVMLC
BEAM profiles systematically narrower (1-2 mm)
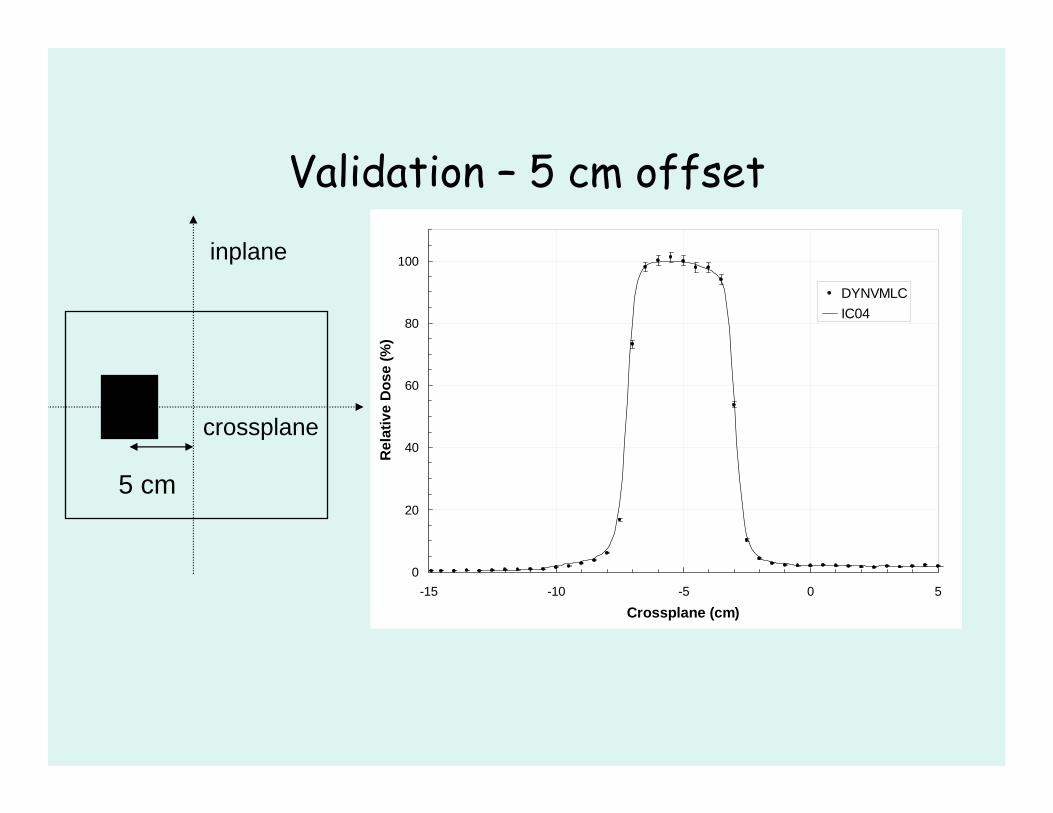
Validation – 5 cm offset
0
20
40
60
80
100
-15 -10 -5 0 5
Crossplane (cm)
Rel
ativ
e D
ose
(%)
DYNVMLCIC04
5 cm
crossplane
inplane

AAPM Summer School, 2006 54
MLC bar pattern
0
20
40
60
80
100
-25 -20 -15 -10 -5 0 5 10 15 20 25
Inplane (cm)
Rel
ativ
e D
ose
(nor
mal
ized
to o
pen
field
)
DYNVMLCDiode
+ Inplane
0
20
40
60
80
100
-8 -6 -4 -2 0 2 4 6 8Crossplane (cm)
Rel
. Dos
e (%
)
MCCA24Film
0
20
40
60
80
100
-8 -6 -4 -2 0 2 4 6 8Inplane (cm)
Rel
. Dos
e (%
)
CA24MCFilm
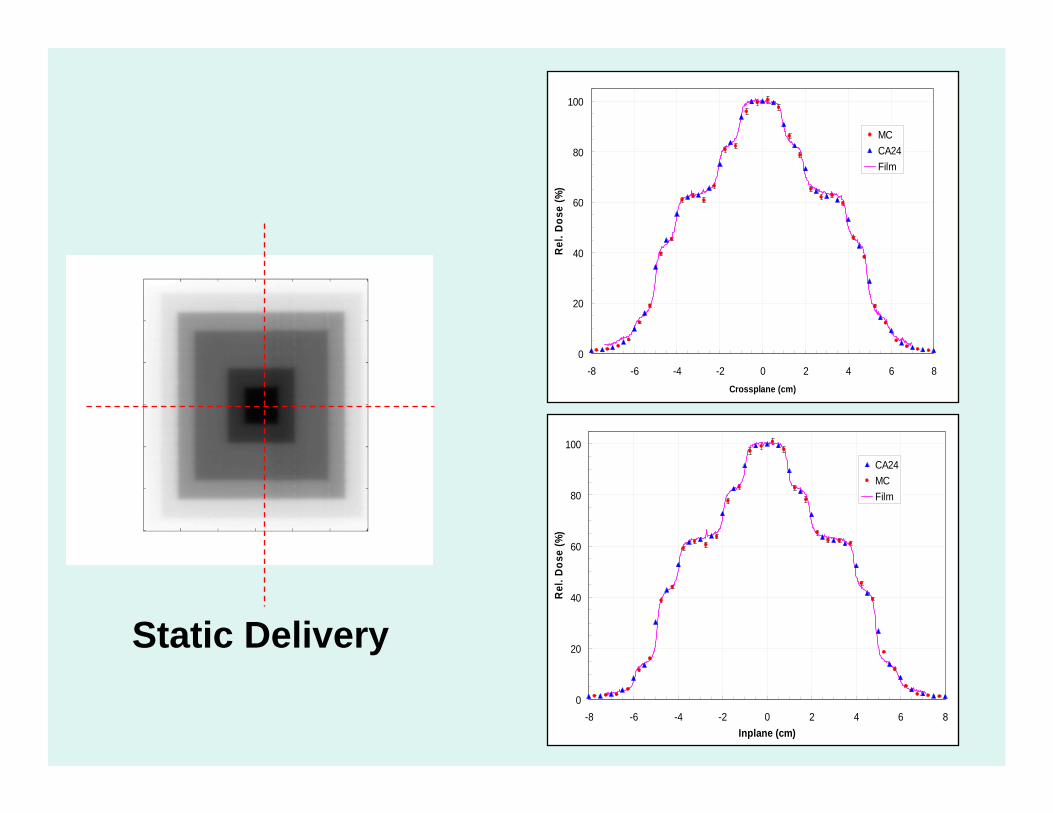
Static Delivery
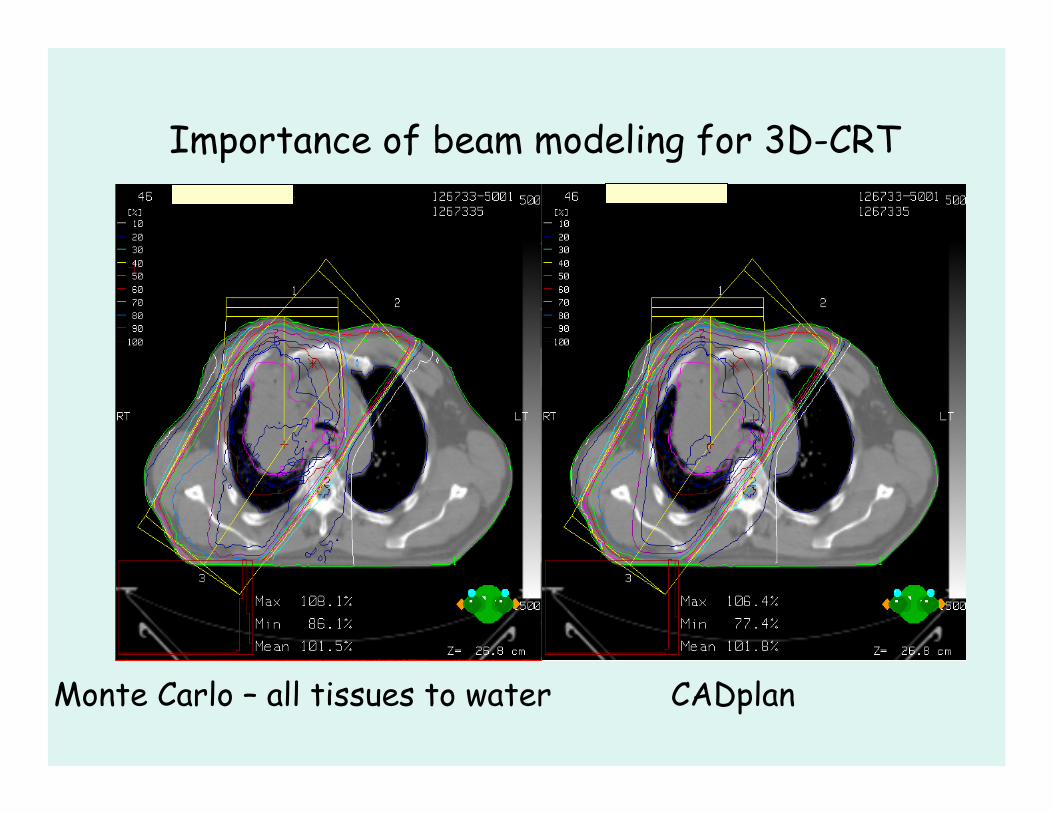
Importance of beam modeling for 3D-CRT
Monte Carlo – all tissues to water CADplan

All tissues to water, plan 2
cord
0
20
40
60
80
100
120
0 200 400 600 800 1000 1200 1400Dose (cGy)
CADplanxVMC
The conventional planningsystem uses a pencil beam
algorithm once MLC is used as
beam shaping device

AAPM Summer School, 2006 58
Validation – MLC leakageLeaf material density and abutting leaf air gap were chosen to match simulated MLC leakage profiles with film measurements
• leaf gaps measured physically
• measured leakage is sensitive to measurement configuration
• simulation should match measurement geometry

AAPM Summer School, 2006 59
Interleaf leakage at 2 cm offset
0.0
0.5
1.0
1.5
2.0
-6 -4 -2 0 2 4 6
Inplane (cm)
Rel
ativ
e D
ose
norm
aliz
ed to
Ope
n fie
ld
FilmBEAMnrc/DOSXYZnrc
• density = 17.7 g/cm3
• interleaf air gap = 0.0057 cm
AAPM Summer School, 2006 60
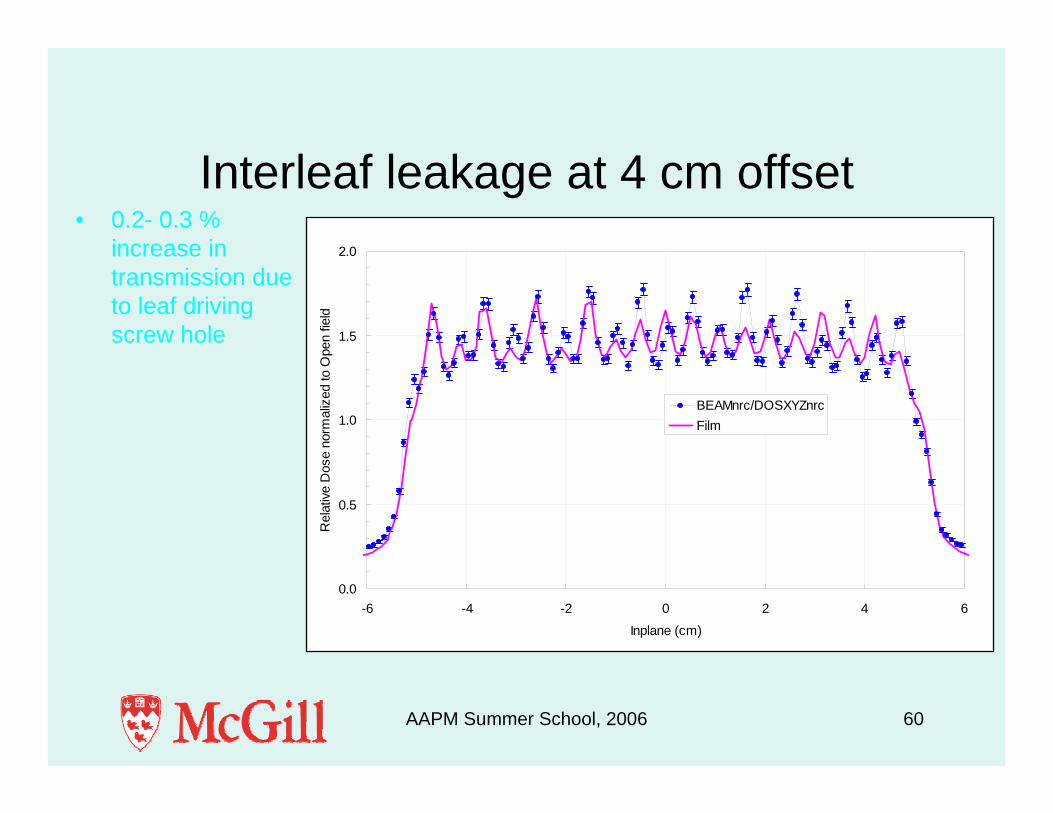
Interleaf leakage at 4 cm offset• 0.2- 0.3 %
increase in transmission due to leaf driving screw hole
0.0
0.5
1.0
1.5
2.0
-6 -4 -2 0 2 4 6
Inplane (cm)
Rel
ativ
e D
ose
norm
aliz
ed to
Ope
n fie
ld
BEAMnrc/DOSXYZnrcFilm
AAPM Summer School, 2006 61
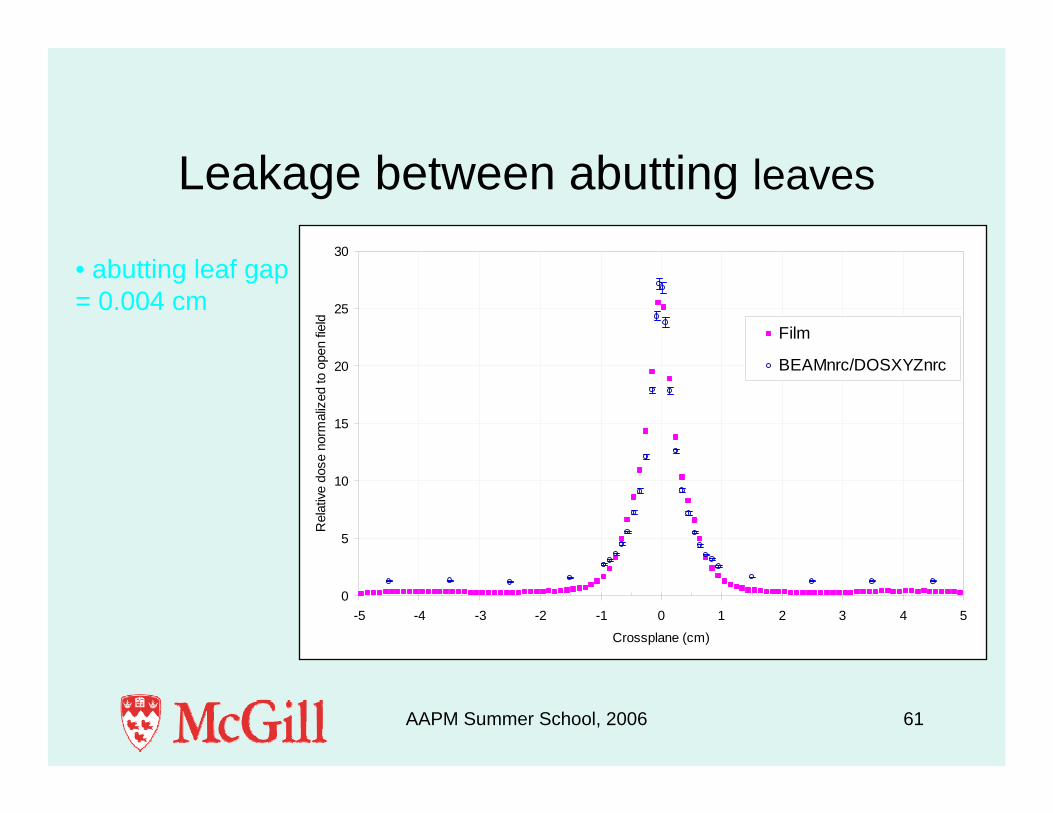
Leakage between abutting leaves
0
5
10
15
20
25
30
-5 -4 -3 -2 -1 0 1 2 3 4 5
Crossplane (cm)
Rel
ative
dos
e no
rmal
ized
to o
pen
field
Film
BEAMnrc/DOSXYZnrc
• abutting leaf gap = 0.004 cm
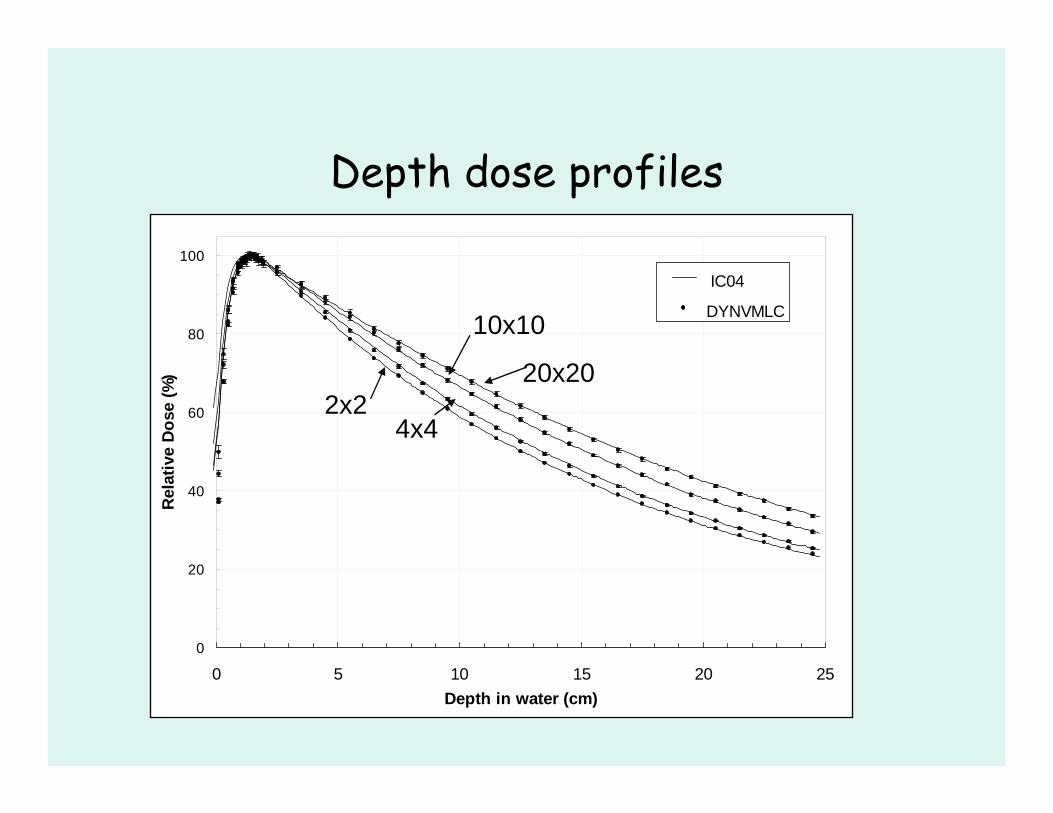
Depth dose profiles
0
20
40
60
80
100
0 5 10 15 20 25Depth in water (cm)
Rel
ativ
e D
ose
(%)
IC04
DYNVML
IC04
DYNVMLC
2x24x4
10x10
20x20
0
20
40
60
80
100
-8 -6 -4 -2 0 2 4 6 8Inplane (cm)
Rel
. Dos
e (%
)
MCFilmCA24
0
20
40
60
80
100
-8 -6 -4 -2 0 2 4 6 8
Crossplane (cm)
Rel
. Dos
e (%
) MCfilmCA24
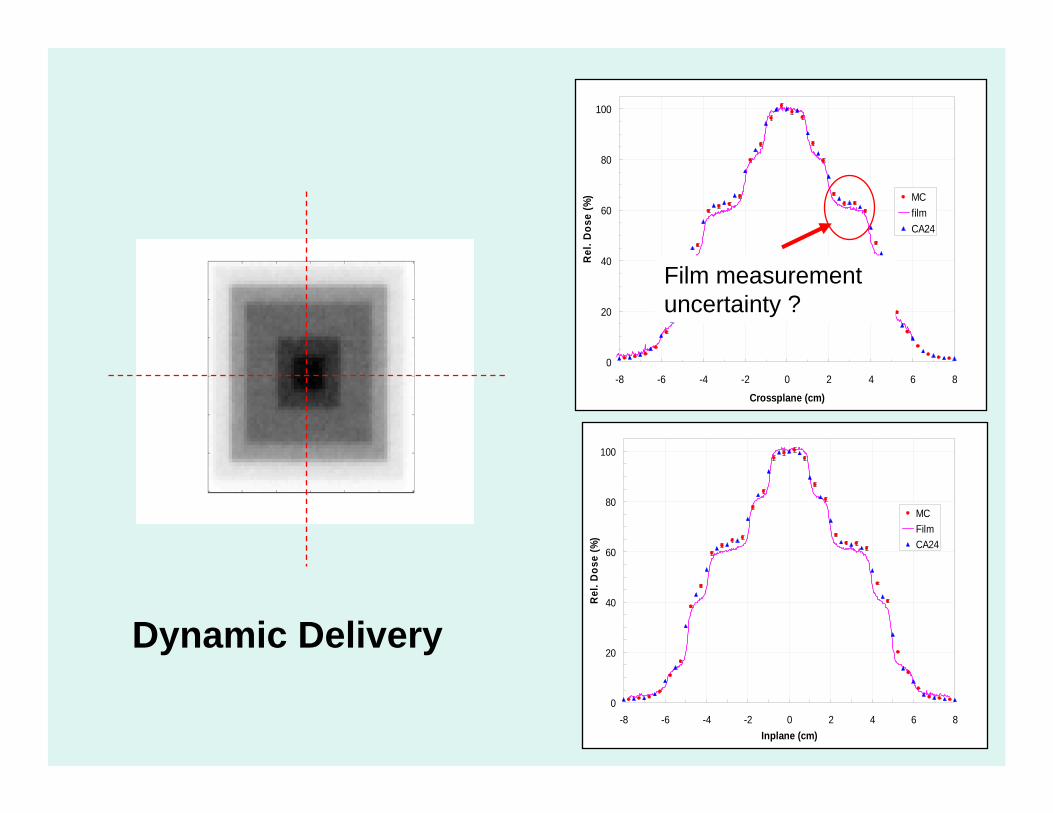
Dynamic Delivery
Film measurement uncertainty ?
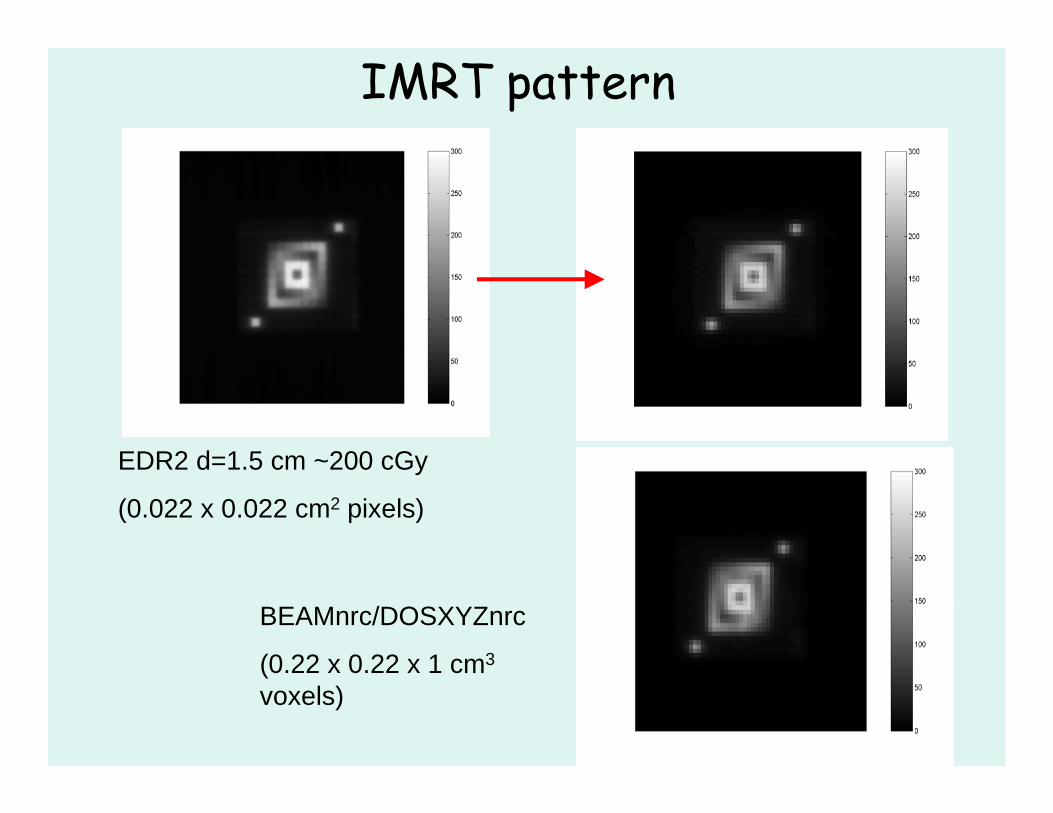
EDR2 d=1.5 cm ~200 cGy
(0.022 x 0.022 cm2 pixels)
BEAMnrc/DOSXYZnrc
(0.22 x 0.22 x 1 cm3
voxels)
IMRT pattern
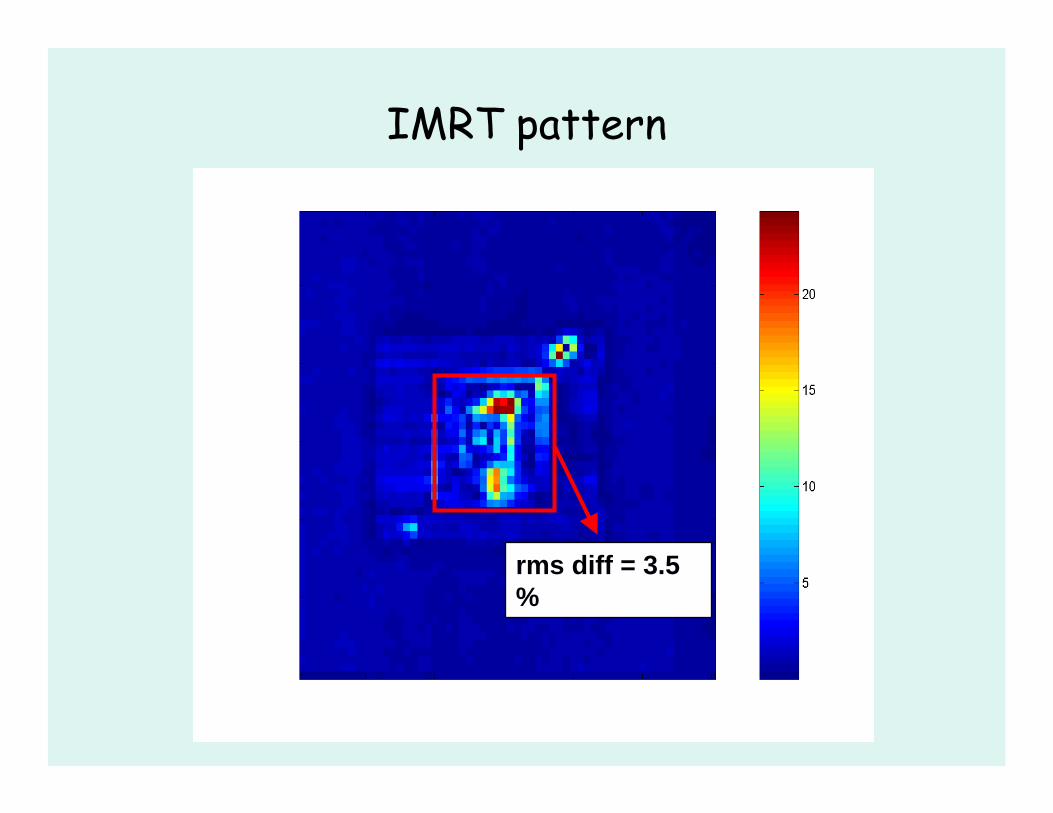
IMRT pattern
rms diff = 3.5 %
AAPM Summer School, 2006 66
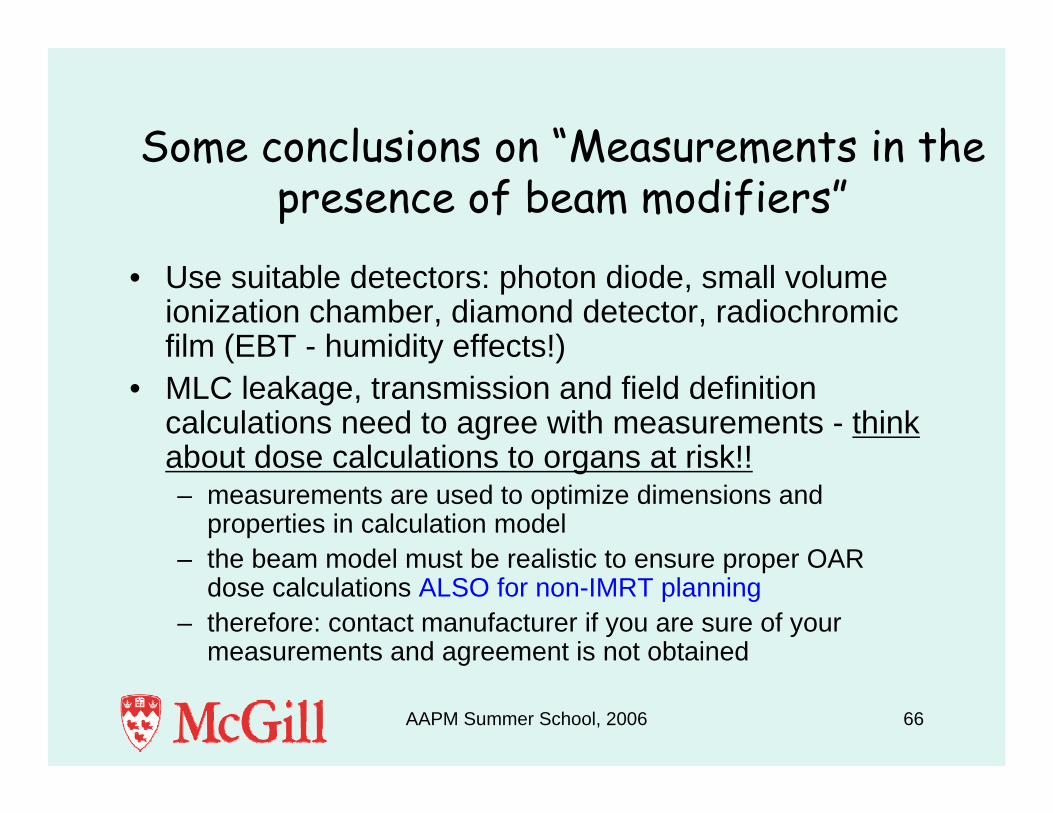
Some conclusions on “Measurements in the presence of beam modifiers”
• Use suitable detectors: photon diode, small volume ionization chamber, diamond detector, radiochromic film (EBT - humidity effects!)
• MLC leakage, transmission and field definition calculations need to agree with measurements - think about dose calculations to organs at risk!!– measurements are used to optimize dimensions and
properties in calculation model– the beam model must be realistic to ensure proper OAR
dose calculations ALSO for non-IMRT planning– therefore: contact manufacturer if you are sure of your
measurements and agreement is not obtained

AAPM Summer School, 2006 67
In-phantom measurements to verify dose calculation accuracy
• Assuming beam models have been verified and found accurate, inherent dose calculation accuracy in patient or phantom may be compromised by implementation issues such as:– voxel-to-region alignment, voxel sizes– CT - interaction coefficient conversion– runtime limitations, smoothing options
• Verification is needed in heterogeneous phantoms– simple, slab-based phantoms– more complex heterogeneous phantoms
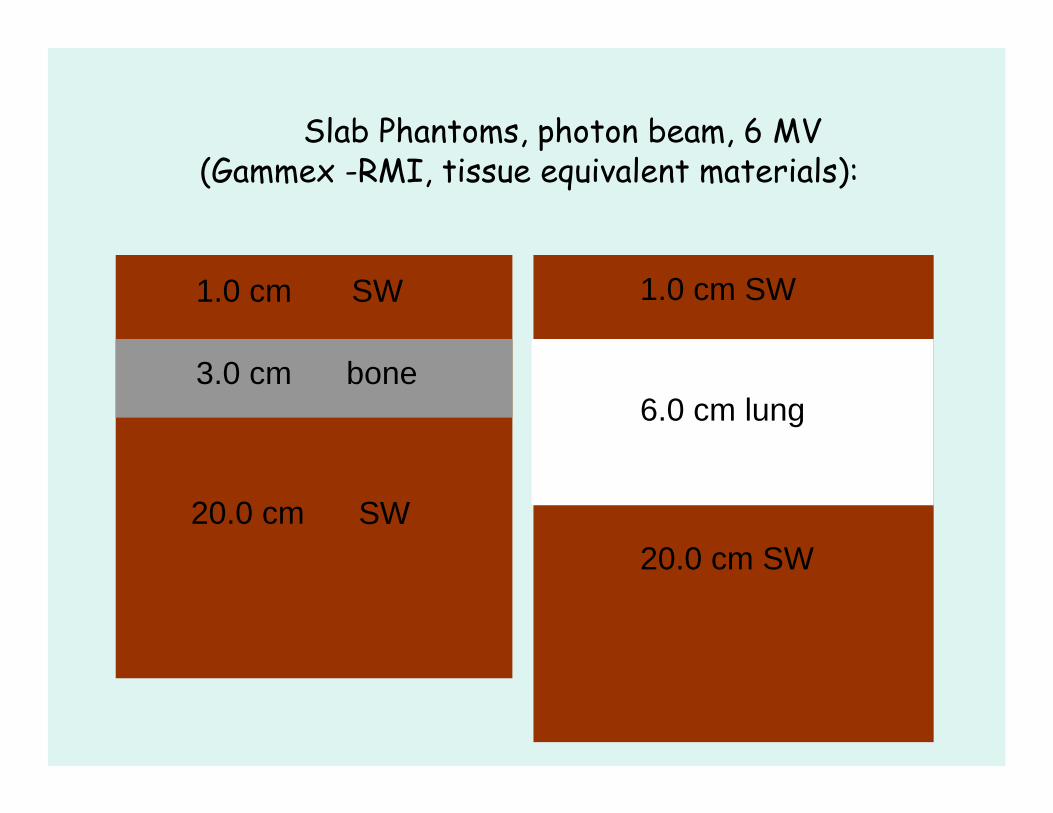
Slab Phantoms, photon beam, 6 MV(Gammex -RMI, tissue equivalent materials):
1.0 cm
3.0 cm
20.0 cm
SW
SW
bone
1.0 cm SW
6.0 cm lung
20.0 cm SW
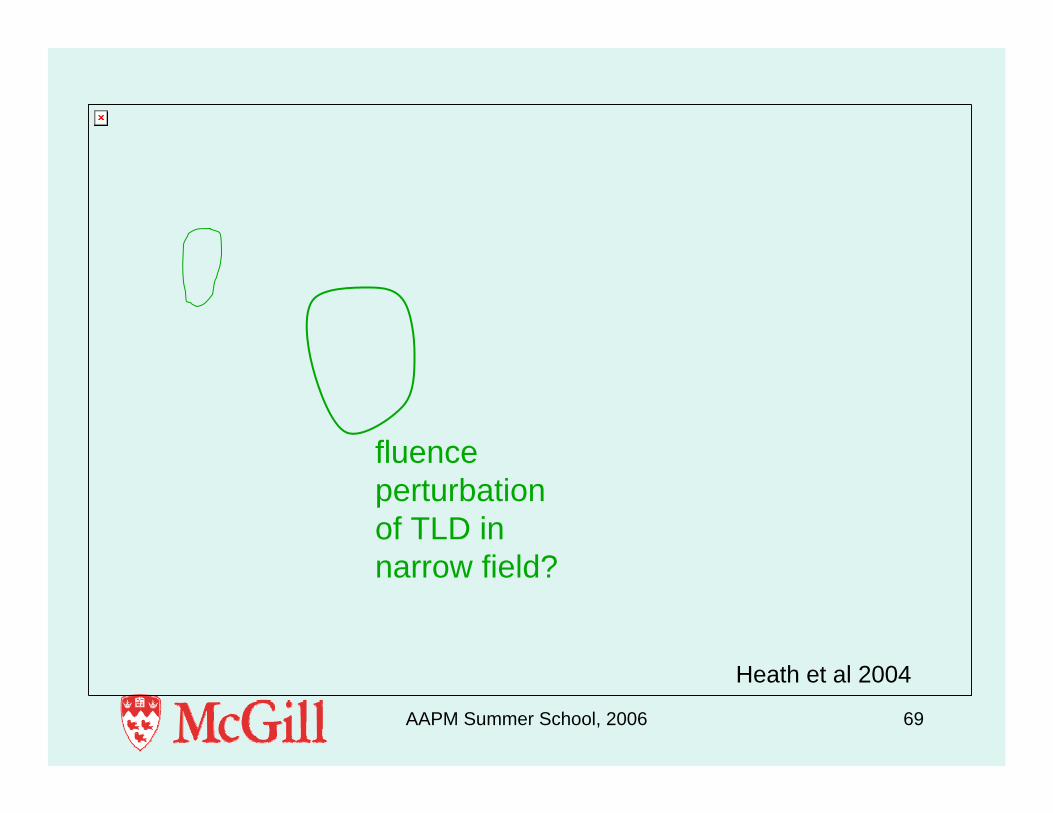
AAPM Summer School, 2006 69
fluence perturbationof TLD in narrow field?
Heath et al 2004
AAPM Summer School, 2006 70
Heath et al 2004
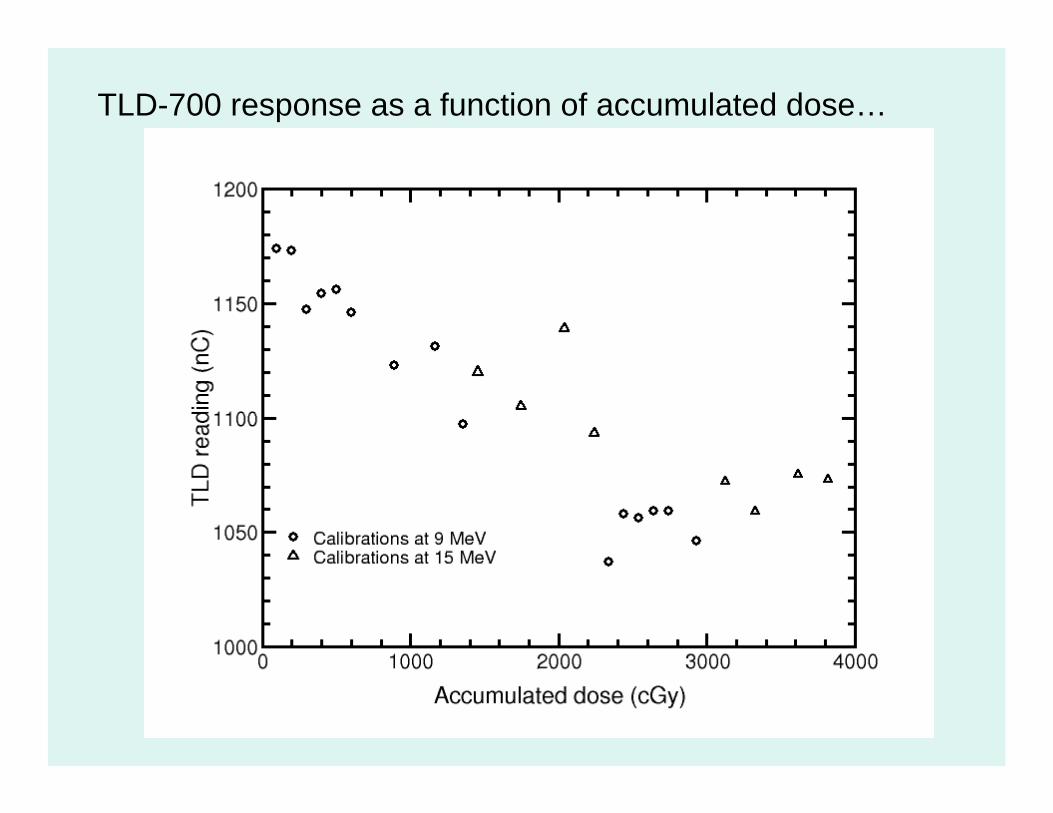
TLD-700 response as a function of accumulated dose…
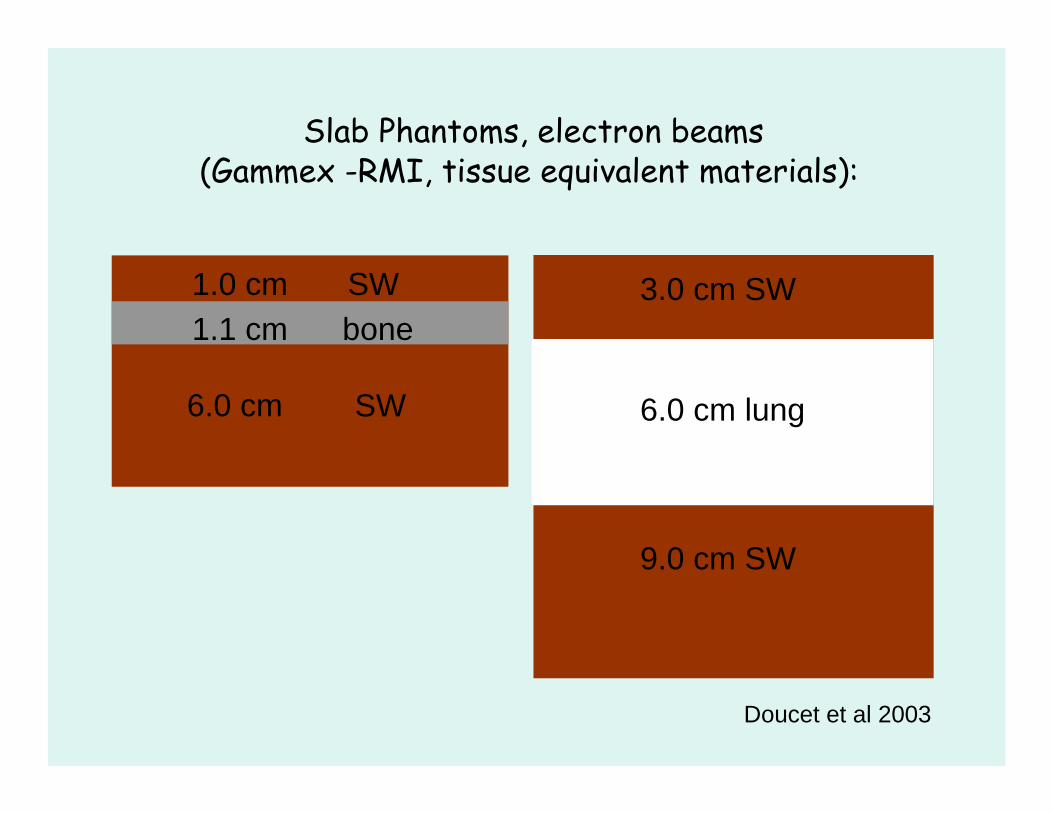
Slab Phantoms, electron beams(Gammex -RMI, tissue equivalent materials):
1.0 cm1.1 cm
6.0 cm
SW
SW
bone3.0 cm SW
6.0 cm lung
9.0 cm SW
Doucet et al 2003

15 MeV electrons
Doucet et al 2003
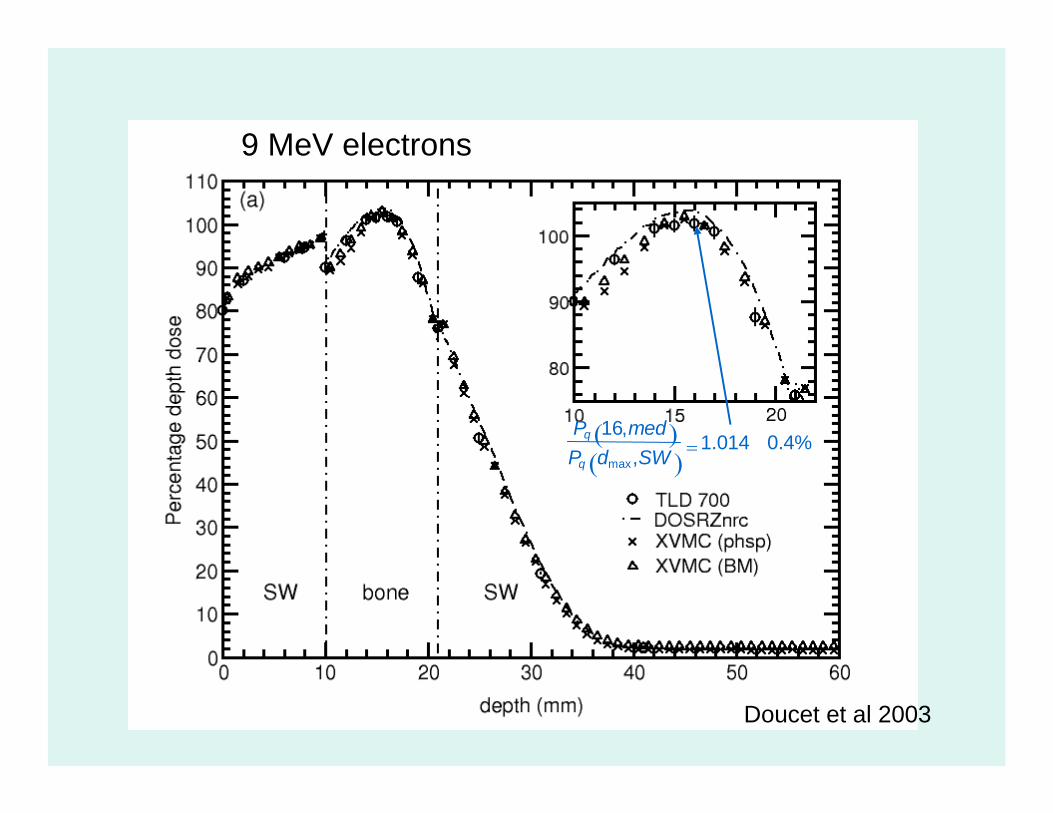
( )( )
=max
16,1.014 0.4%
,q
q
P medP d SW
9 MeV electrons
Doucet et al 2003

15 MeV electrons
Doucet et al 2003
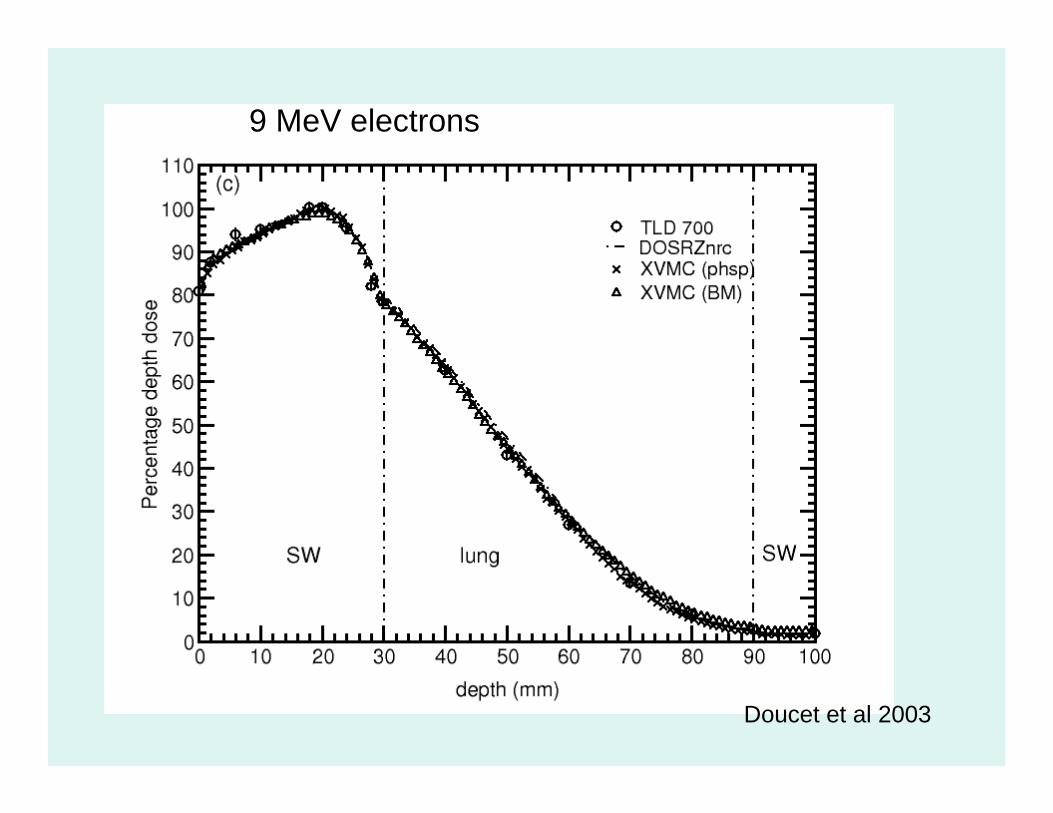
9 MeV electrons
Doucet et al 2003
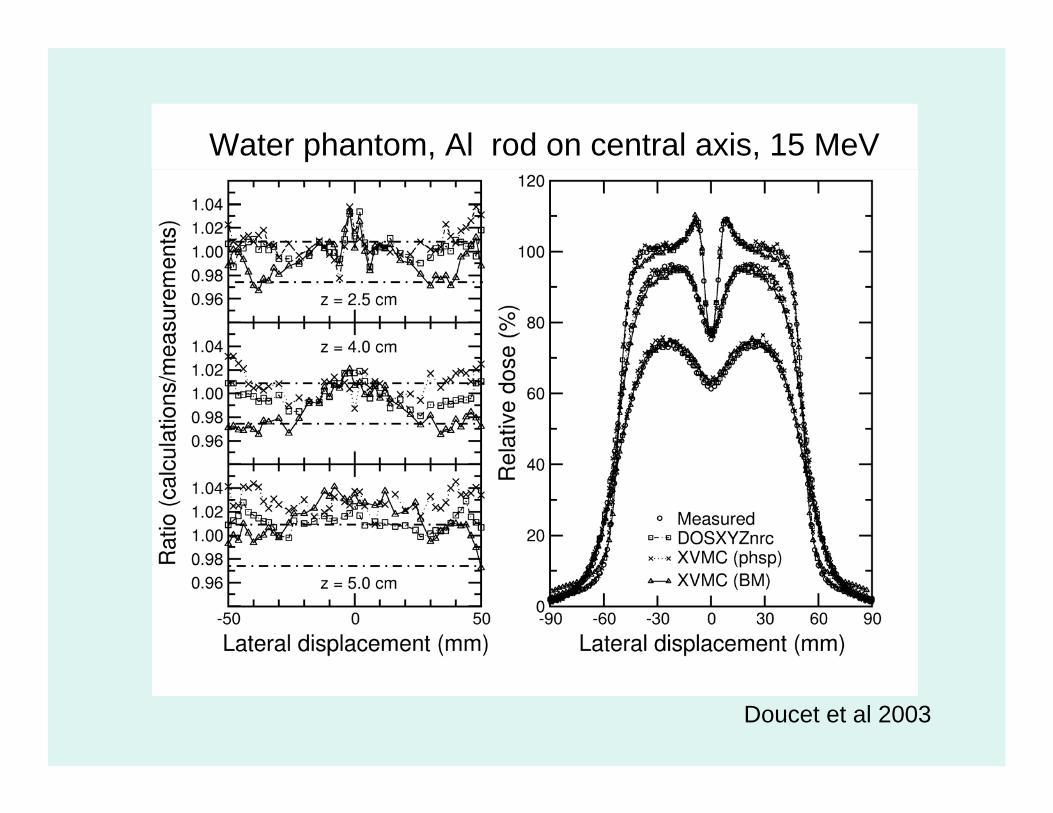
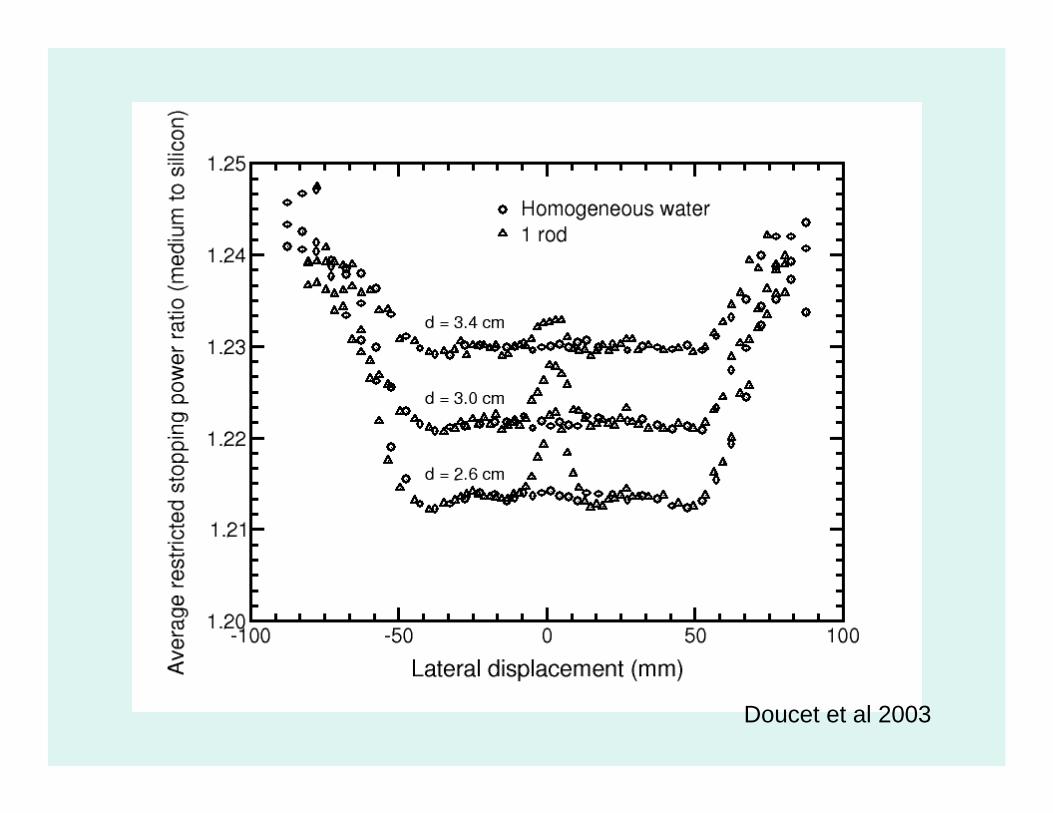
Water phantom, Al rod on central axis, 15 MeV
Doucet et al 2003
Doucet et al 2003
AAPM Summer School, 2006 79
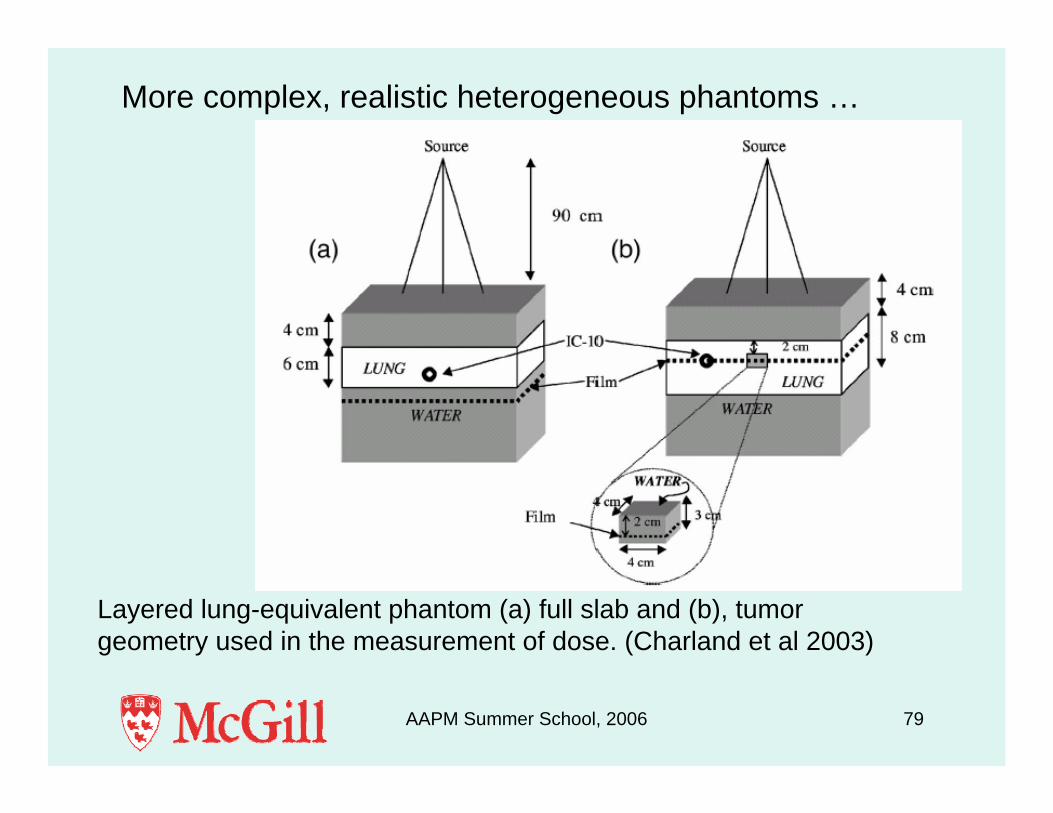
Layered lung-equivalent phantom (a) full slab and (b), tumorgeometry used in the measurement of dose. (Charland et al 2003)
More complex, realistic heterogeneous phantoms …
AAPM Summer School, 2006 80
example detector locations
(a)
Spinal cord
Air-equivalent trachea
Tissue –equivalent tumor
Air –equivalent sinus
Bone-equivalent Cheek bone hard bone-
equiv.
~ 15 cm
air-equiv.
tissue-equiv.
tissue-equiv.
soft-bone equiv.
(b)
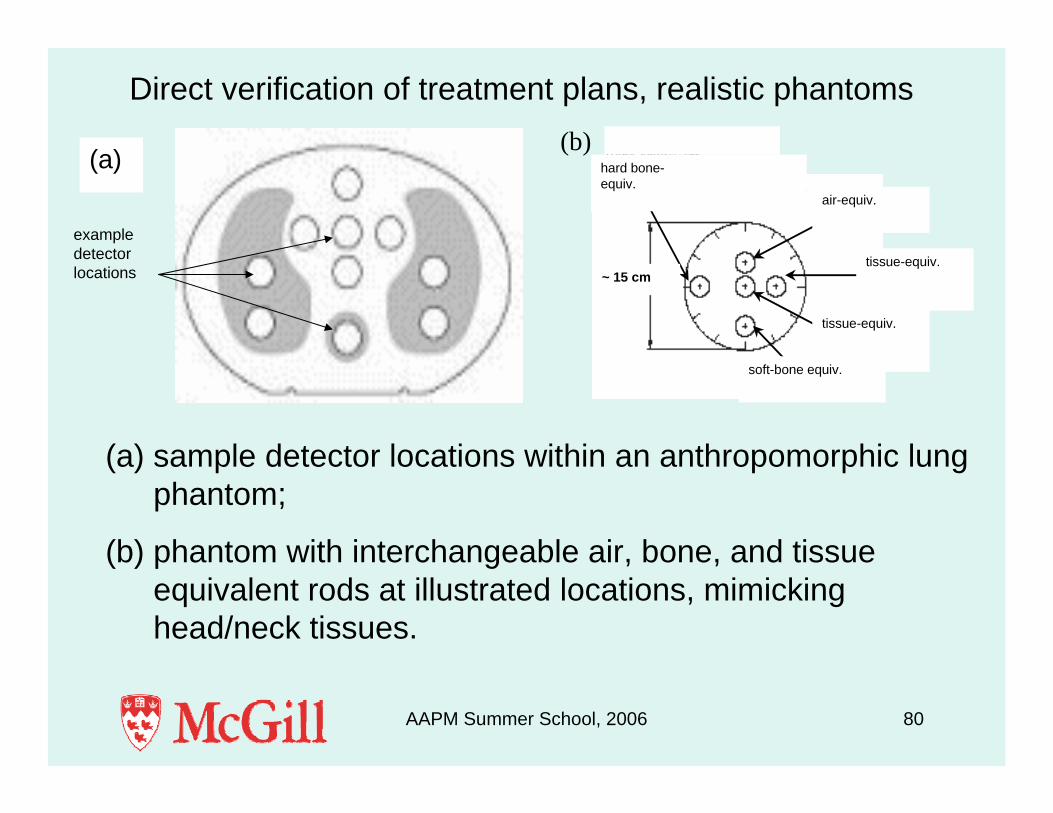
(a) sample detector locations within an anthropomorphic lung phantom;
(b) phantom with interchangeable air, bone, and tissue equivalent rods at illustrated locations, mimicking head/neck tissues.
Direct verification of treatment plans, realistic phantoms
AAPM Summer School, 2006 81
Conclusions• Measurement issues are an important component of
commissioning and verification of a MC TP system.• The user of an MC-based TP system must be aware of
complications in measurements in non-equilibrium situations.• Suitability of detectors for a given purpose must be assessed
when planning system accuracy in these regions is at stake.• MC planning has the potential to be dosimetrically superior to
conventional planning systems especially in dose estimations for OAR’s -> BUT: to this end, extra validation is needed.
• Commissioning and verification should also carefully deal with the other components of the implementation such as CT to interaction coefficient conversion procedure, voxel statistics, smoothing functions, etc all of which are specific to MC planning systems.

AAPM Summer School, 2006 82
Acknowledgments
• Students: Emily Heath, Kristin Stewart, Khalid Al-Yahya, Keyvan Jabbari, Andrew Alexander, Adam Elliott
• Post-doc: Gabriela Stroian• Staff: Frank Verhaegen, Wamied Abdel-Rahman, Slobodan
Devic, Ervin Podgorsak, Michael Evans, William Parker• Funding (operating): Canadian Inst. Health Research (CIHR),
National Cancer Inst. Canada (NCIC), Natural Sciences and Engineering Research Council (NSERC)