measurement of gas natural by coriolis meter
TRANSCRIPT

This report is the property of AGA and is part of its process to create a new recommended practice. This document or any of its parts shall not be copied, disseminated, cited in literature, presentations or discussions by persons other than members of the American Gas Association (AGA) and American Petroleum Institute (API) who are part of its creation process without prior approval from AGA.
AGA TRANSMISSION MEASUREMENT COMMITTEE - DRAFT REPORT NO. 11 Aug 22, 2010
1 of 84
DRAFT for Ballot
March 2011
Measurement of Natural Gas by Coriolis Meter
TRANSMISSION MEASUREMENT COMMITTEE DRAFT AGA REPORT NO. 11 (API MPMS14.9)

This report is the property of AGA and is part of its process to create a new recommended practice. This document or any of its parts shall not be copied, disseminated, cited in literature, presentations or discussions by persons other than members of the American Gas Association (AGA) and American Petroleum Institute (API) who are part of its creation process without prior approval from AGA.
AGA TRANSMISSION MEASUREMENT COMMITTEE - DRAFT REPORT NO. 11 Aug 22, 2010
2 of 84
FOREWORD (To be rewritten by AGA) This report is published as a recommended practice and is not issued as a standard. It has been written in the form of a performance-based specification. Coriolis meters shall meet or exceed the function, accuracy, and testing requirements specified in this report and designers shall follow the applicable installation recommendations. Methods for verifying a meter’s accuracy and/or applying a Flow Weighted Mean Error (FWME) correction factor to minimize the measurement uncertainty are contained in Appendix A - Coriolis Gas Flow Meter Calibration Issues. Depending on the design a flow calibration of each meter on a gas similar to that which it will be applied may be necessary. In order to guide the designer in the specification of a Coriolis meter, Appendix B – Coriolis Meter Data Sheet has been provided. As a reference for background information on Coriolis natural gas metering, Appendix C - AGA Engineering Technical Note XQ0112 - Coriolis Flow Measurement for Natural Gas Applications, is provided. Due to the unique principle of operation and atypical performance characteristics of Coriolis mass flow meters, in comparison to volumetric flow meters, readers who are not familiar with the technology are encouraged to read this document prior to applying the general concepts and guidelines of this report. This report offers general criteria for the measurement of natural gas by Coriolis meters. It is the cumulative result of years of experience of many individuals and organizations acquainted with measuring gas flow rate and/or the practical use of Coriolis meters for gas measurement. Changes to this report may become necessary from time to time. When any revisions are deemed advisable, recommendations should be forwarded to: Operating Section, American Gas Association, 400 North Capitol Street, NW, 4th Floor, Washington, DC 2001, U.S.A. (A form is included for that purpose at the end of this report.)
This report is the property of AGA and is part of its process to create a new recommended practice. This document or any of its parts shall not be copied, disseminated, cited in literature, presentations or discussions by persons other than members of the American Gas Association (AGA) and American Petroleum Institute (API) who are part of its creation process without prior approval from AGA.
AGA TRANSMISSION MEASUREMENT COMMITTEE - DRAFT REPORT NO. 11 Aug 22, 2010
3 of 84
ACKNOWLEDGEMENTS
Report No. 11, Measurement of Gas by Coriolis Meters, was developed by a Transmission Measurement Committee (TMC) task group, chaired by Angela Floyd, ConocoPhillips. Subsequently, a special subcommittee of the task group was formed to assemble technical information, compose drafts of the report, evaluate and resolve comments received through balloting, and prepare a final report.
(To be added by AGA)

This report is the property of AGA and is part of its process to create a new recommended practice. This document or any of its parts shall not be copied, disseminated, cited in literature, presentations or discussions by persons other than members of the American Gas Association (AGA) and American Petroleum Institute (API) who are part of its creation process without prior approval from AGA.
AGA TRANSMISSION MEASUREMENT COMMITTEE - DRAFT REPORT NO. 11 Aug 22, 2010
4 of 84
This report is the property of AGA and is part of its process to create a new recommended practice. This document or any of its parts shall not be copied, disseminated, cited in literature, presentations or discussions by persons other than members of the American Gas Association (AGA) and American Petroleum Institute (API) who are part of its creation process without prior approval from AGA.
AGA TRANSMISSION MEASUREMENT COMMITTEE - DRAFT REPORT NO. 11 Aug 22, 2010
5 of 84
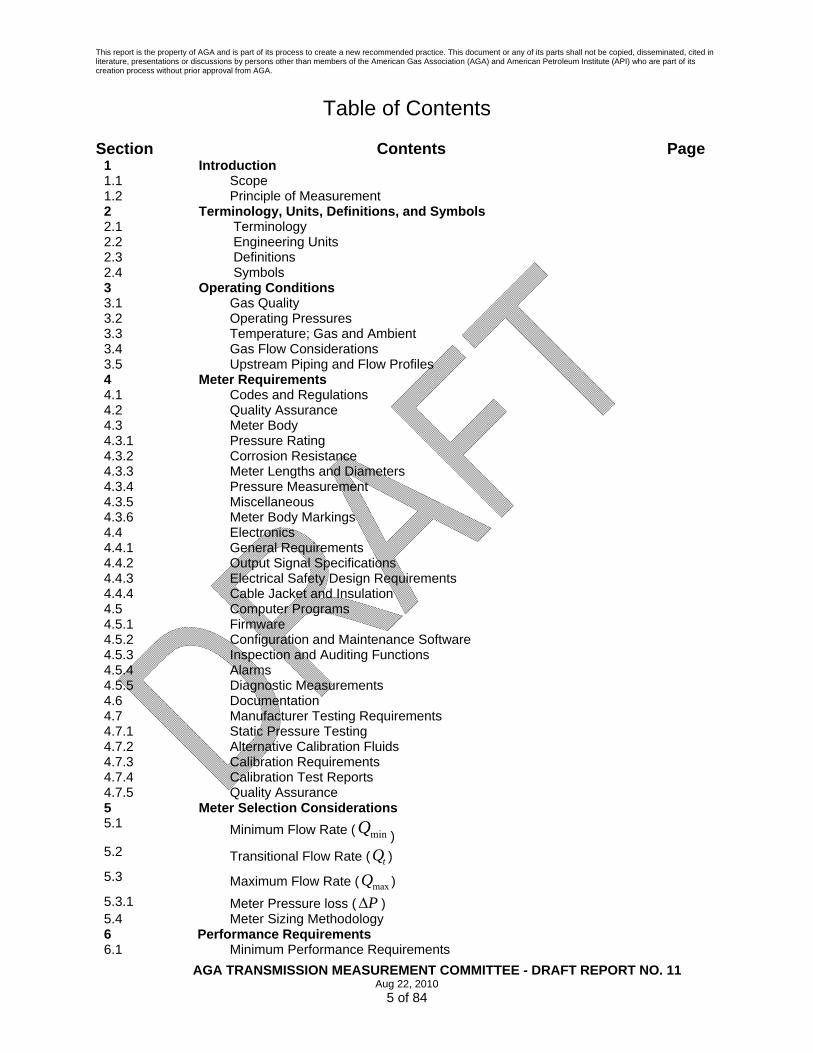
Table of Contents
Section Contents Page 1 Introduction 1.1 Scope 1.2 Principle of Measurement 2 2.1 2.2 2.3 2.4
Terminology, Units, Definitions, and Symbols Terminology Engineering Units Definitions Symbols
3 Operating Conditions 3.1 Gas Quality 3.2 Operating Pressures 3.3 Temperature; Gas and Ambient 3.4 Gas Flow Considerations 3.5 Upstream Piping and Flow Profiles 4 Meter Requirements 4.1 4.2
Codes and Regulations Quality Assurance
4.3 Meter Body 4.3.1 Pressure Rating 4.3.2 Corrosion Resistance 4.3.3 Meter Lengths and Diameters 4.3.4 Pressure Measurement 4.3.5 Miscellaneous 4.3.6 Meter Body Markings 4.4 Electronics 4.4.1 General Requirements 4.4.2 Output Signal Specifications 4.4.3 Electrical Safety Design Requirements 4.4.4 Cable Jacket and Insulation 4.5 Computer Programs 4.5.1 Firmware 4.5.2 Configuration and Maintenance Software 4.5.3 Inspection and Auditing Functions 4.5.4 Alarms 4.5.5 Diagnostic Measurements 4.6 Documentation 4.7 4.7.1
Manufacturer Testing Requirements Static Pressure Testing
4.7.2 Alternative Calibration Fluids 4.7.3 Calibration Requirements 4.7.4 Calibration Test Reports 4.7.5 Quality Assurance 5 Meter Selection Considerations 5.1 Minimum Flow Rate ( minQ )
5.2 Transitional Flow Rate ( tQ )
5.3 Maximum Flow Rate ( maxQ )
5.3.1 Meter Pressure loss ( PΔ ) 5.4 Meter Sizing Methodology 6 Performance Requirements 6.1 Minimum Performance Requirements
This report is the property of AGA and is part of its process to create a new recommended practice. This document or any of its parts shall not be copied, disseminated, cited in literature, presentations or discussions by persons other than members of the American Gas Association (AGA) and American Petroleum Institute (API) who are part of its creation process without prior approval from AGA.
AGA TRANSMISSION MEASUREMENT COMMITTEE - DRAFT REPORT NO. 11 Aug 22, 2010
6 of 84
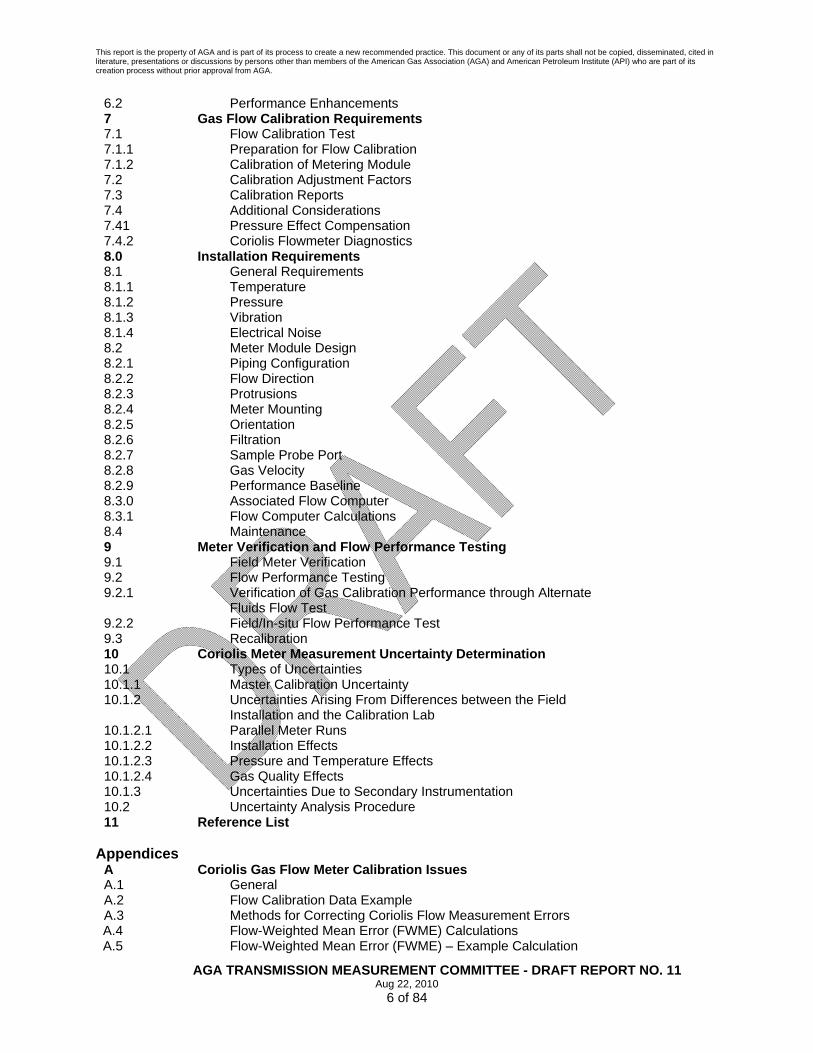
6.2 Performance Enhancements 7 7.1 7.1.1 7.1.2 7.2 7.3 7.4 7.41
Gas Flow Calibration Requirements Flow Calibration Test Preparation for Flow Calibration Calibration of Metering Module Calibration Adjustment Factors Calibration Reports Additional Considerations Pressure Effect Compensation
7.4.2 Coriolis Flowmeter Diagnostics 8.0 Installation Requirements 8.1 General Requirements 8.1.1 Temperature 8.1.2 Pressure 8.1.3 Vibration 8.1.4 Electrical Noise 8.2 Meter Module Design 8.2.1 Piping Configuration 8.2.2 Flow Direction 8.2.3 Protrusions 8.2.4 Meter Mounting 8.2.5 Orientation 8.2.6 8.2.7 8.2.8 8.2.9 8.3.0 8.3.1
Filtration Sample Probe Port Gas Velocity Performance Baseline Associated Flow Computer Flow Computer Calculations
8.4 Maintenance 9 Meter Verification and Flow Performance Testing 9.1 Field Meter Verification 9.2 Flow Performance Testing 9.2.1 Verification of Gas Calibration Performance through Alternate
Fluids Flow Test
9.2.2 Field/In-situ Flow Performance Test 9.3 Recalibration 10 10.1 10.1.1 10.1.2 10.1.2.1 10.1.2.2 10.1.2.3 10.1.2.4 10.1.3 10.2 11
Coriolis Meter Measurement Uncertainty Determination Types of Uncertainties Master Calibration Uncertainty Uncertainties Arising From Differences between the Field Installation and the Calibration Lab Parallel Meter Runs Installation Effects Pressure and Temperature Effects Gas Quality Effects Uncertainties Due to Secondary Instrumentation Uncertainty Analysis Procedure
Reference List
Appendices
A Coriolis Gas Flow Meter Calibration Issues A.1 General A.2 Flow Calibration Data Example A.3 Methods for Correcting Coriolis Flow Measurement Errors A.4 Flow-Weighted Mean Error (FWME) Calculations A.5 Flow-Weighted Mean Error (FWME) – Example Calculation

This report is the property of AGA and is part of its process to create a new recommended practice. This document or any of its parts shall not be copied, disseminated, cited in literature, presentations or discussions by persons other than members of the American Gas Association (AGA) and American Petroleum Institute (API) who are part of its creation process without prior approval from AGA.
AGA TRANSMISSION MEASUREMENT COMMITTEE - DRAFT REPORT NO. 11 Aug 22, 2010
7 of 84
B Coriolis Meter Data Sheet C AGA Engineering Tech Note on Coriolis Flow Measurement for
Natural Gas Applications
D Examples of Overall Measurement Uncertainty Calculations – Coriolis Meter
D.1 General D.2 Mathematical Model D.3 Contributory Variances D.3.1 Uncertainty in the Mass Flow Rate D.3.2 Uncertainty in Flow Pressure Effect Compensation Factor ( pF )
D.3.3 Uncertainty in the Determination of Base Density ( bρ ) D.4 Combined Uncertainty D.5 Expanded Uncertainty E AGA11 Measurement System E.1 Coriolis Measurement System E.2 Transmitter to Flow Computer Interface E.2.1 Unidirectional Discrete I/O Interface E.2.2 Bidirectional Communications Interface E.3 Transmitter E.3.1 Transmitter Flow Calculations E.3.2 Transmitter Algorithms and Variables of Metrological Interest E.4 Flow Computer Measurement Methods E.4.1 Flow Computer Calculations E.4.2 Sampling Rate E.4.3 No Flow Cut Off E.4.4 Quantity Calculation Period (QCP) E.4.5 Average Value Determination for Live Inputs E.4.6 Relative Density, Density, Heating Value, and Composition E.4.7 Transmitter and Flow Computer Measurement Record E.4.7.1 Coriolis Measurement System Configuration Record/Log E.4.7.2 Event Record / Log E.4.7.3 Data Record E.5 Alternate Method E.5.1 Alternate Method for Computing Flow and the Recording of
Measurement Data using Constant Gravity or Base Density
E.5.2 Data Record E.6 Recalculation Methods F Coriolis Sizing Equations F.1 General F.2 Sizing Example F.3 Calculation of Flow Rate Based on Pressure Drop F.4 Calculation of Pressure Drop Based on Flow Rate F.5 Calculation of Accuracy at Flow Rate F.6 Calculation of Velocity at Flow Rate

This report is the property of AGA and is part of its process to create a new recommended practice. This document or any of its parts shall not be copied, disseminated, cited in literature, presentations or discussions by persons other than members of the American Gas Association (AGA) and American Petroleum Institute (API) who are part of its creation process without prior approval from AGA.
AGA TRANSMISSION MEASUREMENT COMMITTEE - DRAFT REPORT NO. 11 Aug 22, 2010
8 of 84
1 INTRODUCTION
1.1 Scope This report was developed as a recommended practice for the specification, calibration, installation, operation, maintenance, and verification of Coriolis flow meters used for natural gas flow measurement. Coriolis meters infer mass flow rate by measuring tube displacement resulting from the Coriolis effect. The scope of this document is limited to the measurement of natural gas and associated hydrocarbon gases either as pure hydrocarbon, as a mixture of pure hydrocarbons, and diluents. Although not within the scope of this document, Coriolis meters are used to measure a broad range of compressible fluids (gases), other than natural gas. The flowing density of a gas as indicated by a Coriolis meter is not of sufficient accuracy to be used to for the purpose of inferring flowing volume of gas from mass and shall not be used for this purpose. This report applies to Coriolis meters used in natural gas applications. Typical applications include measuring single-phase gas flow found in production, process, transmission, storage, distribution, and end-use fuel measurement systems.
1.2 Principle of Measurement Coriolis meters operate on the principle of the bending force known as the Coriolis force (named after the French mathematician Gustave-Gaspard de Coriolis). When a fluid particle inside a rotating body moves in a direction toward or away from a center of rotation, that particle generates an inertial force (known as the Coriolis force) that acts on the body. In the case of a Coriolis flow meter, the body is a tube through which fluid flows. Coriolis meters create a rotating motion by vibrating the tube or tubes through which the fluid flows. Coriolis meters have the ability to measure flow in either direction with comparable measurement accuracy. The inertial force that results is proportional to the mass flow rate. Numerical calculation techniques utilizing the calculated base density of the gas are used to convert the measured mass flow rate into standard volumetric flow rate.
2 TERMINOLOGY, UNITS, DEFINITIONS, AND SYMBOLS
For the purposes of this report, the following terminology, definitions, and units apply.
This report is the property of AGA and is part of its process to create a new recommended practice. This document or any of its parts shall not be copied, disseminated, cited in literature, presentations or discussions by persons other than members of the American Gas Association (AGA) and American Petroleum Institute (API) who are part of its creation process without prior approval from AGA.
AGA TRANSMISSION MEASUREMENT COMMITTEE - DRAFT REPORT NO. 11 Aug 22, 2010
9 of 84
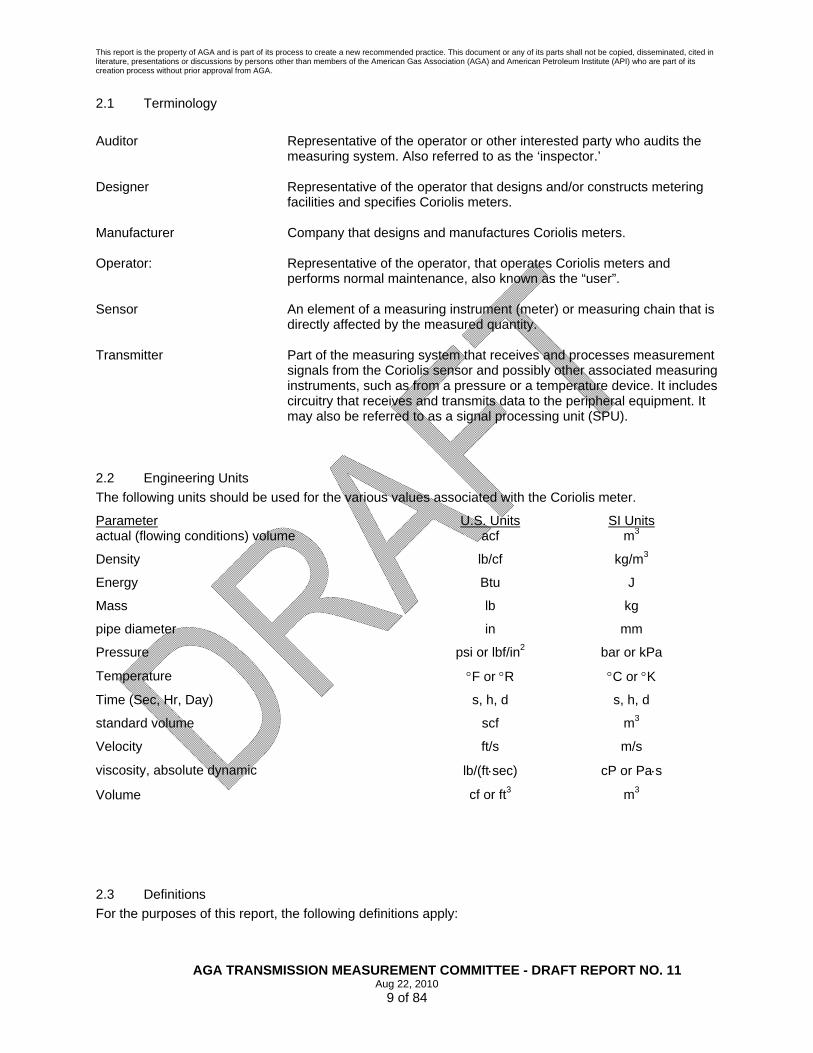
2.1 Terminology Auditor Representative of the operator or other interested party who audits the
measuring system. Also referred to as the ‘inspector.’ Designer Representative of the operator that designs and/or constructs metering
facilities and specifies Coriolis meters. Manufacturer Company that designs and manufactures Coriolis meters. Operator: Representative of the operator, that operates Coriolis meters and
performs normal maintenance, also known as the “user”. Sensor An element of a measuring instrument (meter) or measuring chain that is
directly affected by the measured quantity. Transmitter Part of the measuring system that receives and processes measurement
signals from the Coriolis sensor and possibly other associated measuring instruments, such as from a pressure or a temperature device. It includes circuitry that receives and transmits data to the peripheral equipment. It may also be referred to as a signal processing unit (SPU).
2.2 Engineering Units The following units should be used for the various values associated with the Coriolis meter.
Parameter U.S. Units SI Units actual (flowing conditions) volume acf m3
Density lb/cf kg/m3
Energy Btu J
Mass lb kg
pipe diameter in mm
Pressure psi or lbf/in2 bar or kPa
Temperature °F or °R °C or °K
Time (Sec, Hr, Day) s, h, d s, h, d
standard volume scf m3
Velocity ft/s m/s
viscosity, absolute dynamic lb/(ft⋅sec) cP or Pa⋅s
Volume cf or ft3 m3
2.3 Definitions For the purposes of this report, the following definitions apply:
This report is the property of AGA and is part of its process to create a new recommended practice. This document or any of its parts shall not be copied, disseminated, cited in literature, presentations or discussions by persons other than members of the American Gas Association (AGA) and American Petroleum Institute (API) who are part of its creation process without prior approval from AGA.
AGA TRANSMISSION MEASUREMENT COMMITTEE - DRAFT REPORT NO. 11 Aug 22, 2010
10 of 84
Accuracy: The degree to which an indicated value matches the actual value (or recognized reference value) of a measured variable
Allowable Pressure Drop: The differential pressure available for consumption by the metering
module without affecting the measuring system’s performance as specified by the designer.
Ancillary device: A device intended to perform a particular function, directly involved in
elaborating, transmitting or displaying measurement results. Main ancillary devices are: - Repeat indicating device - Printing device - Memory device - Totalizing indicating device - Conversion device (An ancillary device may be integrated into the transmitter (e.g. flow computer or calculator), into the meter, or may be linked to the transmitter by means of an interface)
Application Gas A gas of known physical properties which will be measured Base conditions: Contractually specified pressure and temperature. Baseline: Clearly defined starting point (point of departure) from where
implementation begins Calibration: Adjustment of a MUT’s output to a reference Calibration factor: Manufacturer flow calibration scalars that are applied to the meter’s
output(s) value to adjust the output(s) value(s) to the as-built performance (i.e. zero, span, linearity, etc.) of the sensor.
Confidence Level The degree of confidence, expressed as a percent, that the true value
lies within the stated uncertainty. For example: A proper uncertainty statement would read: " mQ =500 lb/h ±1.0% at a 95% level of confidence". This means that 95 out of every 100 observations are between 495 and 505 lb/h.
Compressibility: A factor calculated by taking the ratio of the actual volume of a given
mass of gas at a specified temperature and pressure to its volume calculated from the ideal gas law at the same conditions.
Discrete Error Value: An estimate of error for an individual measurement, expressed in
“percent of reading” or in engineering units. Drift A slow change of a metrological characteristic of a measuring
instrument. Drive signal: An electrical signal produced by the Transmitter to initiate and maintain
cyclic vibration of the sensor (measuring transducer) flow tube(s). Error: The difference between a measured value and the ‘true’ value of a
measured quantity. (Note: The ‘true’ value cannot usually be determined. In practice, a conventional recognized ‘standard’ or ‘reference’ value is typically used instead.)

This report is the property of AGA and is part of its process to create a new recommended practice. This document or any of its parts shall not be copied, disseminated, cited in literature, presentations or discussions by persons other than members of the American Gas Association (AGA) and American Petroleum Institute (API) who are part of its creation process without prior approval from AGA.
AGA TRANSMISSION MEASUREMENT COMMITTEE - DRAFT REPORT NO. 11 Aug 22, 2010
11 of 84
Flow-influencing device: An element or device, other than ancillary, which could have an influence
on the measurement of the measured quantity. The main flow-influencing devices are: - Filter - Branch or by-pass line - Valves - Pressure reducing devices located upstream or downstream of the flow
sensor - Piping characteristics
Flow Pressure Effect: The effect on accuracy when measuring mass flow at an operating
pressure that differs from the calibration pressure Flow Pressure Effect Compensation Factor: A factor that adjusts mass flow for operating line pressure. Flow tube(s): The sensing element (measuring transducer) through which the gas
flows. Flow weighted mean error: The calculation of the FWME of a meter from actual flow test data is a
method of calibrating a meter when only a single correction factor correction is applied to the meter output. FWME is only one of many techniques for adjustment of a Coriolis meter calibration to minimize the flow measurement uncertainty of the meter. Note: FWME is calculated per equation (A.1) in Appendix A.
Influence quantity: A quantity that is not the measured quantity but that affects the result of
the measurement. Installation effect: Any difference in performance of a component or the measuring system
arising between the calibration under ideal conditions and actual conditions of use. This difference may be caused by different flow conditions due to velocity profile, perturbations, or by different working regimes (pulsation, intermittent flow, alternating flow, vibrations, etc.).
Maximum peak-to-peak error: The largest allowable difference between the upper-most error point and
the lower-most error point as shown in Figure 6.1 and Section 6.4. This applies to all mean error values in the flow rate range between tQ and
maxQ .
Maximum permissible error: (MPE), The extreme error of a meter’s indicated value in percent of the
reference value it is compared to. (See Section 7.1) Mean error: The arithmetic mean of all the observed errors or data points for a given
flow rate. Measuring system: A system that includes the metering module and all the ancillary devices. Measuring transducer: A device that provides an output quantity having a determined
relationship to the input quantity.

This report is the property of AGA and is part of its process to create a new recommended practice. This document or any of its parts shall not be copied, disseminated, cited in literature, presentations or discussions by persons other than members of the American Gas Association (AGA) and American Petroleum Institute (API) who are part of its creation process without prior approval from AGA.
AGA TRANSMISSION MEASUREMENT COMMITTEE - DRAFT REPORT NO. 11 Aug 22, 2010
12 of 84
Measurement uncertainty: Parameter associated with the result of a measurement that characterizes the dispersion of the values that could reasonably be attributed to the measured quantity.
Meter: A measurement instrument comprised of the sensor, measuring
transducers, and transmitter intended to measure continuously, memorize, and display the volume or mass of gas passing through the sensor at metering conditions. Note: The display may be a remote indicating device.
Meter factor: A scalar factor ( F ) that may be applied to the meter’s output(s) value(s)
to change the output(s) value(s) by a constant percentage at all flow rates ( iQ ), compensating for systematic error.
Meter sensor: Mechanical assembly consisting of vibrating flow tube(s), drive system,
flow tube position sensors, process connections/flanges, flow manifolds, supporting structure, and housing
Metering conditions: The conditions of the gas, at the point of measurement, which the flow
rate is measured, (temperature, pressure, composition, and flow rate of the measured gas).
Metering module: The subassembly of a measuring system, which includes the sensor
and all other devices (i.e. flow conditioners, straight pipe, and/or metering tubes) required to ensure correct measurement of the measuring system’s gas circuit.
MUT Acronym for “Meter Under Test” No flow cut off A flow rate below which any indicated flow by the meter is considered to
be invalid and indicated flow output is set to zero. (Historically referred to as low flow cut-off)
Operating range: The range of ambient conditions, gas temperature, gas pressure, and
gas flow rate over which a meter is designed to operate accurately. Performance test: A test intended to verify whether the measuring equipment under test is
capable of accomplishing its intended functions. Pickoff: Electrical devices mounted at the inlet and outlet of the flow tube(s) that
create signals due to the cyclic vibration of the sensor (measuring transducer). The signals are used by the transmitter to determine the magnitude of the Coriolis force and maintain the cyclic vibration of the flow tube(s).
Pressure loss: Permanent pressure reduction across or through any device, vessel, or
length of pipe within a flowing stream. Reference: A meter or test facility that is traceable to a recognized national or
international measurement standard. Reference Gas A gas of known physical properties used as a reference; e.g. air. Repeatability: (when discrete error values are given) - The closeness of agreement
between successive flow rate measurements when obtained under the
This report is the property of AGA and is part of its process to create a new recommended practice. This document or any of its parts shall not be copied, disseminated, cited in literature, presentations or discussions by persons other than members of the American Gas Association (AGA) and American Petroleum Institute (API) who are part of its creation process without prior approval from AGA.
AGA TRANSMISSION MEASUREMENT COMMITTEE - DRAFT REPORT NO. 11 Aug 22, 2010
13 of 84
same conditions. (Same fluid, same flow meter, same operator, same test facility, and the same interval of time without disconnecting or dismounting the flow meter.)
(When discrete error values are not given) – The acceptable error
tolerance within which 95% of all flow rate errors must lie, when obtained under the same conditions (Same fluid, same flow meter, same operator, same test facility, and the same interval of time without disconnecting or dismounting the flow meter.)
Turndown ratio: A numerical indication of the rangeability of a flow meter relative to
maximum and minimum flow rates, calculated as: minmax /QQ True Value: The value determined with a perfect measurement process. The true
value is always unknown because all measurement processes are imperfect to some degree
Sensor Flow Tubes: Flow conduit(s) located between the inlet and outlet manifolds that are
forced to vibrate at resonant frequency and couple with the flowing gas due to the Coriolis force.
Uncertainty An estimate of the interval bounding the measured value within which the
true value lies Uncompensated Mass The mass flow from a Coriolis meter that has not been compensated for
flow pressure effect Wetted: The surface area of the meter that is exposed to the flowing fluid; e.g.
flanges, flow manifold, flow tubes Zero Stability (ZS): The mass flow limits within which the meter ‘zero flow’ reading may drift
with no flow through the meter. This value should be constant over the operating range of the meter. (See Appendix C, Section 3.1.2.4 for more information)
2.4 Symbols
Symbol Represented Quantity
iE Flow rate error at the tested flow rate ( iQ )
icfE Adjusted error at each calibration/tested flow rate ( iQ )
F Calibration factor
pF Flow pressure effect correction factor
iFT The time interval divided by the time specified by ( tpFT ), that the meter will operate at the
tested flow rate ( iQ )
tpFT A time interval that is proportional to the meter’s life cycle in field service

This report is the property of AGA and is part of its process to create a new recommended practice. This document or any of its parts shall not be copied, disseminated, cited in literature, presentations or discussions by persons other than members of the American Gas Association (AGA) and American Petroleum Institute (API) who are part of its creation process without prior approval from AGA.
AGA TRANSMISSION MEASUREMENT COMMITTEE - DRAFT REPORT NO. 11 Aug 22, 2010
14 of 84
FWME Flow Weighted Mean Error
cg Dimensional conversion constant
rG Real gas relative density (specific gravity) of the gas flowing
mH Mass heating value
K Pressure loss coefficient
rM Molar Weight
CalP Calibration pressure
bP Pressure at base conditions (absolute)
fP Pressure at flowing conditions (absolute)
EffectP Pressure effect
maxP Maximum operating pressure
minP Minimum operating pressure
bQ Volume flow rate at base conditions
eQ Energy flow rate
iQ Actual measured flow rate passing through a meter under a specific set of test or operating conditions, expressed in mass units
fQ Volume flow rate at flowing conditions
mQ Mass flow rate
dCompensatemQ Mass flow rate compensated for flow pressure effect
tedUncompensamQ Mass flow rate uncompensated for flow pressure effect
maxQ Maximum allowable flow rate through the meter, as specified by the meter manufacturer, expressed in mass units
minQ Minimum allowable flow rate through the meter, as specified by the meter manufacturer, expressed in mass units
tQ Transitional flow rate at which the maximum permissible measurement error and peak-to-peak error limit change, expressed in mass units
R Gas constant (8.314472 J mol-1 K-1, 10.7316 psia ft3 (lbmol ˚R) -1)

This report is the property of AGA and is part of its process to create a new recommended practice. This document or any of its parts shall not be copied, disseminated, cited in literature, presentations or discussions by persons other than members of the American Gas Association (AGA) and American Petroleum Institute (API) who are part of its creation process without prior approval from AGA.
AGA TRANSMISSION MEASUREMENT COMMITTEE - DRAFT REPORT NO. 11 Aug 22, 2010
15 of 84
bT Temperature at base conditions (absolute)
fT Temperature at flowing conditions (absolute)
v Velocity of flowing gas
iWF Weighting factor for a tested flow rate ( iQ )
bZ Compressibility at base conditions
fZ Compressibility at flowing conditions
ZS Zero Stability
bρ Density at base conditions
fρ Density at flowing conditions
PΔ Pressure drop or pressure loss across meter

This report is the property of AGA and is part of its process to create a new recommended practice. This document or any of its parts shall not be copied, disseminated, cited in literature, presentations or discussions by persons other than members of the American Gas Association (AGA) and American Petroleum Institute (API) who are part of its creation process without prior approval from AGA.
AGA TRANSMISSION MEASUREMENT COMMITTEE - DRAFT REPORT NO. 11 Aug 22, 2010
16 of 84
3 OPERATING CONDITIONS
3.1 GAS QUALITY At a minimum, the meter shall operate accurately with any of the “Normal Range” natural gas composition mixtures specified in AGA Report No. 8 - Compressibility Factors of Natural Gas and Other Related Hydrocarbon Gases. This includes relative gas densities between 0.554 (pure methane) and 0.87. This document is limited to application of meters in the single phase gas flow. The designer shall examine the metering conditions and consult with the manufacturer, to identify appropriate wetted materials, if any of the following are possible:
• Operation near the hydrocarbon dew point temperature of the natural gas mixture • Total sulfur levels or other elements exceeding those specified in the National Association of
Corrosion Engineers (NACE) guidelines • Presence of halogen elements in the gas mixture; i.e., chlorine, bromine, etc.
3.2 Operating Pressures The manufacturer shall specify the maximum operating pressure. The flowing density, maximum acceptable pressure drop relative to gas flowing density (See Section 5.3.1, Equation 5.2), and desired meter performance will determine the minimum operating pressure. Therefore, the minimum operating pressure of a Coriolis sensor is application dependent. (See Section 4 – Meter Requirements for additional information.) Some Coriolis meters exhibit sensitivity to changes in operating pressure, called “flow pressure effect”, which may create a negative bias in flow rate indication at operating pressures above calibration pressure and a positive bias at operating pressures below calibration pressure. However, this effect can be compensated for by use of an average flowing pressure correction (fixed value) or variable pressure correction using an external pressure measurement device. Since this effect is design and size specific, the manufacturer shall be consulted to identify the magnitude of the pressure effect at operating conditions. (See Section 4.3.4 – Pressure Tap and Section 8.3.1 – Flow Computer Calculations for further discussion)
3.3 Temperature; Gas and Ambient Coriolis sensors should operate over a flowing gas temperature range of -40 to 200°F (-40 to 93°C). It is recommended that the flowing gas temperature remain above the hydrocarbon dew point temperature of the gas. In some designs, variations in flowing temperature and ambient temperature away from zeroing temperature may have an affect a Coriolis sensor’s zero. Manufacturers are required to specify the extent of these affects. Exposure of a Coriolis sensor to a radiant heat source, may produce an influence on the Coriolis flow sensor’s zero.
3.4 Gas Flow Considerations The manufacturer’s flow range of a specific size flow sensor is determined by the acceptable accuracy at minimum flow rate and design limitations at maximum flow rate. The maximum allowable mass flow rate specified by the manufacturer may create fluid velocities and/or pressure drops beyond acceptable levels for a particular applications. Therefore, the designer’s application of a specific size flow sensor is determined by ensuring the expected flow rate range is within the manufacturer’s meter design limitations, application requirements, and the accuracy requirements for minQ , tQ , and maxQ as stated in Section 6.1 of this report.
This report is the property of AGA and is part of its process to create a new recommended practice. This document or any of its parts shall not be copied, disseminated, cited in literature, presentations or discussions by persons other than members of the American Gas Association (AGA) and American Petroleum Institute (API) who are part of its creation process without prior approval from AGA.
AGA TRANSMISSION MEASUREMENT COMMITTEE - DRAFT REPORT NO. 11 Aug 22, 2010
17 of 84
When corrosive elements (H2O, H2S, etc.) exist in the flow stream, an oxide layer can form on the inside walls of carbon steel piping. When this condition exists, if the carbon steel piping is also subjected to high flow velocities, erosion of the oxide layer will occur. The combination of these condition based influences is the origin of operational moisture and velocity limits imposed on carbon steel piping design. Due to materials of construction (stainless steel, Hastelloys, etc.) some Coriolis designs are highly immune to corrosion caused by corrosive elements in the flow stream and the subsequent erosion that can occur when also subjected high gas flow velocities. The designer should perform an evaluation of the piping design and materials of construction addressing any corrosion and erosion concerns that may exist. (See Section 8.2.1 – Piping Configuration for further information) The designer is to examine the maximum upstream and downstream piping velocities for noise and piping safety (thermowell vibrations, etc.) considerations. (For further information on probe vibration see API MPMS Chapter 14 Part 1). Coriolis meters have the inherent ability to measure flow in either direction with equal accuracy; i.e. they are bidirectional. Research has shown some bending-mode Coriolis flow sensors to be mostly immune to error caused by flow pulsation frequencies away from the natural resonant frequency of the Coriolis meter’s flow tube(s). Coriolis flow sensors should not be installed where pulsation frequencies might excite the natural resonant frequency of the flow tube(s). Pulsations at resonant frequency may produce an error quantity, the magnitude and sign of the error is meter design specific. Flow pulsations may be caused by piping design, flow obstructions (e.g. valves, thermowells, probes, etc.), regulator valve oscillation at low flows, and reciprocating engines/compressors. The meter manufacturer shall be consulted before installing a Coriolis flow sensor where pulsations are present.
3.5 Upstream Piping and Flow Profiles Although a substantial amount of data is available on the effect of flow profile distortions caused by upstream piping, and bending-mode Coriolis meters have shown to be mostly immune to these effects, the full range of upstream piping configurations with various Coriolis sensor designs has not been studied in detail. Upstream piping configurations (i.e., various combinations of upstream fittings, valves, regulators, and lengths of straight pipe) may affect the gas velocity profile entering a Coriolis sensor to such an extent that significant flow rate measurement error results. The magnitude and sign of the measurement error, if any, will be, in part, a function of the meter’s ability to correctly compensate for such conditions. In general, research has shown that this effect is dependent on meter design, as well as the type and severity of the flow field distortion produced at the meter. Meter station designers are encouraged to gain insight into expected meter performance for given upstream piping configuration by soliciting available test results for a particular meter design from the meter manufacturer or by reviewing test data found in open literature. When installation effects test data for a particular meter design does not exist, to truly confirm meter performance, flow testing of the metering module is usually required. The designer shall consult the meter manufacturer and review the latest meter test results or verify flow-influencing device installation effects through other means (e.g., experimental evaluation, see Appendix D).
This report is the property of AGA and is part of its process to create a new recommended practice. This document or any of its parts shall not be copied, disseminated, cited in literature, presentations or discussions by persons other than members of the American Gas Association (AGA) and American Petroleum Institute (API) who are part of its creation process without prior approval from AGA.
AGA TRANSMISSION MEASUREMENT COMMITTEE - DRAFT REPORT NO. 11 Aug 22, 2010
18 of 84
4 Meter Requirements
4.1 Codes and Regulations The meter body and all other parts comprising the pressure containing structures and external electronic component enclosures, shall be designed and constructed of materials suitable for the service conditions for which the meter is rated and in accordance with applicable codes specific to the installation, as specified by the designer.
4.2 Quality Assurance The manufacturer shall establish and follow a written comprehensive quality assurance program for the production, assembly, and testing of the meter and its electronic system (ISO 9000, API Specification Q1, etc.) This quality assurance program should be available for inspection.
4.3 Meter Body
4.3.1 Pressure Rating The meter body shall meet all applicable industry codes for the installation site and other requirements specific to the application including the maximum allowable operating pressure over the temperature range. Meters should be manufactured to meet one of the common pipeline flange classes; e.g., ANSI (American National Standards Institute) Class 300, 600, 900. The maximum operating pressure of the meter shall be the lowest maximum design pressure of the wetted components of the meter including manifolds, sensor tube(s) and flanges. The pressure rating of meter case, a non-wetted component, shall be specified as appropriate for the installation and application.
4.3.2 Corrosion Resistance Wetted parts of the sensor shall be manufactured of materials compatible with natural gas and related flow stream constituents described in Section 3 of this report. All external parts of the meter should be made of a corrosion-resistant material or sealed with a corrosion-resistant coating suitable for use in environmental conditions typically found at the applicable meter installation site.
4.3.3 Meter Lengths and Diameters Manufacturers shall publish overall face-to-face length of the meter body with process connections/flanges, piping diameter and the internal diameter of Coriolis flow sensor may differ. Proper piping installation space shall be allowed for the selected meter length.
4.3.4 Pressure Measurement The location of the pressure measurement can typically be made in close proximity, either upstream or downstream, of the sensor. In an application where high turndowns are required and a high-pressure drop across the meter may exist, the designer should locate the pressure tap upstream of the sensor where line pressure will vary less. For further information, see Section 8.1.2
4.3.5 Miscellaneous The meter should be designed in such a way that permits easy and safe handling of the meter during transportation and installation. Hoisting eyelets or clearance for lifting straps should be provided.
4.3.6 Meter Body Markings Information indicating the following should be affixed to the meter body.
• Manufacturer, model number, and serial number • Purchase Order number or Shop Order Number (Optional) • Wetted material within the sensor • The meter sensor size and flange class
This report is the property of AGA and is part of its process to create a new recommended practice. This document or any of its parts shall not be copied, disseminated, cited in literature, presentations or discussions by persons other than members of the American Gas Association (AGA) and American Petroleum Institute (API) who are part of its creation process without prior approval from AGA.
AGA TRANSMISSION MEASUREMENT COMMITTEE - DRAFT REPORT NO. 11 Aug 22, 2010
19 of 84
• ANSI or equivalent rating system • Operating temperature range • Operating (gas) temperature range • Tag number • Applicable hazardous area approvals • The direction of positive or forward flow
4.4 Electronics
4.4.1 General Requirements The Coriolis transmitter is an electronics system which includes a power supply, micro computer, processing circuits for the flow sensor drive signals, signal barriers for safe installation and output circuits. The transmitter may be integrally mounted on the flow sensor or remote from the flow sensor, connected by cabling. All electronic housings shall be identified by the manufacturer The electronic system shall operate correctly over the entire range of environmental conditions specified by the meter manufacturer. It shall also be possible to replace the transmitter without change in meter performance more than the “repeatability” specified in Section 6.1, Minimum Performance Requirements. The system shall include an automatic restart function, in the event of a computer program fault or lock-up. The meter should operate at a nominal power supply voltage of 240V AC or 120V AC at 50 or 60 Hz, or from 12V DC or 24V DC power supply / battery systems, as specified by the designer.
4.4.2 Output Signal Specifications The meter should be equipped with at least one of the following outputs:
• Serial data interface; RS-232, RS-485, or equivalent • Frequency, representing flow rate
The meter may also be equipped with an analog (4-20mA) output for flow rate. The 4-20mA output shall be current regulating, similar to an industrial, two-wire pressure transmitter. A no-flow cutoff function should be provided that sets the flow rate output to zero when the indicated flow rate is below a set value. A method for differentiating forward from reverse flow shall be provided to facilitate the separate accumulation of totals by the associated flow computer(s). All outputs should be isolated from ground and have the necessary voltage protection.
4.4.3 Electrical Safety Design Requirements The design of the meter, including the transmitter should, as a minimum, be analyzed, tested, and certified by an applicable laboratory, and then each meter labeled as approved for operation in a National Electric Code Class I, Division 2, Group D Hazardous Area.
4.4.4 Cable Jackets and Insulation Cable jackets, rubber, plastic, and other exposed parts should be resistant to the environment to which the meter is exposed.

This report is the property of AGA and is part of its process to create a new recommended practice. This document or any of its parts shall not be copied, disseminated, cited in literature, presentations or discussions by persons other than members of the American Gas Association (AGA) and American Petroleum Institute (API) who are part of its creation process without prior approval from AGA.
AGA TRANSMISSION MEASUREMENT COMMITTEE - DRAFT REPORT NO. 11 Aug 22, 2010
20 of 84
4.5 Computer Programs
4.5.1 Firmware Processing software or firmware in the transmitter responsible for the control and operation of the meter shall be stored in a non-volatile memory. All flow calculation constants and operator-entered parameters shall be stored in non-volatile memory. For auditing purposes, it shall be possible to verify all flow calculation constants and parameters while the meter is in operation. The Manufacturer shall maintain a record of all firmware revisions including revision serial number, date of revision, applicable meter models, circuit board revisions, and description of changes to firmware. The firmware revision number, revision date, serial number, and/or checksum should be either available to an auditor by visual inspection of the marking on the firmware chip or capable of being displayed by the meter or ancillary device. The Manufacturer may offer software upgrades from time to time to improve the performance of the meter or to add features. The manufacturer shall inform the meter operator if the firmware revision will affect the accuracy of a flow-calibrated meter.
4.5.2 Configuration and Maintenance Software The manufacturer should be supplied with capability to configure and monitor the operation of the meter, either locally through embedded software or remotely through PC based software. As a minimum the following parameters shall be available: flow rates, temperature, flowing density, drive power and signal quality
4.5.3 Inspection and Auditing Functions It should be possible for an auditor to view and print the flow measurement configuration parameters used by the transmitter while the meter is in operation, either locally or remotely, with an appropriate data acquisition device using the configuration and maintenance software. The auditor should verify that flow measurement algorithms used, in any specific meter, are producing the same or better performance as when it was originally or last flow calibrated. The auditor may have to rely on the manufacturer for portions of this verification due to the proprietary nature of some Coriolis algorithms. In general, the measuring system should conform to the requirements provided in American Petroleum Institute’s Manual of Petroleum Measurement Standards, Chapter 21.1 for electronic gas measurement. Provisions shall be made available to the operator/user to prevent an accidental or undetectable alteration of those parameters that affect the performance of the meter by the manufacturer. For example, suitable provisions may include a sealable switch or jumper, single or multiple password levels in the Transmitter, or a permanent programmable read-only memory chip.
4.5.4 Alarms When specified by the designer, the Coriolis meter may be available with alarm status outputs. The alarm-status outputs should be provided in the form of fail-safe, dry, relay contacts or voltage free solid-state switches isolated from ground. The alarm status may be set for the following.
• Hard Failure: When any of several internal measurements (e.g., drive signal, pickoff signal, RTD, algorithms, etc.) fail for a specified length of time
• Soft Failure: When the meter does not produce a useable output (see Section 8.2.5 for descriptions of example operating conditions that may cause a Soft Failure to occur)

This report is the property of AGA and is part of its process to create a new recommended practice. This document or any of its parts shall not be copied, disseminated, cited in literature, presentations or discussions by persons other than members of the American Gas Association (AGA) and American Petroleum Institute (API) who are part of its creation process without prior approval from AGA.
AGA TRANSMISSION MEASUREMENT COMMITTEE - DRAFT REPORT NO. 11 Aug 22, 2010
21 of 84
4.5.5 Diagnostic Measurements Coriolis meter designs may offer diagnostics that automatically or through a manual process identify conditions that may affect meter performance. Diagnostic methods may require the use of an external tool or may be integrated into meters design. The following lists examples of parameters or analysis measures that a manufacturer may provide for diagnostic measurement via a local display or a digital interface (e.g. RS-232, RS-485):
• EPROM checksum • Configuration change flag • Drive gain or power indication • Pickoff or signal amplitude • Temperature output(s) • Live zero flow indication • Status and measurement quality indicators • Alarm and failure indicators • Flowing density or flow tube resonant frequency • Flow tube health indication • Flow tube balance or symmetry • Frequency output test • Digital status output test • Analog output test
To further optimize the use of diagnostics, the operator should baseline a meter’s diagnostic indicators either manually and/or through an automated process inherent to the meters design during either meter calibration, initial installation, or both. Deviations from baseline diagnostics are useful in establishing acceptance criteria.
4.6 Documentation The manufacturer should provide or make available the following set of documents when requested for quotation, as a minimum. All documentation shall be dated.
• Description of the meter giving the technical characteristics and the principle of its operation. • Dimensioned drawing and/or photograph of the meter. • Nomenclature of parts with a description of constituent materials of such parts. • General description of operation. • Description of the available output signals and any adjustment mechanisms. • A list of the documents submitted. • Recommended spare parts.
The Manufacturer shall provide all necessary data, certificates, and documentation for correct configuration, set-up, and use of the particular meter upon delivery of the meter. The manufacturer should provide the following set of documents upon request. All documentation shall be dated
• Meter-specific outline drawings, including overall process connection dimensions, ratings, maintenance space clearances, conduit connection points, and estimated weight.
• meter-specific electrical drawings showing customer wiring termination points and associated electrical schematics for all circuit components back to the first isolating component; e.g optical isolator, relay, etc.
• Instructions for installation, operation, periodic maintenance, and troubleshooting. • Description of software functions, configuration parameters (including default value), and
operating instructions. • Documentation that the design and construction comply with applicable safety codes and
regulations.

This report is the property of AGA and is part of its process to create a new recommended practice. This document or any of its parts shall not be copied, disseminated, cited in literature, presentations or discussions by persons other than members of the American Gas Association (AGA) and American Petroleum Institute (API) who are part of its creation process without prior approval from AGA.
AGA TRANSMISSION MEASUREMENT COMMITTEE - DRAFT REPORT NO. 11 Aug 22, 2010
22 of 84
• A field verification test procedure as described in Section 9.1 – Field Meter Verification • Drawing showing the location of verification marks and seals. • Drawing of the data plate or face-plate and of the arrangements for inscriptions. • Drawing of any auxiliary devices • A list of electronic interfaces and operator wiring termination points with their essential
characteristics. • (Optional) Documentation that the meter performance meets the requirements of Section 7.
The operator or designer may also request copies of hydrostatic-test certificate, material certificates, and weld radiographs to be supplied with delivery of the meter.
4.7 Manufacturer Testing Requirements
4.7.1 Static Pressure Testing The manufacturer shall test the integrity of all pressure-containing components for every Coriolis meter. The test shall be conducted in compliance with the appropriate industry standard, (ANSI/ASME B16.1, B16.5, B16.34 or other as applicable). Each Coriolis meter manufacturer shall pressure test each meter using suitable and customary methods prior to shipment to verify its structural integrity. Testing will be done before the pressure-containing components of the meter are covered. Typically, the test pressure is one and one-half times the maximum operating pressure of the lowest rated pressure component in the meter wetted assembly, or, as required by the designer or selected product approvals agency, e.g., ANSI B31.3. No leaks will be permitted for a period of 15 minutes at the test pressure. Suitable methods will be used to determine leaks in the meter assembly.
4.7.2 Alternative Calibration Fluids A representative number of samples of a given meter type and size should be calibrated using an alternate calibration fluid (e.g., water, air, etc.) and natural gas to adequately characterize any differences in meter performance (e.g., meter accuracy) produced by the different test media. Based on the results of this characterization process, an adjustment to the meter calibration factor may be made to ensure acceptable meter performance in gas service. The uncertainty of measurement for the meter shall be stated applicable to the intended gas service. Any limitations or restrictions to the operational range of the meter in gas service must also be stated.
4.7.3 Calibration Requirements Each meter shall be calibrated against a recognized national or international measurement standard over a flow range that is representative of the application rate(s) and sufficient to establish meter accuracy and linearity, i.e. within maximum peak-to-peak error limit. A minimum of three test flow rates (in each flow direction through the meter if applicable) shall be collected upscale and downscale within the flow range to show any hysteresis and repeatability effects. If a calibration factor adjustment is made it is recommended that at least one verification point be run. Additional flow rate test points above the minimum may be required as requested by the customer. 4.7.4 Calibration Test Reports All meter test results will be documented in a written report that shall be archived by the meter manufacturer at the time of meter shipment to the owner/operator. At least one copy of the complete report shall be provided to the meter owner/operator. The meter manufacturer should keep a copy of the test report on file for at least 10 years and make the complete report available to the owner/operator upon request, at any time during that period. The report shall include the following, as a minimum:
• The name and address of the meter manufacturer • The name and address of the test facility • The test meter model and serial number

This report is the property of AGA and is part of its process to create a new recommended practice. This document or any of its parts shall not be copied, disseminated, cited in literature, presentations or discussions by persons other than members of the American Gas Association (AGA) and American Petroleum Institute (API) who are part of its creation process without prior approval from AGA.
AGA TRANSMISSION MEASUREMENT COMMITTEE - DRAFT REPORT NO. 11 Aug 22, 2010
23 of 84
• The test meter line size or capacity rating • The test meter software revision number • The date(s) of the test • The name and title of the person(s) who conducted the tests • The flow testing calibration value(s) vs. flow rate
The following shall be available upon request
• A written description of all test procedures and pertinent test conditions • The meter mounting arrangement, including upstream/downstream piping configurations (If
applicable) • A report of the meter software configuration parameters • All measured test data, including flow rates, pressures, temperatures, gas composition (if so
calibrated), and estimates of the measurement uncertainty of the test facility and the test meter • A report of diagnostic information
4.7.5 Quality Assurance The manufacturer shall establish and follow a comprehensive quality-assurance program for the assembly and testing of the meter and its electronic system (e.g., ISO 9000, API Specification Q1, etc.). The user shall have access to the quality assurance documents and records. Test facilities used for meter calibration shall be able to demonstrate traceability to relevant national primary standards and to provide test results that are comparable to those from other such facilities.

This report is the property of AGA and is part of its process to create a new recommended practice. This document or any of its parts shall not be copied, disseminated, cited in literature, presentations or discussions by persons other than members of the American Gas Association (AGA) and American Petroleum Institute (API) who are part of its creation process without prior approval from AGA.
AGA TRANSMISSION MEASUREMENT COMMITTEE - DRAFT REPORT NO. 11 Aug 22, 2010
24 of 84
5 Meter Selection Considerations The major consideration when sizing a Coriolis meter is the tradeoff between pressure loss and usable meter range for a given accuracy. In order to properly size a Coriolis meter the designer/user should provide the manufacturer the following information:
a. Flow rate range b. Pressure range c. Temperature range d. Allowable pressure drop e. Gas composition or flow density at minimum operating pressure and maximum operating
temperature f. Required meter accuracy
Properly sizing a Coriolis meter consists of choosing a meter size that optimizes the tradeoff between measurement error at minimum flow rate and pressure loss and/or gas velocity at maximum flow rate. At a given flow rate, pressure drop and gas velocity are higher through a smaller diameter meter, but potential measurement error at the lowest flow rates is generally reduced and useable turndown ratio is typically increased. Likewise, pressure drop and gas velocity are lower when a larger diameter meter is chosen, but potential measurement error at a similar low flow rate may increase and turndown ratio decrease.
5.1 Minimum Flow Rate
The minimum flow rate ( minQ ) of a Coriolis meter is specified by the manufacturer and determined by defining the lowest flow rate at which the meter error will not exceed the limit specified in figure 6.1. While at high flow rates the meter error is dominated by flow noise and other influences, at low flow rates the meter error is dominated by the meter’s zero stability. Thus, the measurement error of a Coriolis meter below Qt is primarily determined from the meter’s zero stability ( ZS ) and the manufacturer’s published accuracy equation. Since the minimum flow rate of a Coriolis meter is relative to mass flow, once minQ is determined in base volume units for a particular gas mixture, it will remain a constant over the range of temperature, pressure, and flow velocity. Only a change in gas composition or base volume conditions will cause the value of minQ to change.
5.2 Transitional Flow Rate The flow rate where the allowable error changes. See Section 6.1 for performance limit definition.
5.3 Maximum Flow Rate
The maximum flow rate ( maxQ ) of a Coriolis meter is specified by the manufacturer. The user may choose a lower maximum flow rate based on the acceptable pressure drop across the meter and/or flow velocity.
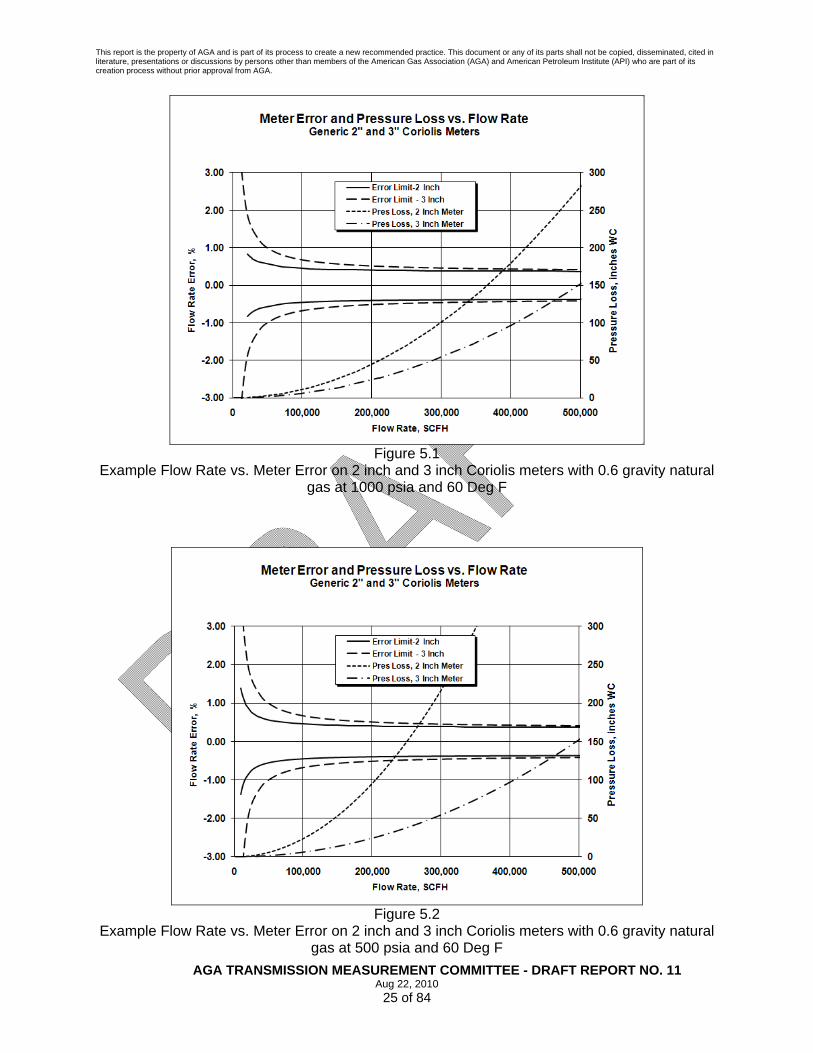
5.3.1 Meter Pressure Loss ( PΔ ) The designer will size the Coriolis flow meter to optimize the meter performance over the flow rate range with a pressure drop that is acceptable for the application. If pressure drop is a priority, meter selection will be made to provide the lowest possible pressure drop at maximum flow while maintaining an acceptable measurement error at minimum flow rates. As examples, figure 5.1 and 5.2 show the relationship between pressure drop and measurement error at line pressures of 1000 and 500 psia respectively, with 0.6 gravity natural gas at flow rates up to 500 MCFH, for several typical line sizes for one particular meter design.
This report is the property of AGA and is part of its process to create a new recommended practice. This document or any of its parts shall not be copied, disseminated, cited in literature, presentations or discussions by persons other than members of the American Gas Association (AGA) and American Petroleum Institute (API) who are part of its creation process without prior approval from AGA.
AGA TRANSMISSION MEASUREMENT COMMITTEE - DRAFT REPORT NO. 11 Aug 22, 2010
25 of 84
Figure 5.1
Example Flow Rate vs. Meter Error on 2 inch and 3 inch Coriolis meters with 0.6 gravity natural gas at 1000 psia and 60 Deg F
Figure 5.2
Example Flow Rate vs. Meter Error on 2 inch and 3 inch Coriolis meters with 0.6 gravity natural gas at 500 psia and 60 Deg F
This report is the property of AGA and is part of its process to create a new recommended practice. This document or any of its parts shall not be copied, disseminated, cited in literature, presentations or discussions by persons other than members of the American Gas Association (AGA) and American Petroleum Institute (API) who are part of its creation process without prior approval from AGA.
AGA TRANSMISSION MEASUREMENT COMMITTEE - DRAFT REPORT NO. 11 Aug 22, 2010
26 of 84
Pressure drop is determined by a constant called the pressure loss coefficient ( K ) defined as:
Re-writing the equation to solve for pressure drop ( PΔ ) the equation becomes:
c
f
gvK
P2
2ρ=Δ
The equation shows that with flowing density ( fρ ) constant the pressure loss ( PΔ ) is directly proportional to the square of the flowing gas velocity ( v ). Because the pressure drop increases with the square of the velocity, choosing a larger line size meter will significantly lower the pressure drop. However, the measurement error over the operating flow rate range below the transitional flow rate for the larger size meter will typically be greater. Every manufactured type and size of Coriolis meter will have a different pressure drop for a given flow rate. The designer should consult the meter manufacturer for specific pressure drop information for a given meter type and size.
(5.1)
(5.2)
2
2v
PgKf
c
ρΔ
=
This report is the property of AGA and is part of its process to create a new recommended practice. This document or any of its parts shall not be copied, disseminated, cited in literature, presentations or discussions by persons other than members of the American Gas Association (AGA) and American Petroleum Institute (API) who are part of its creation process without prior approval from AGA.
AGA TRANSMISSION MEASUREMENT COMMITTEE - DRAFT REPORT NO. 11 Aug 22, 2010
27 of 84
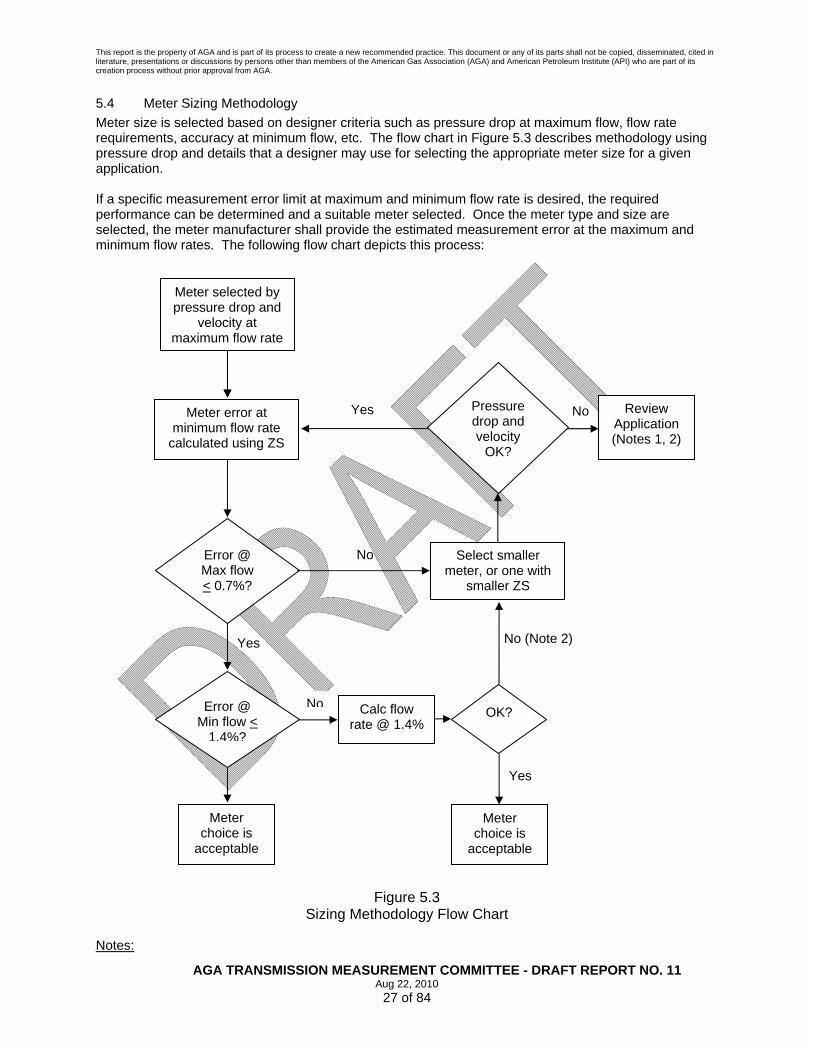
5.4 Meter Sizing Methodology Meter size is selected based on designer criteria such as pressure drop at maximum flow, flow rate requirements, accuracy at minimum flow, etc. The flow chart in Figure 5.3 describes methodology using pressure drop and details that a designer may use for selecting the appropriate meter size for a given application. If a specific measurement error limit at maximum and minimum flow rate is desired, the required performance can be determined and a suitable meter selected. Once the meter type and size are selected, the meter manufacturer shall provide the estimated measurement error at the maximum and minimum flow rates. The following flow chart depicts this process:
Figure 5.3 Sizing Methodology Flow Chart
Notes:
Error @ Max flow < 0.7%?
Select smaller meter, or one with
smaller ZS
Review Application (Notes 1, 2)
Pressure drop and velocity
OK?
Yes No
Error @ Min flow <
1.4%?
Calc flow rate @ 1.4%
No (Note 2)
Meter choice is
acceptable
Yes
No
Meter choice is
acceptable
Yes
No
Meter selected by pressure drop and
velocity at maximum flow rate
Meter error at minimum flow rate
calculated using ZS
OK?
Meter selected by pressure drop and
velocity at maximum flow rate

This report is the property of AGA and is part of its process to create a new recommended practice. This document or any of its parts shall not be copied, disseminated, cited in literature, presentations or discussions by persons other than members of the American Gas Association (AGA) and American Petroleum Institute (API) who are part of its creation process without prior approval from AGA.
AGA TRANSMISSION MEASUREMENT COMMITTEE - DRAFT REPORT NO. 11 Aug 22, 2010
28 of 84
1) Meter sizing may be optimized by relocating the meter to a point in the piping where the gas is at a
higher pressure, i.e., upstream of a pressure regulator. Higher process pressures improve meter turndown ratio by increasing gas density and reducing the pressure drop across the mass flow rate range. Utilizing higher process pressures can also reduce meter size requirements.
2) Choosing a meter with better performance at minimum flow rate may result in a higher pressure drop
at maximum flow rate. If a suitable meter is not available, the designer or operator should review the application requirements. Performance requirements at minimum flow may need to be relaxed, and/or allowable pressure drop at maximum flow may need to be increased.
Appendix F details sizing examples and equations to aid designers in the sizing of Coriolis meters

This report is the property of AGA and is part of its process to create a new recommended practice. This document or any of its parts shall not be copied, disseminated, cited in literature, presentations or discussions by persons other than members of the American Gas Association (AGA) and American Petroleum Institute (API) who are part of its creation process without prior approval from AGA.
AGA TRANSMISSION MEASUREMENT COMMITTEE - DRAFT REPORT NO. 11 Aug 22, 2010
29 of 84
6 Performance Requirements
The meter manufacturer shall state the meter performance specifications for each meter type and line size. The pressure drop through the meter will be charted, graphed, or made available through a sizing process utilizing the pressure loss coefficient ( K ) or correlative equations and reference data to allow the determination of the pressure drop at the gas flow application conditions. Each meter shall be individually calibrated and traceable documentation provided as evidence that the individual meter meets the stated performance (see Section 6.1). The Coriolis meter will be calibrated over the mass flow rate range for the intended application, if known. The specific performance of the meter over the given flow range is dependent on the meter size and design/type. Once the meter size is chosen (see section 5), the meter performance at the application conditions shall meet or exceed the performance requirements stated here. For Coriolis flow meters that are calibrated using a liquid medium, or other gas medium, data will be provided showing results for calibrations done on the same liquid or gas medium, and natural gas for meters of the same design/type and size. Additional or other information and/or calibration data (see Sections 4.7.3 and 4.6) may be provided, as agreed upon between the designer/operator and the meter manufacturer.
6.1 Minimum Performance Requirements In the sizing and selection of Coriolis meters for natural gas applications, the following minimum performance requirements shall be met by the meter, as supplied directly from the manufacturer, prior to making any calibration factor adjustments based on an independent third party flow calibration of the meter.
Repeatability: + 0.35 % of reading for tQ < iQ < maxQ + 1.0% of reading for minQ < iQ < tQ
Maximum Mean Error: + 0.7% of reading for tQ < iQ < maxQ + 1.4% of reading for minQ < iQ < tQ
Maximum Peak-to-Peak Error: 0.7% of reading for tQ < iQ < maxQ 1.4% of reading for minQ < iQ < tQ

This report is the property of AGA and is part of its process to create a new recommended practice. This document or any of its parts shall not be copied, disseminated, cited in literature, presentations or discussions by persons other than members of the American Gas Association (AGA) and American Petroleum Institute (API) who are part of its creation process without prior approval from AGA.
AGA TRANSMISSION MEASUREMENT COMMITTEE - DRAFT REPORT NO. 11 Aug 22, 2010
30 of 84
Figure 6.1 Performance Specification Summary
6.2 Performance Enhancements At the request of the designer/operator, the manufacturer shall state the sensitivity of meter accuracy to changes in gas pressure, temperature, fluid composition, and fluid flowing density over the operating range. This information may be used by the designer/operator to further enhance meter performance. The designer/operator shall evaluate the meter operating conditions and determine the need to apply a fixed calibration factor adjustment or an active calibration factor adjustment, based on the expected variation in operating conditions.
This report is the property of AGA and is part of its process to create a new recommended practice. This document or any of its parts shall not be copied, disseminated, cited in literature, presentations or discussions by persons other than members of the American Gas Association (AGA) and American Petroleum Institute (API) who are part of its creation process without prior approval from AGA.
AGA TRANSMISSION MEASUREMENT COMMITTEE - DRAFT REPORT NO. 11 Aug 22, 2010
31 of 84
7 Gas Flow Calibration Requirements
Manufacturers are responsible for initial flow calibration of Coriolis meters prior to delivery see section 4.7.3. Calibration with an alternate calibration fluid (e.g. water) is valid with Coriolis sensor designs where the transferability of the alternate calibration fluid, with an added uncertainty relative to gas measurement, has been demonstrated by the meter manufacturer through tests conducted by an independent flow calibration laboratory. When the transferability of the manufacturer’s calibration fluid to gas cannot be verified, the meter shall be flow calibrated on gas as per the requirements in 7.1
If the Coriolis sensor design is sensitive to installation effects, the metering module shall be calibrated on gas. In this instance, the metering module includes adequate upstream piping, flow conditioning, downstream piping, and if applicable thermowells and sample probes to insure that there is no significant difference between the velocity profile experienced by the meter in the laboratory and the velocity profile experienced in the final installation.
7.1 Flow Calibration Test
It is a requirement, that the gas flow calibration is conducted with a calibration reference traceable to a recognized national/international standard. Examples of entities that maintain national measurement standards include NIST, NMi and PTB. At least 5 flow rate test points should be selected throughout the range of flow rates over which the meter is to be applied; the recommended nominal test rates (RNTR). The designer may specify additional flow calibration tests or a modified set that more closely represents field operating conditions. If a calibration factor(s) is applied to the meter, then verification point(s) shall be run. The designer, operator; and/or manufacturer shall provide the calibration facility with the following information:
1. Meter size 2. Piping data (i.e. dimensional, process connection, and ANSI rating) 3. Flow calibration test points (i.e. flow rate, pressure, temperature) 4. Output signal to be used for calibration. (digital data, frequency, or analog) 5. Any special calibration instructions (e.g. for bi-directional calibrations duplicate flow
calibration test points in both directions) 6. A drawing showing the metering module assembly
Any thermodynamic or physical properties (e.g. density, compressibility, speed of sound, critical flow factor, etc) used during flow calibration shall be computed using GERG-2004 equation of state or methods from A.G.A. Report No. 8, “Detailed Characterization Method Equation of State. 7.1.1 Preparation for Flow Calibration The calibration provider shall perform the following as regular procedure.
• Inspect the meter module for any obvious physical damage and verify that its physical configuration matches the configuration specified by the user
• Verify that the electronic configuration in the meter, related to flow measurement, matches the configuration provided by the manufacturer. If the manufacturer recommends any changes to the meter configuration prior to calibration, the calibration provider is responsible for following the manufacturer’s recommendations
• Calibrate using the meter output signal requested by the user.

This report is the property of AGA and is part of its process to create a new recommended practice. This document or any of its parts shall not be copied, disseminated, cited in literature, presentations or discussions by persons other than members of the American Gas Association (AGA) and American Petroleum Institute (API) who are part of its creation process without prior approval from AGA.
AGA TRANSMISSION MEASUREMENT COMMITTEE - DRAFT REPORT NO. 11 Aug 22, 2010
32 of 84
• Perform a zero flow verification test and re-zeroing of the Coriolis meter prior to calibration. This shall be performed in accordance with the manufacturer’s specification and at the intended flow calibration average pressure and temperature
• Maintain and provide a record of the “As Found” meter configuration and performance along with a record of all subsequent changes or the “As Left” meter configuration and performance to the user.
7.1.2 Calibration of Metering Module
The calibration will involve flowing gas, one or more reference meters in series with the meter module under test, and at the flow rates recommended in Section 7.1 above. Flow, temperature, pressure and fluid property data will be acquired or calculated and an error for the meter will be calculated at each flow rate. All calibrations will be designed using sound statistical techniques to determine the number of calibration points, the number of samples at each point, and the size of each sample. A calibration point will be derived from a statistically significant measurement. As a minimum, three samples should be collected at each calibration point and at least one verification point will be taken after applying adjustment factor(s), as outlined below, to verify the adjustment was calculated and applied properly.
7.2 Calibration Adjustment Factors
Adjustment of a calibrated meter’s performance within the uncertainty of the flow calibration reference is not recommended, but left to the discretion of the user. Calibration adjustment factors shall be applied, if necessary, only over the range of tQ to maxQ to minimize or eliminate any indicated meter bias error. The accepted methods of applying adjustment factors are:
1) Using the flow-weighted mean error (FWME) over the meter’s expected flow range (Calculation of FWME is shown in Appendix A).
2) Using a polynomial algorithm 3) Multipoint linear interpolation method
For bi-directional flow calibrations, in the absence of the manufacturer demonstrating identical forward and reverse performance for a particular design, a reverse flow calibration test shall be conducted and a second set of calibration adjustment factors shall be applied, if necessary, for reverse flow.
7.3 Calibration Reports
The results of each calibration performed shall be documented in a written report supplied to the designer or the operator. For each meter, the report should include at a minimum:
1) The name of the manufacturer 2) The name and address of the facility 3) The model and serial number of the meter 4) The transmitter firmware revision number 5) The date(s) of the test 6) The name and title of the person(s) who conducted the tests 7) Basic description of the test method 8) The upstream and downstream piping configuration including flow conditioner (If applicable)

This report is the property of AGA and is part of its process to create a new recommended practice. This document or any of its parts shall not be copied, disseminated, cited in literature, presentations or discussions by persons other than members of the American Gas Association (AGA) and American Petroleum Institute (API) who are part of its creation process without prior approval from AGA.
AGA TRANSMISSION MEASUREMENT COMMITTEE - DRAFT REPORT NO. 11 Aug 22, 2010
33 of 84
9) The serial numbers of all piping and flow conditioners (If applicable) forming the meter module as supplied by the user
10) A statement of uncertainty for the facility with reference to the method used and date of last verification of traceability to a recognized national/international standard.
11) All test data, including flow rates, errors, pressure, temperature and gas density/composition 12) Graph of as found performance 13) Identification of adjustment method and any adjustment factors applied 14) Verification test data, including flow rates, errors, pressure, temperature, and gas
density/composition 15) As left performance; i.e. Graph of theoretical performance after adjustment including any
performance verification points taken 16) A report of the software configuration parameters 17) A report of diagnostic information 18) Page and page number of the calibration document, e.g. (1 of 12) 19) Typed names below signatures of all persons who sign calibration document.
At least one copy of the complete report shall be sent to the designer or the operator. For the initial gas calibration of new meters conducted by the manufacturer, one copy will be retained in the manufacturer’s files. The manufacturer shall ensure that the complete report is available to the operator upon request, for a period of 10 years after shipment of any meter. Flow calibration facilities shall ensure that the complete report is available, for a period of 10 years after shipment of any meter.
7.4 Additional Considerations
7.4.1 Pressure Effect Compensation Flow pressure effect compensation should be addressed during gas flow calibration. Coriolis meters are typically calibrated on water at pressures below 50 psig by the manufacturer. Gas flow testing of a Coriolis meter above the manufacturer’s water calibration pressure will induce a negative flow bias relative to the flow pressure effect specification for the particular meter design.
Example: A specific Coriolis meter sensor design has a flow pressure effect of -0.001%/psig. The meter was initially water calibrated at 50 psig. The meter was subsequently gas flow tested at 550 psig. If the flow pressure effect compensation is disabled and a flow pressure calibration factor is not applied, the use of the meter would result in an under registration of 0.5%, due to the pressure difference between the initial water calibration and subsequent gas test,
Pressure effect compensation may be applied in several ways depending upon the Coriolis flowmeter design:
• Where the pressure will vary significantly, an input may be provided to the transmitter which represents the active line pressure. The transmitter or flow computer is programmed with the calibration pressure value and the pressure correction factor supplied by the manufacturer.
• Where the pressure will not vary significantly, a fixed correction value is applied representing the average operating pressure. The correction value maybe applied as a fixed value in the transmitter or as a correction value applied to the calibration factor.
If flow pressure effect compensation is applied during flow calibration, it should be noted that the compensation applied by the meter is referenced to the water calibration pressure. If calibration factor(s) are applied to meter based on data collected while pressure compensation is being applied by the meter,

This report is the property of AGA and is part of its process to create a new recommended practice. This document or any of its parts shall not be copied, disseminated, cited in literature, presentations or discussions by persons other than members of the American Gas Association (AGA) and American Petroleum Institute (API) who are part of its creation process without prior approval from AGA.
AGA TRANSMISSION MEASUREMENT COMMITTEE - DRAFT REPORT NO. 11 Aug 22, 2010
34 of 84
the meter’s reference calibration pressure ( CalP ) will remain the pressure at which the original water calibration was performed.. If the user chooses to establishes a new calibration pressure ( CalP ) for the meter relative to the gas calibration pressure during flow calibration, flow pressure effect compensation MUST be disabled. By doing this the data collected during gas flow test will include that of flow pressure effect from the water calibration pressure to the gas flow test pressure. Thus, when a flow calibration correction factor is applied it will correct the meters performance from the water calibration pressure to the gas flow test pressure. This method may be preferred by the user as it retains the traceability of the gas flow calibration pressure to that which the flow calibration factor was established at; i.e. the calibration pressure ( CalP ) and the flow calibration factor will be contained on the same calibration certificate. Assuming the meter was gas flow calibrated at average operating pressure, this method also minimizes the magnitude of flow pressure effect compensation required during field operation to only pressure deviations away from average operating pressure. 7.4.2 Coriolis Flowmeter Diagnostics During the calibration, meter diagnostics should be monitored for alarm or an out of tolerance condition. If an advanced diagnostic for flow tube health exists, this diagnostic test should be performed after calibration is complete and results reported. Actual diagnostic capabilities vary by design; the flow calibration facility should consult with the manufacturer to determine an appropriate set of diagnostics for the particular design. Refer to section 4.5.5
7.5 Final Considerations
Upon completion of the calibration test the following should be performed. 1) Write protect jumpers/switches should be installed, software security relative to metrology
enabled, or access to transmitter communications sealed to prevent metrology affecting parameter changes.
2) A copy of the final record of the meter parameter configuration file should accompany the meter to the field installation location.
3) A meter log file generated at calibration can establish the meter baseline data. Meter log data and/or the results of an automated flow tube health diagnostic should be included to provide a baseline of the metering module performance at calibration. This baseline data can be used to verify the meter’s performance upon startup, during operation, and after component changes. The baseline data can also be useful in conducting health checks of the metering module. It is recommended that the manufacturers identify the parameters that define the baseline performance for their products.

This report is the property of AGA and is part of its process to create a new recommended practice. This document or any of its parts shall not be copied, disseminated, cited in literature, presentations or discussions by persons other than members of the American Gas Association (AGA) and American Petroleum Institute (API) who are part of its creation process without prior approval from AGA.
AGA TRANSMISSION MEASUREMENT COMMITTEE - DRAFT REPORT NO. 11 Aug 22, 2010
35 of 84
8 Installation Requirements This section is directed to the designer to ensure that Coriolis flow meters will be installed in a suitable environment and in a piping configuration in which Coriolis meters can meet the expected performance requirements described in Section 6 of this report.
8.1 General Requirements
8.1.1 Temperature Coriolis flow meters should operate properly over a minimum ambient temperature range of –13 to 131°F (-25 to 55°C). Special consideration should be given to extreme ambient environments; e.g., painting the meter white, providing shade to reduce solar radiation in direct sunlight; a suitable enclosure in colder climates, or insulating the meter. Due to mass, base volume, and energy relationships, a flowing temperature sensor is not required to calculate base volume and energy. The Coriolis sensor measures temperature to correct for the effect of Young’s modulus on the flow tube(s). Routine meter verification procedures include the verification of the Coriolis sensor’s temperature indication to be within the manufacturer’s specified tolerance. Designers are encouraged to install a thermowell upstream of the Coriolis sensor for temperature verification purposes and issues related to Joule-Thomson effects at high pressure drops.
8.1.2 Pressure If pressure compensation is used, the location of the pressure measurement should be made in close proximity to the sensor. The pressure tap can be located either upstream or downstream of the sensor, though upstream is preferred.
8.1.3 Vibration Coriolis meters are mostly immune to vibrations away from the natural resonant frequency of its flow tube(s). Coriolis flow sensors should not be installed where mechanical/structural vibration levels might excite the natural resonant frequency of the flow tube(s). Vibrations at the natural resonant frequency of the flow tube(s) will induce an influence quantity. The magnitude and sign of the error is meter design specific. The natural resonant frequency of a Coriolis meter is dependent upon design and operating conditions. The meter manufacturer shall be consulted before installing a Coriolis flow sensor where vibrations are present.
8.1.4 Electrical Noise Although a Coriolis flow meter is designed to withstand electrical noise influences, the designer should not expose the Coriolis flow meter or the connected wiring to any unnecessary electrical noise; i.e., electromagnetic interference (EMI), radio frequency interference (RFI), solenoid transients, etc. Refer to the manufacturer’s recommended installation instructions for further guidance.
8.2 Meter Module Design Testing to date has shown that some bending-mode Coriolis flow sensors are generally immune to velocity profile distortion, pulsations, and swirl effects, thus allowing the designer flexibility restricted only by good piping support practices to minimize structural stresses on the sensor body. It is recommended that the meter manufacturer be consulted regarding upstream and, downstream piping configuration requirements, as well as any requirements pertaining to the use of a flow conditioner upstream of the sensor. When velocity profile is of concern, the designer may also choose to do one or more of the following:
• Install a flow conditioner upstream of the sensor that will produce a fully-developed turbulent velocity flow profile, regardless of the upstream piping configuration.

This report is the property of AGA and is part of its process to create a new recommended practice. This document or any of its parts shall not be copied, disseminated, cited in literature, presentations or discussions by persons other than members of the American Gas Association (AGA) and American Petroleum Institute (API) who are part of its creation process without prior approval from AGA.
AGA TRANSMISSION MEASUREMENT COMMITTEE - DRAFT REPORT NO. 11 Aug 22, 2010
36 of 84
• Flow calibrate the Coriolis meter in-situ or in a flow calibration facility using a piping configuration identical to the planned installation.
• Provide a sufficient straight length of upstream pipe to achieve a fully developed turbulent velocity
flow profile, determined by analysis and/or field-testing.
A fully developed, swirl-free, turbulent velocity flow profile is generally the most desirable condition entering any flow meter. Further information can be found in GTI Topical Report GRI-01/0222 Coriolis Mass Flow Meter Performance with Natural Gas. (See Appendix D)
8.2.1 Piping Configuration For Coriolis meters not susceptible to profile distortions, examples of a Coriolis piping configurations are shown in Figure 8.1 and 8.2 The Coriolis sensor is typically one or more sizes in flow diameter smaller than the system piping. It is good practice to provide the following components in the piping design. Bypass Provides an alternate path for process supply during meter
maintenance and inspection procedures. Consideration should be given to prevent inadvertent bypassing of the meter.
Isolation Block Valves Allows isolation of the Coriolis sensor from process conditions
and thermally driven flows during maintenance and inspection. Isolation block valves should be located in close proximity to the meter to facilitate accurate zeroing. Note: Use of valves incorporating double block and bleed mechanisms can improve maintenance efficiency and the certainty of isolation.
Pressure and Blow-down Port Provides for the monitoring of process pressure when required.
When used for the correction of flow pressure effect, the process connection should be located directly upstream of the sensor. A blow down valve incorporated into the design facilitates leak checking of Coriolis upstream and downstream isolation block valves (if not double block and bleed type) prior to the sensor zeroing process, relief of process pressure prior to maintenance, and the installation of a re-calibrated Coriolis meter/meter module if required.
Thermowell Port Provides for use of a flow temperature reference in the
verification of the Coriolis sensor’s temperature measurement. This process connection should be located upstream of the Coriolis sensor.

This report is the property of AGA and is part of its process to create a new recommended practice. This document or any of its parts shall not be copied, disseminated, cited in literature, presentations or discussions by persons other than members of the American Gas Association (AGA) and American Petroleum Institute (API) who are part of its creation process without prior approval from AGA.
AGA TRANSMISSION MEASUREMENT COMMITTEE - DRAFT REPORT NO. 11 Aug 22, 2010
37 of 84
Installation Example
Figure 8.1 In gas measurement applications a Coriolis sensor’s flow diameter will typically be one or more pipe sizes smaller than the upstream and downstream piping it is connected to, requiring the use of reducers and expanders in the design. Excessive lengths of small diameter pipe, rapid flow diameter reductions, rapid changes in flow direction (tees, short radius elbows, etc.) can adversely affect piping pressure drop. The designer should employ conservative piping design techniques when the magnitude of pressure drop is of concern in a particular application. Figure 8.2 shows an example of a Coriolis meter installation where conservative piping design is employed to reduce operating pressure drop.
Figure 8.2: Installation Example Minimizing Operating Pressure Drop

This report is the property of AGA and is part of its process to create a new recommended practice. This document or any of its parts shall not be copied, disseminated, cited in literature, presentations or discussions by persons other than members of the American Gas Association (AGA) and American Petroleum Institute (API) who are part of its creation process without prior approval from AGA.
AGA TRANSMISSION MEASUREMENT COMMITTEE - DRAFT REPORT NO. 11 Aug 22, 2010
38 of 84
8.2.2 Flow Direction For bi-directional flow applications, both ends of the sensor shall be considered "upstream”, particularly if the sensor is sensitive to velocity profile distortion effects.
8.2.3 Protrusions Changes in internal diameter, protrusions, and misaligned flanges shall be avoided on meter modules when the sensor is sensitive to velocity profile distortion effects.
8.2.4 Meter Mounting The manufacturer shall be consulted for specific mounting requirements. Proper mounting of the sensor is required to achieve the desired meter performance. Consideration shall be given to the support of the sensor and the alignment of the inlet and outlet flanges with the sensor. A pipe spool piece should be used in place of the meter to align the upstream and downstream piping during the construction phase. Piping should meet the requirements of typical industry piping codes. Meter performance, specifically zero stability, can be adversely affected by axial, bending, and torsion stresses from pressure, weight, and thermal effects. Utilizing properly aligned pipe-work and properly designed supports can minimize these stresses and associated loads. The Coriolis transmitter should be mounted so that it can be easily accessed to attach communications equipment for operation and maintenance needs. Most Coriolis flow meters are configured in two basic ways, with either with the transmitter mounted to the sensor or the transmitter mounted remotely.
8.2.5 Orientation The designer shall consult the manufacturer installation guidelines for proper orientation of the meter. In general, sensor orientation does not affect performance, but orientation range is limited by flow tube geometry and the potential for settling or the loading of heavier flow components. As a rule, orient the sensor flow tubes in such a way as to minimize the possibility of loading heavier flow stream components, such as condensate, in the vibrating portion of the sensor; i.e., flow tubes oriented in a upward direction in gas service. Solids, sediment, coatings, trapped liquids, or plugging of the flow path(s) can affect the meter performance, especially when present during zeroing of the meter. In applications where condensates regularly exist (e.g. production), the sensor should be mounted in a self draining position with the flow direction down.
8.2.6 Filtration Filtration of the flowing gas is not necessary for most applications of a Coriolis flow meter. However, if there are abrasive contaminants or other debris in the gas flow stream, erosion or damage of the wetted meter components may be a concern, the designer should consider the use of upstream filtration. Susceptibility to this effect is specific to sensor design, size, and velocity.
8.2.7 Sample Probe Port Provides for the monitoring of gas composition, density, or gravity when required. The process connection can be located either upstream or downstream of the sensor.
8.2.8 Gas Velocity Coriolis sensors are typically designed with nickel alloy wetted components and are highly immune to the high velocity gas flow erosion associated with carbon steel pipe, which is induced by corrosive contaminants (e.g. H2O, H2S, etc.) in the gas stream. The gas contaminant levels that raise these concerns are mainly associated with the operating conditions in gas production. Designers regularly design carbon steel piping with these concerns in mind, but the use of reducers and expanders upstream and downstream of the Coriolis sensor is common. When high levels of corrosive contaminants exist, the designer should consider the use of reducers and expanders constructed of a nickel alloy or the user should employ inspection procedures to identify if, in a particular application, a problem exists.

This report is the property of AGA and is part of its process to create a new recommended practice. This document or any of its parts shall not be copied, disseminated, cited in literature, presentations or discussions by persons other than members of the American Gas Association (AGA) and American Petroleum Institute (API) who are part of its creation process without prior approval from AGA.
AGA TRANSMISSION MEASUREMENT COMMITTEE - DRAFT REPORT NO. 11 Aug 22, 2010
39 of 84
8.2.9 Performance Baseline The operator should baseline the meter, either manually or through an automated process inherent to the meter’s design, during the meter’s calibration and/or initial installation. Common parameters that are used to baseline a Coriolis meter’s performance are flowing density accuracy, drive gain, pickoff coil amplitude, and zero value. Some manufacturers offer advanced diagnostics that directly infer change in a meter’s flow performance or flow factor. These baseline relationships are useful in establishing acceptance criteria for the various relationships and the need for a flow performance test and adjustment (if necessary).
8.3 Associated Flow Computer In applications where a flow computer is utilized, the Coriolis transmitter output to the flow computer is typically uncompensated mass, either per a unit of time or accumulated. Therefore, if capable, the associated flow computer may apply any flow pressure effect compensation necessary. Optionally, the flow pressure effect compensation can be performed within the Coriolis transmitter. For bidirectional applications, the Coriolis meter should be treated as two separate meters, associated to two “separate meter runs” in a single flow computer. For detailed requirements, refer to Appendix F, “AGA11 Measurement System” and API MPMS Chapter 21.1, Flow Measurement Using Electronic Metering Systems, in which, a Coriolis meter is classified as a “Linear Meter”.
8.3.1 Flow Computer Calculations The equations for measuring a gas with a Coriolis meter are summarized with the following expressions. When measuring mass flow away from calibration pressure, there is a secondary effect on a Coriolis meter’s indicated flow rate called the “flow pressure effect”. To correct for this effect, a flow pressure effect compensation factor ( pF ) must be applied to the uncompensated mass flow indication from the transmitter by the flow computer. This relationship is such that:
)( pmm FQQtedUncompensadCompensate
= Eq. (8.1)
Where:
dCompensatemQ = Mass flow of gas compensated for flow pressure effect
tedUncompensamQ = Mass flow of gas uncompensated for flow pressure
effect pF = Flow pressure effect compensation factor The flow pressure effect compensation factor ( pF ) is calculated in accordance with the following equation.
))(*)100/((11
CalfEffectp PPPF
−+= Eq. (8.2)
Where: pF = Flow pressure effect compensation factor
EffectP = Flow pressure effect in percent of rate per psig
fP = Measurement fluid static pressure in psig

This report is the property of AGA and is part of its process to create a new recommended practice. This document or any of its parts shall not be copied, disseminated, cited in literature, presentations or discussions by persons other than members of the American Gas Association (AGA) and American Petroleum Institute (API) who are part of its creation process without prior approval from AGA.
AGA TRANSMISSION MEASUREMENT COMMITTEE - DRAFT REPORT NO. 11 Aug 22, 2010
40 of 84
CalP = Calibration static pressure in psig The flow rate from a Coriolis measurement system can take several forms depending on whether the ultimate quantity being measured is mass, volume at base conditions, energy, or volume at flowing conditions. Appropriate conversions, relative to the gas physical properties and process conditions, must be applied to accurately obtain the desired quantity. The equation for flow rate at base conditions, including flow pressure effect compensation factor ( pF ), is such that:
⎟⎟⎠
⎞⎜⎜⎝
⎛=⎟⎟
⎠
⎞⎜⎜⎝
⎛=
)( Airbr
pm
b
pmb G
FQ
FQQ
edUncmpensattedUncompensa ρρ Eq. (8.3)
Where: bQ = Volume flow of gas at base conditions
tedUncompensamQ = Mass flow of gas uncompensated for flow pressure
effect pF = Flow pressure effect compensation factor
bρ = Density of gas at base conditions
rG = Relative density of gas at base conditions
)( Airbρ = Density of air at base conditions The relationship for the calculation of energy, including flow pressure effect compensation factor ( pF ), is such that:
)( mpme HFQQtedUncompensa
= Eq. (8.4)
Where: eQ = Energy rate of gas
tedUncompensamQ = Mass flow of gas uncompensated for flow pressure
effect pF = Flow pressure effect compensation factor
mH = Mass heating value
8.4 Maintenance Users should follow the manufacturer’s recommendations for maintenance. Monitoring diagnostics, performing periodic meter verification procedures called out in Section 9.1, and possibly the trending/long-term monitoring of performance indicators, can identify if abnormal conditions develop. Maintenance procedures, like cleaning, should be condition based (based upon meter diagnostics, process conditions, and/or meter usage). The monitoring of performance indicators can identify the need for cleaning. For example, by monitoring the measured flowing density and comparing it to the calculated/real density, it is possible to infer coating of the of the flow tubes. Performance indicators available to the user are design specific and the meter manufacturer should be consulted on performance indicators available and the interpretation of them.
This report is the property of AGA and is part of its process to create a new recommended practice. This document or any of its parts shall not be copied, disseminated, cited in literature, presentations or discussions by persons other than members of the American Gas Association (AGA) and American Petroleum Institute (API) who are part of its creation process without prior approval from AGA.
AGA TRANSMISSION MEASUREMENT COMMITTEE - DRAFT REPORT NO. 11 Aug 22, 2010
41 of 84
The decision to perform periodic flow test is left to the user. Periodic flow test can be calendar based or, as a minimum, condition based. A number of companies have flow tested Coriolis meters after having been in service for significant (in excess of 15 years) periods of time. These test results have shown that meters, free from flow tube corrosion, erosion, or mechanical damage perform as originally flow calibrated, within the uncertainty of the flow lab. This testing has also shown that, coating of the flow tubes by debris or product residue may change flow tube balance and cause a subsequent zero shift, but if the coating is stable, left as-is, and the meter is re-zeroed, the meter performs as originally calibrated. See Section 9.2, Flow Performance Testing for further discussion.
This report is the property of AGA and is part of its process to create a new recommended practice. This document or any of its parts shall not be copied, disseminated, cited in literature, presentations or discussions by persons other than members of the American Gas Association (AGA) and American Petroleum Institute (API) who are part of its creation process without prior approval from AGA.
AGA TRANSMISSION MEASUREMENT COMMITTEE - DRAFT REPORT NO. 11 Aug 22, 2010
42 of 84
9 Meter Verification and Flow Performance Testing The meter manufacturer should provide the meter operator with written field meter verification test procedures that will allow the Coriolis meter, as a component of the measuring system, to be verified as operating properly and performing within the measurement uncertainty limits required by the designer/operator. Further discussion of these checks can also be found in Appendix C, Section 3.4.1.
9.1 Field Meter Verification The field verification of a Coriolis metering system consists of monitoring and evaluating metering conditions, diagnostic indicators output by the transmitter, and/or ancillary devices of the metering system designed to identify possible change in the system’s performance and the cause. The evaluation of these indicators will guide the operator in determining the need to re-zero the Coriolis meter, execute a flow performance test (in-situ or laboratory), adjust maintenance intervals, and implement design improvements, if necessary, to the metering system. The Operator should follow design-specific meter verification procedures recommended by the manufacturer and as a minimum the following general meter verification procedures should be performed. • Meter Transmitter Verification – The meter transmitter verification should coincide with the
meter zero check. It should include the following procedures: Verify the sensor calibration and correction factors in the configuration of the transmitter to ־
be unchanged from most recent calibration.
Verify all transmitter diagnostic indicators to be in the normal state ־
• Coriolis Sensor Verification – Sensor diagnostics may be available, that continuously, on-
command, or procedurally verify the performance of the sensor and/or infers change in measurement performance. Users should consult the meter manufacturer for the availability of these types of diagnostics..
• Temperature Verification – The Coriolis transmitter monitors a temperature element bonded to
the flow tubes of the Coriolis sensor to correct for Young’s modulus of the flow tubes. Although transmitter diagnostics on this element exist, they typically only identify catastrophic failures; e.g. element open, element short, and an open in the compensation loop.
Using a temperature reference placed in an upstream thermowell or temporarily placed tightly against the upstream flow splitter/inlet and insulated, verify the temperature indicated by the Coriolis meter to be within the published accuracy of the Coriolis meter’s temperature measurement plus the accuracy of the temperature reference.
• Meter Zero Verification – A change in the meter zero value can be used as an indicator of
change in the metering conditions. This can be caused by contamination and coating of the flow tubes (e.g. condensates, glycol, amines, water, oil, dirt, etc.), erosion, corrosion, inadequate structural support, and/or out of square components constructed into the meter module. These influences may cause a bias in the meter zero through change in the dynamic balance of the meter’s flow tubes. It is recommended, as a minimum, that the meter zero be checked at flowing pressure and temperature within 1 to 4 weeks of installation and quarterly during the first year of its field service. The frequency of subsequent zero verifications should be guided by the record of meter zero data, operating conditions, and by operator policy. The meter zero verification should include the following procedures:
This report is the property of AGA and is part of its process to create a new recommended practice. This document or any of its parts shall not be copied, disseminated, cited in literature, presentations or discussions by persons other than members of the American Gas Association (AGA) and American Petroleum Institute (API) who are part of its creation process without prior approval from AGA.
AGA TRANSMISSION MEASUREMENT COMMITTEE - DRAFT REPORT NO. 11 Aug 22, 2010
43 of 84
• Thermal stability is critical for obtaining a proper meter zero. For flowing stations it is recommended to flow above its transitional flow rate ( tQ ) until temperature has stabilized. For non-flowing stations the sensor temperature must be uniform and stable. If you do not have thermal stability, zero verification cannot be performed correctly.
• Close upstream and downstream block valves to ensure a zero flow condition exists
• Verify the indicated meter zero value to be within manufacturer specification limits
• If meter zero is within specification
o Record the meter zero value
• Open upstream and downstream block valves placing meter back into service
• If meter zero is out of specification
o Verify isolation valves are not leaking and check for other potential leak sources. If leaks are present, zero verification cannot be performed correctly.
o Record current zero value
o Re-zero the meter and record the new zero value
o Open upstream and downstream block valves placing meter back into service
o Evaluate indicated meter zero value with historic record to identify the long-term performance of the meter zero and potential influences (consult manufacturer)
The manufacturer should provide an uncertainty analysis to demonstrate that their recommended meter verification tests are sufficient to validate the meter’s specified physical and electrical performance characteristics. The manufacturer should make reference to the uncertainty method used in this analysis.
9.2 Flow Performance Testing The decision to perform a periodic field (in-situ) flow performance test or laboratory flow test and the frequency of these tests, should be guided by the results of the Section 9.1, Field Meter Verification procedures and is at the discretion of the operator. Some regulatory agencies and/or contractual agreements specify a flow test interval. Should the flow performance testing of a Coriolis meter be required, one of several methods can be employed using certified traceable reference standards.
1) Remove from service and send to the manufacturer or third party lab. 2) In-situ flow test 3) Remove from service for flow test with a portable weigh scale system or certified meter using an
alternate fluid. Performance adjustment or recalibration of the Meter Under Test (MUT) should not be performed if the MUT’s performance is within the uncertainty of the reference. See Section 9.3. 9.2.1 Verification of Gas Calibration Performance through Alternate Fluids Flow Test Some regulatory agencies and/or contractual agreements require that the initial performance of a Coriolis meter to be used in a gas application is documented by a gas calibration or flow test. Calibration with an alternative fluid is acceptable where transferability to natural gas has been demonstrated by the manufacturer. 9.2.2 Field/In-situ Flow Performance Test
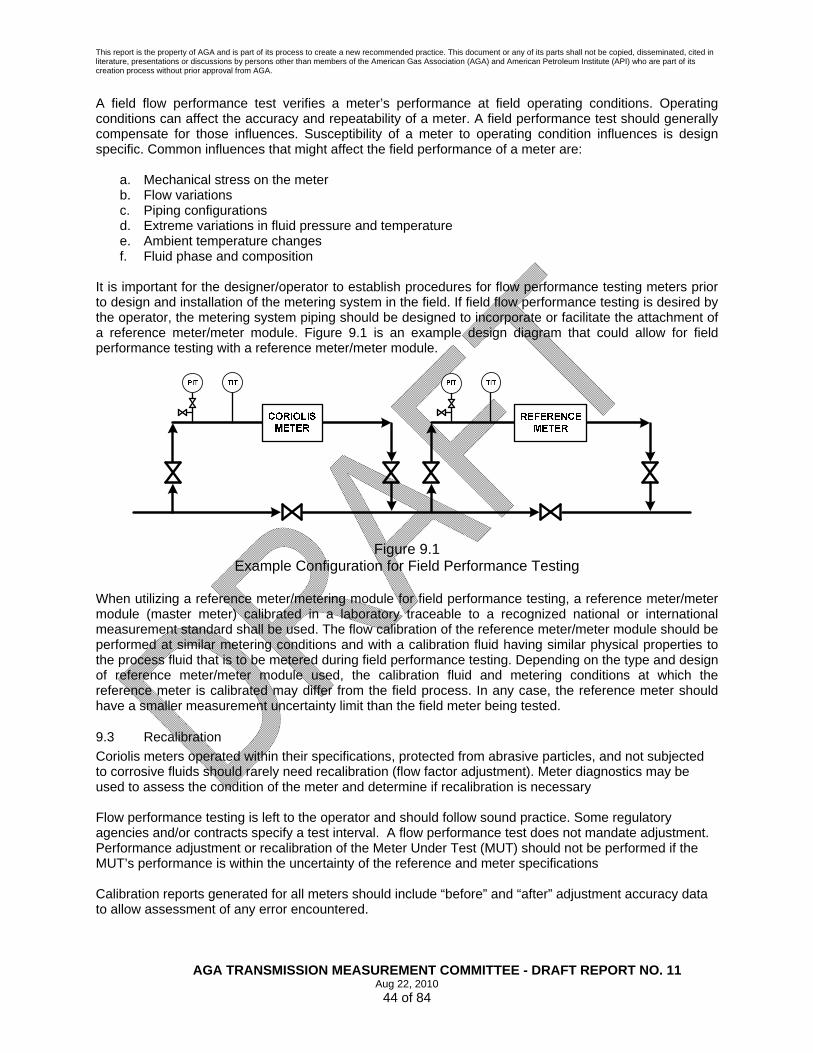
This report is the property of AGA and is part of its process to create a new recommended practice. This document or any of its parts shall not be copied, disseminated, cited in literature, presentations or discussions by persons other than members of the American Gas Association (AGA) and American Petroleum Institute (API) who are part of its creation process without prior approval from AGA.
AGA TRANSMISSION MEASUREMENT COMMITTEE - DRAFT REPORT NO. 11 Aug 22, 2010
44 of 84
A field flow performance test verifies a meter’s performance at field operating conditions. Operating conditions can affect the accuracy and repeatability of a meter. A field performance test should generally compensate for those influences. Susceptibility of a meter to operating condition influences is design specific. Common influences that might affect the field performance of a meter are:
a. Mechanical stress on the meter b. Flow variations c. Piping configurations d. Extreme variations in fluid pressure and temperature e. Ambient temperature changes f. Fluid phase and composition
It is important for the designer/operator to establish procedures for flow performance testing meters prior to design and installation of the metering system in the field. If field flow performance testing is desired by the operator, the metering system piping should be designed to incorporate or facilitate the attachment of a reference meter/meter module. Figure 9.1 is an example design diagram that could allow for field performance testing with a reference meter/meter module.
Figure 9.1 Example Configuration for Field Performance Testing
When utilizing a reference meter/metering module for field performance testing, a reference meter/meter module (master meter) calibrated in a laboratory traceable to a recognized national or international measurement standard shall be used. The flow calibration of the reference meter/meter module should be performed at similar metering conditions and with a calibration fluid having similar physical properties to the process fluid that is to be metered during field performance testing. Depending on the type and design of reference meter/meter module used, the calibration fluid and metering conditions at which the reference meter is calibrated may differ from the field process. In any case, the reference meter should have a smaller measurement uncertainty limit than the field meter being tested.
9.3 Recalibration Coriolis meters operated within their specifications, protected from abrasive particles, and not subjected to corrosive fluids should rarely need recalibration (flow factor adjustment). Meter diagnostics may be used to assess the condition of the meter and determine if recalibration is necessary Flow performance testing is left to the operator and should follow sound practice. Some regulatory agencies and/or contracts specify a test interval. A flow performance test does not mandate adjustment. Performance adjustment or recalibration of the Meter Under Test (MUT) should not be performed if the MUT’s performance is within the uncertainty of the reference and meter specifications Calibration reports generated for all meters should include “before” and “after” adjustment accuracy data to allow assessment of any error encountered.
This report is the property of AGA and is part of its process to create a new recommended practice. This document or any of its parts shall not be copied, disseminated, cited in literature, presentations or discussions by persons other than members of the American Gas Association (AGA) and American Petroleum Institute (API) who are part of its creation process without prior approval from AGA.
AGA TRANSMISSION MEASUREMENT COMMITTEE - DRAFT REPORT NO. 11 Aug 22, 2010
45 of 84
10 Coriolis Meter Measurement Uncertainty Determination Procedures for expressing the uncertainty of measurement using Coriolis flow meters shall conform to the following guides:
10.1 Types of Uncertainties
The in-situ measurement uncertainty of systems based on Coriolis flow meters is comprised of:
a) Calibration uncertainties associated with the meter calibration b) Uncertainties arising from differences between the field installation and the calibration lab,
including those that are a function of age, flow conditions or contamination c) Uncertainties associated with secondary instrumentation, such as pressure and temperature
sensors, gas composition measurement, and flow computers
10.1.1 Meter Calibration Uncertainty
Commercial flow calibration facilities maintain formal estimates of uncertainty. These estimates recognize the contributing influence of all measurement parameters involved in the calibration at the flow facility. A stated estimate of calibration uncertainty must accompany the documentation of each meter calibration. The uncertainty of meter calibration remains with the meter assembly for as long as the calibration parameters are applied to its operation.
10.1.2 Uncertainties Arising From Differences between the Field Installation and the Calibration Lab
Measurement uncertainty increases when:
a) the in-situ condition of the meter differs materially from its condition during calibration b) the in-situ characteristics of the fluid flow differ materially from those present during calibration
10.1.2.1 Parallel Meter Runs
As described in Annex J of ISO/DIS 5168, a special situation exists for meters used in parallel. The combined uncertainty of parallel meter runs may be less than that of individual meter runs. The process for estimating uncertainty identifies sources that produce different effects in each meter run, and therefore uncorrelated, versus those that produce the same effect in each meter assembly (correlated).
10.1.2.2 Installation Effects
a) Although bending mode Coriolis sensors have been shown to be mostly immune to flow distortions, some Coriolis designs may be susceptible to flow distortions from upstream piping elements (valves, headers, flow conditioners, etc.) changing the registration of a meter. The manufacturer of the meter should be consulted for estimation of the associated uncertainty.
b) Meter performance, specifically zero stability, can be adversely affected by changes in axial, bending, and torsion stresses caused by misaligned piping and poor piping weight support, that change with temperature.
c) Improper installation as referenced in 8.2.5 of the meter module can lead to increased uncertainty

This report is the property of AGA and is part of its process to create a new recommended practice. This document or any of its parts shall not be copied, disseminated, cited in literature, presentations or discussions by persons other than members of the American Gas Association (AGA) and American Petroleum Institute (API) who are part of its creation process without prior approval from AGA.
AGA TRANSMISSION MEASUREMENT COMMITTEE - DRAFT REPORT NO. 11 Aug 22, 2010
46 of 84
10.1.2.3 Pressure and Temperature Effects
a) At low flow rates (below tQ ), due to differences in ambient and gas flowing temperature conditions, thermal gradients can develop in the sensor affecting zero stability. Although the symptoms of this effect may be masked with automated “no-flow cut-offs”, uncertainty may be increased if the cut-off points are too high, resulting in un-measured gas.
b) Meter performance, specifically zero stability, can be adversely affected by changes in axial, bending, and torsion stresses caused by misaligned piping and poor piping weight support, that change with temperature.
c) Some Coriolis sensors exhibit a sensitivity to changes in operating pressure, called “flow pressure effect”. However, this effect can be compensated for through use of external pressure measurement. The manufacturer should be consulted to identify the magnitude of flow pressure effect at operating conditions and the uncertainty associated to same if uncompensated for.
10.1.2.4 Gas Quality Effects
Coriolis sensor flow tube surface contamination or coating may produce changes to the dynamic balance of the sensor’s flow tube(s) affecting zero stability. However, if the coating is stable the meter can be re-zeroed and low-end flow performance re-established.
10.1.3 Uncertainties Due to Secondary Instrumentation
The uncertainties of field equipment include the permanent, in-situ equipment as well as calibration devices used to maintain the equipment. Local operating conditions, such as ambient temperature and current gas temperature and pressure may influence the performance of in-situ equipment as well as calibration equipment. The performance of pressure and temperature sensors is critical to all metering technologies. For linear meters, such as Coriolis flow meters, the relationship between pressure, temperature, and mass is directly proportional. Secondary equipment includes devices such as flow computers that are responsible for converting real-time, uncompensated measurement data to fully compensated mass, volume, and energy data. Applicable standards, such as API MPMS Chapter 21.1, prescribe the industry-recommended practices with respect to:
• Sampling and Integration Frequencies • Linear Meter K Factors • Variable Averaging and Integration • Low Flow Cut-off • Equations of State
10.2 Uncertainty Analysis Procedure
The simplified analysis procedure consists of the five basic steps listed below.
1. Write an equation, called the data reduction equation, which gives the desired output as a function of one or more variables (components).
2. Identify those components of the data reduction equation that potentially contribute uncertainty. 3. Determine the sensitivity coefficients for each component in Item 2. 4. Obtain numerical values for the uncertainty of each component in Item 2. 5. Combine the numerical values obtained in Item 4 to give a numerical value for the uncertainty.

This report is the property of AGA and is part of its process to create a new recommended practice. This document or any of its parts shall not be copied, disseminated, cited in literature, presentations or discussions by persons other than members of the American Gas Association (AGA) and American Petroleum Institute (API) who are part of its creation process without prior approval from AGA.
AGA TRANSMISSION MEASUREMENT COMMITTEE - DRAFT REPORT NO. 11 Aug 22, 2010
47 of 84
Refer to Appendix E: Examples of Overall Measurement Uncertainty Calculations – Coriolis Meter
This report is the property of AGA and is part of its process to create a new recommended practice. This document or any of its parts shall not be copied, disseminated, cited in literature, presentations or discussions by persons other than members of the American Gas Association (AGA) and American Petroleum Institute (API) who are part of its creation process without prior approval from AGA.
AGA TRANSMISSION MEASUREMENT COMMITTEE - DRAFT REPORT NO. 11 Aug 22, 2010
48 of 84
11 Reference List
• AGA Engineering Technical Note XQ0112, Coriolis Flow Measurement for Natural Gas Applications, American Gas Association, 400 N. Capitol Street, N.W., 4th Floor, Washington, DC 20001
• AGA Engineering Technical Note M-96-2-3, Ultrasonic Flow Measurement for Natural Gas Applications, American Gas Association, 1515 Wilson Boulevard, Arlington, VA 22209
• AGA Report No. 3, Orifice Metering of Natural Gas and Other Related Hydrocarbon Fluids, American Gas Association, 1515 Wilson Boulevard, Arlington, VA 22209
• AGA Report No. 7, Measurement of Gas by Turbine Meters, American Gas Association, 1515 Wilson Boulevard, Arlington, VA 22209
• AGA Report No. 8, Compressibility Factors of Natural Gas and Other Related Hydrocarbon Gases, American Gas Association, 1515 Wilson Boulevard, Arlington, VA 22209
• AGA Report No. 9, Measurement of Gas by Multipath Ultrasonic Meters, American Gas Association, 1515 Wilson Boulevard, Arlington, VA 22209
• ANSI B16.5, Pipe Flanges and Flanged Fittings, American National Standards Institute, 25 West 42nd Street, New York, NY 10036
• ANSI/NFPA 70, National Electrical Code, 2008, American National Standards Institute (ANSI), 11 West 42nd Street, New York, NY 10036
• API Manual of Petroleum Measurement Standards Chapter 21.1, September 1993, Flow Measurement Using Electronic Metering Systems, American Petroleum Institute, 1220 L Street NW, Washington, DC 20005
• ASME B31.3, Pipe, American Society of Mechanical Engineers, Three Park Avenue, 23S2, New York, NY 10016-5990
• ASME MFC-11M, 2006, Measurement of Fluid Flow by Means of Coriolis Mass Flowmeters, American Society of Mechanical Engineers, Three Park Avenue, 23S2, New York, NY 10016-5990
• DOT, Code of Federal Regulations, Title 49, Subchapter D Pipeline Safety (49CFR), Part 192, Pipeline Safety Regulations, Transportation of Natural Gas and Other Gas by Pipeline: Minimum Federal Safety Standards.
• ISO 9951, 1993, Measurement of gas flow in closed conduits - Turbine meters, International Organization for Standardization, Case Postale 56, CH-1211 Geneve 20, Switzerland
• ISO 10790, 1999, Measurement of fluid flow in closed conduits – Coriolis meters, International Organization for Standardization, Case Postale 56, CH-1211 Geneve 20, Switzerland
• GTI Topical Report, GRI-01/0222, Coriolis mass flow meter performance with natural gas, Gas Technology Institute, 1700 South Mount Prospect Road, Des Plaines, Illinois 60018
This report is the property of AGA and is part of its process to create a new recommended practice. This document or any of its parts shall not be copied, disseminated, cited in literature, presentations or discussions by persons other than members of the American Gas Association (AGA) and American Petroleum Institute (API) who are part of its creation process without prior approval from AGA.
AGA TRANSMISSION MEASUREMENT COMMITTEE - DRAFT REPORT NO. 11 Aug 22, 2010
49 of 84
• GRI Topical Report, GRI-04/0172, Coriolis mass flow meter performance with water, air, dry - gas, & wet – gas, Gas Research Institute, 1700 South Mount Prospect Road, Des Plaines, Illinois 60018
• OIML D 11 Edition 1994 (E), International Document, General requirements for electronic measuring instruments, Organisation Internationale de Métrologie Légale, Bureau International de Métrologie Légale, 11, rue Turgot - 75009 Paris - France
• OIML R 6 Edition 1989 (E), International Recommendation, General provisions for gas volume meters, Organisation Internationale de Métrologie Légale, Bureau International de Métrologie Légale, 11, rue Turgot - 75009 Paris – France
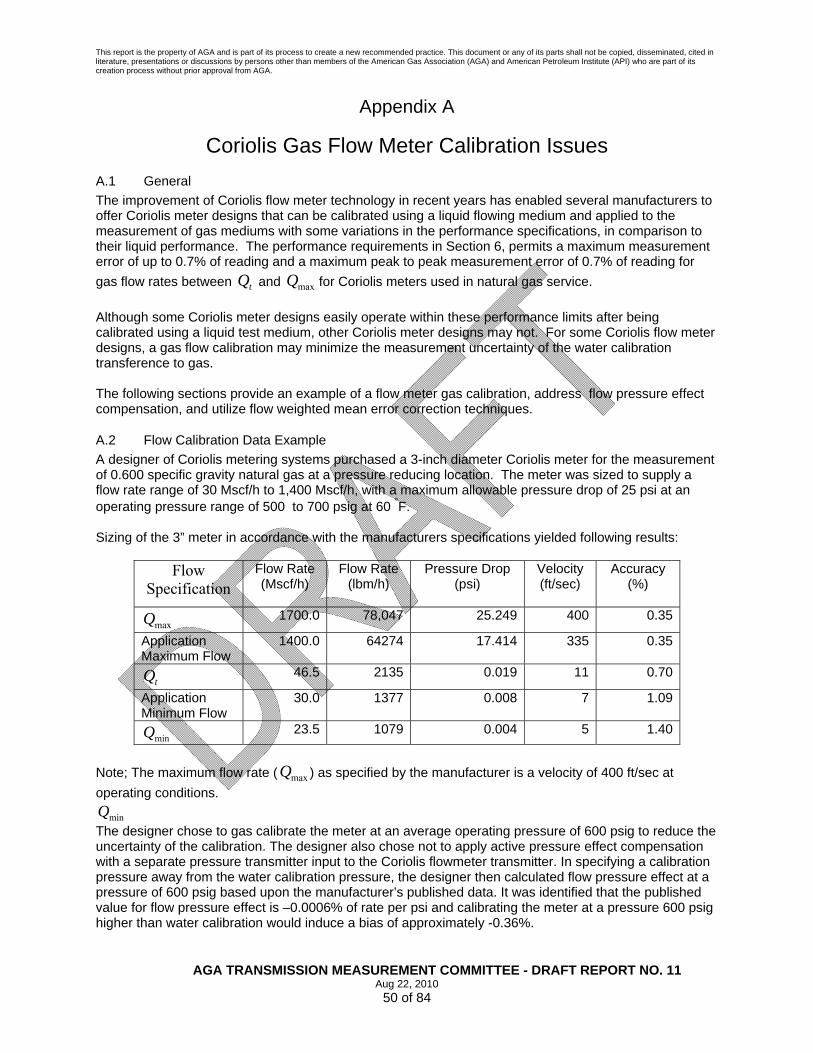
This report is the property of AGA and is part of its process to create a new recommended practice. This document or any of its parts shall not be copied, disseminated, cited in literature, presentations or discussions by persons other than members of the American Gas Association (AGA) and American Petroleum Institute (API) who are part of its creation process without prior approval from AGA.
AGA TRANSMISSION MEASUREMENT COMMITTEE - DRAFT REPORT NO. 11 Aug 22, 2010
50 of 84
Appendix A
Coriolis Gas Flow Meter Calibration Issues A.1 General The improvement of Coriolis flow meter technology in recent years has enabled several manufacturers to offer Coriolis meter designs that can be calibrated using a liquid flowing medium and applied to the measurement of gas mediums with some variations in the performance specifications, in comparison to their liquid performance. The performance requirements in Section 6, permits a maximum measurement error of up to 0.7% of reading and a maximum peak to peak measurement error of 0.7% of reading for gas flow rates between tQ and maxQ for Coriolis meters used in natural gas service. Although some Coriolis meter designs easily operate within these performance limits after being calibrated using a liquid test medium, other Coriolis meter designs may not. For some Coriolis flow meter designs, a gas flow calibration may minimize the measurement uncertainty of the water calibration transference to gas. The following sections provide an example of a flow meter gas calibration, address flow pressure effect compensation, and utilize flow weighted mean error correction techniques.
A.2 Flow Calibration Data Example A designer of Coriolis metering systems purchased a 3-inch diameter Coriolis meter for the measurement of 0.600 specific gravity natural gas at a pressure reducing location. The meter was sized to supply a flow rate range of 30 Mscf/h to 1,400 Mscf/h, with a maximum allowable pressure drop of 25 psi at an operating pressure range of 500 to 700 psig at 60 °F. Sizing of the 3” meter in accordance with the manufacturers specifications yielded following results:
Flow Specification
Flow Rate (Mscf/h)
Flow Rate (lbm/h)
Pressure Drop (psi)
Velocity (ft/sec)
Accuracy (%)
maxQ 1700.0 78,047 25.249 400 0.35
Application Maximum Flow
1400.0 64274 17.414 335 0.35
tQ 46.5 2135 0.019 11 0.70
Application Minimum Flow
30.0 1377 0.008 7 1.09
minQ 23.5 1079 0.004 5 1.40
Note; The maximum flow rate ( maxQ ) as specified by the manufacturer is a velocity of 400 ft/sec at operating conditions.
minQ The designer chose to gas calibrate the meter at an average operating pressure of 600 psig to reduce the uncertainty of the calibration. The designer also chose not to apply active pressure effect compensation with a separate pressure transmitter input to the Coriolis flowmeter transmitter. In specifying a calibration pressure away from the water calibration pressure, the designer then calculated flow pressure effect at a pressure of 600 psig based upon the manufacturer’s published data. It was identified that the published value for flow pressure effect is –0.0006% of rate per psi and calibrating the meter at a pressure 600 psig higher than water calibration would induce a bias of approximately -0.36%.
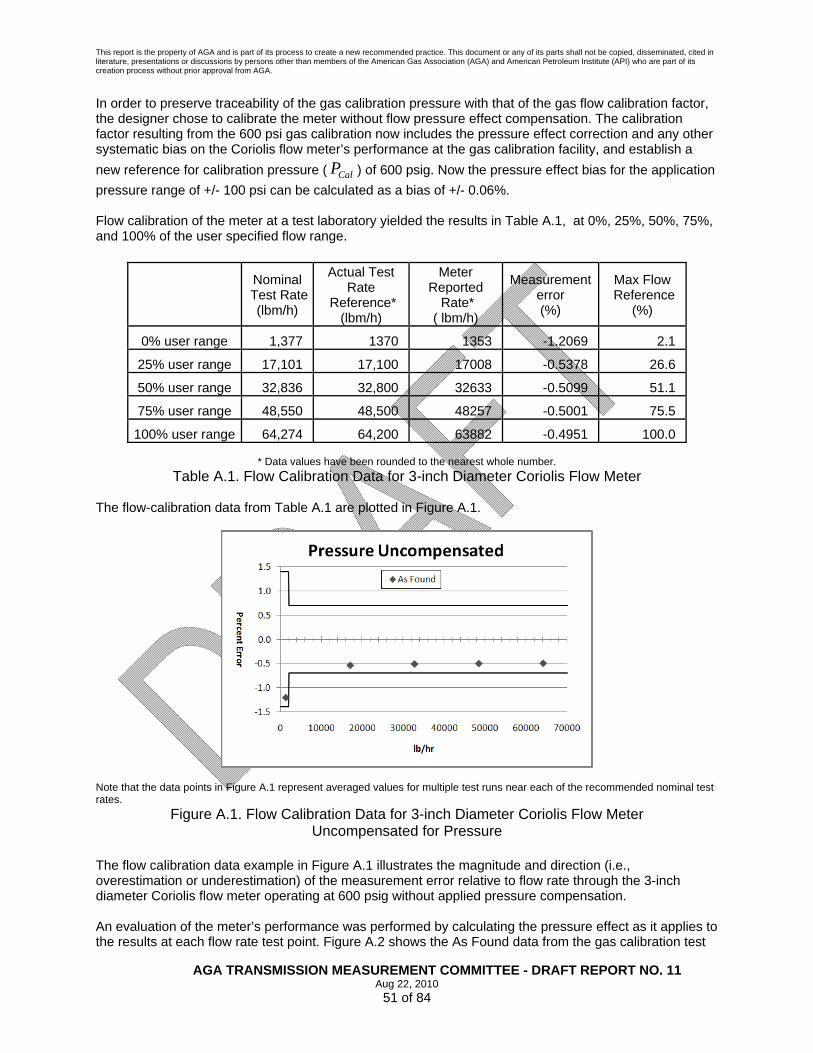
This report is the property of AGA and is part of its process to create a new recommended practice. This document or any of its parts shall not be copied, disseminated, cited in literature, presentations or discussions by persons other than members of the American Gas Association (AGA) and American Petroleum Institute (API) who are part of its creation process without prior approval from AGA.
AGA TRANSMISSION MEASUREMENT COMMITTEE - DRAFT REPORT NO. 11 Aug 22, 2010
51 of 84
In order to preserve traceability of the gas calibration pressure with that of the gas flow calibration factor, the designer chose to calibrate the meter without flow pressure effect compensation. The calibration factor resulting from the 600 psi gas calibration now includes the pressure effect correction and any other systematic bias on the Coriolis flow meter’s performance at the gas calibration facility, and establish a new reference for calibration pressure ( CalP ) of 600 psig. Now the pressure effect bias for the application pressure range of +/- 100 psi can be calculated as a bias of +/- 0.06%. Flow calibration of the meter at a test laboratory yielded the results in Table A.1, at 0%, 25%, 50%, 75%, and 100% of the user specified flow range.
Nominal
Test Rate (lbm/h)
Actual Test Rate
Reference* (lbm/h)
Meter Reported
Rate* ( lbm/h)
Measurement error (%)
Max Flow Reference
(%)
0% user range 1,377 1370 1353 -1.2069 2.1
25% user range 17,101 17,100 17008 -0.5378 26.6
50% user range 32,836 32,800 32633 -0.5099 51.1
75% user range 48,550 48,500 48257 -0.5001 75.5
100% user range 64,274 64,200 63882 -0.4951 100.0
* Data values have been rounded to the nearest whole number. Table A.1. Flow Calibration Data for 3-inch Diameter Coriolis Flow Meter
The flow-calibration data from Table A.1 are plotted in Figure A.1.
Note that the data points in Figure A.1 represent averaged values for multiple test runs near each of the recommended nominal test rates.
Figure A.1. Flow Calibration Data for 3-inch Diameter Coriolis Flow Meter Uncompensated for Pressure
The flow calibration data example in Figure A.1 illustrates the magnitude and direction (i.e., overestimation or underestimation) of the measurement error relative to flow rate through the 3-inch diameter Coriolis flow meter operating at 600 psig without applied pressure compensation. An evaluation of the meter’s performance was performed by calculating the pressure effect as it applies to the results at each flow rate test point. Figure A.2 shows the As Found data from the gas calibration test

This report is the property of AGA and is part of its process to create a new recommended practice. This document or any of its parts shall not be copied, disseminated, cited in literature, presentations or discussions by persons other than members of the American Gas Association (AGA) and American Petroleum Institute (API) who are part of its creation process without prior approval from AGA.
AGA TRANSMISSION MEASUREMENT COMMITTEE - DRAFT REPORT NO. 11 Aug 22, 2010
52 of 84
and the calculated pressure effect . Note the -0.36% bias impact I on the flowmeter performance at 600 psig without active pressure compensation applied with a pressure input to the transmitter.
Figure A.2. Flow Calibration Data for 3-inch Diameter Coriolis Flow Meter Uncompensated and Compensated for Pressure at 600 psig
Section A.5 describes a methodology to derive a calibration factor(s) from the results listed in Table A.1.
A.3 Methods for Correcting Coriolis Flow Measurement Errors The total flow measurement error of a Coriolis meter consists of two parts: (1) random (or precision) errors and (2) systematic (or bias) errors. Random errors can be caused by numerous influences on meter operation. Random errors typically follow a normal or Gaussian statistical distribution. The magnitude of the random error can usually be reduced by acquiring multiple measurement samples and then applying accepted statistical principles. Systematic errors are repeatable measurement biases of known magnitude and sign. The cause of a systematic error may or may not be known. Usually, most systematic errors can be identified and eliminated by flow calibration of the meter. Due to meter design, component tolerances, the variation of manufacturing processes, and other factors, each Coriolis meter has its own unique operating characteristics. In order to minimize the measurement uncertainty of a particular Coriolis flow meter, a meter manufacturer may calibrate the meter and then apply the calibration data to compensate for the “as built” measurement error associated with the meter. Depending on the meter application and the needs of the meter owner/operator there are a number of error correction techniques that the meter manufacturer can use. The following section includes a suggested technique that utilizes a single flow weighted mean error (FWME) correction factor. When acceptable linearity exists in the flow measurement performance of a particular Coriolis flow meter over its operational flow range, the FWME correction method is an effective means of implementing a single correction factor weighted toward minimizing the average measurement error over a specific (prioritized) portion of the operational flow range of the meter. If the non-linearity over the operational flow range is unacceptable for the application in which the Coriolis meter is intended, more robust error correction techniques can be employed. Examples of these techniques include high order curve fit algorithms, such as a second- or third-order polynomial equation and a multipoint linear interpolation method. The designer or operator should consult with the meter manufacturer regarding the error correction techniques available for a particular Coriolis flow meter to identify the most effective technique for minimizing measurement error for a given meter application.

This report is the property of AGA and is part of its process to create a new recommended practice. This document or any of its parts shall not be copied, disseminated, cited in literature, presentations or discussions by persons other than members of the American Gas Association (AGA) and American Petroleum Institute (API) who are part of its creation process without prior approval from AGA.
AGA TRANSMISSION MEASUREMENT COMMITTEE - DRAFT REPORT NO. 11 Aug 22, 2010
53 of 84
A.4 Flow-Weighted Mean Error (FWME) Calculations The calculation of the FWME of a meter from actual flow test data is a method of calibrating a meter when only a single correction factor correction is applied to the meter output. As noted previously, FWME is only one of many techniques for adjustment of a Coriolis meter calibration to minimize the flow measurement uncertainty of the meter. The example flow calibration data in Section A.1 will now be used to demonstrate how to calculate the FWME for a 3-inch diameter Coriolis flow meter in operating conditions similar to those that the meter would experience during field service. The determination and application of a single FWME correction factor to the flow calibration test results will produce a resultant FWME equal to zero. Meter performance, both before and after a correction factor has been applied, shall be compared with the performance requirements specified in Section 6.0. The FWME for the data set in Table A.1 of Section A.1 is defined by the following equation.
∑
∑
=
== n
i TestMax
i
n
ii
TestMax
i
EQ
Q
FWME
1
1
Or
∑
∑
=
== n
ii
n
iii
WF
EWFFWME
1
1
Where: iQ = Reference flow test rate
TestMaxQ = Maximum reference flow test rate
iWF = TestMax
i
= The weighting factor for each flow test point
iE = The indicated flow rate error (in percent) at the tested flow rate Some alternate methods for computing the FWME are as follows:
• Calculate ( iWF ) at each flow test point with an additional weighting factor such as a flow time weighted factor dependent on whether the meter will run mostly in the lower range or upper range of the meter during field service. To apply this method, the weighting factor ( iWF ) in equation (A.2) would be defined as.
TestMax
i
tp
ii Q
QxFTFTWF =
Where: tpFT = A time which is proportional and represents the meters life cycle
in field service. iFT = The flow time over the time period specified by ( tpFT ) that the
meter will operate at the test flow rate ( iQ ).
(A.1)
(A.2)
(A.3)

This report is the property of AGA and is part of its process to create a new recommended practice. This document or any of its parts shall not be copied, disseminated, cited in literature, presentations or discussions by persons other than members of the American Gas Association (AGA) and American Petroleum Institute (API) who are part of its creation process without prior approval from AGA.
AGA TRANSMISSION MEASUREMENT COMMITTEE - DRAFT REPORT NO. 11 Aug 22, 2010
54 of 84
For example, if the meter spent 18 hours of a day operating in the range of the two lowest test flow rates and the remainder of the day in the range of the upper test flow rates. The two lowest test flow rates would be given a ( iFT ) of 18 and the upper test
flow rates would be given a ( iFT ) of 6. Furthermore, the value of
( tpFT ) would be 24.
• If the specified measuring range of a meter or metering module is known beforehand and when this range is smaller than the maximum specified measuring range of the meter, it is recommended to determine the FWME and adjust the meter over the actual operating range only.
A.5 Flow-Weighted Mean Error (FWME) – Example Calculation. Applying Equation A.2 to calculate the FWME for the test data in Table A.1 excluding test data collected below the transitional flow rate (i.e. below 2135 lb/hr), as specified in section 7.2, produces the result shown in Table A.2. The weighting factor ( iWF ) is included in Table A.2 to show the value of the factor
before it is applied to each flow rate error ( iE ).
Actual Test Rate Reference
Meter (lbm/h)
iWF
iE
(%) iWF x iE (%)
17,101 0.2664 -0.5378 -0.1433 32,836 0.5109 -0.5099 -0.2605 48,550 0.7555 -0.5001 -0.3778 64,274 1.0000 -0.4951 -0.4951
Sum = 2.5327 Sum = -1.2767
Table A.3. FWME Calculation Summary for 3-inch Diameter” Coriolis Flow Meter
The FWME value for the test data in Table A.2 is calculated using equation A.2 as follows:
%5041.05327.22767.1
1
1 −=−
==
∑
∑
=
=n
ii
n
iii
WF
EWFFWME
A single FWME calibration factor (F) can now be applied to the meter output to reduce the magnitude of the measurement error. The correction factor (F) is calculated as follows:
)100/(100 FWMEF += 0051.1)5041.0100/(100 =−+=F
This calibration factor may be applied in the flow computer of the Coriolis flow metering system.
(A.4)

This report is the property of AGA and is part of its process to create a new recommended practice. This document or any of its parts shall not be copied, disseminated, cited in literature, presentations or discussions by persons other than members of the American Gas Association (AGA) and American Petroleum Institute (API) who are part of its creation process without prior approval from AGA.
AGA TRANSMISSION MEASUREMENT COMMITTEE - DRAFT REPORT NO. 11 Aug 22, 2010
55 of 84
As a final step, the designer may want to validate the application of the calibration factor using the same FWME calculations. By multiplying the Coriolis meter error results by the calibration factor (F), the adjusted error can be determined. The adjusted error ( icfE ) at each calibration flow rate ( iQ ) can be calculated by the following equation:
100))100(( −+= xFEE iicf Applying equations A.4 and A.5, the adjusted error for each calibration flow is calculated as shown in Table A.3.
iE (%) iWF icfE
(%) iWF x icfE (%)
-0.5378 0.2664 -0.0339 -0.0090 -0.5099 0.5109 -0.0059 -0.0030 -0.5001 0.7555 0.0040 0.0030 -0.4951 1.0000 0.0090 0.0090
Sum = 2.5327 Sum = 0.0000 Table A.4. Correction Factor Adjusted FWME Calculation Summary for 3–inch Diameter Coriolis
Flow Meter Using the adjusted data from Table A.3 and applying equation A.2, the “Correction Factor Adjusted FWME” can be calculated as follows:
%0000.05327.20000.0
1
1 ===
∑
∑
=
=n
ii
n
iicfi
WF
EWFFWME
Note that the slight errors indicated by the “Correction Factor Adjusted FWME” are caused by rounding errors.
By Applying the FWME calibration factor (F) to the flow calibration data in Figure A.1, the corrected flow rate error data are as presented in Figure A.3.
(A.5)

This report is the property of AGA and is part of its process to create a new recommended practice. This document or any of its parts shall not be copied, disseminated, cited in literature, presentations or discussions by persons other than members of the American Gas Association (AGA) and American Petroleum Institute (API) who are part of its creation process without prior approval from AGA.
AGA TRANSMISSION MEASUREMENT COMMITTEE - DRAFT REPORT NO. 11 Aug 22, 2010
56 of 84
Figure A.3. FWME-Corrected Flow Calibration Data for 3-inch Diameter Coriolis Flow Meter This method of calculating a FWME calibration factor accomplishes the following:
1) Incorporates the correction for flow pressure effect compensation from the water calibration pressure to gas test pressure into the FWME correction factor.
2) Re-establishes the calibration pressure ( CalP ) of the meter to the gas calibration test pressure.
3) Weight the measurement error at the test flow rates according to the rate at which the gas is flowing.
4) Maintains the original manufacturer’s calibration traceability. Using this method always weight the correction factor for the best correction at the upper-most test flow rates. This correction method may result in somewhat less precise measurement performance for the lower-most test flow rates because only a single calibration factor is applied. Another method could be employed where data is linearized in the flow computer using curve fitting techniques to improve the meter correction over the entire flow rate range. Linearization is typically not applied to Coriolis flowmeters due to the exceptional linear performance of the device.

This report is the property of AGA and is part of its process to create a new recommended practice. This document or any of its parts shall not be copied, disseminated, cited in literature, presentations or discussions by persons other than members of the American Gas Association (AGA) and American Petroleum Institute (API) who are part of its creation process without prior approval from AGA.
AGA TRANSMISSION MEASUREMENT COMMITTEE - DRAFT REPORT NO. 11 Aug 22, 2010
57 of 84
Appendix B
Coriolis Meter Data Sheet
This report is the property of AGA and is part of its process to create a new recommended practice. This document or any of its parts shall not be copied, disseminated, cited in literature, presentations or discussions by persons other than members of the American Gas Association (AGA) and American Petroleum Institute (API) who are part of its creation process without prior approval from AGA.
AGA TRANSMISSION MEASUREMENT COMMITTEE - DRAFT REPORT NO. 11 Aug 22, 2010
58 of 84
Appendix C
(AGA Engineering Tech Note on Coriolis Flow Measurement for Natural Gas Applications)
This report is the property of AGA and is part of its process to create a new recommended practice. This document or any of its parts shall not be copied, disseminated, cited in literature, presentations or discussions by persons other than members of the American Gas Association (AGA) and American Petroleum Institute (API) who are part of its creation process without prior approval from AGA.
AGA TRANSMISSION MEASUREMENT COMMITTEE - DRAFT REPORT NO. 11 Aug 22, 2010
59 of 84
Appendix D
Examples of Overall Measurement Uncertainty Calculations – Coriolis Meter
D.1 General The following is a simplified example of estimating measurement uncertainty for sites using Coriolis gas flow meters. Following the pattern demonstrated in ISO 5168, the estimation of uncertainty is based on a sequence of: a) establishing a mathematical model for the measurement process b) listing and quantifying the contributory variances c) combining variances into a composite statement of uncertainty D.2 Mathematical Model The gas volume flow rate at base conditions is given by:
⎟⎟⎠
⎞⎜⎜⎝
⎛=
b
pmb
FQQ
ρ
D.3 Contributory Variances The relative (percentage) combined standard uncertainty in the measurement is given by the following equation:
( ) 2*2*2*2*bpm
uuuQu FQb ρ++=
D.3.1 Uncertainty in the Mass Flow Rate The total uncertainty is composed of uncertainty in the calibration plus long term reproducibility in the field. Calibration uncertainty is assumed to include the flow laboratory, its chain of traceability and the repeatability of the meter under test. Uncertainty under field conditions is assumed to include all site-specific installation effects, including those associated with flow characteristics, equipment age, cleanliness and data acquisition.
2*2*2*FieldmCalmm QQQ uuu +=
%15.0* =
CalmQu , coverage factor k=1, as estimated by flow laboratory

This report is the property of AGA and is part of its process to create a new recommended practice. This document or any of its parts shall not be copied, disseminated, cited in literature, presentations or discussions by persons other than members of the American Gas Association (AGA) and American Petroleum Institute (API) who are part of its creation process without prior approval from AGA.
AGA TRANSMISSION MEASUREMENT COMMITTEE - DRAFT REPORT NO. 11 Aug 22, 2010
60 of 84
%05.0* =FieldmQu , as estimated by user
222* 05.015.0 +=
mQu
%16.0* =mQu
D.3.2 Uncertainty in Flow Pressure Effect Compensation Factor ( pF ) The relationship for pressure effect is such that.
))(*)100/((11
CalfEffectp PPPF
−+=
pF uncertainty is composed of estimates of uncertainty in flowing pressure ( fP ) and calibration
pressure ( CalP ) with a sensitivity proportional to pressure effect ( EffectP ). Pressure flowing uncertainty is composed of uncertainty in calibration and field long-term reproducibility. The estimate of field uncertainty includes the effect of ambient conditions, equipment age, and data acquisition.
( )2*2*2*CalfEffectp PPPF uusu +=
002.0=EffectPs , highest sensitivity, Coverage Factor k=1, as estimated by manufacturer
%1.02* =fPu , Coverage Factor k=1, as estimated by manufacturer
%1.02* =CalPu , Coverage Factor k=1, as estimated by manufacturer
( )222* 1.01.0002.0 +=pFu
%0003.02* =pFu
D.3.3 Uncertainty in the Determination of Base Density ( bρ ) The relationship for base density is such that.
bb
rbb RTZ
MP=ρ

This report is the property of AGA and is part of its process to create a new recommended practice. This document or any of its parts shall not be copied, disseminated, cited in literature, presentations or discussions by persons other than members of the American Gas Association (AGA) and American Petroleum Institute (API) who are part of its creation process without prior approval from AGA.
AGA TRANSMISSION MEASUREMENT COMMITTEE - DRAFT REPORT NO. 11 Aug 22, 2010
61 of 84
Given the base pressure ( bp ), gas constant ( R ), and base temperature ( bT ) are constants by
definition. For this example, the estimation of uncertainty includes the uncertainty in Molar Weight ( rM )
and base compressibility ( bZ ), which are dependent on gas composition analysis. For simplicity in this example, the gas composition analysis uncertainty is assumed to be zero. A more comprehensive analysis of uncertainty would include the contributory variances of gas calibration standards and chromatography. D.4 Combined Uncertainty Applying the values from above examples, the revised expression for combined uncertainty is:
( ) 2*2*2*2*bpm
uuuQu FQb ρ++=
( ) 2222* 0.00003.016.0 ++=bQu
( ) %16.0* =bQu D.5 Expanded Uncertainty An expanded uncertainty, coverage factor k=2, approximate confidence level 95%, is:
( ) ( )bb QkuQu **95 =
( ) %)16.0(2*95 =bQu
( ) %32.0*95 =bQu
xx cubic feet per hour +/-0.32% (expanded uncertainty, coverage factor k=2, approximate confidence level 95 percent).

This report is the property of AGA and is part of its process to create a new recommended practice. This document or any of its parts shall not be copied, disseminated, cited in literature, presentations or discussions by persons other than members of the American Gas Association (AGA) and American Petroleum Institute (API) who are part of its creation process without prior approval from AGA.
AGA TRANSMISSION MEASUREMENT COMMITTEE - DRAFT REPORT NO. 11 Aug 22, 2010
62 of 84
Appendix E
AGA11 Measurement System E.1� Coriolis Measurement System Architecture A fundamental Coriolis gas measurement system is depicted in Figure E.1 and is composed of a Coriolis Sensor, Transmitter, and flow computer. Dependent upon system design and process conditions, an analytical transmitter (on-site or off-site) and pressure transmitter (on-site) may or may not be required. A Coriolis sensor incorporates multiple sensing elements from which gas flow, flow tube temperature, and flowing density are inferred by the transmitter. The transmitter also performs sensor and transmitter diagnostic functions, and communicates diagnostic and inferential measurement information, partially or completely, through analog and/or digital methods to a gas flow computer.
Figure E.1 It is important to note that the transmitter will always be located physically on-site, either local or remote to the sensor. The flow computer should be viewed as software that can exist either on-site or off-site. In the case of on-site, the flow computer can be located in electronic hardware in same enclosure as the transmitter or in electronic hardware in a separate enclose. In the case of off-site, the flow computer is located in a central data processing system through a digital communication link. The flow computer, at a minimum, collects mass flow information from the transmitter and at a maximum also collects flow tube temperature, flowing density, configuration and calibration variables, and diagnostic information from the transmitter along with live analytical, live pressure, and other process information. It utilizes this information to perform flow measurement calculations, enhanced diagnostics, and in some cases control the flow measurement process. In performing these tasks, the flow computer shall retain all metrological significant information that it controls or has access to in the configuration, event, and data logs to facilitate a chronologic audit of the measurement process along with deconstruction and reconstruction with relevant corrections when necessary.

This report is the property of AGA and is part of its process to create a new recommended practice. This document or any of its parts shall not be copied, disseminated, cited in literature, presentations or discussions by persons other than members of the American Gas Association (AGA) and American Petroleum Institute (API) who are part of its creation process without prior approval from AGA.
AGA TRANSMISSION MEASUREMENT COMMITTEE - DRAFT REPORT NO. 11 Aug 22, 2010
63 of 84
E.2 Transmitter to Flow Computer Interface Dependent upon design, the communications interface between the transmitter and flow computer can be either unidirectional or bidirectional. The unidirectional interface typically consists of a combination of unidirectional discrete digital, frequency and analog signals generated by the transmitter and monitored by the flow computer. The bidirectional interface is typically a digital communications link with read only or read/write capability. E.2.1 Unidirectional Discrete I/0 Interface At a minimum, the unidirectional discrete I/O communications interface from the transmitter to the flow computer shall consist of a digital frequency and/or analog signal(s) that indicate mass flow sensed by the Coriolis sensor. Methods for facilitating flow indication will be as follows.
1) A single signal from the transmitter to flow computer proportional to unidirectional flow
through the Coriolis Sensor (Minimum requirement unidirectional flow), or 2) A single signal from the transmitter to flow computer proportional to the absolute value of
flow through the Coriolis Sensor with another signal representing flow direction (Minimum requirement facilitating bidirectional flow measurement through the sensor), or
3) Dual frequency signals, one representing forward and one representing reverse flow, or 4) Dual frequency signals with quadrature phase shifting to indicate flow direction and fault
conditions. This functionality may be implemented as shown in figure E.2.
Figure E.2
Quadrature Phase Shifting The incorporation of other unidirectional signals, either analog and or digital, representative of a system fault, flow tube temperature, flowing density, etc. are optional. E.2.2 Bidirectional Communications Interface The bidirectional communications interface between the transmitter and flow computer can consist of a parallel data bus or serial data link (i.e. RS-232, RS485, Ethernet, etc.). Dependent upon design, the transmitter communications port can be a read only or read/write. If the transmitter communications port accessed by the flow computer allows read/write functionality, the flow computer shall retain a current record/log of all metrological significant configuration variables it has the ability to change and an event record/log of historic change to these variables.

This report is the property of AGA and is part of its process to create a new recommended practice. This document or any of its parts shall not be copied, disseminated, cited in literature, presentations or discussions by persons other than members of the American Gas Association (AGA) and American Petroleum Institute (API) who are part of its creation process without prior approval from AGA.
AGA TRANSMISSION MEASUREMENT COMMITTEE - DRAFT REPORT NO. 11 Aug 22, 2010
64 of 84
E.3 Transmitter E.3.1 Transmitter Flow Calculations The transmitter monitors signals from pickoff(s)/flow tube(s) position sensors located across the length of the Coriolis flow tube(s). By integrating the flow tube(s) position, from inlet to outlet, and determining a phase shift in position relative to time at zero flow and flow, mass flow is determined such that:
tfm FttFCFQtedUncompensa
)( 0Δ−Δ= Eq. (E.1)
Where: tedUncompensamQ = Mass flow rate uncompensated for flow pressure effect and
secondary gas calibration factor(s) FCF = Sensor flow calibration factor ftΔ = Phase shift at flow
0tΔ = Phase shift at zero flow
tF = Flow temperature correction factor The flow temperature compensation factor ( tF ) is calculated as follows:
)(1 TFTFt −= Eq. (E.2) Where: tF = Flow temperature compensation factor
T = Temperature in degrees Celsius FT = Temperature coefficient (%/100 Deg C)
E.3.2 Transmitter Algorithms and Variables of Metrological Interest Due to the ability of a Coriolis meter to measure mass flow, flow tube temperature, and gas flowing density, there are common calibration variables, units of measure, and algorithm settings related to this functionality that can influence mass flow measurement and Transmitter output. Verification and record of the values is necessary to insure accurate flow measurement and the audit of historic measurement performed by a Coriolis meter. A summary of these items may include but is not limited to the following: Mass units - lb, kg, tons, grams, etc. Mass flow damping - The time period for a rolling average on mass flow output No flow cut-off - Mass flow rate at mass and flow time unit settings Flow time unit - sec, hour, day Temperature unit - Celsius, Fahrenheit Density unit - gm/cc, lb/f3, kg/m3, etc. Temperature calibration intercept - degrees Temperature calibration slope - value Density calibration Points - Density value Tube periods at density calibration pts. - Tube period Density temperature coefficient - Value Density flow effect - Value High slug flow limit - Density value, if flowing density exceeds value, flow rate
output and accumulation is set to zero

This report is the property of AGA and is part of its process to create a new recommended practice. This document or any of its parts shall not be copied, disseminated, cited in literature, presentations or discussions by persons other than members of the American Gas Association (AGA) and American Petroleum Institute (API) who are part of its creation process without prior approval from AGA.
AGA TRANSMISSION MEASUREMENT COMMITTEE - DRAFT REPORT NO. 11 Aug 22, 2010
65 of 84
Low slug flow limit - Density value, if flowing density exceeds value, flow rate output and accumulation is set to zero
When bidirectional communications between the transmitter and flow computer exists, there is the ability for the flow computer to manage the calibration, unit of measure, and algorithm variables. If this metrological management functionality exists, the flow computer shall maintain configuration and event records for these variables. E.4 Flow Computer Measurement Methods E.4.1 Flow Computer Calculations In Coriolis linear metering applications, the Coriolis sensor and transmitter have the ability to provide updates to flow rate indication and counts accumulation at frequencies of 100 hertz or higher, either through a frequency output, serial communication flow rate indication, or a serial communication accumulator. Due to this response time and the ability of a Coriolis sensor to accurately measure rapidly changing or pulsating flows, it is recommended that flow computers calculate and accumulate flow based on a pulse counter tied to the transmitter frequency output or the transmitter mass counts accumulator. A total quantity (V ) is determined by the summation of flow counts over a defined time interval ( tΔ )
between time 0t and t . In equation form, the calculation of total quantity determined from flow counts is expressed as:
∑=
=t
tnnCountsV
0
Eq. (E.3)
Where: V = Total quantity between time interval 0t and t
nCounts = Counts accrued between time interval 0t and t
0t = Time at start of interval ( tΔ )
t = Time at end of interval ( tΔ ) A total quantity (V ) can be calculated from an analog outputs or flow rate indication from the transmitter. Flow rate is typically not constant; therefore, a true total quantity or Integral Value ( IV ) is the integrated flow rate over a specified Quantity Calculation Period (QCP) based on continuously changing conditions. In reality, the variables that define flow are not read continuously by a flow computer, they are taken at discrete sampling intervals. Therefore, the equation becomes:
( )∑=
=
Δ=ni
iii tQIV
1
Eq. (E.4)
Where: IV = Integral value or total Integral quantity accumulated over
QCP i = Sample number
n = Number of samples taken over the it
QCPnΔ
=
iQ = Flow rate based on data taken at sample i
itΔ = Time between samples
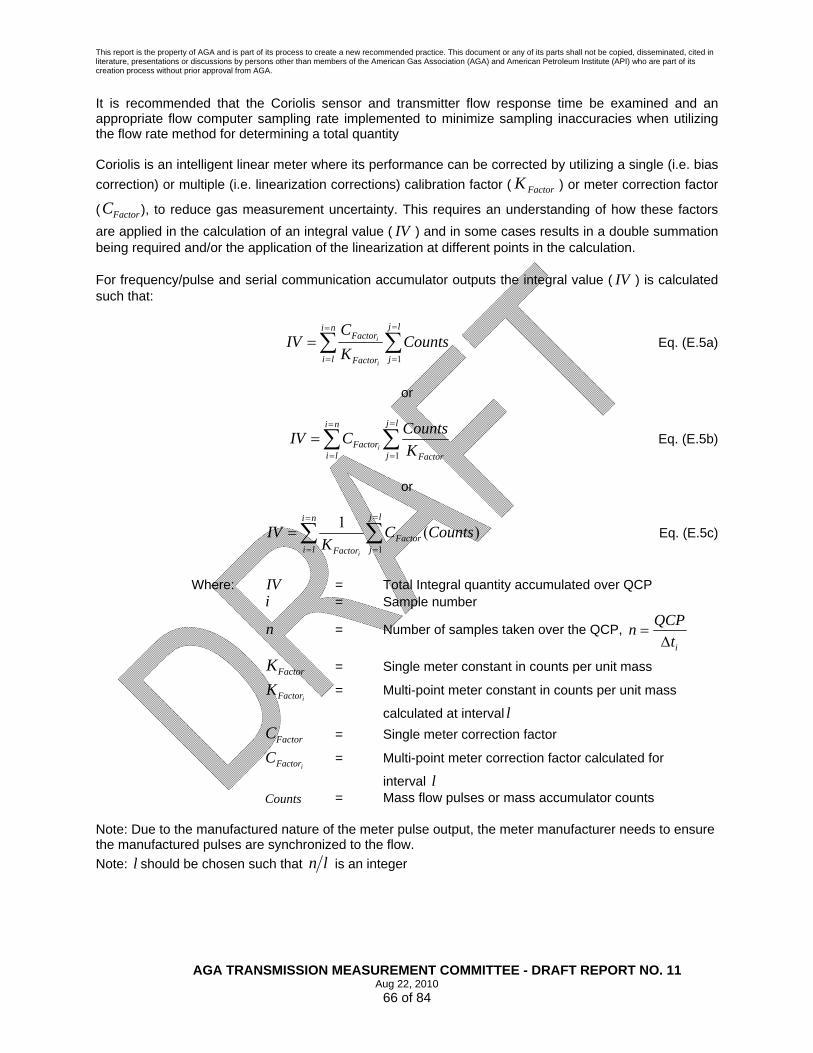
This report is the property of AGA and is part of its process to create a new recommended practice. This document or any of its parts shall not be copied, disseminated, cited in literature, presentations or discussions by persons other than members of the American Gas Association (AGA) and American Petroleum Institute (API) who are part of its creation process without prior approval from AGA.
AGA TRANSMISSION MEASUREMENT COMMITTEE - DRAFT REPORT NO. 11 Aug 22, 2010
66 of 84
It is recommended that the Coriolis sensor and transmitter flow response time be examined and an appropriate flow computer sampling rate implemented to minimize sampling inaccuracies when utilizing the flow rate method for determining a total quantity Coriolis is an intelligent linear meter where its performance can be corrected by utilizing a single (i.e. bias correction) or multiple (i.e. linearization corrections) calibration factor ( FactorK ) or meter correction factor
( FactorC ), to reduce gas measurement uncertainty. This requires an understanding of how these factors are applied in the calculation of an integral value ( IV ) and in some cases results in a double summation being required and/or the application of the linearization at different points in the calculation. For frequency/pulse and serial communication accumulator outputs the integral value ( IV ) is calculated such that:
∑ ∑=
=
=
=
=ni
li
lj
jFactor
Factor CountsKC
IVi
i
1 Eq. (E.5a)
or
∑ ∑=
=
=
=
=ni
li
lj
j FactorFactor K
CountsCIVi
1 Eq. (E.5b)
or
)(11
∑ ∑=
=
=
=
=ni
li
lj
jFactor
Factor
CountsCK
IVi
Eq. (E.5c)
Where: IV = Total Integral quantity accumulated over QCP i = Sample number
n = Number of samples taken over the QCP, it
QCPnΔ
=
FactorK = Single meter constant in counts per unit mass
iFactorK = Multi-point meter constant in counts per unit mass
calculated at interval l FactorC = Single meter correction factor
iFactorC = Multi-point meter correction factor calculated for
interval l Counts = Mass flow pulses or mass accumulator counts Note: Due to the manufactured nature of the meter pulse output, the meter manufacturer needs to ensure the manufactured pulses are synchronized to the flow. Note: l should be chosen such that ln is an integer
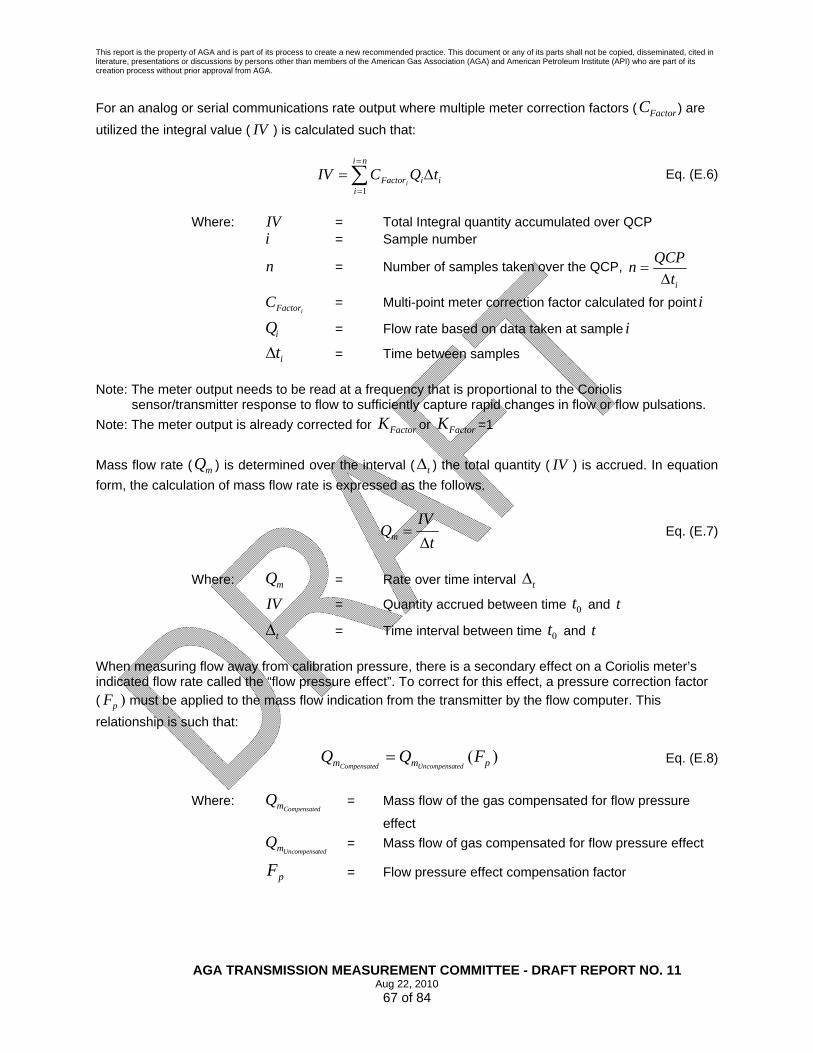
This report is the property of AGA and is part of its process to create a new recommended practice. This document or any of its parts shall not be copied, disseminated, cited in literature, presentations or discussions by persons other than members of the American Gas Association (AGA) and American Petroleum Institute (API) who are part of its creation process without prior approval from AGA.
AGA TRANSMISSION MEASUREMENT COMMITTEE - DRAFT REPORT NO. 11 Aug 22, 2010
67 of 84
For an analog or serial communications rate output where multiple meter correction factors ( FactorC ) are utilized the integral value ( IV ) is calculated such that:
∑=
=
Δ=ni
iiiFactor tQCIV
i1
Eq. (E.6)
Where: IV = Total Integral quantity accumulated over QCP i = Sample number
n = Number of samples taken over the QCP, it
QCPnΔ
=
iFactorC = Multi-point meter correction factor calculated for point i
iQ = Flow rate based on data taken at sample i
itΔ = Time between samples Note: The meter output needs to be read at a frequency that is proportional to the Coriolis
sensor/transmitter response to flow to sufficiently capture rapid changes in flow or flow pulsations. Note: The meter output is already corrected for FactorK or FactorK =1 Mass flow rate ( mQ ) is determined over the interval ( tΔ ) the total quantity ( IV ) is accrued. In equation form, the calculation of mass flow rate is expressed as the follows.
tIV
Qm Δ= Eq. (E.7)
Where: mQ = Rate over time interval tΔ
IV = Quantity accrued between time 0t and t
tΔ = Time interval between time 0t and t When measuring flow away from calibration pressure, there is a secondary effect on a Coriolis meter’s indicated flow rate called the “flow pressure effect”. To correct for this effect, a pressure correction factor ( pF ) must be applied to the mass flow indication from the transmitter by the flow computer. This relationship is such that:
)( pmm FQQtedUncompensadCompensate
= Eq. (E.8)
Where:
dCompensatemQ = Mass flow of the gas compensated for flow pressure
effect
tedUncompensamQ = Mass flow of gas compensated for flow pressure effect
pF = Flow pressure effect compensation factor

This report is the property of AGA and is part of its process to create a new recommended practice. This document or any of its parts shall not be copied, disseminated, cited in literature, presentations or discussions by persons other than members of the American Gas Association (AGA) and American Petroleum Institute (API) who are part of its creation process without prior approval from AGA.
AGA TRANSMISSION MEASUREMENT COMMITTEE - DRAFT REPORT NO. 11 Aug 22, 2010
68 of 84
The flow pressure effect compensation factor ( pF ) is calculated in accordance with the following equation.
))(*)100/((11
CalfEffectp PPPF
−+= Eq. (E.9)
Where: pF = Flow pressure effect compensation factor
EffectP = Flow pressure effect in percent of rate per psig
fP = Measurement fluid static pressure in psig
CalP = Calibration static pressure in psig The flow rate from a Coriolis measurement system can take several forms depending on whether the ultimate quantity being measured is mass, volume at base conditions, energy, or volume at flowing conditions. Appropriate conversions, relative to the gas physical properties and process conditions, must be applied to accurately obtain the desired units. The equation for flow rate at base conditions, including flow pressure effect correction ( pF ) is such that:
⎟⎟⎠
⎞⎜⎜⎝
⎛=⎟⎟
⎠
⎞⎜⎜⎝
⎛=
)( Airbr
pm
b
pmb G
FQ
FQQ
tedUncompensatedUncompensa ρρ Eq. (E.10)
Where: bQ = Volume flow of gas at base conditions
tedUncompensamQ = Mass flow of gas uncompensated for flow pressure
effect pF = Flow pressure effect compensation factor
bρ = Density of gas at base conditions
rG = Relative density of gas at base conditions
)( Airbρ = Density of air at base conditions The base density of gas is calculated utilizing the non-ideal gas law such that:
bb
rbb RTZ
MP=ρ
Eq. (E.11)
Where: bρ = Density of gas at base conditions
bP = Pressure of the gas at base conditions
rM = Molar weight of the gas
bZ = Compressibility of the gas at base conditions R = Universal Gas Constant
bT = Temperature at base conditions

This report is the property of AGA and is part of its process to create a new recommended practice. This document or any of its parts shall not be copied, disseminated, cited in literature, presentations or discussions by persons other than members of the American Gas Association (AGA) and American Petroleum Institute (API) who are part of its creation process without prior approval from AGA.
AGA TRANSMISSION MEASUREMENT COMMITTEE - DRAFT REPORT NO. 11 Aug 22, 2010
69 of 84
Relative density is calculated utilizing methods such that:
)()(
)()(
)(
)(
AirGasb
GasAirb
Airb
Gasb
MrZMrZ
Gr ==ρρ
Eq. (E.12)
Where: )(Gasbρ = Density of gas at base conditions
)( Airbρ = Density of air at base conditions
)(GasbZ = Compressibility of gas at base conditions
)( AirbZ = Compressibility of air at base conditions
)(GasrM = Molar weight of gas
)( AirrM = Molar weight of air
rG = Relative Density of the gas at base conditions The equation for energy rate, including flow pressure effect compensation factor ( pF ), is such that:
)( mpme HFQQtedUncompensa
= Eq. (E.13)
Where: eQ = Energy rate of gas
tedUncompensamQ = Mass flow of gas uncompensated for flow pressure
effect pF = Flow pressure effect compensation factor
mH = Mass heating value The equation for flow rate at flowing conditions, including flow pressure effect compensation factor ( pF ), is such that:
⎟⎟⎠
⎞⎜⎜⎝
⎛=
f
pmf
FQQ
tedUncompensa ρ Eq. (E.14)
Where: fQ = Volume flow rate of the gas at flowing conditions
tedUncompensamQ = Mass flow of gas uncompensated for flow pressure
effect pF = Flow pressure effect compensation factor
fρ = Density of gas at flowing conditions The flowing density of gas is calculated utilizing the non-ideal gas law such that:

This report is the property of AGA and is part of its process to create a new recommended practice. This document or any of its parts shall not be copied, disseminated, cited in literature, presentations or discussions by persons other than members of the American Gas Association (AGA) and American Petroleum Institute (API) who are part of its creation process without prior approval from AGA.
AGA TRANSMISSION MEASUREMENT COMMITTEE - DRAFT REPORT NO. 11 Aug 22, 2010
70 of 84
ff
rff RTZ
MP=ρ Eq. (E.15)
Where: fρ = Density of gas at flowing conditions
fP = Pressure of the gas at flowing conditions
rM = Molar weight of the gas fZ = Compressibility of the gas at flowing conditions
R = Universal Gas Constant fT = Temperature at flowing conditions Typical Units of Measure for Base Density Calculations
Variable U.S. Units S.I. Units
bρ lbm/ft3 kg/m3
bP Psia Mpa
rM lb/lb-mole kg/kg-mole
bZ Dimensionless dimensionless
R psia-ft3/lb-mole-oR (10.73164)
Mpa-m3/kg-mole-oK (0.00831451)
bT oR (Rankin) oK (Kelvin)
rG Dimensionless dimensionless
)( Airbρ lbm/ft3
(0.076529 lb/ft3 at 14.73 psia and 60 οF)
kg/m3
(1.2254 kg/m3 at 0.101325 Mpa and 288.15 οK)(1.2254 kg/m3 at 101.325 kpa and 15 οC)
Table E.1 The flow relationships shown in Equations E.8, E.10, E.13, and E.14 can be factored into two parts; one representing the mass flow from the transmitter (
tedUncompensamQ ) and one containing the measured variables
( IMV ) that remain relatively constant with respect to time. This relationship is such that:
)(IMVQQ
tedUncompensamx = Eq. (E.16)
Where: xQ = Flow quantity where “ x ” is mass ( m ), base volume
( b ), energy ( e ), or flowing volume ( f )
tedUncompensamQ = Mass flow of the gas uncompensated for flow pressure
effect IMV = Integral Multiplier Value Combining the factored form of the equation with the quantity calculation shown in Eq. E.4 above yields:
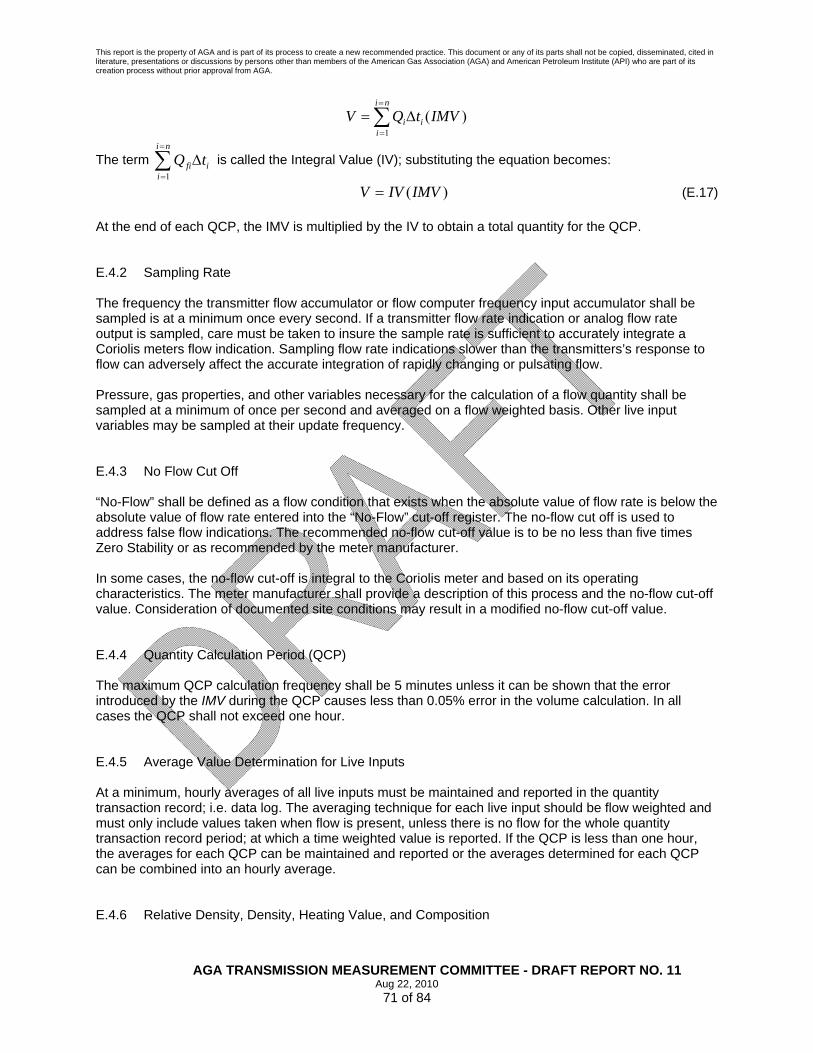
This report is the property of AGA and is part of its process to create a new recommended practice. This document or any of its parts shall not be copied, disseminated, cited in literature, presentations or discussions by persons other than members of the American Gas Association (AGA) and American Petroleum Institute (API) who are part of its creation process without prior approval from AGA.
AGA TRANSMISSION MEASUREMENT COMMITTEE - DRAFT REPORT NO. 11 Aug 22, 2010
71 of 84
)(1
IMVtQVni
iii∑
=
=
Δ=
The term ∑=
=
Δni
iifi tQ
1
is called the Integral Value (IV); substituting the equation becomes:
)(IMVIVV = (E.17) At the end of each QCP, the IMV is multiplied by the IV to obtain a total quantity for the QCP. E.4.2 Sampling Rate The frequency the transmitter flow accumulator or flow computer frequency input accumulator shall be sampled is at a minimum once every second. If a transmitter flow rate indication or analog flow rate output is sampled, care must be taken to insure the sample rate is sufficient to accurately integrate a Coriolis meters flow indication. Sampling flow rate indications slower than the transmitters’s response to flow can adversely affect the accurate integration of rapidly changing or pulsating flow. Pressure, gas properties, and other variables necessary for the calculation of a flow quantity shall be sampled at a minimum of once per second and averaged on a flow weighted basis. Other live input variables may be sampled at their update frequency. E.4.3 No Flow Cut Off “No-Flow” shall be defined as a flow condition that exists when the absolute value of flow rate is below the absolute value of flow rate entered into the “No-Flow” cut-off register. The no-flow cut off is used to address false flow indications. The recommended no-flow cut-off value is to be no less than five times Zero Stability or as recommended by the meter manufacturer. In some cases, the no-flow cut-off is integral to the Coriolis meter and based on its operating characteristics. The meter manufacturer shall provide a description of this process and the no-flow cut-off value. Consideration of documented site conditions may result in a modified no-flow cut-off value. E.4.4 Quantity Calculation Period (QCP) The maximum QCP calculation frequency shall be 5 minutes unless it can be shown that the error introduced by the IMV during the QCP causes less than 0.05% error in the volume calculation. In all cases the QCP shall not exceed one hour. E.4.5 Average Value Determination for Live Inputs At a minimum, hourly averages of all live inputs must be maintained and reported in the quantity transaction record; i.e. data log. The averaging technique for each live input should be flow weighted and must only include values taken when flow is present, unless there is no flow for the whole quantity transaction record period; at which a time weighted value is reported. If the QCP is less than one hour, the averages for each QCP can be maintained and reported or the averages determined for each QCP can be combined into an hourly average. E.4.6 Relative Density, Density, Heating Value, and Composition

This report is the property of AGA and is part of its process to create a new recommended practice. This document or any of its parts shall not be copied, disseminated, cited in literature, presentations or discussions by persons other than members of the American Gas Association (AGA) and American Petroleum Institute (API) who are part of its creation process without prior approval from AGA.
AGA TRANSMISSION MEASUREMENT COMMITTEE - DRAFT REPORT NO. 11 Aug 22, 2010
72 of 84
Relative density, density, heating value, and composition may be required in the calculation of energy and/or volume. They may be introduced into the calculation as a constant value, sampled input, or calculated value using a combination of constant values and sampled inputs. Increasing the frequency of calculation and/or sampling of these variables will minimize energy and/or volume uncertainty. E.4.7 Transmitter and Flow Computer Measurement Record Coriolis measurement systems commonly utilize the unidirectional transmission of flow from the transmitter to the flow computer through use of discrete outputs; i.e. frequency, digital, and analog. The transmitter and flow computer in these systems typically reside in different physical locations. The unidirectional nature of this data transfer requires separate metrological accounting (electronic or manual) and security functionality (electronic or mechanical) to be incorporated into the design of the transmitter and flow computer to facilitate accurate audit and data security.
In systems utilizing a bidirectional digital communications link, the transmitter and flow computer can reside in separate electronic devices located in the same physical location or separate locations. They can both also reside in the same electronic device. Due to the nature of a bidirectional digital communications link between the signal processor and flow computer, functionality can be incorporated into the measurement system allowing for the flow computer to track all metrological significant information in one set (configuration, event, and data) of accounting records/logs that reside in the flow computer.
The following sections will outline the general requirements of the flow computer configuration, event, and data records/logs, dependent on the use of a unidirectional discrete I/O interface or a bidirectional digital communications interface that manages metrological information in the transmitter. Whether the flow computer manages transmitter metrological parameters, is at the discretion of the flow computer manufacturer. The information contained in these sections is specific to determining the most common quantities of flow measure by the gas industry; i.e. mass, base volume, and energy.
E.4.7.1� Coriolis Measurement System Configuration Record/Log
The configuration record may include but is not limited to the following, for a unidirectional discrete I/O interface and a bidirectional digital communications interface as listed in the Table E.2. As indicated by the table, flow computer systems that utilize a bidirectional digital communications interface, but do not manage metrological parameters in the transmitter, have the same configuration record as a unidirectional discrete I/O interface.
Unidirectional Discrete I/O Interface
and Bidirectional Digital Communications Interface
w/o transmitter metrological management
Bidirectional Digital Communications Interface
w/transmitter metrological management
Meter Identifier Meter Identifier Date and Time Date and Time Contract Hour Contract Hour K Factor; i.e. pulses/unit Meter Factor(s); i.e. Calibration Correction Factor, direct multiplier
Meter Factor(s); i.e. Calibration Correction Factor, direct multiplier
Flow Pressure Effect Flow Pressure Effect Sensor Calibration Pressure Sensor Calibration Pressure Pressure (if not live) Pressure (if not live) Pressure Base Pressure Base
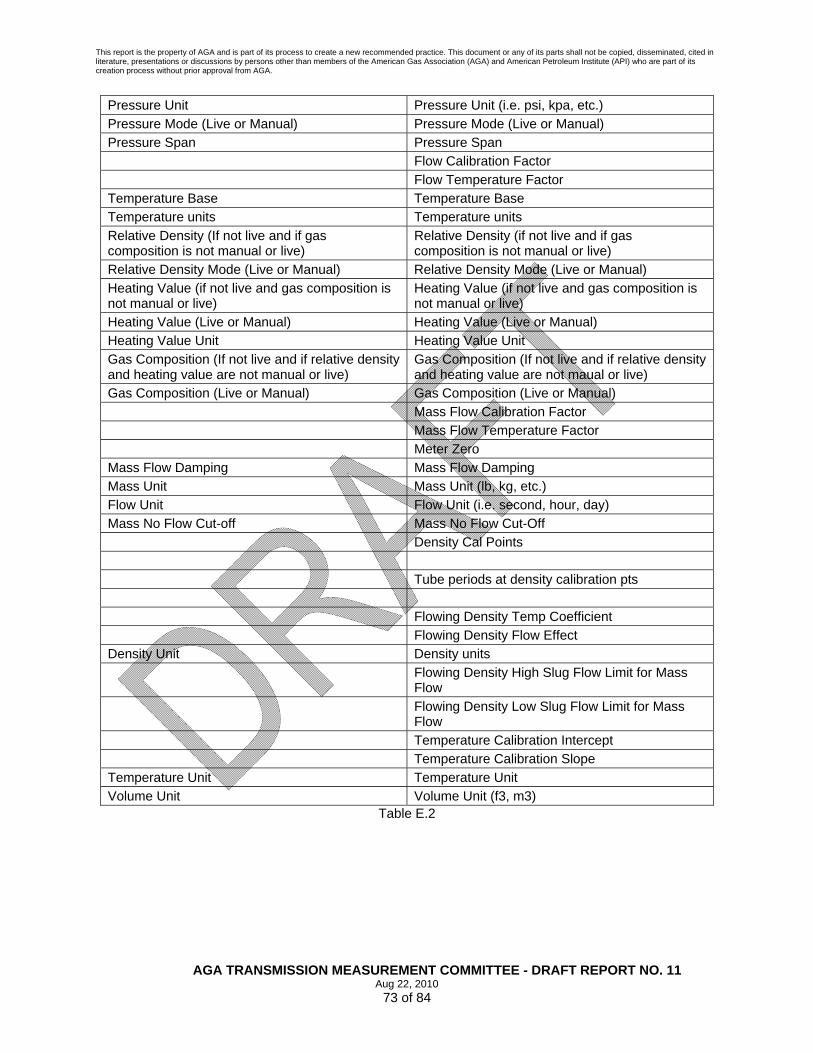
This report is the property of AGA and is part of its process to create a new recommended practice. This document or any of its parts shall not be copied, disseminated, cited in literature, presentations or discussions by persons other than members of the American Gas Association (AGA) and American Petroleum Institute (API) who are part of its creation process without prior approval from AGA.
AGA TRANSMISSION MEASUREMENT COMMITTEE - DRAFT REPORT NO. 11 Aug 22, 2010
73 of 84
Pressure Unit Pressure Unit (i.e. psi, kpa, etc.) Pressure Mode (Live or Manual) Pressure Mode (Live or Manual) Pressure Span Pressure Span Flow Calibration Factor Flow Temperature Factor Temperature Base Temperature Base Temperature units Temperature units Relative Density (If not live and if gas composition is not manual or live)
Relative Density (if not live and if gas composition is not manual or live)
Relative Density Mode (Live or Manual) Relative Density Mode (Live or Manual) Heating Value (if not live and gas composition is not manual or live)
Heating Value (if not live and gas composition is not manual or live)
Heating Value (Live or Manual) Heating Value (Live or Manual) Heating Value Unit Heating Value Unit Gas Composition (If not live and if relative density and heating value are not manual or live)
Gas Composition (If not live and if relative density and heating value are not maual or live)
Gas Composition (Live or Manual) Gas Composition (Live or Manual) Mass Flow Calibration Factor Mass Flow Temperature Factor Meter Zero Mass Flow Damping Mass Flow Damping Mass Unit Mass Unit (lb, kg, etc.) Flow Unit Flow Unit (i.e. second, hour, day) Mass No Flow Cut-off Mass No Flow Cut-Off Density Cal Points Tube periods at density calibration pts Flowing Density Temp Coefficient Flowing Density Flow Effect Density Unit Density units Flowing Density High Slug Flow Limit for Mass
Flow Flowing Density Low Slug Flow Limit for Mass
Flow Temperature Calibration Intercept Temperature Calibration Slope Temperature Unit Temperature Unit Volume Unit Volume Unit (f3, m3)
Table E.2

This report is the property of AGA and is part of its process to create a new recommended practice. This document or any of its parts shall not be copied, disseminated, cited in literature, presentations or discussions by persons other than members of the American Gas Association (AGA) and American Petroleum Institute (API) who are part of its creation process without prior approval from AGA.
AGA TRANSMISSION MEASUREMENT COMMITTEE - DRAFT REPORT NO. 11 Aug 22, 2010
74 of 84
E.4.7.2� Event Record / Log
Modifications to configuration variables will be logged with Date, Time, Event, Old Value, and New Value. Variables above those outlined in Table E.3 that should be logged in the event log are as follows.
Unidirectional Discrete I/O Interface
and Bidirectional Digital Communications Interface
w/o Transmitter Metrological Management
Bidirectional Digital Communications Interface
w/Transmitter Metrological Management
Pressure Calibration Values (where applicable) Pressure Calibration Values (where applicable) Relative Density Calibration Values (where applicable)
Relative Density Calibration Values (where applicable)
Coriolis Sensor/Transmitter Fault(s) – where applicable
Coriolis Sensor/Transmitter Fault(s)- where applicable
Table E.3
E.4.7.3 Data Record
At a minimum, the following parameters shall be contained in the data record/log.
Date Time Flow time Counts1 or Flow Weighted FactorFactor KC Compensated Mass Flow weighted pressure Volume at Base Conditions Energy
Note 1: “Counts” are the pulses accumulated by the flow computer frequency input and in actuality, a
fractional representation of the mass units accumulated by the Coriolis transmitter; i.e. unitpulseKFactor /= . When a flow rate is used to integrate mass accumulation or a
bidirectional communications interface is utilized by the flow computer, “Counts” are no longer equivalent to pulse accumulation, but rather the actual raw mass units accumulated in the transmitter or flow computer.
E.5 Alternate Method
E.5.1 Alternative method for Computing Flow and the Recording of Measurement Data using a Constant Gravity or Base Density
In applications where gas composition does not vary (e.g. pure gases) or an average composition is used to compute base volume, it is possible to configure the Coriolis transmitter to output base volume directly. The method for facilitating output of base volume by the transmitter is gained though examination of Equation A.10, shown below for reference.
⎟⎟⎠
⎞⎜⎜⎝
⎛=⎟⎟
⎠
⎞⎜⎜⎝
⎛=
)( Airbr
pm
b
pmb G
FQ
FQQ
dUncorrectedUncorrecte ρρ

This report is the property of AGA and is part of its process to create a new recommended practice. This document or any of its parts shall not be copied, disseminated, cited in literature, presentations or discussions by persons other than members of the American Gas Association (AGA) and American Petroleum Institute (API) who are part of its creation process without prior approval from AGA.
AGA TRANSMISSION MEASUREMENT COMMITTEE - DRAFT REPORT NO. 11 Aug 22, 2010
75 of 84
By applying a Mass Flow conversion factor equal to the inverse of base density (i.e. bρ1 ) and
compensating for flow pressure effect ( PF ) in the transmitter, the Volume Flow at Base Conditions ( bQ ) can be output directly from the transmitter. Utilizing this method, a base volume flow rate can then be input into a standard AGA7 flow computer, if accumulation and record of flow measurement data is desired. It is important to note that when an AGA7 flow computer is utilized to accumulate and record base volume flow from a Coriolis transmitter, the conditions of Flowing Volume ( fQ ) required for input into the AGA7
computer are the same conditions as Base Volume ( bQ ). As an example, the AGA7 equation is such that.
f
b
f
b
b
ffb Z
ZTT
PP
QQ =
Where: bQ = Volume flow rate of gas at base conditions
fQ = Volume flow rate of gas at flowing conditions
fP = Flow static pressure of the gas (psia)
bP = Base pressure (psia)
bT = Base temperature (Rankin)
fT = Flowing temperature of the gas (Rankin)
fZ = Flowing compressibility of the gas
bZ = Compressibility of the gas at base conditions If the Base Density used for the mass conversion factor in the Coriolis transmitter was determined at 14.73 psia and 60 degrees Fahrenheit, the volume output by the transmitter will also be at base conditions of 14.73 psia and 60 degrees Fahrenheit. Therefore, the AGA7 equation effectively becomes.
)()(
)67.519()67.519(
)73.14()73.14(
XXQQ fb = or )1)(1)(1(fb QQ =
When applying these methods, flowing pressure ( fP ) and flowing temperature ( fT ) in the AGA7 flow computer are not live, but rather, fixed values relative to base conditions. The volume of flow at base conditions ( bQ ) calculated by the AGA7 flow computer is then identical in quantity to the volume of flow
input into the flow computer ( fQ ). When utilizing this method, compensation for flow pressure effect will need to be performed by the Coriolis transmitter, through use of a live pressure input to the transmitter or entry of an average flowing pressure. If a live flowing pressure is used for compensation, it is recommended that the flow computer monitor and record an average flowing pressure in its measurement log for each log interval. The average flowing pressure log should be flow-weighted, especially when large pressure variations exist, to eliminate recalculation uncertainties caused by the use of time-weighted averages. A manual or electronic record of the following variables, in the transmitter, shall also be maintained by the user.

This report is the property of AGA and is part of its process to create a new recommended practice. This document or any of its parts shall not be copied, disseminated, cited in literature, presentations or discussions by persons other than members of the American Gas Association (AGA) and American Petroleum Institute (API) who are part of its creation process without prior approval from AGA.
AGA TRANSMISSION MEASUREMENT COMMITTEE - DRAFT REPORT NO. 11 Aug 22, 2010
76 of 84
E.5.2 Data Record At a minimum, the following parameters shall be contained in a manual audit log for the Coriolis transmitter.
• Coriolis Sensor Calibration Pressure • Flow Pressure Effect • Average Pressure (if fixed) • Mass Flow Conversion Factor (i.e. bρ1 ) and the basis for its value (i.e. relative density, base
temperature, and base pressure) Other than the requirement for logging of flowing pressure by the flow computer, when live flow pressure effect compensation is performed, the contents of the AGA7 data log will remain unchanged. E.6 Recalculation Methods The use of an average base density (
)(Gasbρ ) or relative density ( )(GasrG ), by users, to calculate
approximate base volume quantities, is a common practice in gas measurement. In many cases these volumes are recalculated, at a later date, by means of more accurate gas quality information acquired from an on-line gas analyzer, gravitometer, or analysis of a sample cylinder. Fundamental to the relationship expressed in Equation A.10, a ratio of base or relative densities is used to perform a simple and accurate recalculation of volume quantities. In practice, these recalculation methods are such that.
)(
)(
)()(
New
Old
OldNewr
rGrGr G
GSCFSCF = Eq. (E.18)
Where: )( NewGrSCF
= Recalculated base or standard volume at )(NewrG
)(OldGrSCF
= Base or standard volume at )( OldrG
)( OldrG = The average relative density that )(OldGrSCF was determined
)(NewrG = The average relative density that
)( NewGrSCF is to be determined
and
)(
)(
)()(*
Newb
Oldb
OldbNewbSCFSCF
ρ
ρρρ = Eq. (E.19)
Where:
)( NewbSCFρ
= Recalculated base or standard volume at )(Newbρ
)(Oldb
SCFρ = Base or standard volume at )(Oldbρ
)(Oldbρ = The average base density that )(Oldb
SCFρ was determined
)(Newbρ = The average base density that )( Newb
SCFρ is to be determined

This report is the property of AGA and is part of its process to create a new recommended practice. This document or any of its parts shall not be copied, disseminated, cited in literature, presentations or discussions by persons other than members of the American Gas Association (AGA) and American Petroleum Institute (API) who are part of its creation process without prior approval from AGA.
AGA TRANSMISSION MEASUREMENT COMMITTEE - DRAFT REPORT NO. 11 Aug 22, 2010
77 of 84
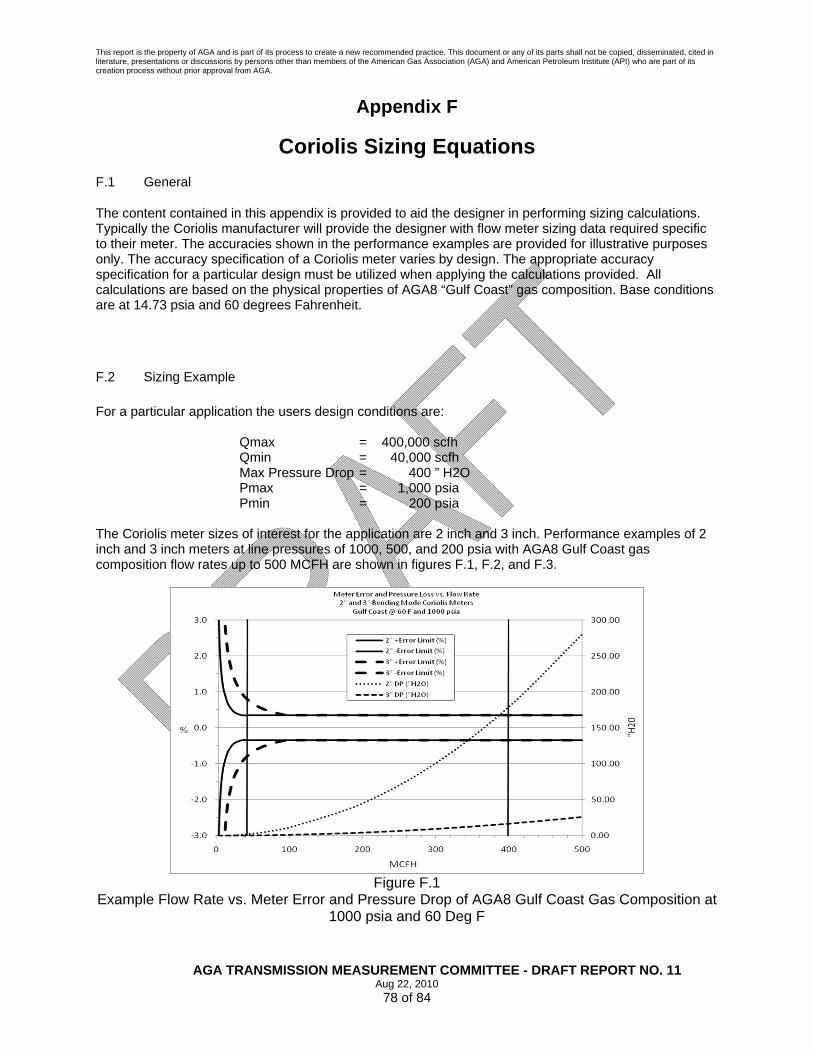
This report is the property of AGA and is part of its process to create a new recommended practice. This document or any of its parts shall not be copied, disseminated, cited in literature, presentations or discussions by persons other than members of the American Gas Association (AGA) and American Petroleum Institute (API) who are part of its creation process without prior approval from AGA.
AGA TRANSMISSION MEASUREMENT COMMITTEE - DRAFT REPORT NO. 11 Aug 22, 2010
78 of 84
Appendix F
Coriolis Sizing Equations F.1 General
The content contained in this appendix is provided to aid the designer in performing sizing calculations. Typically the Coriolis manufacturer will provide the designer with flow meter sizing data required specific to their meter. The accuracies shown in the performance examples are provided for illustrative purposes only. The accuracy specification of a Coriolis meter varies by design. The appropriate accuracy specification for a particular design must be utilized when applying the calculations provided. All calculations are based on the physical properties of AGA8 “Gulf Coast” gas composition. Base conditions are at 14.73 psia and 60 degrees Fahrenheit.
F.2 Sizing Example For a particular application the users design conditions are: Qmax = 400,000 scfh Qmin = 40,000 scfh Max Pressure Drop = 400 ” H2O Pmax = 1,000 psia Pmin = 200 psia The Coriolis meter sizes of interest for the application are 2 inch and 3 inch. Performance examples of 2 inch and 3 inch meters at line pressures of 1000, 500, and 200 psia with AGA8 Gulf Coast gas composition flow rates up to 500 MCFH are shown in figures F.1, F.2, and F.3.
Figure F.1
Example Flow Rate vs. Meter Error and Pressure Drop of AGA8 Gulf Coast Gas Composition at 1000 psia and 60 Deg F
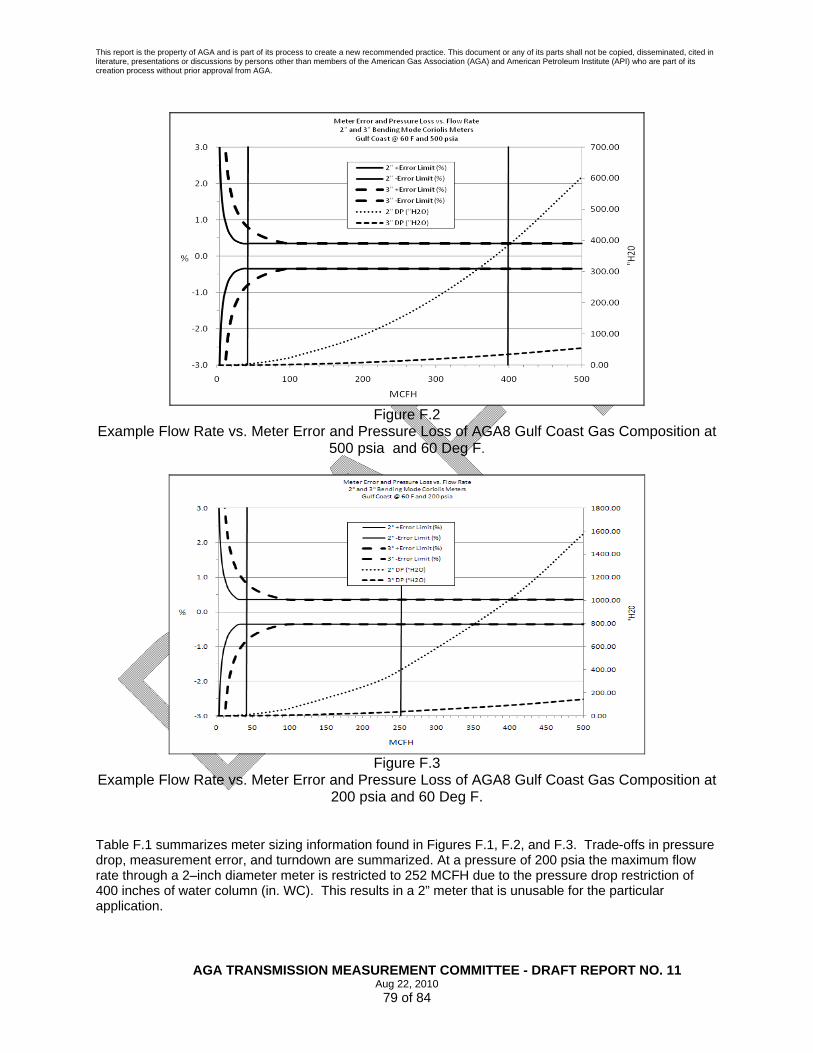
This report is the property of AGA and is part of its process to create a new recommended practice. This document or any of its parts shall not be copied, disseminated, cited in literature, presentations or discussions by persons other than members of the American Gas Association (AGA) and American Petroleum Institute (API) who are part of its creation process without prior approval from AGA.
AGA TRANSMISSION MEASUREMENT COMMITTEE - DRAFT REPORT NO. 11 Aug 22, 2010
79 of 84
Figure F.2
Example Flow Rate vs. Meter Error and Pressure Loss of AGA8 Gulf Coast Gas Composition at 500 psia and 60 Deg F.
Figure F.3
Example Flow Rate vs. Meter Error and Pressure Loss of AGA8 Gulf Coast Gas Composition at 200 psia and 60 Deg F.
Table F.1 summarizes meter sizing information found in Figures F.1, F.2, and F.3. Trade-offs in pressure drop, measurement error, and turndown are summarized. At a pressure of 200 psia the maximum flow rate through a 2–inch diameter meter is restricted to 252 MCFH due to the pressure drop restriction of 400 inches of water column (in. WC). This results in a 2” meter that is unusable for the particular application.

This report is the property of AGA and is part of its process to create a new recommended practice. This document or any of its parts shall not be copied, disseminated, cited in literature, presentations or discussions by persons other than members of the American Gas Association (AGA) and American Petroleum Institute (API) who are part of its creation process without prior approval from AGA.
AGA TRANSMISSION MEASUREMENT COMMITTEE - DRAFT REPORT NO. 11 Aug 22, 2010
80 of 84
Line
Pressure (psia)
Meter Nominal Diameter
Flow rate
(scfh)
Pressure Drop
(in. WC)
Meter Error (%)
Turn- Down Ratio
1000 2” 400,000 179.0 +/- 0.35 % 10:1 40,000 1.8 +/- 0.35 %
1000 3” 400,000 16.2 +/- 0.35 % 10:1 40,000 0.2 +/- 0.84 %
500 2” 400,000 385.8 +/- 0.35 % 10:1 40,000 3.9 +/- 0.35 %
500 3” 400,000 35.0 +/- 0.35 % 10:1 40,000 0.4 +/- 0.84 %
200 2” 252,000 400.0 +/- 0.35 % 6:1 40,000 10.1 +/- 0.35 %
200 3” 400,000 91.5 +/- 0.35 %
10:1 40,000 0.9 +/- 0.84 % Table F.1
Meter Sizing Examples NOTE: In the above example the 3” meter would be the suitable choice, however if a higher pressure
drop is acceptable the 2” meter could be chosen to provide better accuracy at the low end.
F.3 Calculation of Flow Rate Based on Pressure Drop A Coriolis manufacturer will typically supply a set of reference flow conditions for the various sizes of meters they offer. In the example shown in Table F.2 the reference data is based on a pressure drop ( AppGasPΔ ) of 50 psi and Density Flowing (
fGasfReρ ) of 5.5276 lb/cf.
Table F.2
Utilizing this information, the equation for calculating the flow of an application gas through a Coriolis meter at any given pressure drop is such that.
AppGas
AppGas
AppGasfGas
AppGas
fGas
bb
ffffGas
fAppGas
Q
QP
P
=⎥⎥⎦
⎤
⎢⎢⎣
⎡
Δ
Δ
ρ
ρρ
ρRe
Re
Re Equation (F.1)
Coriolis Size
(inches) Volume Flowing (
fGasfQRe
) in cf/hr Mass Rate (lb/hr)
1/4 328 1,815 1/2 841 4,647 1 3,730 20,618 2 11,252 62,197 3 37,370 206,567 4 94,587 522,840 6 175,036 967,530 8 306,277 1,692,978

This report is the property of AGA and is part of its process to create a new recommended practice. This document or any of its parts shall not be copied, disseminated, cited in literature, presentations or discussions by persons other than members of the American Gas Association (AGA) and American Petroleum Institute (API) who are part of its creation process without prior approval from AGA.
AGA TRANSMISSION MEASUREMENT COMMITTEE - DRAFT REPORT NO. 11 Aug 22, 2010
81 of 84
Where: AppGasPΔ = Differential pressure across Coriolis meter with
application gas flowing at AppGasfρ in psi
fGasfReρ = Density of reference gas at flowing conditions in lb/cf
fGasPReΔ = Differential pressure across Coriolis meter with reference
gas at fGasfRe
ρ in psi
AppGasfρ = Density of application gas at flowing conditions in lb/cf
fGasfQ
Re = Volume flow rate of reference gas at flowing conditions
of fGasfRe
ρ and fGasPReΔ in scfh
AppGasbρ = Density of application gas at base conditions in lb/cf
AppGasbQ = Volume flow rate of application gas at base conditions in
scfh Applying Equation F.1 and the information in Table F.2; if the designer wanted to know the base volume flow rate of AGA8 “Gulf Coast” gas composition, with a flowing density (
AppGasfρ ) of 0.6205 lb/cf at 200
psia and 60 degrees Fahrenheit and a base density (AppGasbρ ) of 0.0445 lb/cf at base conditions of 14.73
psia and 60 degrees Fahrenheit, through a 3” Coriolis meter with a pressure drop of 3.3 psi (91.5” H2O), the calculation would be as follows.
AppGas
AppGas
AppGasfGas
AppGas
fGas
bb
ffffGas
fAppGas
Q
QP
P
=⎥⎥⎦
⎤
⎢⎢⎣
⎡
Δ
Δ
ρ
ρρ
ρRe
Re
Re
AppGasbQ=⎥⎦
⎤⎢⎣
⎡
0445.0
6205.0*373706205.0*505276.5*3.3
[ ]
AppGasbQ=0445.0
6205.0*373707668.0
AppGasbQ=553,399 = 399,553 scfh
F.4 Calculation of Pressure Drop based on Flow Rate The equation for calculating the pressure drop of an application gas through a Coriolis meter at any given flow rate is such that.

This report is the property of AGA and is part of its process to create a new recommended practice. This document or any of its parts shall not be copied, disseminated, cited in literature, presentations or discussions by persons other than members of the American Gas Association (AGA) and American Petroleum Institute (API) who are part of its creation process without prior approval from AGA.
AGA TRANSMISSION MEASUREMENT COMMITTEE - DRAFT REPORT NO. 11 Aug 22, 2010
82 of 84
AppGasf
fGasf
ff
bb PP
Q
Q
fGas
AppGass
AppGasfGas
AppGasAppGas Δ=Δ
⎟⎟
⎠
⎞
⎜⎜
⎝
⎛
ReRe
Re
2*
ρ
ρ
ρ
ρ Equation (F.2)
Applying Equation F.2, the information in Table F.2, and using AGA8 “Gulf Coast” gas composition as the application gas; if the designer wanted to know the pressure drop across the meter at 400,000 scfh with a flowing density (
AppGasfρ ) of 0.6205 lb/cf and a base density (AppGasbρ ) of 0.0445, the solution for pressure
drop would be as follows.
AppGasf
fGasf
ff
bb PP
Q
Q
fGas
AppGass
AppGasfGas
AppGasAppGas Δ=Δ
⎟⎟
⎠
⎞
⎜⎜
⎝
⎛
ReRe
Re
2*
ρ
ρ
ρ
ρ
AppGasPΔ=⎟⎠⎞
⎜⎝⎛
5276.550*6205.0
6205.0*373700445.0*000,400 2
AppGasPΔ=3.3 = 3.3 psi
F.5 Calculation of Accuracy at Flow Rate The accuracy of a Coriolis meter can be determined at any flow rate utilizing the manufacturers published accuracy statement and zero stability data. It should be noted that the accuracy statement varies from manufacturer to manufacturer. An example of an accuracy statement and zero stability values for Coriolis meters are shown in Table F.3.
Table E.3 Note 1: Accuracy equals +/- 0.35% of rate, except when flow rate is less than
100/
/
Accuracy
ityZeroStabil bρ , where
accuracy then equals ⎥⎦
⎤⎢⎣
⎡⎟⎟⎠
⎞⎜⎜⎝
⎛± 100/
vb
b
QityZeroStabil ρ % of rate.
Utilizing the information specific to a 3” meter and AGA8 natural gas composition “Gulf Coast” at base conditions of 14.73 psia and 60 degrees Fahrenheit; If the designer wanted to find the transition flow rate ( tQ ) where the accuracy of the meter changes from +/- 0.35%, the calculation would be as follows.
Coriolis Size (inches)
Accuracy1
(%) Zero Stability (lb/hr)
1/4 0.35 0.0600 1/2 0.35 0.3600 1 0.35 1.5000 2 0.35 4.8000 3 0.35 15.0000 4 0.35 90.0000 6 0.35 150.000 8 0.35 300.000

This report is the property of AGA and is part of its process to create a new recommended practice. This document or any of its parts shall not be copied, disseminated, cited in literature, presentations or discussions by persons other than members of the American Gas Association (AGA) and American Petroleum Institute (API) who are part of its creation process without prior approval from AGA.
AGA TRANSMISSION MEASUREMENT COMMITTEE - DRAFT REPORT NO. 11 Aug 22, 2010
83 of 84
100//
AccuracyityZeroStabil
Q bt
ρ=
100/35.00445.0/15
=tQ
308,96=tQ scfh
Thus, all flow rates above the transition flow rate of 96,308 scfh would have an accuracy of +/- 0.35% and all of those below would have an accuracy of %100
/
⎥⎥⎦
⎤
⎢⎢⎣
⎡⎟⎟⎠
⎞⎜⎜⎝
⎛±
b
b
QityZeroStabil ρ .
For example, if the minimum flow rate for the application was 40,000 scfh, the accuracy at that flow rate would be.
Accuracy = ⎥⎦
⎤⎢⎣
⎡⎟⎟⎠
⎞⎜⎜⎝
⎛± 100/
b
b
QityZeroStabil ρ
Accuracy = ⎥⎦
⎤⎢⎣
⎡⎟⎠⎞
⎜⎝⎛± 100
400000445.0/15
Accuracy = %84.0± F.6 Calculation of Velocity at Flow Rate Some manufacturers will specify a maximum flow velocity through their Coriolis meter relative to the speed of sound (Mach). Knowing the density of a reference gas, the velocity it is flowing at, and the pressure drop it produces across the meter, the designer can calculate the velocity through the sensor for any application gas mixture at any set of flowing conditions such that.
fGas
AppGas
AppGas
fAppGas
ffGas
fGasff
PP
vv
Re
Re
Re
ρρ
Δ
Δ=
Equation (F.3)
Where: AppGasfv = Velocity flowing of application gas at AppGasfρ and
AppGasPΔ
in ft/sec AppGasPΔ = Differential pressure across a Coriolis meter with
AppGasfρ
flowing at fGasfv
Re in psi
fGasPReΔ = Differential pressure across a Coriolis meter with
fGasfReρ flowing at
fGasfvRe
in psi

This report is the property of AGA and is part of its process to create a new recommended practice. This document or any of its parts shall not be copied, disseminated, cited in literature, presentations or discussions by persons other than members of the American Gas Association (AGA) and American Petroleum Institute (API) who are part of its creation process without prior approval from AGA.
AGA TRANSMISSION MEASUREMENT COMMITTEE - DRAFT REPORT NO. 11 Aug 22, 2010
84 of 84
fGasfReρ = Density of reference gas at flowing conditions in lb/cf
fGasfvRe = Velocity of the reference gas at
fGasf Reρ and
fGasPReΔ in
ft/sec
AppGasfρ = Density of application gas at flowing conditions in lb/cf
An example of the reference velocities specified at a flowing density (
fGasfReρ ) of 5.5276 lb/cf and a
pressure drop ( fGasPReΔ ) of 50 psi for different Coriolis meter sizes is shown in Table F.4.
Table F.4 Applying Equation F.3, the information in Table F.3 for a 3” meter, and using AGA8 “Gulf Coast” composition as the application gas; if the designer wanted to know the velocity through the Coriolis meter at a pressure drop of 3.3 psi and flowing conditions of 200 psia and 60 degrees Fahrenheit with a flowing density (
AppGasfρ ) of 0.6205 lb/cf, the solution for flowing velocity would be as follows.
fGas
AppGas
AppGas
fAppGas
ffGas
fGasff
PP
vv
Re
Re
Re
ρρ
Δ
Δ=
5276.5*3.36205.0*50
307=
AppGasfv
4.235=AppGasfv ft/sec
Coriolis Meter Size
(inches)
fGasfvRe
in ft/sec with a fGasPReΔ of 50 psi
and a fGasfRe
ρ of 5.5276 lb/cf
1/4 197.00 1/2 180,00 1 227.00 2 256.00 3 307.00 4 291.30 6 363.87 8 387.19