measurement of online student engagement: utilization of
TRANSCRIPT
University of Denver University of Denver
Digital Commons @ DU Digital Commons @ DU
Electronic Theses and Dissertations Graduate Studies
1-1-2017
Measurement of Online Student Engagement: Utilization of Measurement of Online Student Engagement: Utilization of
Continuous Online Student Behaviors as Items in a Partial Credit Continuous Online Student Behaviors as Items in a Partial Credit
Rasch Model Rasch Model
Elizabeth Anderson University of Denver
Follow this and additional works at: https://digitalcommons.du.edu/etd
Part of the Education Commons
Recommended Citation Recommended Citation Anderson, Elizabeth, "Measurement of Online Student Engagement: Utilization of Continuous Online Student Behaviors as Items in a Partial Credit Rasch Model" (2017). Electronic Theses and Dissertations. 1248. https://digitalcommons.du.edu/etd/1248
This Dissertation is brought to you for free and open access by the Graduate Studies at Digital Commons @ DU. It has been accepted for inclusion in Electronic Theses and Dissertations by an authorized administrator of Digital Commons @ DU. For more information, please contact [email protected],[email protected].
Measurement of Online Student Engagement: Utilization of Continuous Online Student Behavior Indicators as Items in a Partial Credit Rasch Model
----------
A Dissertation
Presented to
the Faculty of the Morgridge College of Education
University of Denver
-----------
In Partial Fulfillment
of the Requirements for the Degree
Doctor of Philosophy
----------
by
Elizabeth Anderson
March 2017
Advisor: Dr. Kathy E. Green

©Copyright by Elizabeth Anderson 2017
All Rights Reserved

Author: Elizabeth Anderson Title: Measurement of Online Student Engagement: Utilization of Continuous Online Student Behavior Indicators as Items in a Partial Credit Model Advisor: Dr. Kathy E. Green Degree Date: March 2017
ii
Abstract Student engagement has been shown to be essential to the development of research-based
best practices for K-12 education. It has been defined and measured in numerous ways. The
purpose of this research study was to develop a measure of online student engagement for grades
3 through 8 using a partial credit Rasch model and validate the measure using confirmatory factor
analysis. The dataset for this research study comprised approximately 20,000 online students in
grades 3 through 8 from five different online schools. Two random samples of 10,000 students
each were drawn for the measure development process and the validation of the measures created.
For this research study student engagement was defined as a three-component manifestation of
cognitive engagement, affective engagement, and behavioral engagement, which are required to
achieve success as measured by normalized state assessments. This research study used tracked
online student behaviors as items. Online student behavior items were converted from continuous
to categorical after assessing indicator strength and possible inverted U relationship with
academic achievement. The measure development and item categorization processes resulted in
an online cognitive engagement measure and an online behavioral engagement measure for
grades 3 through 8, with each grade having its own measure. All measures were validated using
the second random sample of students and all but two (grades 4 and 5) were further validated by
confirmatory factor analysis to be two factor models. Future research will include measure
development specifically for students receiving special education services, comparing measures
developed using the original continuous items without categorization, identification of facilitators
of online student engagement for grades 3 through 8 and further evaluation of the relationship
between online student engagement and academic achievement.

iii
Acknowledgements
Thank you. I am dedicating the journey and completion of my dissertation to my son,
Chance and my daughter, Yapah. You both have been my inspiration and my best
cheerleaders. Yapah, your creative spirit and big heart filled my world with a spectacular
light, thank you for fighting off the darkness with me. And thank you for sacrificing some of
our girly time for me to write and study; my time now is all yours. Chance, thank you for
sharing your world with me. Your imagination and adventure stories remind me that life is
colorful and holds so much more than we can see. I hope that the many challenges we all
three have conquered and the adventures we have shared can be an inspiration to accomplish
your dreams and bring your imaginations to life. I am so proud of you. Now is your time to
put your stamp on the world. Mommy loves you. Thank you to my friends and family.
Thank you, mom and dad for recognizing and supporting my perfectionistic drive; you taught
me to persevere and never give up. Thank you to my siblings, Monica and Michael, you
putting up with my bossy games made me a better teacher and mom. Thank you to my
friends and classmates your support was unmatched and I am so glad I had you throughout
this journey. Thank you to my dissertation chair, Dr. Kathy Green, and my committee
members and mentors, Dr. Nicole Joseph, and Dr. Duan Zhang. Your examples of
dedication, leadership and expertise in your fields have been monumental in my success. I
hope I am able to be a representation of the incredible work you do to support and guide your
students and colleagues. Thank you to my dissertation committee and my academic
department, I could not ask for a better graduate school experience. Thank you to my
coworkers, especially Mary and Margie, you got me the data I needed and helped me to find
my inner expert. Thank you to anyone who I forgot. I know that it took many people to get
me here, happy and healthy.
iv
Table of Contents
List of Tables vii
List of Figures ix
Abstract ii
Acknowledgements iii Chapter 1: Introduction and Literature Review 1 Problem Statement 3
Research Question and Hypotheses 4
Purpose Statement 5
Literature Review 8
Defining Student Engagement 10
Online Student Engagement 17
Measuring Student Engagement 20
Indicators versus Facilitators 21
Data Collection Methods 22
Surveys and Questionnaires 24
Observations and Teacher Ratings 25
Interviews 26
Experience Sampling (ESM) 27
Current Measures of K-12 Student Engagement 28
Measurement Development 33
Item Response Theory 33
Items 35
Item Response Model Selection 37
Psychometric Quality Indicators 40
Dimensionality 41
Scale Use 42
Fit: Model, Item, and Person 43
Invariance 45
Reliability/Validity and Separation 46

v
Chapter 2: Method 49
Participants 50
Instrument 54
Selection of items. 54
Splitting of the dataset. 57
Outcomes. 57
Normalizing state test scores. 58
Screening of data and data patterns 60
Missing data 60
Multicollinearity 61
Clustering 61
Nested Effects 62
Inverted U relationships 63
Strong and weak indicators. 64
Establishment of measurement core 66
Polytomous measurement model:Partial credit Rasch model 67
Building the measure. 70
Analyses Addressing Research Question and Hypotheses 74
Procedure 79
Data collection and processing. 80
Chapter 3: Results 82
Data Screening 83
Missing Data 85
Multicollinearity 91
Clustering 92
Nesting Effects 95
Inverted U Relationships 99
Strong and Weak Indicators 104
Measure Development 108
Reliability and Validity 136
Split Sample 136
vi
Confirmatory Factor Analysis 145
Additional CFA Results 158
Relationships with Outcome Variables 159
Chapter 4 Discussion 163
Summary of Findings 163
Limitations 168
Implications 173
Future Research 174
Value to Practitioners 176
References 180
Appendix A: Glossary of Terms 192
Appendix B: Measure Development and Item Categorization for All Grades and Grade Segments 205
Appendix C: Measure Development and Item Categorization by Grade 218

vii
List of Tables
Table 1: Types of Student Engagement Measures’ Advantages and Disadvantages 23
Table 2: Current Measures of Student Engagement, Sample Components, and Reliability and Validity Estimates 31
Table 3: Description of Participants’ Demographic Background 53
Table 4: Online Student Engagement for Grades 3 through 8 Measure Objective and Sub-Objectives 55
Table 5: Variables/Items Remaining after Data Preparation 84
Table 6: Variable Summary of Missing Data 87
Table 7: Nesting Effect Results 97
Table 8: Items that did not Meet Invariance Requirements by Grade for Schools 98
Table 9: Inverted U Relationship Tests for Grades 3 to 5 101
Table 10: Inverted U Relationship Tests for Grades 6 to 8 102
Table 11: Strong and Weak Indicators for First Random Sample 104
Table 12: Strong and Weak Indicators for Grade 3 to 5 Random Sample 105
Table 13: Strong and Weak Indicators for Grades 6 to 8 Random Sample 107
Table 14: Dimensionality and Fit Indices for Grades 3 through 8 with All Items 110
Table 15: Grade 5 Measure Development and Item Categorization Process 112
Table 16: Dimensionality and Fit Indices for Grade 5 Measure Development and Item Categorization Process Steps 113
Table 17: Cognitive Engagement Subscale Results for All Grades 131
Table 18: Behavioral Engagement Subscale Results for all Grades 134
Table 19: Test- Retest Cognitive Engagement Subscale Results for All Grades Using Second Random Sample 138
Table 20: Test- Retest Behavioral Engagement Subscale Results for All Grades Using Second Random Sample 142
Table 21: Grade Level CFA One-Factor and Two-Factor Sample Moments, Parameters to be Estimated and Conclusions 154

viii
Table 22: Correlations between Person Logit Position for Online Cognitive Engagement and Online Behavioral Engagement and Academic Achievement 159
Table 23: Regressions Predicting Academic Achievement from Online Cognitive Engagement and Online Behavioral Engagement 161
Table 24: General Dimensionality and Fit Indices for Steps in Measure Development 209
Table 25: Invariance Examination for Grade Segments 212
Table 26: Item Categorization Steps for Grade Segments, Grades 3 to 5 and Grade 6 to 8 213
Table 27: Grade 3 Measure Development and Item Categorization Process 218
Table 28: Dimensionality and Fit for Grade 3 Measure Development and Item Categorization Process 219
ix
List of Figures
Figure 1: Parsimonious Structural Equation Model for Online student engagement for grades 3 through 8 77
Figure 2: Three Sub-Scale Structural Equation Model for Online student engagement for grades 3 through 8 78
Figure 3: Overall Summary of Missing Values 87
Figure 4: Missing Value Patterns 88
Figure 5: Ten Most Frequently Occurring Patterns of Missing Data 89
Figure 7: Person-Item Maps for Grade 5 Cognitive Engagement Item Categorization 116
Figure 8: 1st Dimension- Cognitive Engagement 118
Figure 9: Measure Continuum Changes for Grade 5 Behavioral Engagement 121
Figure 10: 2nd Dimension- Behavioral Engagement 122
Figure 11: Grade 3 Item-Person Map for Total Scale and by Dimension (Cognitive and Behavioral) 124
Figure 12: Grade 4 Item-Person Map for Total Scale and by Dimension (Cognitive and Behavioral) 125
Figure 13: Grade 6 Item-Person Map for Total Scale and by Dimension (Cognitive and Behavioral) 126
Figure 14: Grade 7 Item-Person Map for Total Scale and by Dimension (Cognitive and Behavioral) 127
Figure 15: Grade 8 Item-Person Map for Total Scale and by Dimension (Cognitive and Behavioral) 128
Figure 16: Grade 3CFA Models 148
Figure 17: Grade 4 CFA Models 149
Figure 18: Grade 5 CFA Models 150
Figure 19: Grade 6 CFA Models 151
Figure 20: Grade 7 CFA Models 152
Figure 21: Grade 8 CFA Models 153
Figure 22: Example of Dashboard: Online Cognitive Engagement vs Online Behavioral Engagement for Free lunch Eligible Grade 8 New Students 179
Figure 23: Category Probability Curves for Math Total Time as a Dichotomous Item, Four Category Item and Eight Category Item 207
x
Figure 24: Grade 3 Item-Person Map for Total Scale and by Dimension (Cognitive and Behavioral) 221
Figure 25: Grade 4 Item-Person Map for Total Scale and by Dimension Cognitive and Behavioral) 224
Figure 26: Grade 5 Item-Person Map for Total Scale and by Dimension (Cognitive and Behavioral) 228
Figure 27: Grade 6 Item-Person Map for Total Scale and by Dimension (Cognitive and Behavioral) 237
Figure 28: Grade 7 Item-Person Map for Total Scale and by Dimension (Cognitive and Behavioral) 240
Figure 29: Grade 8 Item-Person Map for Total Scale and by Dimension (Cognitive and Behavioral) 244
1
Chapter 1: Introduction and Literature Review
Students in the United States lag behind their international counterparts in both
academic achievement skills (Lemke et al., 2004) and applied career-oriented literacy and
numeracy skills (Goodman, Finnegan, Mohadjer, Krenzke, & Hogan, 2013). The lack of
these global workforce skills contributes to a struggle with unemployment and career
establishment for students in the United States as they exit college. One might assume
that it is only the low-achieving students who are lagging behind their international
counterparts, but the International Association of Adult Competencies found that even the
wealthiest and best-educated adults in the United States lack the literacy, numeracy, and
problem-solving skills required to compete in the global workforce (Goodman et al.,
2013).
Career-oriented reading ability and mathematical ability that are required to
compete and be successful in the global workforce are developed from the academic
achievement of primary school and secondary school students (Chapin, 2008; Jao, 2013;
Lemke & Gonzales, 2006). The academic achievement of primary and secondary
students can be measured by student grades, internal curriculum assessments such as
quizzes and exams, and state assessments, which in most US states are given annually
2
starting in third grade. Ensuring that US schools effectively impart the skills essential for
the global workforce as well as supporting the academic success of students throughout
the curriculum is pivotal to the United States in competing with the rest of the world.
Every year, teachers, schools, and districts across the United States implement
new techniques, theories, and best practices to improve student academic achievement,
increase graduation rates, and decrease dropout rates. Increasing graduation rates and
decreasing high school dropout rates is a critical aspect in the effort to improve the skill
level and number of US graduates that competitively enter the global workforce (Bowers,
2010; Caron, 2015). The list of recommendations for improving high school graduation
rates while decreasing dropout rates is long and deep, yet all recommendations require a
certain investment by the student. Successful implementation of any technique, theory, or
best practice requires student buy-in and participation—student engagement. Student
engagement is the investment students must contribute to make all of the strategies and
techniques meaningful and relevant (Appleton, Christenson, & Furlong, 2008; Fredricks
& McColskey, 2012). Kuh (2009) found that engaged students are more likely to persist,
achieve success, and complete qualifications for graduation. If students are not engaged
in the learning that is taking place in the classroom, then they are unlikely to obtain the
skills necessary to successfully move on to the next level of education (tertiary) or into
the global workforce (Bowers, 2010; Stokes, 2011). Through the efforts of both the
students and their teachers and schools, student engagement levels can be raised to
increase academic achievement (Cano, 2015; Fredricks & McColskey, 2012; Singh,
2015).
3
Student engagement has been defined in several different ways as it has become a
highlight of educational research in the last two decades. According to Fredricks and
McColsky (2012),“researchers, educators, and policymakers are increasingly focused on
student engagement as the key to address problems of low achievement, high levels of
student boredom, alienation, and high dropout rates” (p. 763). Chen, Gonyea, and Kuh
(2008) have defined student engagement as the quality of effort students themselves
devote to educationally purposeful activities that contribute directly to desired outcomes.
However, this definition may not be specific enough to apply to all learning environments
or be conducive to the consistent measurement of student engagement.
The definition and measurement of student engagement become more complex in
the case of online learning environments. While the definition of student engagement
should stay consistent with more traditional learning environments, the measure of
student engagement should be unique to the data availability of the online learning
environment. Yet there is neither a universally accepted definition nor learning
environment-specific measure of student engagement, both of which are needed to
conduct further research on the connection between student engagement, academic
success, and global workforce skills. This research study addressed this problem through
the development of an online student engagement measure for students in grades 3
through 8 that utilizes student behavior data regularly collected by online schools.
4
Problem Statement
Student engagement is essential to the development of research-based best
practices for the K-12 online learning environment, but student engagement must first be
defined and measured appropriately (Morris, Finnegan, & Wu, 2005). Fredricks and
McColsky (2012) believe “that a more systematic and thoughtful attention to
measurement of student engagement is one of the most pressing and imperative directions
for future research” (p. 779). This need for student engagement measurement extends to
the online learning environment as more traditional learning environments.
The measurement of online student engagement has mimicked the measurement
of student engagement in traditional learning environments. Online student engagement
has been measured by single observed variables such as independent time in course
(Morris, Finnegan, et al., 2005), the number of on-task and off-task Internet activities
(Bulger, Mayer, Almeroth, & Blau, 2008) and self-esteem (Harbaugh & Cavanagh,
2012). In addition, student engagement measures often use surveys and questionnaires
that rely on self-assessment (Harbaugh & Cavanagh, 2012). However, these methods of
data collection are not necessarily applicable to the K-12 online learning environment.
There is a need for a measure of student engagement for K-12 online students.
5
Research Question and Hypotheses
In an effort to provide a more fitting form of student engagement measurement
for the K-12 online learning environment, this study aimed to answer the following
research question and hypotheses:
Research Question: Does a measure of online student engagement for grades 3 through
8 comprised of continuous online student behavior items scaled
using a polytomous Rasch partial credit model meet the
expectations of dimensionality, model fit, item fit, construct
reliability, and construct validity?
Hypothesis 1: The online student engagement measure for grades 3 through 8
encompasses three dimensions of student engagement—
behavioral, affective, and cognitive—displaying fit statistics that
support a three-factor model over a one-factor model for the
overall measure of online student engagement for grades 3 through
8.
Hypothesis 2: The online student engagement measure for grades 3 through 8 is
invariant across student special education status and grade level.
Hypothesis 3: The online student engagement measure for grades 3 through 8
displays statistically significant positive correlations with academic
achievement for any subscales that comprise the measure.
6
The research question and hypotheses of this study not only encompass the need
for a consistent student engagement measure for the K-12 online learning environment
but also acknowledge that an online learning environment has different attributes that
contribute to student engagement and academic achievement.
Purpose Statement
The purpose of this research study was to develop a measure of online student
engagement for grades 3 through 8 that uses tracked student online behaviors as items.
The online student engagement for grades 3 through 8 measure was defined in terms of
online student behavioral indicators. Item response theory with a polytomous partial
credit model was used to develop this measure of online student engagement for grades 3
through 8. Structural equation modeling via confirmatory factor analysis was used to
assess support for the structure of the measure. At the conclusion of this research, the
online student engagement measure for grades 3 through 8 measure was examined for
correlation with academic achievement.
In relation to the measure being developed this study considered that previous
research has found student engagement in traditional learning environments to be
multifaceted (Fredricks & McColskey, 2012; Lam et al., 2014). For this research study,
student engagement was considered a multifaceted latent construct that comprises
behavioral, affective, and cognitive engagement components (Axelson & Flick, 2011;
Fredricks, Blumenfeld, & Paris, 2004). It is hypothesized that for K-12 online students all
three forms of student engagement—behavioral, cognitive, and affective—can be

7
observed and measured through observed online student behaviors. The inclusion of the
three components of student engagement in the online student engagement for grades 3
through 8 measure was intended to capture the complexity of student engagement in an
online learning environment.
Several studies have assessed student engagement, both in an online learning
environment and in other learning environments (Chen, Lambert, & Guidry, 2010;
Hamane, 2014; Lerma, 2010; McNeal, Spry, Mitra, & Tipton, 2014). Yet none of the
current research studies used multiple items within the measure that were not self-
reported, meaning either one item was used to represent student engagement or a self-
report measure was used to quantify student engagement. The goal of this project was to
utilize multiple continuous variables as items in the measure of online student
engagement for grades 3 through 8.
Ultimately, the online student engagement for grades 3 through 8 measure is
expected to be used to support online school decision making, student intervention
developments, and overall improvement of academic success in an online learning
environment for K-12 students. Establishing online students’ engagement levels provides
vital information for schools and teachers on how to make focused improvements for
students (Appleton et al., 2008; Carter, Reschly, Lovelace, Appleton, & Thompson, 2012;
Fredricks & McColskey, 2012). In addition, measuring a student body’s overall
engagement in an educational program provides essential information on how to improve
student retention and academic success (Ett, 2008; Gasper, DeLuca, & Estacion, 2012).
8
The creation of a comprehensive measure of online student engagement for grades 3
through 8 is important in order to identify the educational methods that successfully
improve K-12 online learning environments.
The online student engagement measure for grades 3 through 8 developed in this
research study not only extends the understanding of student engagement in an online
learning environment, but also exposes differences between the online learning
environment and traditional learning environments.
Literature Review
Educational researchers have found that as student engagement is increased it
contributes to higher grades, higher state assessment scores, and better school conduct
(Lam et al., 2014; Pierson & Connell, 1992; Skinner & Belmont, 1993a). With an
average Cohen’s d effect size of 0.48, it has been established that student engagement is
important to academic achievement (Hattie, 2009). Since student engagement is a key
factor in academic achievement, a reliable, valid, and grade-expansive measure of student
engagement is needed. To begin to measure student engagement, the construct must first
be detailed and student engagement defined; even with extensive interest in the study of
student engagement, there has been little agreement over the definition of student
engagement (Appleton et al., 2008; Fredricks & McColskey, 2012). The definition of
student engagement has evolved and fluctuated over time, which has resulted in similar
shifting trends for the measurement of student engagement. If student engagement is not
9
consistently measured then the impact of student engagement on academic achievement
is not clear.
Some researchers view student engagement as a compilation of relationships with
school, teachers, administrators, other students, and self, as well as the influences of these
relationships on students’ academic achievement and conduct (Cano, 2015; Cremascoli,
2011; Ett, 2008). Other researchers define student engagement as a collection of
contextual factors that can both influence targeted interventions (Appleton et al., 2008;
Fredricks & McColskey, 2012) and predict developmental and academic outcomes (Lam
et al., 2014; Shernoff & Schmidt, 2008). With this range of classifications of student
engagement, it is no wonder that the measure of student engagement is intricate as well.
Early pioneers in education and educational access set the foundation for the
definitions of student engagement as well as the items used to measure student
engagement. Initial research on student engagement can be seen in the work of John
Dewey in the 1940s. Dewey’s research made associations to student engagement through
the relationship between interest and motivation, which in turn were linked to the desire
to put forth energy to complete an academic task (Dewey, 1946). Following the work of
Dewey, educational researchers then began defining and examining student engagement
specifically. Current research defining student engagement draws notably on the work of
the student involvement researcher Alexander Astin in the 1980s. Astin suggested that
student learning is directly proportional to student involvement (Axelson & Flick, 2010).
Astin’s theory of student involvement is made up of three components: inputs,
10
environment, and outcomes. The three components of Astin’s theory of involvement have
been expanded upon and evolved into the components currently used to define and
measure student engagement.
Astin’s work was expanded upon by Connell and Welborn’s (1991) self-systems
process model and Finn’s (1991) participation-identification (PI) model. Connell and
Wellborn’s self-systems process model focuses on how school environments can be
nurtured to promote competence, motivation, and student engagement. In contrast, Finn’s
PI model focuses on students’ participatory behaviors and how the effects of those
behaviors can lead to increased engagement resulting in academic success. These models
added to the foundation of student engagement knowledge and directed the current
definitions of student engagement.
Defining Student Engagement
Before student engagement can be measured it must be defined so measurement is
linked to the definition. The advancement of the definition of student engagement has
enhanced the methodology of student engagement measurement. Student engagement has
been defined in research in terms of effort (Meece, Blumenfeld, & Hoyle, 1988), time on
task (Spanjers, Burns, & Wagner, 2008), and motivation (Pintrich & De Groot, 1990;
Skinner & Belmont, 1993a). Most recently, student engagement has been broadly defined
as student involvement and time of involvement in activities and practices that lead to
increased academic achievement (Axelson & Flick, 2010; Coates, 2007; Leach & Zepke,
2011; Morris, Finnegan, et al., 2005). In addition, student engagement has been described
11
as pertaining to students’ contribution to their academic activities and experiences either
in the form of time and energy of study efforts or in the form of willingness to problem
solve (Axelson & Flick, 2010; Kuh, 2009). Overall the definitions of student engagement
are based on the participation of students in their own learning and contribution to their
academic success. In short, student engagement embodies the participation of students in
their own learning and academic success.
Even with the myriad number of definitions for student engagement, researchers
have agreed that student engagement is a multidimensional construct (Carter et al., 2012;
Fredricks & McColskey, 2012). The agreement ends here however, in that there have
been three-component models, four-dimensional models, and six-factor models proposed
for the measurement of student engagement. Morris et al. (2005) found that student
engagement is defined most often as cognitive-based, behavioral-based, affective-based
or a combination of two or more of the previous designations. In addition, Fredricks and
McColskey (2012) found that student engagement models that contained three or fewer
components were more accurate because they had little to no overlap of items between
components. It is important to have little to no item overlap across components or
subscales to ensure the independent utility of both the subscale and the measure as a
whole. The three-component model includes behavioral, affective, and cognitive
components of student engagement. This research study focused on the three-component
model to optimize clarity in definition and to develop a measure of online student
engagement for grades 3 through 8.

12
The three-component model of student engagement includes behavioral
engagement, cognitive engagement, and affective engagement. Most of the research has
been conducted on each of these components of student engagement individually, but a
few more recent studies and scales bring these components together to measure the
student engagement construct (Axelson & Flick, 2011; Fredricks & McColskey, 2012;
Harbaugh & Cavanagh, 2012). Measured separately, each of the components of student
engagement has been found to contribute to positive academic outcomes (Fredricks et al.,
2004; Sinclair, Christenson, Lehr, & Anderson, 2003). To fully understand student
engagement, researchers must understand it in all three of its forms: behavioral,
cognitive, and affective (Cavanaugh, 2010), in addition to understanding how these
components work together to fully encompass the student engagement construct.
Now that it has been established that student engagement must be defined as a
multidimensional construct that consists of three components, it is important to define
each of the components to begin to define student engagement in more detail. The
behavioral, affective, and cognitive components of student engagement all incorporate
different aspects of the student engagement construct. The full definition of student
engagement must unite the definitions of each of its components.
The behavioral component of student engagement consists of the actions that
students take to gain access to the curriculum. The behavioral component of student
engagement is the most studied and foundational element of student engagement
research. Behavioral engagement has been measured by effort and persistence in
13
schoolwork (Ladd & Birch, 1997), participation in extracurricular activities (Finn,
Pannozzo, & Voelkl, 1995), school attendance and participation in class activities
(Appleton, Christenson, Kim, & Reschly, 2006), and preparation for class including
homework completion (Fredricks & McColskey, 2012). Once a student accesses the
curriculum and displays behavioral engagement, then the students can begin to make
emotional ties to their learning.
Affective engagement, also called emotional engagement, is the emotional tie or
how students feel about their learning (Pierson & Connell, 1992; Skinner & Belmont,
1993a), including their learning environment (Finn, 1989; Voelkl, 1997) and teachers and
classmates (Appleton et al., 2006; Finn, 1989; Fredricks et al., 2004). In addition,
according to Fredricks and McColskey (2012) “expressing interest and enjoyment;
reporting fun and excitement; reacting to failure and challenge; feeling safe; perceiving
school as valuable; and expressing feelings of belonging” (p. 772) should also be
included in the measure of affective engagement. Affective engagement contributes
activities that display the “care” students have for their education and for the curriculum
they have accessed. In addition to accessing the curriculum and making emotional ties to
the curriculum, an engaged student would also use cognitive skills and resources to
display mastery of the curriculum; cognitive engagement.
The resources and skills utilized to learn and display learning are embedded in the
cognitive engagement component of student engagement. The cognitive component is
observed when students embrace the learning process which leads to actions with
14
achievement and academic success outcomes (Fredricks et al., 2004; Meece, Blumerfeld,
& Hoyle, 1988). Cognitive engagement is the mental investment in academic
achievement, not necessarily academic performance. The cognitive component of student
engagement also encompasses the neurological process of learning as well as the
knowledge of child development with cognitive learning milestones (Chi & Wylie,
2014).
In the development of curriculum, in both online and traditional formats, learning
objectives are typically used to focus the learning process of students. These learning
objectives are usually written with a specific taxonomy that is related to the cognitive
process of learning. An example of this practice is the use of the revised Bloom’s
Taxonomy to write objectives that support the flow of learning through the following
stages:
1. Remember
2. Understand
3. Apply
4. Analyze
5. Evaluate
6. Create
(Krathwohl, 2002)
15
The established objectives also become the focus of academic achievement goals. In
addition, these goals require students to mentally invest in their learning to reach said
goals. This mental investment is cognitive engagement.
Educational researchers have found that academic achievement goals relate
directly to cognitive engagement, which in turn influences academic achievement. Hence
a student must first have sufficient levels of cognitive engagement before academic
achievement can be accomplished. Yet it is difficult to separate the measure of cognitive
engagement from academic achievement outcomes. For example, while grades on
formative and summative assessments can be used to measure academic achievement, the
number of attempts or effort that a student puts into mastering the content on the
formative or summative assessments could be used to measure cognitive engagement, the
investment made to attain academic achievement. Laim et al. (2014) explained that
“examples of indicators of cognitive engagement include the use of learning strategies,
execution of a particular work style, and self-regulated learning” (p. 215). Student
motivation is also part of the cognitive component of student engagement (Fredricks &
McColskey, 2012). The cognitive component of student engagement links student
engagement to academic achievement through the display of the actions required to reach
academic achievement expectations. The cognitive engagement component also parallels
motivation research and must be distinguished from motivation to complete the
multidimensional definition of student engagement.
16
Student motivation is very closely aligned to the cognitive component of student
engagement. While educational researchers were focused on student engagement,
psychologists were conducting research on motivation and forms of motivation with the
same academic success outcomes. Psychologists began identifying behaviors related to
student engagement as they researched the manifestations of motivation and cognition
(Fredricks & McColskey, 2012). To fully understand student engagement, research must
differentiate the cognitive engagement component from motivation (Fredricks &
McColskey, 2012). While motivation is the internal desire to succeed, student
engagement is the manifestation of motivation, in the form of behaviors, emotional
expressions, and cognitive displays (Fredricks & McColskey, 2012).
Student engagement and student motivation are conceptually similar due to their
shared research foundations. Both student motivation and student engagement stem from
studies of self-efficacy (Schunk, 1991), interest (Dewey, 1946; Schiefele, 1991), and goal
orientation (Ames & Ames, 1984; Dweck & Elliot, 1983; Nicholls, 1984). Yet
psychological research examined internal sentiments (Skinner & Belmont, 1993a,
1993b), such as attributes (Weiner, 1986), perceived ability (McIver, Stipek, & Daniels,
1991), perceived control and competence (Chapman, Skinner, & Bates, 1991; Weisz &
Cameron, 1985), and self-concept (Harbaugh & Cavanagh, 2012; Wigfield &
Karpathian, 1991),while educational researchers focused on the outward displays of these
internal sentiments. According to Skinner and Belmont (1993a), cognitive engagement,
and disaffection, lack of motivation, encompass similar behaviors and motivational
indicators.
17
Student engagement, in particular the cognitive component, is the manifestation
of student motivation (Fredricks & McColskey, 2012). Motivation and cognitive
engagement are similar, but motivation focuses on internal processes while cognitive
engagement is focused on external actions that result from the internal processes.
In addition to the distinction between student engagement and motivation, student
engagement, especially the cognitive component, must also be differentiated from the
outcomes of academic achievement. If cognitive engagement is defined as the mental
investment in academic achievement, then to measure it parallels academic achievement.
Yet while academic achievement is defined and measured by the final score or grade on
an assessment or set of assessments, cognitive engagement can be measured by the
number of attempts taken to achieve the level of academic achievement. It is assumed
that with increased mental investment, cognitive engagement, fewer attempts will be
needed to master the curriculum assessments. Student engagement, whether behavioral,
affective or cognitive, is the investment or actions taken to achieve learning and academic
success (Fredricks, 2004).
Keeping with the actionable definitions of the components of student engagement,
for this study student engagement was defined as a three-component manifestation of the
motivation, academic behaviors, emotional expressions, and cognitive displays required
to achieve success as measured by the annual state assessments. In addition, for this study
student engagement for grades 3 through 8 was measured in an online context.

18
Online Student Engagement
The online learning environment lends itself well to the use of student behaviors
to measure student engagement. The behaviors of students in an online learning
environment are regularly documented. Yet since online education as we know it today is
still a young industry, less than 30 years old, educational researchers are still exploring
ways to collect and use the data available in an online learning environment.
Similar to traditional learning environments, student engagement is essential to
the development of research-based best practices for the K-12 online learning
environment. While the components of student engagement remain the same at their core,
they are displayed and hence measured differently in the online learning environment.
The behavioral engagement component in a traditional learning environment may be
measured by attendance at school, while in the online learning environment daily logins
to the online courses could represent behavioral engagement. Likewise, the affective
engagement component in the online environment may be individual emails to one’s
teacher, while in a traditional learning environment it may be measured by seeking out
additional help from a teacher. Lastly, the cognitive component can be measured
similarly in both learning environments through the display of homework, practice, and
studying to reach academic achievement goals.
Also similar to traditional learning environments, student engagement must first
be clearly defined and measured appropriately (Morris, Finnegan, et al., 2005; Morris,
19
Wu, & Finnegan, 2005) in an online learning environment to aid in future educational
research.
Online student engagement has been measured by single observed variables such
as independent time in course (Morris, Finnegan, et al., 2005), the number of on-task and
off-task internet activities (Bulger et al., 2008), and self-esteem (Harbaugh & Cavanagh,
2012). Most of the online student engagement measures that have been developed were
designed for college-aged and higher education learning environments where online
learning included computer-equipped classrooms and campus-based students taking one
or more online course.
The majority of the research that has been done on online student engagement
comes from higher education researchers. In some cases, the participants of these
research studies are campus-based students who choose to take one or more of their
courses online. The National Survey of Student Engagement (NSSE) has been used to
assess the engagement levels of higher education students and has been adapted for
online students in a higher education setting. Yet this fuels the question of whether online
student engagement should be measured differently for students who are 100% online.
Chen et al. (2008) found that not only were there demographic differences
between the students who chose to take online courses and campus-based college
students but also that online students had higher engagement levels than their campus-
based school counterparts. However, it was not confirmed how the differences in
demographics affected student engagement levels. The most highly engaged online
20
students in the Chen et al. (2008) research were students who were over the traditional
age of college students, leading Chen et al. (2008) to question if age increases
engagement levels as well as motivation for academic success.
For primary and secondary education students, researchers have done some work
with traditional K-12 student engagement levels when they are using online learning
resources and tutorials (R. S. Baker, Corbett, & Koedinger, 2004; Gobert, Baker, &
Wixon, 2015) yet more research is needed to identify specific differences between
traditional K-12 students and online K-12 students, if there are differences at all. The
establishment of an online student engagement for grades 3 through 8 measure helps
progress in this type of research.
Since online student engagement for grades 3 through 8 has yet to be fully
defined, this study used the general definition of student engagement previously
established: three-component manifestation of the motivation, academic behaviors,
emotional expressions, and cognitive displays required to achieve success as measured by
the annual state assessments.
Measuring Student Engagement
Once student engagement is defined then it can begin to be measured. For both
brick-and-mortar K-12 schools and online K-12 schools there are challenges that need to
be addressed to establish a measure with support for validity. Fredricks and McColskey
(2012) stated “One of the challenges with research on student engagement is the large
variation in the measurement of this construct, which has made it challenging to compare

21
findings across studies” (p. 763). Two aspects of measurement that contribute to the
challenge of student engagement measurement development are:
1. Differences between indicators and facilitators used for measurement items
2. Data collection methods utilized
By addressing these two concerns a measure of student engagement can have fewer
inconsistencies and greater validity (Fredricks & McColskey, 2012).
Indicators versus Facilitators
The distinction between indicators of student engagement and facilitators of
student engagement need to be kept in mind as a measure for student engagement is
constructed and evaluated (Appleton et al., 2008). Skinner, Furrer, Marchand, and
Kindermann (2008) were the first to identify the need to distinguish between indicators
and facilitators in the construction of student engagement measures and listed
differentiation as one of the problems leading to inconsistencies in student engagement
research. According to Lam et al. (2014), “Indicators refer to the features that define
student engagement, whereas facilitators are contextual factors that exert influences on
student engagement” (p. 215). Thus indicators are the student behaviors, student
emotions, and student cognitive displays that are used to directly measure the
engagement level of students. Facilitators are all the best practices, teacher professional
development, and school cultural implementations that try to encourage higher levels of
student engagement within the classroom. Lam et al. (2014) gave the example of “use of
learning strategies, execution of a particular work style, and self-regulated learning” (p.
22
215) as indicators for cognitive engagement and “time spent on task” as an indicator for
behavioral engagement.
For this study, only indicators were included in the measure of student
engagement, with future research discussed to include identifying the facilitators of
student engagement.
Data Collection Methods
The second aspect of student engagement measurement that contributes to the
inconsistency of measure development is the data collection method employed.
Researchers have used several different methods of measurement for student
engagement, including but not limited to surveys and questionnaires, observations and
teacher ratings, interviews, and experience sampling. In most cases the component of
student engagement—behavioral, affective, or cognitive—that is being measured controls
the data collection method utilized (Appleton et al., 2006; Fredricks & McColskey,
2012). Now that researchers are attempting to measure multiple components of student
engagement simultaneously, there is substantial argument on what would be the
psychometrically appropriate form of data collection (Appleton et al., 2006; Finn &
Zimmer, 2012). Each of these methods of measurement of student engagement has its
own set of advantages and disadvantages, as seen in Table 1. Some data collection
methods are ill suited to collecting the necessary data to measure all components of
student engagement. This, along with the contrast between the advantages and
23
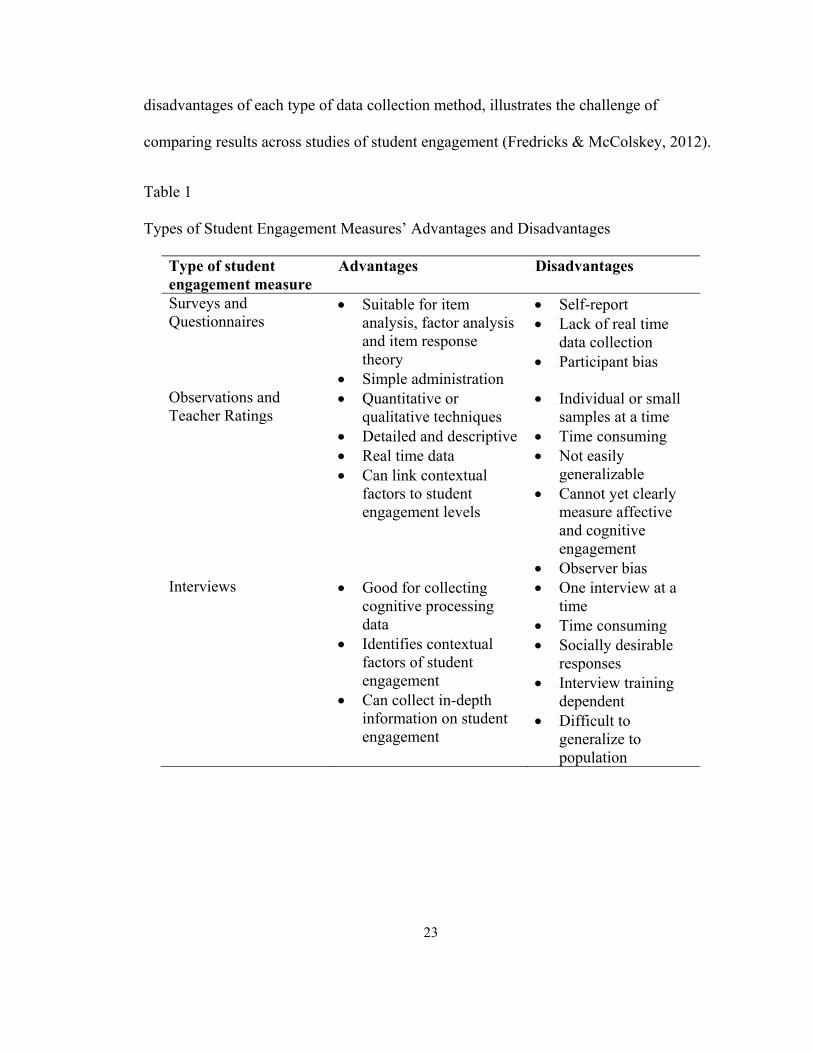
disadvantages of each type of data collection method, illustrates the challenge of
comparing results across studies of student engagement (Fredricks & McColskey, 2012).
Table 1 Types of Student Engagement Measures’ Advantages and Disadvantages
Type of student engagement measure
Advantages Disadvantages
Surveys and Questionnaires
Suitable for item analysis, factor analysis and item response theory
Simple administration
Self-report Lack of real time
data collection Participant bias
Observations and Teacher Ratings
Quantitative or qualitative techniques
Detailed and descriptive Real time data Can link contextual
factors to student engagement levels
Individual or small samples at a time
Time consuming Not easily
generalizable Cannot yet clearly
measure affective and cognitive engagement
Observer bias Interviews Good for collecting
cognitive processing data
Identifies contextual factors of student engagement
Can collect in-depth information on student engagement
One interview at a time
Time consuming Socially desirable
responses Interview training
dependent Difficult to
generalize to population

24
Experience Sampling (ESM)
Real time engagement ratings
Tracks length and intensity of engagement
Observations without the observer
Multiple students’ data collected simultaneously
Time consuming Depends on
participation of student participants
Struggle to include items that represent multidimensional constructs
Not suitable for younger children; student participants
Surveys and Questionnaires
Due to the ease of administration, surveys and questionnaires are most often used
in student engagement research studies. Surveys and questionnaires are frequently used
with students, teachers, and parents (Handelsman, Briggs, Sullivan, & Towler, 2005;
Harbaugh & Cavanagh, 2012). The psychometric properties of quantitative surveys and
questionnaires are most suitable for item analysis, factor analysis, and item response
theory analysis. This form of data collection is also practical with simple administration.
Yet the disadvantages of surveys and questionnaires, such as their self-report
nature, lack of real-time data collection, and participant bias can skew the results and
paint an unreal picture of student engagement. Participation bias is the most concerning
disadvantage of self- report surveys and questionnaires. If student participants do not feel
comfortable and honestly answer the self-report surveys and questionnaires then
researchers are not capturing the actual behavior or cognitive strategies being employed
(Appleton et al., 2006; Garcia & Pintrich, 1995). This participation bias can be
25
emphasized by broadly worded items that allow participants to respond generally instead
of to specific tasks or classroom circumstances (Fredricks & McColskey, 2012).
Surveys and questionnaires have been used and continue to be used to expand
research on student engagement, yet strategies for overcoming the disadvantages,
especially participant bias, are necessary.
Observations and Teacher Ratings
Observations and teacher ratings can be utilized both at an individual and at a
classroom level. Also the data collected from observations and teacher ratings can be
quantitative, qualitative, or a mixture of both. Most researchers that have used
observations and/or teacher ratings to study student engagement have started with some
predetermined categories of behaviors that constitute either engagement or
disengagement (Jao, 2013). Other researchers used qualitative techniques to collect
narrative and descriptive data to measure student engagement levels. Teacher ratings
have been used to assess behavioral and emotional engagement (Finn, Folger, & Cox,
1991; Finn et al., 1995; Skinner & Belmont, 1993a) as well as the multi-component
construct of student engagement (Wigfield et al., 2008). Similar to observations, teacher
ratings can potentially document levels of student engagement, especially related to
particular academic content. Overall, the greatest advantage to using observations and
teacher ratings is the capability to document contextual factors connected with high and
low student engagement (Fredricks & McColskey, 2012).
26
The primary disadvantage of observations and teacher ratings is they are only able
to capture engagement levels and behaviors for one individual student or classroom at a
time (Fredricks & McColskey, 2012). This makes observations and teacher ratings very
time consuming and not easily generalizable to the larger population of students.
Observations and teacher ratings are currently unable to clearly capture the data needed
to measure aspects of affective and cognitive engagement such as quality of effort,
participation, or thinking (Fredricks & McColskey, 2012; Peterson, Swing, Stark, &
Waas, 1984). In addition, research has shown a disconnect between the student
engagement levels teachers assign to students versus the student engagement levels
students assign to themselves (Fredricks & McColskey, 2012), especially in relation to
emotional engagement. Similarly, observations can be heavily biased by the observers,
especially untrained observers, along with participation bias due to knowledge of being
observed (Fredricks & McColskey, 2012).
While observations and teacher ratings work well for linking contextual factors or
specific classroom activities with student engagement levels, neither observations nor
teacher ratings can capture the full source of student engagement.
Interviews
Another common data collection method used by student engagement researchers
is interviews. Interviews for student engagement research have been conducted
quantitatively, with structured questions, and qualitatively, with open-ended
questions(Turner & Meyer, 2000). Interviews have been a good way to collect the
27
cognitive processing data needed to understand the cognitive engagement component of
student engagement. Interviews have been used to assess how and which contextual
factors relate to student engagement (Meece, Blumerfeld, et al., 1988) and to extract
meaningful vignettes concentrating on how engagement relates to the student’s school
experiences. These attributes of interviews give them the ability to gather in-depth data
related to both affective and cognitive engagement.
Interviews also have some disadvantages that would need to be overcome to use
the data from interviews to develop a measure of student engagement. Interviews are
heavily reliant on the training and position of the interviewer. If the interviewer is seen as
an authority figure or reporting to an authority figure, then the student participant may
give socially desirable answers instead of honest answers. Also interviews are so personal
that it is difficult to relate the findings from interviews to the student engagement of the
larger population (Fredricks & McColskey, 2012).
Although interviews collect in-depth personal information from students about
their engagement levels, interviews are not able to accumulate data necessary to develop
a psychometrically sound measure of student engagement (Katz-Buonincontro &
Hektner, 2014).
Experience Sampling (ESM)
Experience sampling or ESM is another data collection method used in student
engagement research. ESM utilizes technology to have students give engagement ratings
in real time during activities along with tracking the amount of time engagement or
28
intense focus on a task takes place (Katz-Buonincontro & Hektner, 2014). ESM has been
used to observe engagement in a classroom setting without an observer needing to be
present and allows the tracking of multiple students’ engagement levels at one time
(Shernoff, Csikszentmihalyi, Schneider, & Shernoff, 2003; Shernoff & Schmidt, 2008;
Yair, 2000). Hektner, Schmidt, and Csikszentmihalyi (2007) found that ESM could
effectively be used to collect a large amount of comprehensive data in real time while
limiting the problems of retrospective answers and socially desirable responses. ESM is
useful for examining student engagement over time and classroom scenarios, such as
transitions into new lessons.
Yet with all of its advantages, ESM is still very time consuming, relies heavily on
the participation of student participants, and may not be suitable for younger students
(Fredricks & McColskey, 2012). ESM captures more of the facilitators of student
engagement instead of the indicators that would need to be used to develop a measure of
student engagement. Moreover, ESM measures struggle to include enough items to
encompass the multidimensional nature of student engagement (Fredricks & McColskey,
2012).
ESM is useful in collection of more data from more students than other data
collection methods but ESM is not useful in measuring the multiple components of
student engagement concurrently.
The advantages and disadvantages of each of these data collection methods with
regard to student engagement highlight the complexity of the construct of student
29
engagement. Additionally, the current data collection methods for student engagement
research do not seem appropriate for students in an online learning environment.
Current Measures of K-12 Student Engagement
Survey and questionnaire data may not be appropriate for online K-12 students
due to the additional entry points for bias, misadministration, and low response rates. Yet
many of the current measures of student engagement use surveys and or questionnaires as
their main source of data.
Fredricks and McColskey (2012) published a comprehensive evaluation of the
student engagement measures currently available and being employed in educational
research. This evaluation details the development and data collection methods of 11 self-
report student engagement measures, 4 of which (Table 2) were used in this research
study to set a foundational basis for the development of the Online student engagement
for grades 3 through 8 measure. Four student engagement surveys—NSSE, HSSSE,
MES, and SEI/SEI-E—represent both student engagement measures that are used as a
base for other measures and measures that contain items for all three components of
student engagement.
The National Survey of Student Engagement (NSSE) was developed from the
College Student Experiences Questionnaire (CSEQ) to measure college-aged student
engagement (Kuh, 2009), yet several measures of student engagement at the primary and
secondary school level have been based on the NSSE (Fredricks & McColskey, 2012).

30
The High School Survey of Student Engagement (HSSSE) is derived from the
NSSE and was developed to collect data on the view of high school students in relation to
their schoolwork, school learning environment, and interactions with school community
(Fredricks & McColskey, 2012; Yazzie-Mintz, 2007). The student engagement construct
measured by the HSSE includes all three components of student engagement.
The Motivation and Engagement Survey (MES) and the Student Engagement
Instrument (SEI) also encompass the three components of student engagement, as well as
a measure of disengagement. The MES is a self-report measure that was developed for
informing instruction and interventions by identifying students who are at risk for low
motivation and engagement (Fredricks & McColskey, 2012).
SEI was originally developed for the measurement of middle school and high
school affective and cognitive engagement. The SEI was then adapted for elementary
aged students to create the Student Engagement Instrument- Elementary Version (SEI-E).
The SEI-E was developed for third through fifth grade students to expand the research
with student engagement longitudinally and to attempt the early identification of students
at risk for disengagement and high school dropout (Appleton et al., 2006).
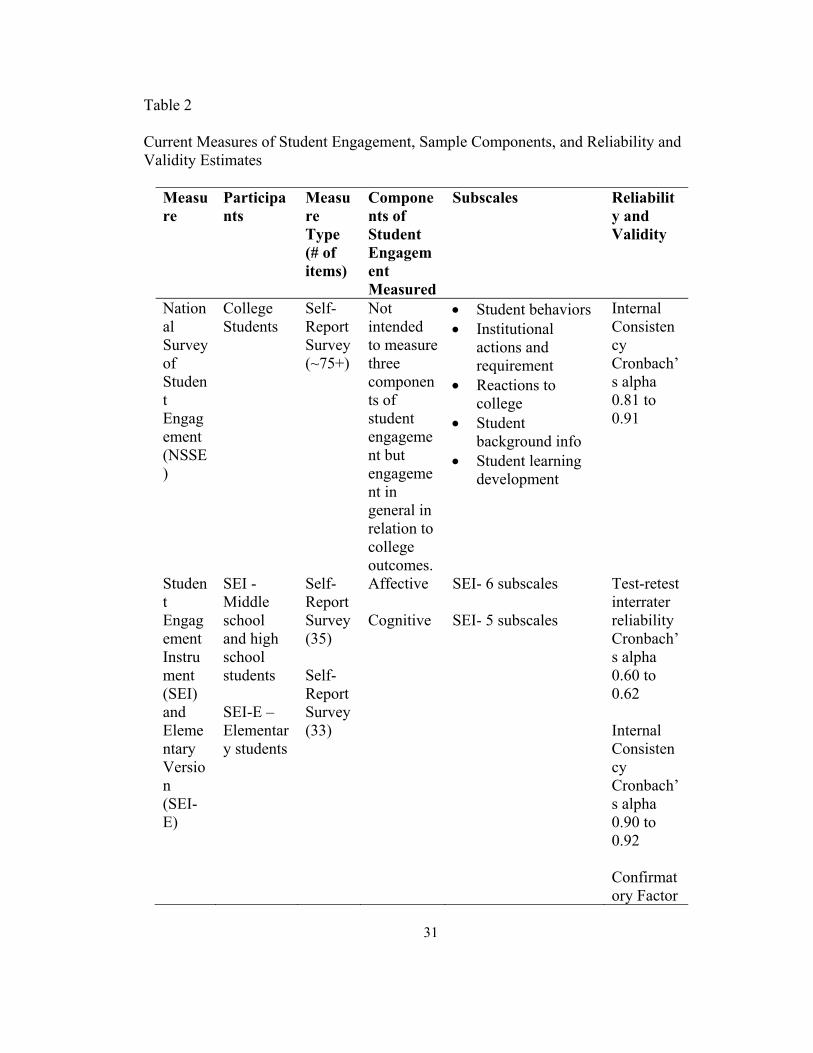
Table 2 provides information about participants, measure type with number of
items, components of student engagement measured, subscales, and reliability/validity of
the most frequently used measures of student engagement. All of the measures listed in
Table 2 are self-report surveys and questionnaires that were developed using item
response theory.
31
Table 2 Current Measures of Student Engagement, Sample Components, and Reliability and Validity Estimates
Measure
Participants
Measure Type (# of items)
Components of Student Engagement Measured
Subscales Reliability and Validity
National Survey of Student Engagement (NSSE)
College Students
Self-Report Survey (~75+)
Not intended to measure three components of student engagement but engagement in general in relation to college outcomes.
Student behaviors Institutional
actions and requirement
Reactions to college
Student background info
Student learning development
Internal Consistency Cronbach’s alpha 0.81 to 0.91
Student Engagement Instrument (SEI) and Elementary Version (SEI-E)
SEI - Middle school and high school students SEI-E – Elementary students
Self-Report Survey (35) Self-Report Survey (33)
Affective Cognitive
SEI- 6 subscales SEI- 5 subscales
Test-retest interrater reliability Cronbach’s alpha 0.60 to 0.62 Internal Consistency Cronbach’s alpha 0.90 to 0.92 Confirmatory Factor

32
Analysis validity for 6 scales SEI and 5 scales SEI-E
High School Survey of Student Engagement
High school students
Self-Report Survey (121)
Behavioral Affective Cognitive
Cognitive/intelligent/academic engagement
Social/behavioral/participatory engagement
Emotional engagement
None
Motivation and Engagement Survey (MES)
Middle school and high school students
Self-Report Survey (44)
Behavioral Affective Cognitive
11 subscales Test-retest interrater reliability Cronbach’s alpha 0.61 to 0.81 Internal Consistency Cronbach’s alpha 0.70 to 0.87
Measurement Development
Student engagement self-report surveys and questionnaires are sometimes
developed and validated using item response theory. Item response theory was used in the
development of this researcher’s measure of online student engagement for grades 3
through 8. The items all consisted of recorded online student behaviors, which are
33
continuous variables. These online student behaviors, like human behaviors in general,
can range on a continuum. The distribution of values on this continuum was the guide for
fitting the items into an item response model.
Item Response Theory
Latent trait theory focuses on the use of observed variables to measure a complex
trait or ability that cannot be directly measured or observed, such as online student
engagement for grades 3 through 8. Latent trait theory began with Ferguson’s 1942
normal ogive item characteristic function for items with dichotomous responses, which
was supported by the 1943 work of Lawley (Bejar, 1977). Latent trait theory expanded to
the measurement of attitude with the work of Lord (1952) and Lazarsfeld (1959). Now
latent trait theory is termed item response theory and encompasses different models for
unique item types. Bejar (1977) notes that “latent trait theory characterizes testees’
(participants’) trait levels by their position on a continuum, denoted by θ, which is
assumed to be ∞ ∞” (p. 510). Researchers primarily use item response theory
to develop, evaluate, and validate their measures of complex human behaviors, emotions,
and abilities.
Item response theory (IRT) is a set of non-linear models that give each participant
an ability estimate (θ) on an interval scale instead of an ability estimate based on an
overall test score. The raw score transformation to an interval scale (θ) is the main
advantage of using IRT over the classical test theory models that were used prior to IRT.
An additional benefit gained by using IRT instead of its classical test theory (CTT)
34
predecessor is its sample-free characteristic as well as capability to create a measure from
the item level instead of at the test level. The person ability and item difficulty logit
positions that are calculated using IRT are test independent (sample-free) probabilities
that place items and participants on the same measurement continuum.
The measure continuum of item response theory models is based on estimates of
item difficulty and person ability, a process called parameterization. Parameterization
specifics are based on the type of item response model utilized and produce a more
accurate estimate of the latent construct than an overall score.
Using IRT this study’s measure continuum consisted of all items and all subscales
with each subscale having its own measure continuum. Research focused on
multidimensional latent constructs has additional challenges. Bond and Fox (2007)
remind researchers
“we are all aware that the complexity of human existence can never be satisfactorily expressed as one score on any test. We can, however, develop some useful quantitative estimates of some human attributes, but we can do that only for one attribute at a time” (p. 33)
All of the student engagement measures previously reviewed used self-report
data collection methods followed by either factor analysis or item response theory
analysis for measure construction and evaluation. Both factor analysis and item response
theory are useful in grouping items to measure a latent construct or ability. Factor
analysis constructs a measure continuum that yields participants’ test-based ability
scores. The lack of sample-free ability scores means that the results of factor analysis can
35
change with every data set used and hence a reusable measure is not formed (Wright,
1996). On the other hand, item response theory results in a measure continuum that is
more stable with changing samples, or sample-free. Item response theory can generate a
consistent, usable measure while factor analysis cannot (Wright, 1996). According to
Bond and Fox (2007), “This (factor analysis’) dependence on sample-dependent
correlations, without analysis of fit or standard errors, severely limits the utility of factor
analysis results” (p. 252). Instead of using factor analysis to develop a measure, an item
response theory model is used to develop a measure that produces both item difficulty
and person ability estimates.
IRT was the preferred method of measure development for the current study but
results are still contingent on the quality of items in the measure.
Items
IRT models differ by the type of items they accommodate to create the measure
continuum. If items have only two possible responses, such as True/False or Yes/No, a
dichotomous response model is employed for measure development (Ostini, Finkelman,
& Nering, 2015). For multiple choice questions that have more than two options but are
still ordinal in nature, a polytomous model is used in measure development (Ostini et al.,
2015).
Whether dichotomous items or ordinal items, types of items are not only
pertinent to selecting an item response model for measure development the measure but
are also important in increasing the accuracy of person ability and item difficulty
36
estimations. As more items are placed along the measure continuum, the range of person
ability levels identified generally increases and the estimation error between participants’
true ability and estimated ability decreases (Bond & Fox, 2007). Likewise, as the range of
person ability increases, then the accuracy of estimation of item difficulty also increases
(Bond & Fox). Increasing the number of items and number of person abilities along the
measurement continuum means that there are more possible patterns of responses which
can generate more accurate measurement of the latent construct (Boone, Staver, & Yale,
2014). It is the goal of researchers to fashion a measurement continuum that is able to
clearly distinguish between both the extreme low and extreme high levels of the
construct/ability of measure but also those levels that are in the mid-range (Boone et al.,
2014). The items should be carefully selected to create the measure continuum that will
be useful with a wide range of ability levels. If a theoretical foundation is used to select
items, the ability levels will be estimated based on the theory. Without a strong
theoretical foundation, a pragmatic viewpoint can be used to select items based on
perspective participant abilities (Boone et al.).
The items for the measure of online student engagement for grades 3 through 8
were selected using both a theoretical foundation of the three components of student
engagement—behavioral, affective and cognitive—as well as from a pragmatic viewpoint
of participant ability along with the malleability of items. Student engagement is
considered to be malleable (Fredricks, 2004), so malleable items were included in the
measurement of student engagement. The items selected to measure the behavioral
engagement component of the online student engagement measure are most malleable,
37
followed by the items selected to measure the affective engagement component of online
student engagement. While somewhat malleable, the items selected to measure the
cognitive engagement component are more rigid in that they rely on other items, such as
those used to measure behavioral engagement and affective engagement, to change. Yet
by creating a measure of online student engagement that consists of mostly malleable
items, tools and resources to influence the level of online student engagement can be
developed in the future for use by practitioners (teachers and schools) in the field.
The items selected, regardless of whether they are continuous behaviors or data
collected from a survey/questionnaire, establish the foundation for the IRT model to be
used in measure development.
Item Response Model Selection
Once items are written and/or selected, a researcher can determine which item
response model to use in order to develop the measure. While dichotomous models use
items that have only two possible responses per item, polytomous models work with
items that have multiple categorical responses for each item. Different polytomous
models take into consideration the scale of each item and how items fit together to
encompass the measure (Ostini et al., 2015). The graded response model and the partial
credit model are two polytomous item response models. Both of these polytomous
models work with items that have multiple categorical response scales. With the use of
either the graded response model or the partial credit model, parameter estimation takes
into account that the items have more than two ordinal categories (J. G. Baker, Rounds,
38
& Zevon, 2000). Yet the graded response model assumes that all items have the same
ordinal category scale (Ostini et al., 2015). Alternatively, the partial credit model takes
items having different scales into account when parameter estimates are calculated.
Although the theory behind the continuous response model is that it will increase
the accuracy of the measure by increasing the possible response patterns, this theory has
only been substantiated by limited previous research (Zopluoglu, 2013). In addition, not
enough research has been done with the continuous response model to establish ranges of
parameter estimates that would support the accuracy of the measure (Zopluoglu). Lastly,
while the graded response model and the partial credit model are available in software
commonly used for item response theory, continuous response model measures would
need to be developed in a different software package that has yet to be validated
(Zopluoglu). Therefore, the model used in this work was the partial credit Rasch model.
Following continuous data being transformed into items with categorical response
scales, the items can now be entered into a polytomous response model for this study the
partial credit Rasch model for parameterization. The parameterization process consists of
the estimation of item difficulty and the estimation of person ability. The estimate of item
difficulty is the probability that a person at each ability level (student engagement level)
will get the item correct or exhibit the item in sufficient quantity. The estimate of person
ability is the probability that a person will get each item correct or exhibit the level of the
item associated with that item in sufficient quantity. Bond and Fox (2007) explain this
process as “the response probability for any person n attempting any item I is a function

39
of the difference between the ability of the person (Bn) and the difficulty of the item (Di)”
(p. 48). Both the item difficulty estimates and the person ability estimates are on a logit
scale and they are placed on the measurement continuum.
Once the item difficulty logits and the person ability logits are reflected on the
measurement continuum, then it is important to evaluate the item locations. There should
be items that measure each potential level of person ability and items should increase in
difficulty (level of student engagement) as they go up the scale. If the hypothesis is that
behavioral engagement items are the lowest levels of student engagement, followed by
affective engagement items, and the highest levels of student engagement measured by
cognitive engagement items holds, empirical item order would support or not support the
hypothesis. At this point in the research study the researcher diagnoses whether
additional items should be added, if there are gaps in the measurement continuum, or
items removed if there is too much overlap of items at a particular level of ability (student
engagement). The selection of items is pertinent and greatly affects not only the accuracy
of the measure but also reduces the amount of time necessary to fine tune it.
Psychometric Quality Indicators
During measure development and after the measure is constructed, the following
psychometric quality indicators must be met adequately for the measure to show evidence
of reliability and validity (Bond & Fox, 2007). A glossary of the numerous terms specific
to the Rasch model and to evaluation of items and scale use is found as Appendix A.
Dimensionality

40
Scale Use
Fit
Invariance
Reliability and Separation
There is a circular relationship between dimensionality, scale use, item fit, and
person fit. As a measure is created using IRT, any change to improve one or more of
these indices must be followed by the re-examination of them all. The goal of measure
development is to create a unidimensional measure with support for reliability and
validity made up of items that cover the array of person abilities and have scales that
clearly contribute to the measurement continuum. Using IRT models, this is done by
taking into consideration the cyclical relationship between the psychometric quality
indicators.
Dimensionality
Dimensionality is a key assumption of IRT models that ensures only one ability,
trait or construct is measured at a time (Bond & Fox, 2007). Similar to other IRT models,
the partial credit model require a unidimensional construct as the focus of the measure,
meaning that all the items included in the measure contribute to a single construct.
However, it is possible to have multiple scales, such as the three components of
student engagement, as part of a larger measure but each scale needs to meet the
unidimensionality assumption. The measure was first evaluated for dimensionality with
all items included in one measure. This is the most parsimonious model (Bond & Fox,
41
2007), but if this model is found to contain more than one scale then items would need to
be separated into different scales and dimensionality re-assessed for each scale
individually (Bond & Fox, 2007). Multiple dimensions were identified through the
number of potential “contrasts” listed with the dimensionality results for the
parsimonious model.
The dimensionality of a measure is investigated using the principal components
analysis of residuals (PCAR) (Bond & Fox, 2007; Boone et al., 2014), specifically the
raw variance explained by the measure, residual variance explained by the first contrast
(or a potential second factor), and the variance explained by the first contrast. Along with
the residual variance due to a first contrast, the variance between the person abilities and
item difficulties contribute to the determination of dimensionality. PCAR was used to
evaluate the variance of the person and item logit positions not explained by the measure.
If the measure is not unidimensional there are several adjustments that can be made to
reach the unidimensionality expectation aside from seeking a second dimension in the
data.
In order to reach unidimensionality, items can be removed from the measure that
are found to measure a construct other than the main construct or items’ scales can be
adjusted to better fit the measure continuum of the latent construct measurement.
Scale Use
One of the adjustments that can be made to help determine if unidimensionality is
feasible is modifying item response scale use (Bond & Fox, 2007; Boone et al., 2014).
42
Scale use interpretation is two-fold in that it is both how the measurement continuum is
designed as well as the use of the item response scales by participants.
For many IRT models, all the items have the same scale. The item scale use is
scrutinized for ordered categories so that each category measures a particular ability level
of participants on an individual item. Similar to the overall measurement continuum, each
item’s scale should measure a range of possible ability levels at the item level. Item
categories can be reordered or collapsed as needed to achieve appropriate use of the
rating scale.
For items with a continuous response scale, the number of response categories can
be increased until no positive change in measurement properties is noted. When an item’s
scale categories are changed, the dimensionality of the measure is reassessed after each
change (Bond & Fox, 2007; Boone et al., 2014).
The measurement continuum can be examined to ensure that the items are
measuring different ability levels along the continuum. If there is a gap in the
measurement continuum, in that some participants at a particular level do not have an
item to measure their ability level, then an item may need to be added to the measure to
fill the measurement continuum scale (Bond & Fox, 2007). If this is done, then the
measure would need to be re-administered for re-evaluation. This is not an ideal solution
for the researcher, so item scale use along with person and item fit should be manipulated
to meet dimensionality and measurement continuum goals prior to adding items to the
measure (Boone et al., 2014). Similarly, if there are multiple items at any location on the
43
measurement continuum, items with worse fit may be removed, improving overall fit and
unidimensionality, without loss of measurement precision.
Fit: Model, Item, and Person
Once the dimensionality of the measure is established it is important to evaluate
the fit of the model, together with person fit and item fit. Model fit is evaluated using the
root mean square error (RMSE). RMSE is calculated using the estimates of person fit and
item fit. The model fit indices can give clues when there are problems with the fit of the
data to the model but it is person fit and item fit that give the most information in order to
make adjustments to improve overall model fit.
The process of estimating the fit of person ability and item difficulty to the model
is done in two steps: (1) calibration of person abilities and item difficulties, and (2)
estimation of fit (Linacre, 2002; Masters, 1982). The person fit and item fit examines the
pattern of actual scores versus the pattern of expected scores. The statistics used to
determine the quality of fit are infit and outfit. The unstandardized form of infit and
outfit, for both person and item, is the mean square statistic. Wright (1994) suggests that
acceptable mean square item infit/outfit will fall between 0.7 and 1.4, with values over
1.0 being considered underfit, while values below 1.0 are overfit.
Underfit is noisy or unpredictable item and/or person performances which disrupt
the predictive nature of IRT models. Overfit is “too good to be true” item and person
performances which can give a false sense of reaching ideal fit. Yet a model that exhibits
overfit mean square person and item infit/outfit values is better than a model dominated
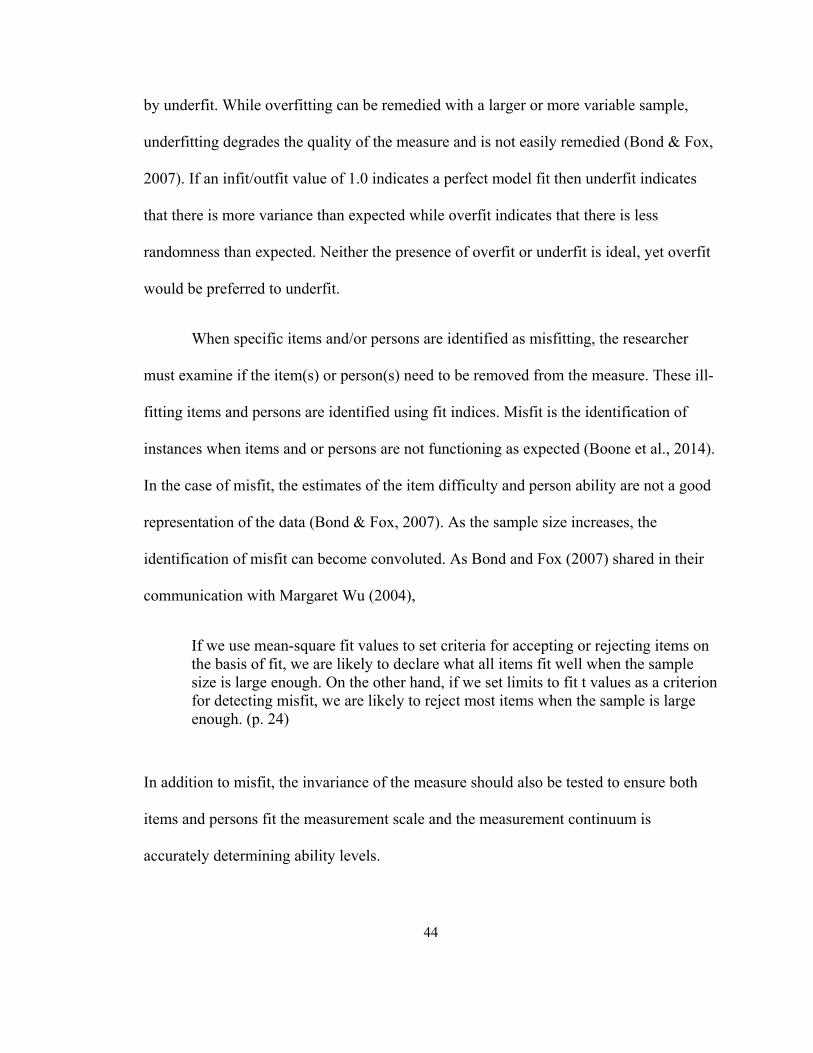
44
by underfit. While overfitting can be remedied with a larger or more variable sample,
underfitting degrades the quality of the measure and is not easily remedied (Bond & Fox,
2007). If an infit/outfit value of 1.0 indicates a perfect model fit then underfit indicates
that there is more variance than expected while overfit indicates that there is less
randomness than expected. Neither the presence of overfit or underfit is ideal, yet overfit
would be preferred to underfit.
When specific items and/or persons are identified as misfitting, the researcher
must examine if the item(s) or person(s) need to be removed from the measure. These ill-
fitting items and persons are identified using fit indices. Misfit is the identification of
instances when items and or persons are not functioning as expected (Boone et al., 2014).
In the case of misfit, the estimates of the item difficulty and person ability are not a good
representation of the data (Bond & Fox, 2007). As the sample size increases, the
identification of misfit can become convoluted. As Bond and Fox (2007) shared in their
communication with Margaret Wu (2004),
If we use mean-square fit values to set criteria for accepting or rejecting items on the basis of fit, we are likely to declare what all items fit well when the sample size is large enough. On the other hand, if we set limits to fit t values as a criterion for detecting misfit, we are likely to reject most items when the sample is large enough. (p. 24)
In addition to misfit, the invariance of the measure should also be tested to ensure both
items and persons fit the measurement scale and the measurement continuum is
accurately determining ability levels.
45
Invariance
An invariant item is one that does not change in difficulty when presented to
different person groups. To test item parameter invariance, a differential item function
(DIF) statistic is used. The DIF test identifies item bias by comparing the responses of
different person groups, such as student ethnicity groups. If it is found that there is a
statistically significant (α = 0.01) DIF statistic between two groups on a particular item
then the effect size must be evaluated to know the extent of the difference. An item with a
statistically significant DIF statistic with a DIF contrast value greater than 0.64 does not
meet invariance requirements. If an item is found to have statistically significant DIF,
then the item bias would be addressed by either replacing the item with a less biased
item, or removing the item from the measure.
Reliability/Validity and Separation
Reliability and validity must be evaluated for a newly developed measure. While
reliability indicates that the measure consistently measures ability levels, validity
suggests that it is measuring what it was intended to measure. Yet you cannot have
validity without reliability, therefore reliability is tested first, followed by validity.
Measures can be found to be reliable in a number of different ways. The three
most common tests for reliability are test-retest, alternate form and internal consistency
(Boone et al., 2014). Test-retest uses the measure to test the same population multiple
times to ensure that the same participants receive relatively the same scores each time the
46
measure is administered. With many measures the first time a participant completes the
measure affects subsequent times they take the measure, this introduces bias into the test
for reliability. Alternate forms use multiple versions of a test to check that similar levels
of ability are measured with either form. And internal consistency “is based on the
average correlation among the items of an instrument” (Boone et al., 2014, p. 223).
Coefficient alpha is typically reported to show the consistency of the relationship
between items. All three of these forms of reliability would in most cases use a
correlation or Cronbach’s alpha to assess reliability, yet these indices and the reliability
tests that use these indices are linear while the IRT models are inherently nonlinear
(Boone et al., 2014).
Linacre (2015) has established nonlinear indices within the IRT software
Winsteps that can be used to establish reliability of a developed or developing measure.
Winsteps provides person reliability, item reliability, and separation indices. All of these
indices consider reliability as the consistency of the measure to establish ability levels of
persons and difficulty levels of the items.
Person reliability indices evaluate the likelihood of a person getting the same
ability level every time the measure or any form of the measure is used; the measure
accurately and consistently measures the level of ability of persons. Similarly, item
reliability indices evaluate the consistency of the item difficulty remaining the same when
different participants complete the measure. Both person reliability and item reliability
require that there is a full range of person abilities, low to high, and item difficulties

47
included in the measure development process. Boone et al. (2014) detail how person
reliability indices should be interpreted: [P]erson reliability” can be interpreted similarly
to more traditional reliability indices in classical test theory (i.e., KR-20 and Cronbach’s
alpha; Linacre 2012). Meaning that values closer to 1 indicate a more internally
consistent measure. (p. 222)
Both person reliability and item reliability are supported by separation indices.
Person separation and item separation evaluate the level of noise (inconsistent results) in
relation to the level of signal (consistent results). The separation coefficient is “the square
root value of the ratio between the true person variance and the error variance” (Boone et
al., 2014, p. 222). With the addition of the separation indices both person reliability and
item reliability can be determined. Once reliability has been shown to meet expectations,
the validity of the measure can be tested.

48
Chapter 2: Method
The purpose of this research study was to use tracked student online behaviors as
items in the development of an online student engagement measure for grades 3 through
8. The research question and hypotheses of this study guided the development of the
measure as well as acted as the foundation for future research in the area of K-12 online
student engagement.
Research Question: Does a measure of online student engagement for grades 3 through
8 comprised of continuous online student behavior items and
scaled using a polytomous Rasch partial credit model meet the
expectations of dimensionality, model fit, item fit, construct
reliability, and construct validity?
Hypothesis 1: The online student engagement measure for grades 3 through 8
encompasses three dimensions of student engagement—
behavioral, affective, and cognitive—displaying fit statistics that
support a three-factor model over a one-factor model for the
overall measure of Online student engagement for grades 3
through 8.
49
Hypothesis 2: The online student engagement measure for grades 3 through 8 is
invariant across student special education status and grade level.
Hypothesis 3: The online student engagement measure for grades 3 through 8
displays statistically significant positive correlations with academic
achievement for any subscales that comprise the measure.
State assessment scores normalized across states and grades were used as
outcome variables for the measure as a whole, measure subscales, and individual measure
items. The outcome variables are the only variables not collected from the learning
management system that houses both student performance data and student behavior data
for the online learning environment. The outcome variables are stored in a separate
database and were added to the dataset containing the student performance data and
student behavior data.
The expectation was that this research study would produce a measure of online
student engagement for grades 3 through 8 that can be utilized in future research and as a
model for similar measures of latent constructs.
Participants
All of the participants in this study were in grades 3 through 8 during the 2013-
2014 school-year and completed state required assessments in math and reading. In
addition, all of these student participants started and completed the 2013- 2014 school-

50
year in an online charter school, where all the curriculum/content along and all student-
teacher interactions takes place in an online learning environment.
Online charter schools are public charter schools that are funded primarily
through state and school district funding while offering a public education in an online
learning environment. Similar to other public charter schools, online charter schools offer
an alternative to traditional public education. Online charter schools are required to meet
the same standards and expectations as other public schools, including satisfactory results
in annual state assessments. The results of these annual state assessments are used to
evaluate all public schools and teachers, including online charter schools and their
teachers.
In the online education industry it is important to note that there is a difference
between the online charter school and the company that supplies curriculum and school
management services. The Keeping Pace Report, produced by the Evergreen Education
Group, defines online learning suppliers as:
entities that provide online and digital learning products and services to schools, and sometimes directly to students, but usually coordinated and monitored by the school. A supplier is not responsible for a student’s academic activity and performance and is not authorized to do so (Watson, 2015, p. 8)
An online learning supplier is a support entity for the online charter schools. Yet the
responsibility of meeting district and state standards is solely the responsibility of the
school. The relationship between schools and suppliers in the online learning
environment creates a unique dynamic for online educational research. The sample used
51
for this research study was supplied by an online learning supplier and is typical of the
online charter school population in terms of demographics and student group
representativeness.
The online learning environment is a subpopulation to the population of all
students in grades 3 through 8. Ideally students in the online learning environment would
be compared to the population as a whole or compared to another subpopulation within
the same population but data is not available to make this comparison. Therefore, the
online learning environment is considered the population for this research study.
All participants in the provided sample had demographic variables that designated
socioeconomic status (FRL), whether they were part of the general education or special
education program (SPED), and how long they had attended school in an online setting
(Number of Years at Same Online School). These demographic variables were in
addition to the general demographic variables of sex, ethnicity, and grade. Table 3
displays percentages for demographic variables for those participants included in both of
the two randomly selected datasets used in this research study.
The final dataset had approximately 20,000 online students in grades 3 through 8
from approximately 32 schools. Table 3 displays percentages of demographic variables
for those participants included in both randomly selected datasets of 10,000 students each
used for this research study. It should be noted that the final datasets used were randomly
selected from the 10,000 student datasets and included 5,000 students in the Grades 3 to 5
grade segment and 5,000 students in the Grades 6 to 8 grade segment. This change in
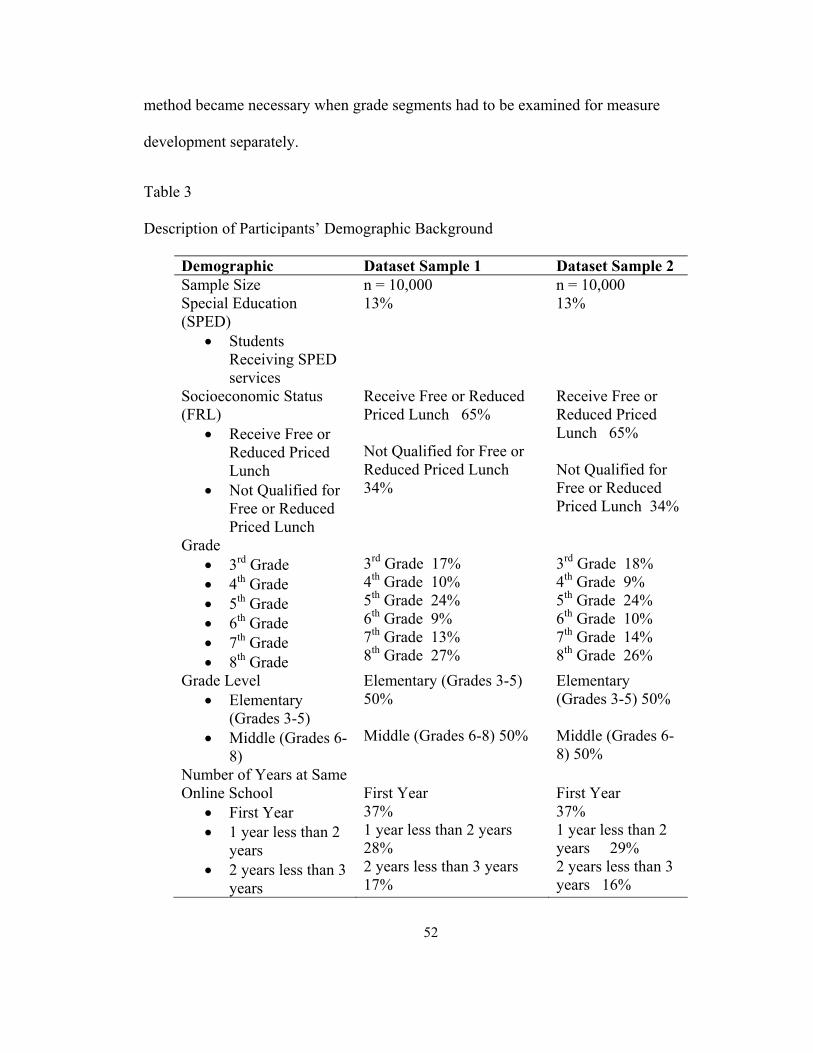
52
method became necessary when grade segments had to be examined for measure
development separately.
Table 3 Description of Participants’ Demographic Background
Demographic Dataset Sample 1 Dataset Sample 2 Sample Size n = 10,000 n = 10,000 Special Education (SPED)
Students Receiving SPED services
13% 13%
Socioeconomic Status (FRL)
Receive Free or Reduced Priced Lunch
Not Qualified for Free or Reduced Priced Lunch
Receive Free or Reduced Priced Lunch 65% Not Qualified for Free or Reduced Priced Lunch 34%
Receive Free or Reduced Priced Lunch 65% Not Qualified for Free or Reduced Priced Lunch 34%
Grade 3rd Grade 4th Grade 5th Grade 6th Grade 7th Grade 8th Grade
3rd Grade 17% 4th Grade 10% 5th Grade 24% 6th Grade 9% 7th Grade 13% 8th Grade 27%
3rd Grade 18% 4th Grade 9% 5th Grade 24% 6th Grade 10% 7th Grade 14% 8th Grade 26%
Grade Level Elementary
(Grades 3-5) Middle (Grades 6-
8)
Elementary (Grades 3-5) 50% Middle (Grades 6-8) 50%
Elementary (Grades 3-5) 50% Middle (Grades 6-8) 50%
Number of Years at Same Online School
First Year 1 year less than 2
years 2 years less than 3
years
First Year 37% 1 year less than 2 years 28% 2 years less than 3 years 17%
First Year 37% 1 year less than 2 years 29% 2 years less than 3 years 16%
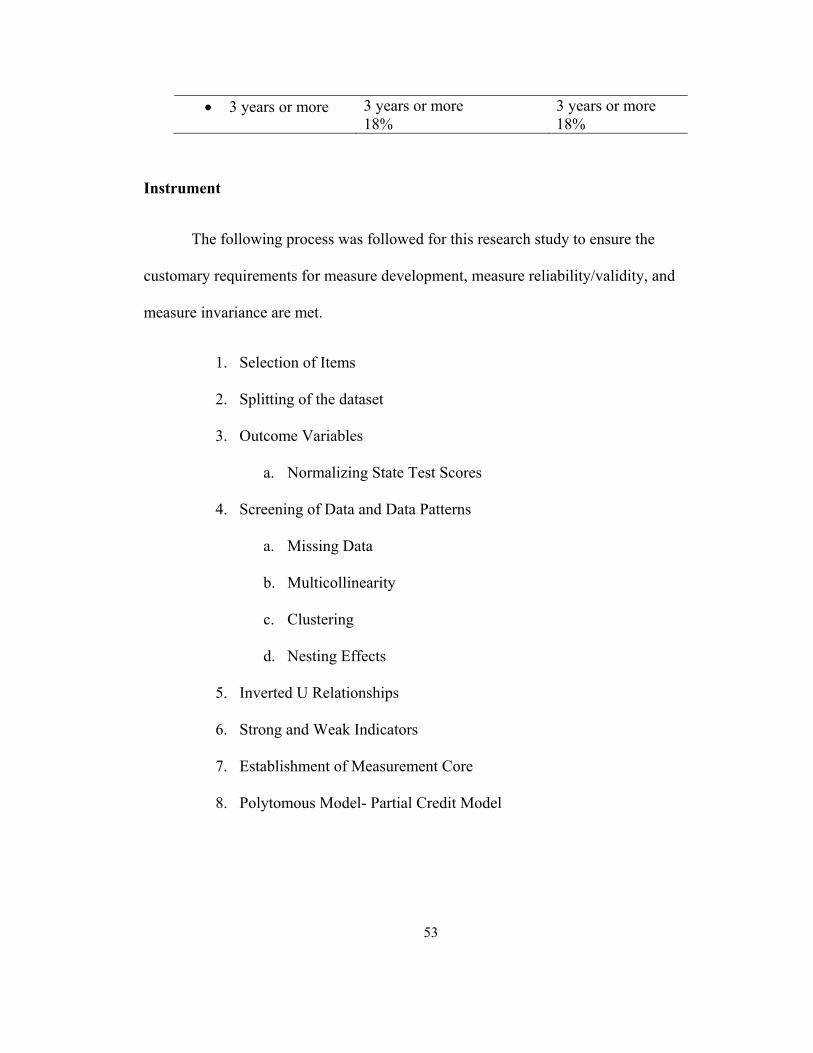
53
3 years or more 3 years or more 18%
3 years or more 18%
Instrument
The following process was followed for this research study to ensure the
customary requirements for measure development, measure reliability/validity, and
measure invariance are met.
1. Selection of Items
2. Splitting of the dataset
3. Outcome Variables
a. Normalizing State Test Scores
4. Screening of Data and Data Patterns
a. Missing Data
b. Multicollinearity
c. Clustering
d. Nesting Effects
5. Inverted U Relationships
6. Strong and Weak Indicators
7. Establishment of Measurement Core
8. Polytomous Model- Partial Credit Model
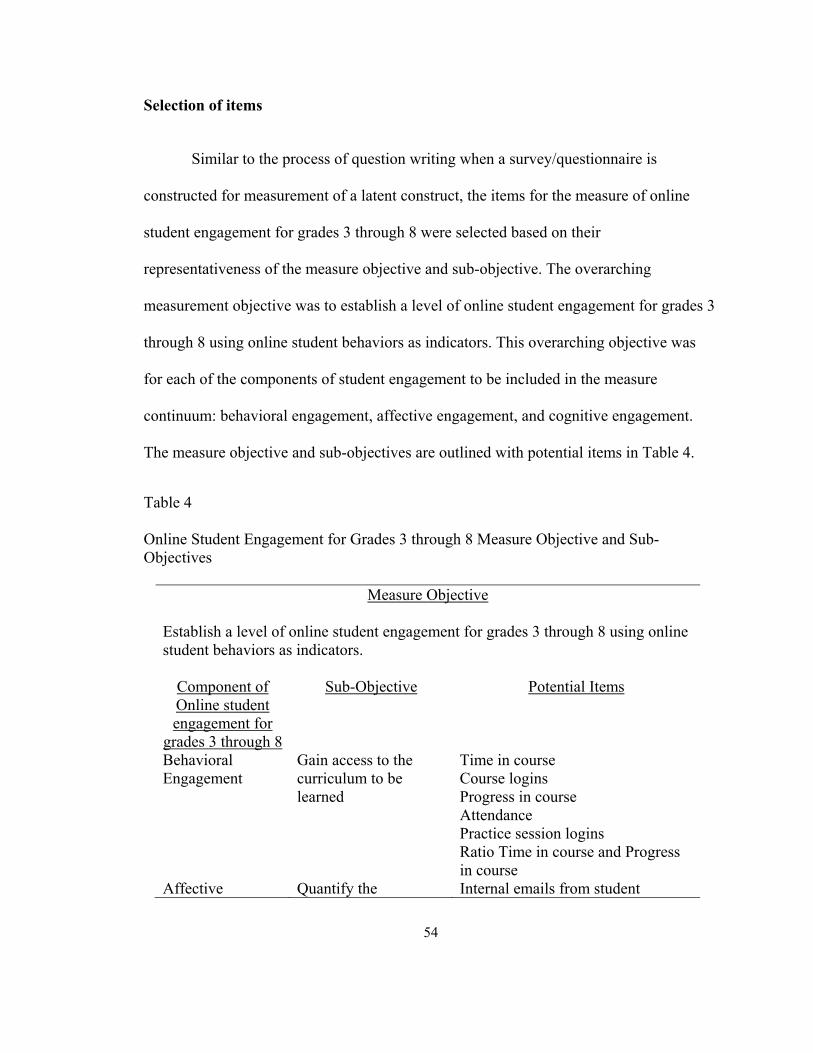
54
Selection of items
Similar to the process of question writing when a survey/questionnaire is
constructed for measurement of a latent construct, the items for the measure of online
student engagement for grades 3 through 8 were selected based on their
representativeness of the measure objective and sub-objective. The overarching
measurement objective was to establish a level of online student engagement for grades 3
through 8 using online student behaviors as indicators. This overarching objective was
for each of the components of student engagement to be included in the measure
continuum: behavioral engagement, affective engagement, and cognitive engagement.
The measure objective and sub-objectives are outlined with potential items in Table 4.
Table 4 Online Student Engagement for Grades 3 through 8 Measure Objective and Sub-Objectives
Measure Objective
Establish a level of online student engagement for grades 3 through 8 using online student behaviors as indicators.
Component of Online student engagement for
grades 3 through 8
Sub-Objective Potential Items
Behavioral Engagement
Gain access to the curriculum to be learned
Time in course Course logins Progress in course Attendance Practice session logins Ratio Time in course and Progress in course
Affective Quantify the Internal emails from student
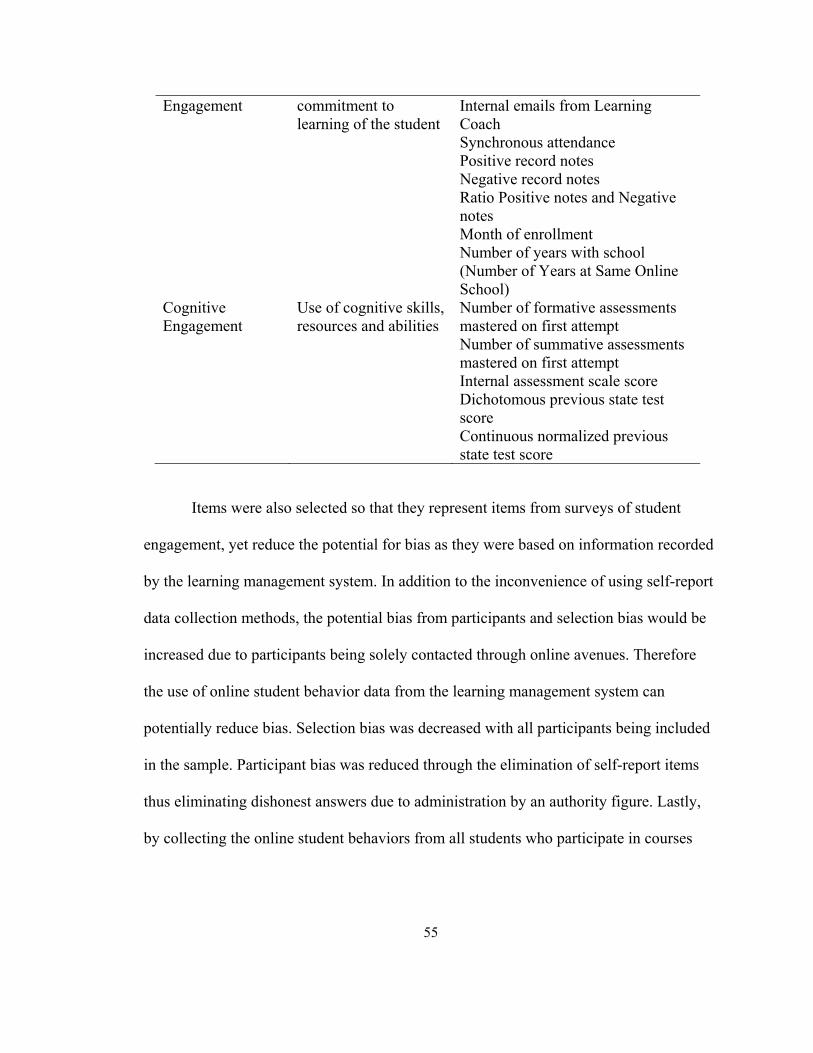
55
Engagement commitment to learning of the student
Internal emails from Learning Coach Synchronous attendance Positive record notes Negative record notes Ratio Positive notes and Negative notes Month of enrollment Number of years with school (Number of Years at Same Online School)
Cognitive Engagement
Use of cognitive skills, resources and abilities
Number of formative assessments mastered on first attempt Number of summative assessments mastered on first attempt Internal assessment scale score Dichotomous previous state test score Continuous normalized previous state test score
Items were also selected so that they represent items from surveys of student
engagement, yet reduce the potential for bias as they were based on information recorded
by the learning management system. In addition to the inconvenience of using self-report
data collection methods, the potential bias from participants and selection bias would be
increased due to participants being solely contacted through online avenues. Therefore
the use of online student behavior data from the learning management system can
potentially reduce bias. Selection bias was decreased with all participants being included
in the sample. Participant bias was reduced through the elimination of self-report items
thus eliminating dishonest answers due to administration by an authority figure. Lastly,
by collecting the online student behaviors from all students who participate in courses
56
housed in the learning management system, there was an increase in sample size which
assists in the construction of a measure continuum for online student engagement.
Following the aggregation of the data into one row per student per subject area
(math and English/language arts), each row of data was converted to a column
representing the variable to be used as an item in measure development. Once each
student had only one row of items, where only one item was represented by a column,
final preparations of the dataset for creation of the measure could be done.
For this research, the measure of online student engagement for grades 3 through
8 used continuous online student behaviors with a partial credit Rasch model to
parameterize the estimates. This means that all of the continuous online student behavior
items were categorized to fit the partial credit model.
Splitting of the dataset
It was expected that the dataset for this research study would include data for
approximately 20,000 K-12 online students. Instead of using this very large dataset for
the development of the measure, two smaller randomly selected datasets of
approximately 5,000 students were generated using IBM SPSS random sample function.
These smaller datasets were then used to develop the measure of online student
engagement for grades 3 through 8 using a partial credit model, test the measure using the
partial credit Rasch model, confirm the measure structure with confirmatory factor
analysis and validate the measure by correlation with academic achievement scores in
math and reading.

57
Outcomes
Researchers have established the relationship between student engagement and
academic achievement(Hattie, 2009). To ensure that this relationship was present in these
data, academic achievement outcomes were collected. All students in grades 3 through 8
are required to take state tests each year to confirm students are meeting state and federal
standards of academic achievement. Yet all states have different state tests with different
score scales and different proficiency cut score expectations. For this reason, all state test
scores were normalized/standardized in order to be compared and considered the same
measure of academic achievement.
Normalizing state test scores.
The process of normalizing/standardizing the state test scores is a similar process
to the calculation of z scores. Z scores begin with all scores being centered using the
population/sample mean then dividing by the population/sample standard deviation. Z
scores are essentially the number of standard deviations each original score is from the
mean.
1
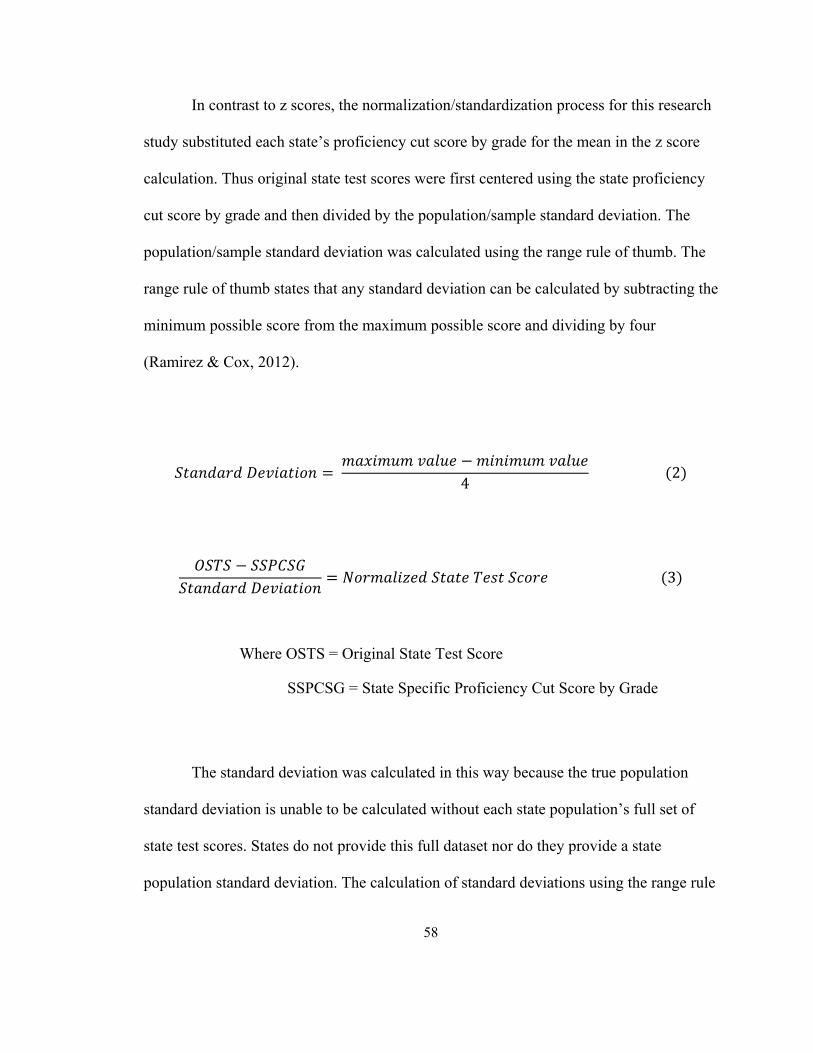
58
In contrast to z scores, the normalization/standardization process for this research
study substituted each state’s proficiency cut score by grade for the mean in the z score
calculation. Thus original state test scores were first centered using the state proficiency
cut score by grade and then divided by the population/sample standard deviation. The
population/sample standard deviation was calculated using the range rule of thumb. The
range rule of thumb states that any standard deviation can be calculated by subtracting the
minimum possible score from the maximum possible score and dividing by four
(Ramirez & Cox, 2012).
4 2
3
Where OSTS = Original State Test Score
SSPCSG = State Specific Proficiency Cut Score by Grade
The standard deviation was calculated in this way because the true population
standard deviation is unable to be calculated without each state population’s full set of
state test scores. States do not provide this full dataset nor do they provide a state
population standard deviation. The calculation of standard deviations using the range rule
59
of thumb could increase the variability of the normalized/standardized scores but is the
most accurate value without the state population data or standard deviation value.
In this manner each original state test score becomes the number of standard
deviations away from proficiency. Since proficiency is the academic achievement
expectation for the state it is a representative statistic for academic achievement. The
normalization of state test scores does not take into consideration differing levels of test
difficulty by state.
Screening of data and data patterns
Missing data
While Rasch analysis does not require the removal or imputation of missing data
for stable estimate calculations it is important to understand missingness in the dataset,
especially when using structural equation modeling for structure confirmation. By
understanding missing data and the patterns of missing data the consequences of the
options in dealing with missing data, including doing nothing at all, can be considered.
In this dataset from online students in grades 3 through 8, it was expected that
there would be a high number of missing data points across all variables, with some
students missing all item values besides demographic items (SPED, FRL, number of
years in online school). Yet in understanding how the online student behavior items
combine to measure higher levels of student engagement, the students who are missing
all item values are the true disengaged student, the lowest point on the measure
60
continuum. For this reason imputation was not an option because in shifting the zero or
disengaged level it would not be a true representation of the behaviors of online students
that contribute to their student engagement level.
The IBM SPSS Missing Values Analyzer was used to analyze the patterns of
missing data in the first randomly selected sample of approximately 5,000 students.
Since items are student behaviors and not survey/questionnaire items, it is
expected that many of the items would likely have large amounts of missing data.
Students who were missing all online student behavior item values were kept in both
datasets as the 100% disengaged (lowest point of measurement continuum) student.
Multicollinearity
Multicollinearity exists when independent variables are highly related to each
other. If unresolved, multicollinearity inflates error terms and weaken analyses performed
by including redundant information.
Multicollinearity was assessed using a bivariate correlation matrix. A statistically
significant correlation with a correlation coefficient equal to or greater than 0.9 was
identified as a multicollinear pair of items. If multicollinearity was identified, one
item/variable in the multicollinear pair of items was removed and multicollinearity
reassessed. Multicollinearity checks were performed using each of the random samples of
5,000 students each so item removals could be checked for consistency between random
samples.
61
Clustering
The items selected for this measure were chosen based on overall measure
objective and subscale measure objectives. The clustering effect of the items helps to
confirm or disconfirm the grouping of these items. A principal components analysis
(PCA) wasconducted using all items remaining after multicollinearity checks and
removal of items. A scree plot and eigenvalue evaluations with a parallel analysis were
used to determine the number of factors that represented by the items of the measure. In
addition, the grouping of items was further examined and documented for use in measure
development.
The expectation was that items selected for each of the components of student
engagement – behavioral engagement, affective engagement, and cognitive engagement –
would group together appropriately. If any of the components were left with minimal
(less than 3) items then the combination of component items was examined.
If it was found that all the items could not be included together in one measure
(there are subscales of the measure) then the results of the PCA were used to separate
subscales and continue measure development.
Nested Effects
Educational data is naturally nested since students occupy classrooms and
classrooms are in schools. Each of the randomly selected data sets of 5000 students was
62
examined for nesting effects of schools. This analysis examined whether simply being in
a particular school accounted for a large portion of the variance in outcome variables.
Outcome variables used in this assessment were the math normalized state test
score and the reading normalized state test score. HLM7 Student edition was used to
examine nesting effects by school. Each of the outcome variables was examined in a
hierarchical linear model that had no level I or level II predictors: the null model. For
each of these models the intraclass correlation (ICC, Equation 4) was calculated using the
between school variance and total variance. If the ICC was less than 0.1 or 10% of
variance explained then the nesting effect of schools was considered negligible.
(4)
Inverted U relationships
Once state test scores are normalized/standardized, the relationship between
outcomes (academic achievement) and measure items can be examined. The
identification of inverted U relationships between outcomes and items was important
since any item that has an inverted U relationship with an outcome variable should be
split into two items instead of simply mentioned as one item.
While most outcome-item relationships were anticipated to be linear, inverted U
relationships have different linear relationships on either side of the middle term of the
outcome, in this case “proficiency.” An inverted U relationship is a quadratic relationship
63
where there is a statistically significant positive slope for the lower outcome values while
there is a statistically significant negative slope for higher outcome values, with a peaking
turning point connecting these two slopes. To identify inverted U relationships a process
used in economics, proposed by Hirschberg and Lye (2005) was used. This process states
that inverted U relationships meet the following three requirements:
1. The slope of the squared independent variable/item is significant and negative
2. The slope at the lowest variable/item value is positive and significant while the
slope at the highest variable/item value is negative and significant
3. The turning point (first derivative of the regression equation) and its calculated
95% confidence interval are well within the data range of the variable/item
When an item has an inverted U relationship with the outcome variable, it is split into a
low end variable and a high end variable, where each student would have a value on one
item or the other, but not both. Consequently, a student who has a negative
normalized/standardized score would use the low end of the item, while a student who
has a positive normalize/standardized outcome would use the high end of the item. These
low end and high end items were individually scaled based on the linear relationship with
the outcome variable.
Strong and weak indicators
In addition to the identification of inverted U relationships, the relationships
between academic achievement outcomes and items were used to identify strong and
weak indicators. The identification of strong and weak indicators was important in the
64
process of putting the continuous items into categories for measure development using a
polytomous partial credit Rasch model.
Weak indicators are those items that have a weak relationship with outcome
variables as identified by a statistically significant correlation coefficient (r) that is less
than 0.4 (Bobko, 2001). The process for transforming these weak indicators into
categorical items from continuous items began with creating dichotomous variables with
the split between categories at the mean value of the item. As each item’s scale use was
reviewed (using item thresholds, observed average, and step structure described below)
the two halves were split into additional categories until the item scale covered the
measure continuum where it was most probable to occur.
Strong indicators are those that have a strong relationship with outcome variables
as indicated through a statistically significant correlation coefficient (r) greater than 0.5
(Bobko, 2001). It was expected that strong indicator items contribute more to the measure
continuum than weak indicator items. For this reason all strong indicator items were split
into 101 (100 splits) category items. Through scale use analysis, categories were made
larger or smaller to ensure the item response scale consistently contributed to the measure
continuum. This categorization process ended when each category had a portion of the
measure continuum where it was most probable to occur.
Once continuous items had been appropriately categorized based on their status as
a weak or strong indicator item, the items were put into a polytomous model to fully
develop the measure as a whole, starting with the measurement core.
65
Establishment of measurement core
The measurement core is the foundation from which an expanded measure can be
built. For this research study, a measurement core first needed to be established before
the measure could be fully realized. The measurement core was identified first through
the use of strong and weak indicators where the strong indicators were assumed to be the
best items for the measurement core, with weak indicator items added to the core one at a
time to build up the measure. Theoretically, each component of student engagement
(behavioral, affective and cognitive) had strong indicators to contribute to both the online
student engagement measurement core and the component measurement core. If the
identified strong indicators do not make a unidimensional measurement core or multiple
unidimensional subscale measurement cores then all items would be included in the
initial measure, excluding those removed for missing data concerns or multicollinearity.
Both techniques of measurement core development are essentially identifying a
measurement core from no pre-established known measure of online student engagement.
There is no clearly defined measure core or foundation for the measure because key
online student engagement items have not been identified from the available continuous
online student behavior variables. This means that in the process of measure development
the online student behaviors that should be included in the measurement core needed to
be identified as well. The measurement core items should relate to the outcome variables

66
enough to be considered student engagement but should not relate enough to be
considered academic achievement.
The process of measurement core development and measure development
required many iterations through the Winsteps program, using a partial credit Rasch
model. This process is usually used to establish construct validity of survey/questionnaire
items, but in this case the process was used to build the measure from the core outward.
The items that make up the measurement core should be items that explain a large (over
40%) amount of the variance in person ability (student engagement level) and increase
the ability of student engagement to predict the variance in the academic achievement
outcome variables.
The goal of this project was to build a measurement core that consists of items
that were able to separate the student participants into at least two groups: engaged (high
ability) and not engaged (low ability). Then the addition of more items fine-tuned the
measurement continuum to split person ability (level of student engagement) into more
levels which yield a finer gradient.
Polytomous measurement model: Partial credit Rasch model
A family of models has evolved to accommodate the development of measures
and models of latent constructs, such as online student engagement for grades 3 through
8. Polytomous models are based on item response theory and accommodate items that
have more than two categories. This research study used a partial credit Rasch model.
The process of developing the measure was iterative. Items were categorized and
67
indicator statistics reviewed until an optimal categorization was reached for each item.
[See Appendix A for a list and definitions of indicator statistics.] Items were rejected if
they misfit the polytomous measurement model or if they failed invariance testing.
Rejected items were removed from both of the datasets. Thus, the researcher conducted
multiple runs through the data in order to develop the measure.
The partial credit Rasch model works with items that have multiple categorical
responses (J. G. Baker et al., 2000). This model also allows for items to have different
multiple category response scales. With the potential of a mix of strong and weak
indicators, it was unlikely that all items would end the categorization process with the
same response scales. According to (Ostini et al., 2015, p. 289),
A major distinction that applies only to polytomous IRT models pertains to the way that category boundaries within an item are modeled. Boundary locations can either be modeled across an item, in terms of cumulative category response (GRM-type models), or locally, with respect to adjacent category responses only (Rasch-type models).
The partial credit Rasch model (PCM) is a model which defines category boundaries by
the probability of responding to adjacent categories. Since the PCM models each
category boundary separately it allows for “more general parameterization for ordered
polytomous items” (Ostini et al., 2015, p. 287). This further allows for specific
objectivity which in turn allows for objective comparisons by estimating different
people’s abilities independently (Ostini et al.). The mathematical form of the PCM
(Equation 5) shows the model:
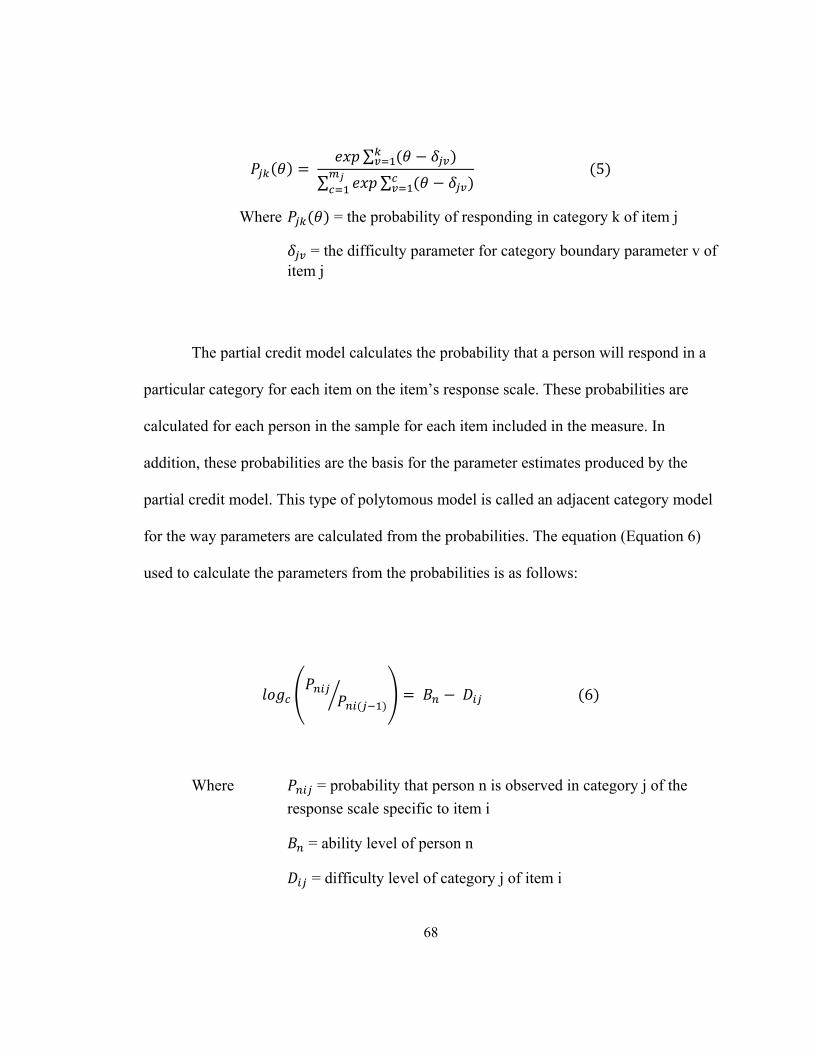
68
∑
∑ ∑ 5
Where = the probability of responding in category k of item j
= the difficulty parameter for category boundary parameter v of item j
The partial credit model calculates the probability that a person will respond in a
particular category for each item on the item’s response scale. These probabilities are
calculated for each person in the sample for each item included in the measure. In
addition, these probabilities are the basis for the parameter estimates produced by the
partial credit model. This type of polytomous model is called an adjacent category model
for the way parameters are calculated from the probabilities. The equation (Equation 6)
used to calculate the parameters from the probabilities is as follows:
6
Where = probability that person n is observed in category j of the
response scale specific to item i
= ability level of person n
= difficulty level of category j of item i
69
= probability that person n is observed in category j-1 (one
category lower than category j) of the response scale specific to item i
The partial credit model was used since after the categorization process items
were likely to have different rating scales and/or a mix of dichotomous and polytomous
items.
Building the measure
Winsteps software was used, and is developed and maintained by Linacre (2016).
Winsteps was used in both the establishment of each item’s rating scale and the
development of the measure. While dimensionality, fit, and scale use were monitored
throughout the item categorization process, invariance was checked only after the
measure was initially built. Dimensionality is whether one or more latent constructs seem
to underlie item responses and is assessed in the partial credit Rasch model with principal
components analysis of residuals (PCAR) described below. Fit is assessed by several
statistics and indicates whether the data fit the expectations of the partial credit Rasch
model. Fit is assessed by mean square and standardized infit and outfit. Infit, or
information-laden fit, is a weighted fit statistic based on a chi-square that weighs
responses close to the person position more heavily than responses distant from the
person position. Outfit, or outlier sensitive fit, is unweighted so extreme responses are
more heavily weighted. Both person fit and item fit statistics are generated by the
Winsteps software. Bond and Fox (2007) recommend that mean square fit values

70
between 0.6 and 1.4 indicate fitting items, while person fit values less than 3.0 indicate
adequate fitting persons. Standardized fit values are affected by sample size, with large
samples yielding large standardized fit values, and were not used in this study. Scale use
indices are described below.
The initial use of Winsteps was in the categorization of the continuous online
student behavior items followed by the development of the measure with the categorical
items created.
Principal components analysis of residuals (PCAR) for the measure as a whole
was used to assess the dimensionality of the measure (Linacre, 2015). This information
was checked and results recorded after each change was made to any item to ensure that
unidimensionality of the measure was maintained. PCAR is also used to identify the need
to establish multiple scales. It was hypothesized that this measure may yield three scales,
one for each type of student engagement—behavioral engagement, cognitive
engagement, and affective engagement. Unidimensionality is tenable if, in a PCAR, the
variance explained by the measure is approximately 40%, with a first contrast eigenvalue
(an indicator of a possible second dimension) less than 2.0, and variance to the first
contrast of less than 5% (Bond & Fox, 2007). A first contrast eigenvalue exceeding 2.0
indicates that item relationships to a potential second factor should be examined.
Item fit and person fit were registered both while items are being categorized and
as the measure was being developed. Item fit, person fit, adjusted standard deviation,
item separation, person separation, item reliability, and person reliability statistics were

71
monitored. These statistics are used to ensure that the measure continuum that is being
built item by item is clearly representing persons’ abilities being measured, in this case
level of student engagement. Adjusted standard deviation is the observed standard
deviation adjusted for measurement error. The error standard deviation is calculated
taking into account that as misfit increases, the error standard deviation inflates.
Separation is then calculated by dividing the adjusted standard deviation by the error
standard deviation, and represents the number of distant strata that can be identified in
person ability by the measure (Bond & Fox, 2007; Boone et al., 2014). Person separation
reliability and Cronbach’s alpha are based on the same concept; both calculate the
amount of observed variance that is reproducible (Bond & Fox, 2007). Person separation
reliability ( uses the following formula (Formula 7):
(7)
Where adjusted person variability =
total person variability =
The resulting person separation reliability estimate has values ranging between zero and
one (Masters, 1982). In addition, Cronbach’s alpha was calculated and monitored as well.
Along with dimensionality and fit, scale use were examined during both the item
categorization process and the measure development process. Scale use was observed
72
item by item when rating scales for items were being developed and all items were
observed once the initial measure was built. Threshold, observed average logit position
and category probability curves were monitored. A display of the partial credit map
distributions with persons and items displayed along the measure continuum was
generated and reviewed. Threshold is the boundary of person ability and item difficulty
that each category in an item’s response scale displays in relation to other categories. In
other words, each category in an item’s response scale should have unique boundaries
that represent a particular level of person ability and item difficulty. Observed average
logit positions display the location of each item category, and its threshold, in relation to
item difficulty and measure continuum. Examining the observed average logit position
can expose how each item category contributes to the item difficulty as well as the
measure continuum. The category probability curve of an item displays the observed
average logit position and thresholds for each category of an item. On a category
probability curve there should be little to no overlap in categories and no inversion of
categories. Inversion, or disordering, in observed average or threshold indicates that the
category is not functioning as intended. One resolution of category malfunction is
collapsing the category with an adjacent category.
Once each item continuum was split into categories and the initial measure built,
invariance was evaluated so either further adjustments could be made or items altered to
meet invariance requirements. Invariance means that the items measure student
engagement levels for different student groups in the same way, while misfit can threaten
the invariance of an item or measure as a whole. Invariance was assessed using t-tests
73
evaluated at the < 0.01 significance level. Items were considered to fail invariance if p <
0.01 and the differential item function (DIF) contrast was greater than |.64| (Bond & Fox,
2007).
If any item was found to not meet the invariance requirements for a specific
student group then the item would be altered, split into two or more items, or deleted to
meet the invariance requirements. An item could be removed for not meeting invariance
requirements but this option was avoided as much as possible throughout the measure
development process.
Analyses Addressing Research Question and Hypotheses
Research Question: Does a measure of online student engagement for grades 3 through
8 comprised of continuous online student behavior items and
scaled using a polytomous Rasch partial credit model meet the
expectations of dimensionality, model fit, item fit, construct
reliability, and construct validity?
The research question was addressed by examination of the dimensionality, fit,
separation, and reliability of the measure. The measure developed on the first sample was
used with a second sample of approximately 5,000 cases with dimensionality, fit,
separation, and reliability computed from the partial credit Rasch model.
Hypothesis 1: The online student engagement measure for grades 3 through 8
encompasses three components of student engagement—
74
behavioral, affective, and cognitive- displaying fit statistics that
support a three-factor model over a one-factor model for the
overall measure of online student engagement for grades 3 through
8.
The structure of the developed measure was confirmed using structural equation
modeling with the second random sample of approximately 5,000 cases. Both the most
parsimonious model with all items contributing directly to online student engagement for
grades 3 through 8 (Figure 1) and the three subscale model, where items are indirectly
related to online student engagement for grades 3 through 8 and the components of
student engagement—behavioral, affective, and cognitive (Figure 2)—were compared.
Figures 1 and 2 below provide examples of potential unidimensional and three-factor
models.
The fit indices used to compare the models were chi-square, root mean square
error of approximation (RMSEA), and comparative fit index (CIF). Structural equation
models are subject to a parsimonious principle in that the most parsimonious model is
preferred so examination of the models began with the most parsimonious and moved to
the least parsimonious model. The chi-square fit statistic is the most commonly used and
referenced fit statistic for structural equation modeling yet it is susceptible to sample size
so requires other fit indices to support the findings. Models that are just-identified have a
chi-square around 0, so the model that has a chi-square statistic that was statistically
significant at the 0.05 significance level and was closest to 0 was determined to be the
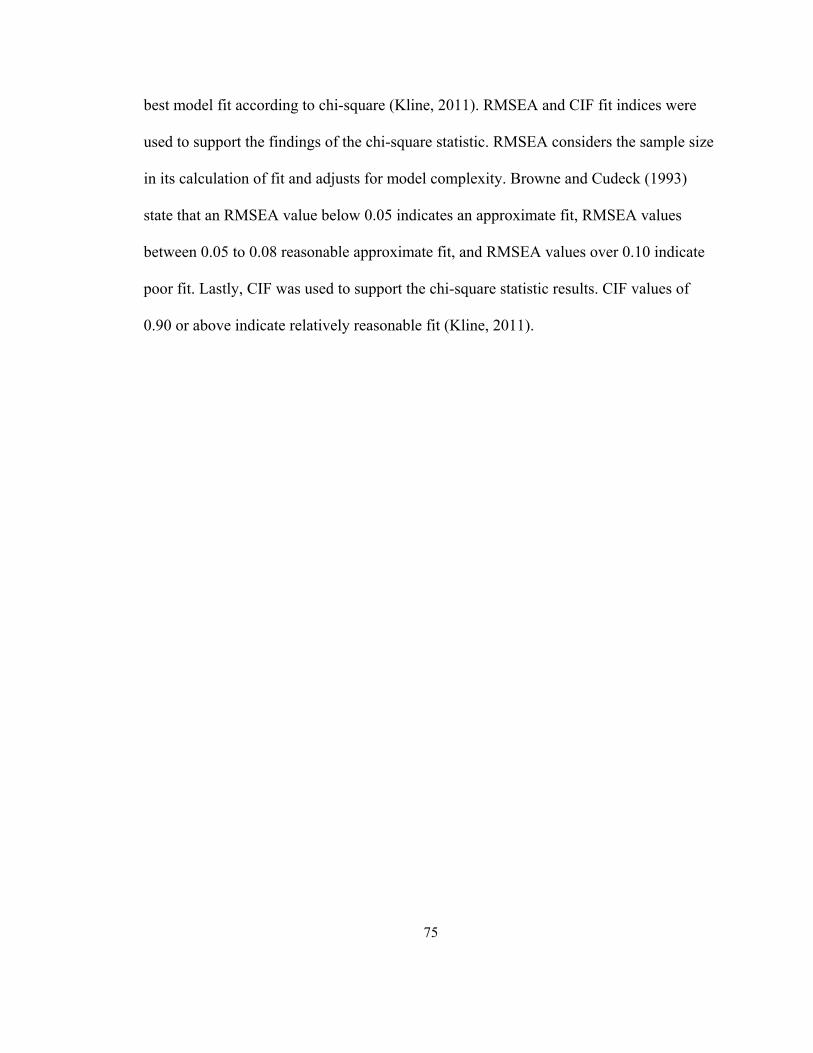
75
best model fit according to chi-square (Kline, 2011). RMSEA and CIF fit indices were
used to support the findings of the chi-square statistic. RMSEA considers the sample size
in its calculation of fit and adjusts for model complexity. Browne and Cudeck (1993)
state that an RMSEA value below 0.05 indicates an approximate fit, RMSEA values
between 0.05 to 0.08 reasonable approximate fit, and RMSEA values over 0.10 indicate
poor fit. Lastly, CIF was used to support the chi-square statistic results. CIF values of
0.90 or above indicate relatively reasonable fit (Kline, 2011).
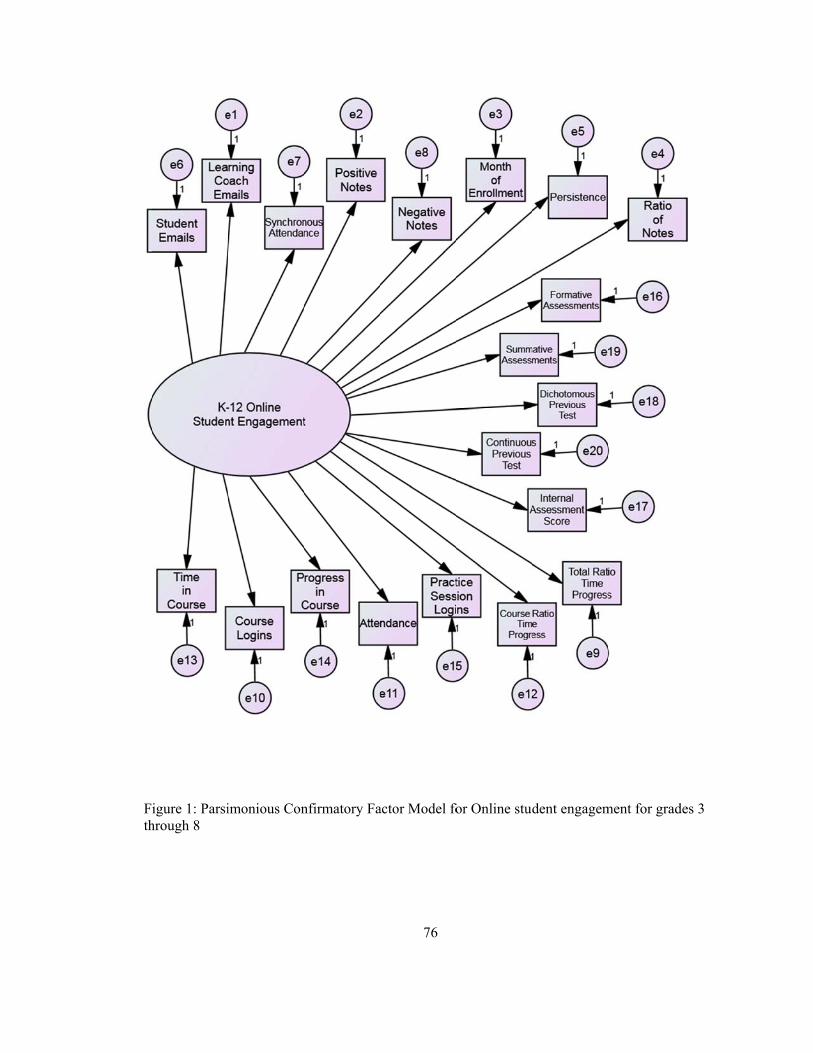
Fth
igure 1: Parsihrough 8
imonious Connfirmatory Fa
76
actor Model fofor Online studdent engagemment for grade
es 3
F3
igure 2: Threthrough 8
e Sub-Scale CConfirmatory
77
y Factor Modeel for Online student engag
gement for grrades
78
Hypothesis 2: The online student engagement measure for grades 3 through 8 is
invariant across student special education status and grade level.
Invariance was tested for students receiving special education services vs. general
education students and for different grade levels using the criteria described above.
Hypothesis 3: The online student engagement measure for grades 3 through 8
displays statistically significant positive correlations with academic
achievement for any subscales that comprise the measure.
Support for validity of the measure was evaluated by correlation of the logit
person position from each random sample with math and reading normalized scores.
Procedure
While item variables were collected from the learning management system that
houses the online courses for all participants/students, outcome variables came from a
separate database that houses state test scores for the online charter schools included in
this study.
Permission for data use followed strict FERPA guidelines and was obtained both
from the online supplier’s legal department and executive board. Once permission for
data was approved, authorization for this research study and use of secondary data was
obtained from the University of Denver Institutional Review Board.

79
Data collection and processing
The selected items were collected from the learning management system and
processed for use in the development of the measure. The data collection and processing
were done in three steps.
1. Extract data from learning management system (LMS)
2. Aggregate data into continuous online student behavior variables
3. Turn continuous variables into categorical variables for use in polytomous
IRT models
The data were collected from the learning management system (LMS) owned and
operated by the online supplier of the online charter schools included in this research
study. Since all the item data were collected from the same source and participants
utilized the same curriculum it was assumed that small differences in school, teacher, etc.
would be negligible.
The data collected from the LMS were all continuous data. In addition, selected
variables were chosen as representatives of variables that are commonly used either
solely as student engagement measures or have been part of survey based student
engagement measures.
All items to be included in the measure of online student engagement for grades 3
through 8 were aggregated from the LMS. The LMS houses all the online courses as well
as the landing page where general course descriptive statistics can be viewed by the
80
student, teacher, and/or parent/learning coach. The learning management system archives
student data on a per student per course login basis. For example, if a student logs into
their math class five times in one day and spends 15 minute per login on their math
course, then they will have five rows of data for that particular day and math class in the
LMS. When data were initially pulled from the LMS they must be aggregated into a
usable form, so each student has one row for math and one row for English/language arts
that aggregate the total of each data point across all days and logins. These aggregates
were the total of each variable for all days and logins from the start of school-year to
when the student took their state test. Once the items were extracted from the learning
management system and appropriately aggregated, they were considered to be the
continuous online student behavior variables used in the measure development.
81
Chapter 3: Results
The purpose of this research study was to develop a measure of online student
engagement for grades 3 through 8 using tracked online student behaviors as items.
Similar to the definition established by Chen, Gonyea, and Kuh (2008), student
engagement was defined as the quality of effort students themselves devote to
educationally purposeful activities that contribute directly to desired outcomes, and
encompassed the three components of student engagement: cognitive engagement,
behavioral engagement, and affective engagement.
Data were collected, aggregated, and screened. Relationships between the
individual items and academic achievement outcomes (math and reading) were then
assessed to identify and account for non-linear relationships, multicollinearity, nesting
effects, and clustering. The items remaining after the data screening processes were then
identified as either strong or weak indicators of academic achievement preceding
measure development, including item categorization. The measure development process
began with item categorization. It was found that online student engagement was best
measured by individual grade and contained two subscales of cognitive engagement and
behavioral engagement for each grade. Using a partial credit Rasch model, six measures
of online student engagement were developed, with two subscales at each grade level.
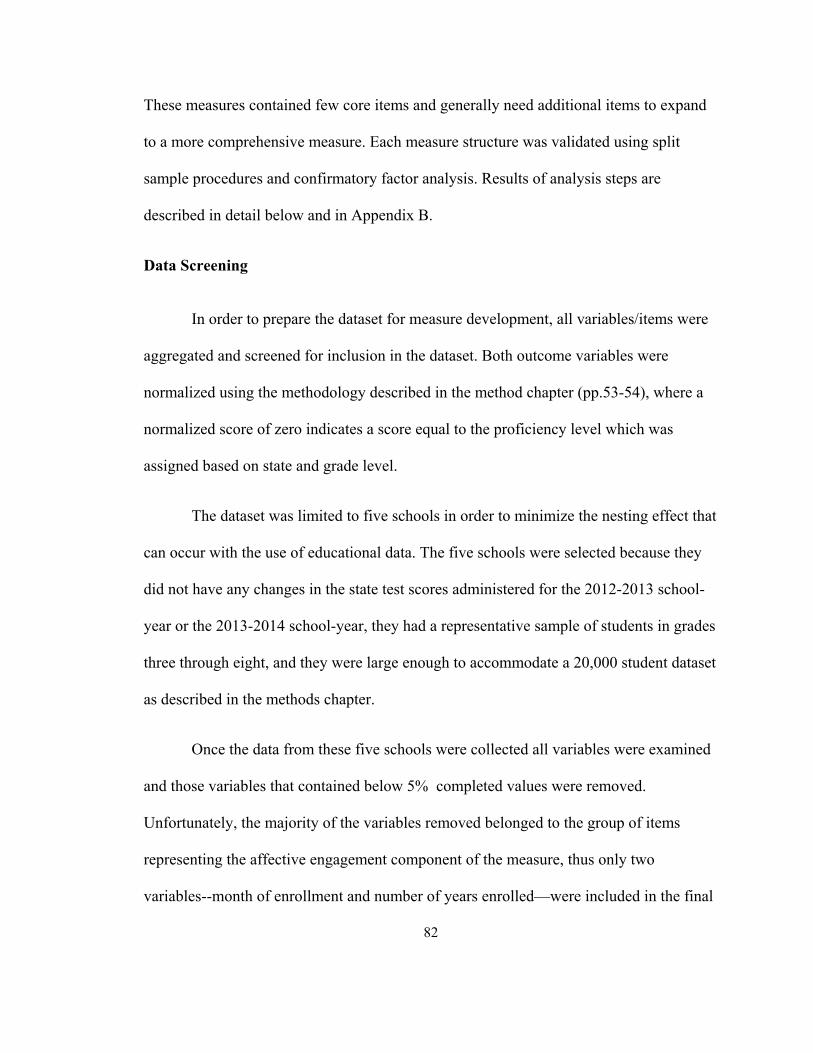
82
These measures contained few core items and generally need additional items to expand
to a more comprehensive measure. Each measure structure was validated using split
sample procedures and confirmatory factor analysis. Results of analysis steps are
described in detail below and in Appendix B.
Data Screening
In order to prepare the dataset for measure development, all variables/items were
aggregated and screened for inclusion in the dataset. Both outcome variables were
normalized using the methodology described in the method chapter (pp.53-54), where a
normalized score of zero indicates a score equal to the proficiency level which was
assigned based on state and grade level.
The dataset was limited to five schools in order to minimize the nesting effect that
can occur with the use of educational data. The five schools were selected because they
did not have any changes in the state test scores administered for the 2012-2013 school-
year or the 2013-2014 school-year, they had a representative sample of students in grades
three through eight, and they were large enough to accommodate a 20,000 student dataset
as described in the methods chapter.
Once the data from these five schools were collected all variables were examined
and those variables that contained below 5% completed values were removed.
Unfortunately, the majority of the variables removed belonged to the group of items
representing the affective engagement component of the measure, thus only two
variables--month of enrollment and number of years enrolled—were included in the final
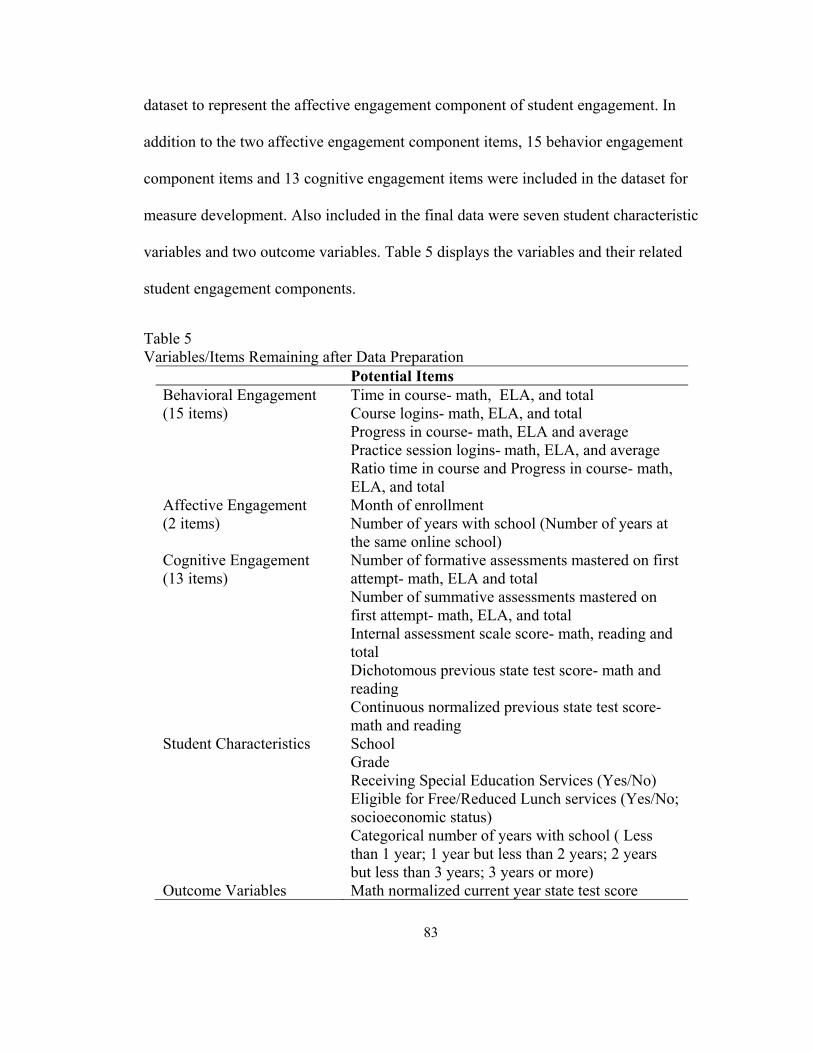
83
dataset to represent the affective engagement component of student engagement. In
addition to the two affective engagement component items, 15 behavior engagement
component items and 13 cognitive engagement items were included in the dataset for
measure development. Also included in the final data were seven student characteristic
variables and two outcome variables. Table 5 displays the variables and their related
student engagement components.
Table 5 Variables/Items Remaining after Data Preparation
Potential Items Behavioral Engagement (15 items)
Time in course- math, ELA, and total Course logins- math, ELA, and total Progress in course- math, ELA and average Practice session logins- math, ELA, and average Ratio time in course and Progress in course- math, ELA, and total
Affective Engagement (2 items)
Month of enrollment Number of years with school (Number of years at the same online school)
Cognitive Engagement (13 items)
Number of formative assessments mastered on first attempt- math, ELA and total Number of summative assessments mastered on first attempt- math, ELA, and total Internal assessment scale score- math, reading and total Dichotomous previous state test score- math and reading Continuous normalized previous state test score- math and reading
Student Characteristics School Grade Receiving Special Education Services (Yes/No) Eligible for Free/Reduced Lunch services (Yes/No; socioeconomic status) Categorical number of years with school ( Less than 1 year; 1 year but less than 2 years; 2 years but less than 3 years; 3 years or more)
Outcome Variables Math normalized current year state test score
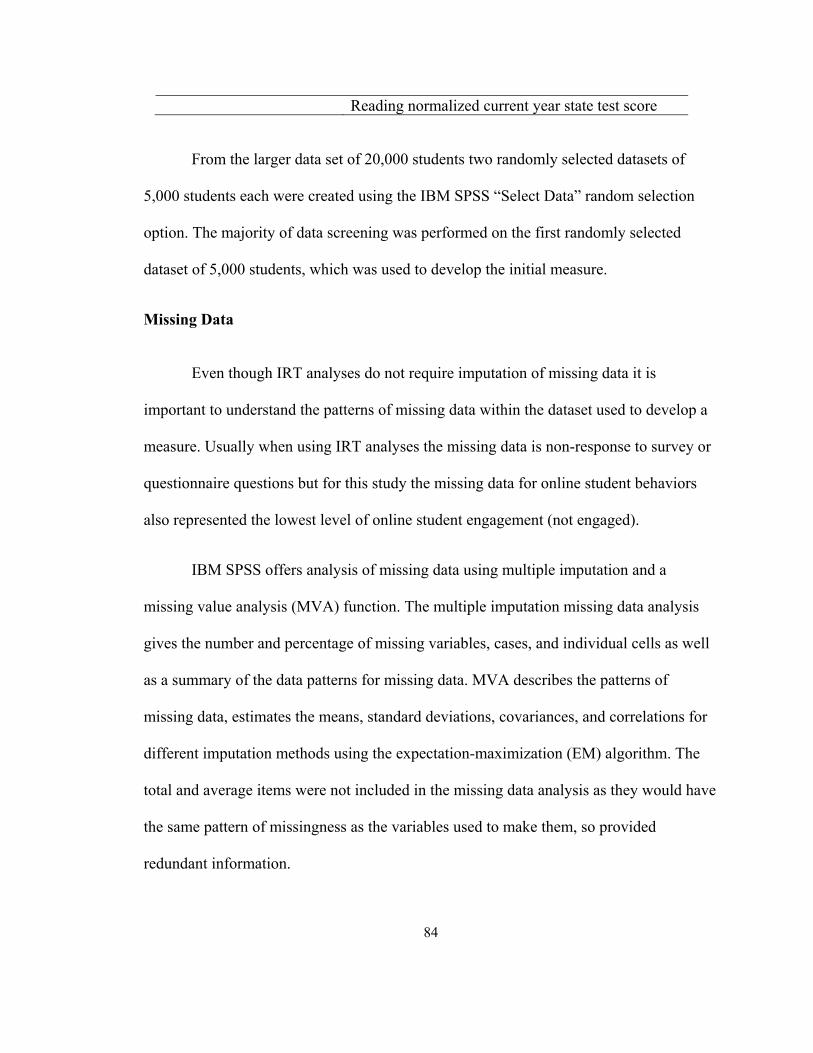
84
Reading normalized current year state test score
From the larger data set of 20,000 students two randomly selected datasets of
5,000 students each were created using the IBM SPSS “Select Data” random selection
option. The majority of data screening was performed on the first randomly selected
dataset of 5,000 students, which was used to develop the initial measure.
Missing Data
Even though IRT analyses do not require imputation of missing data it is
important to understand the patterns of missing data within the dataset used to develop a
measure. Usually when using IRT analyses the missing data is non-response to survey or
questionnaire questions but for this study the missing data for online student behaviors
also represented the lowest level of online student engagement (not engaged).
IBM SPSS offers analysis of missing data using multiple imputation and a
missing value analysis (MVA) function. The multiple imputation missing data analysis
gives the number and percentage of missing variables, cases, and individual cells as well
as a summary of the data patterns for missing data. MVA describes the patterns of
missing data, estimates the means, standard deviations, covariances, and correlations for
different imputation methods using the expectation-maximization (EM) algorithm. The
total and average items were not included in the missing data analysis as they would have
the same pattern of missingness as the variables used to make them, so provided
redundant information.

85
According to the multiple imputation missing data analysis 18 of 21 (not
including Total and Average variables) or 85.71% of the variables had at least one
missing value; 4,412 of 5,000 or 88.24% of cases had at least one missing value, and
there were 27,519 of 105,000 or 26.21% of all values missing in the dataset (Figure 3).
Of the 18 variables that had at least one missing value, 13 had at least 10% of their values
missing and six of the 13 variables had over 50% missing values (Table 6). The six
variables that had over 50% missing values were: ELA ratio of time in hours and
progress, ELA percent complete, math ratio of time in hours and progress, math percent
complete, 2012-2013SY math normalized score, and 2012-2013SY reading normalized
score. In addition, there were three variables-math percent complete, ELA percent
complete, and ELA ratio of time in hour and progress—that displayed patterns of
monotonicity, meaning data on these variables could be missing not at random (Figure 4).
Evaluating the missing data patterns also revealed that six patterns were more
prevalent than others in the missing data (Figure 5). Figure 5 displays the missingness
patterns, where a larger pattern number indicates more variables combined to make the
pattern, by percent of cases missing. Four of the six widespread patterns of missing data
included multiple variables missing at one time. This means that students who were
missing one online student behavior were most likely missing multiple online student
behaviors and would therefore be considered less engaged.
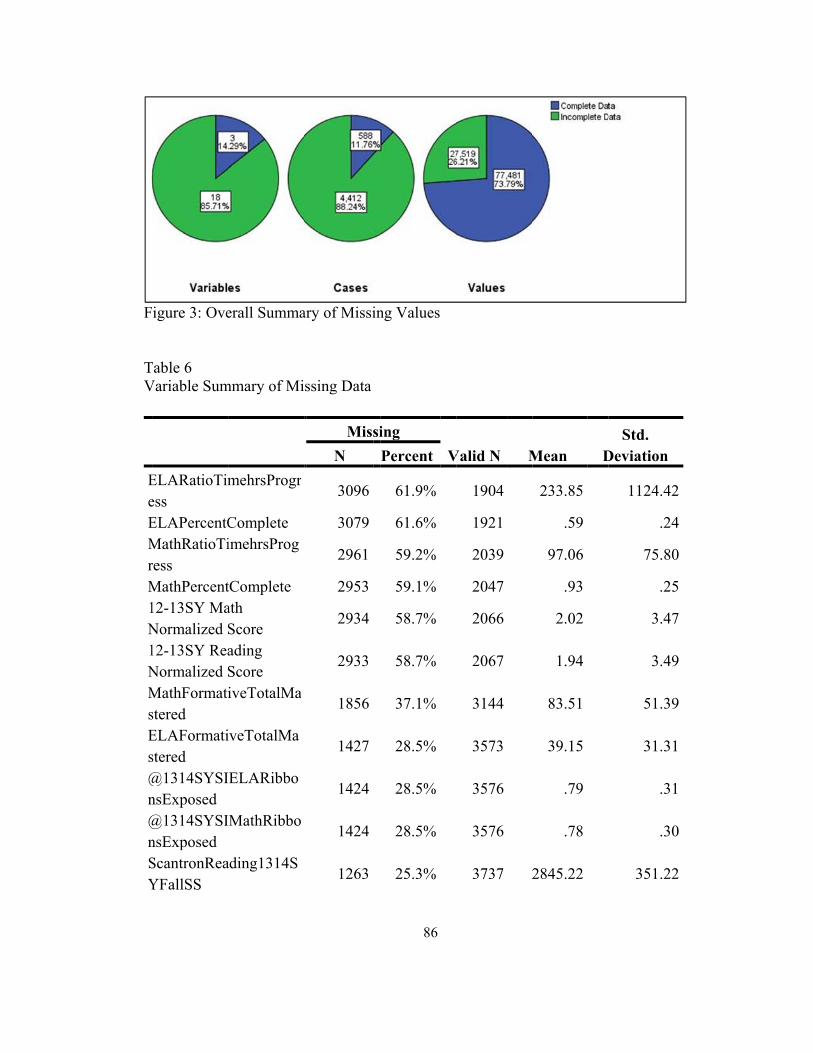
F TV
EeEMrM1N1NMsEs@n@nSY
igure 3: Ove
Table 6 Variable Sum
ELARatioTimess ELAPercentCMathRatioTiress MathPercent12-13SY MaNormalized S12-13SY ReaNormalized SMathFormatistered ELAFormatistered @1314SYSInsExposed @1314SYSInsExposed ScantronReaYFallSS
erall Summa
mmary of Mi
mehrsProgr
Complete imehrsProg
tComplete ath Score ading Score iveTotalMa
iveTotalMa
IELARibbo
IMathRibbo
ading1314S
ary of Missin
ssing Data
Missi
N
3096
3079
2961
2953
2934
2933
1856
1427
1424
1424
1263
86
ng Values
ing
VPercent
61.9%
61.6%
59.2%
59.1%
58.7%
58.7%
37.1%
28.5%
28.5%
28.5%
25.3%
Valid N M
1904
1921
2039
2047
2066
2067
3144
3573
3576
3576
3737 2
Mean D
233.85
.59
97.06
.93
2.02
1.94
83.51
39.15
.79
.78
2845.22
Std. Deviation
1124.42
.24
75.80
.25
3.47
3.49
51.39
31.31
.31
.30
351.22
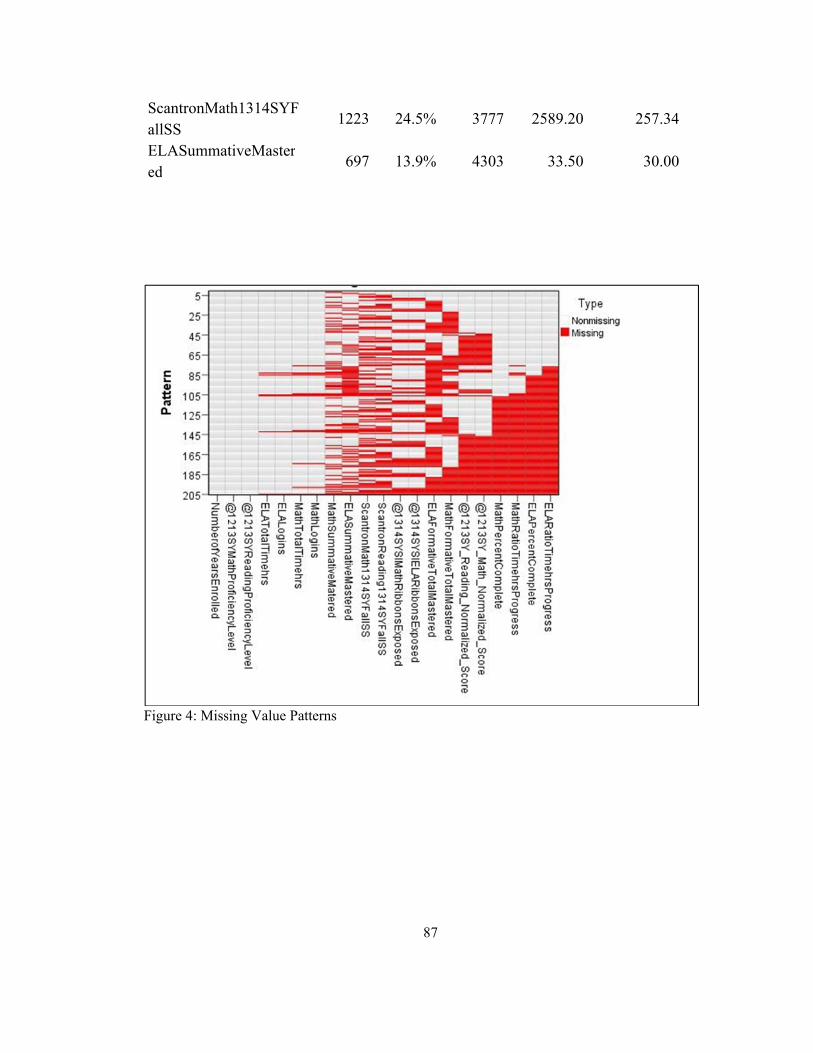
SaEe
F
ScantronMatallSS ELASummated
igure 4: Miss
th1314SYF
tiveMaster
sing Value Pa
1223
697
atterns
87
24.5%
13.9%
3777 2
4303
2589.20
33.50
257.34
30.00
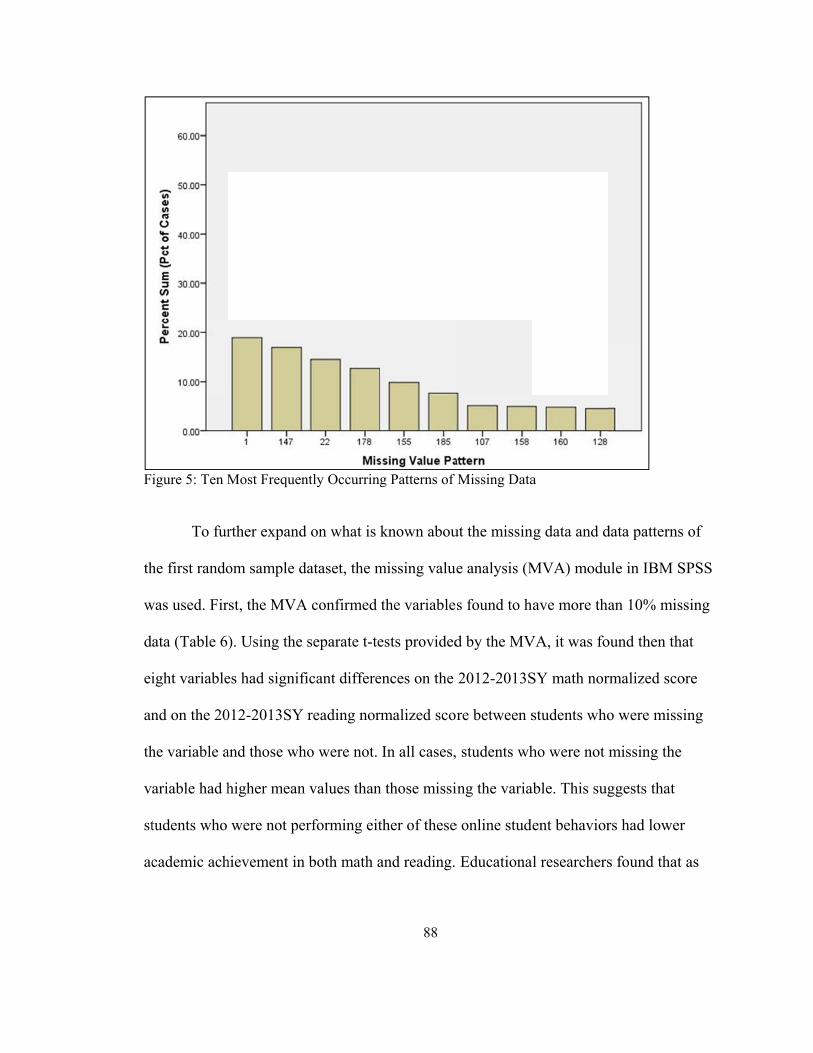
F
th
w
d
ei
an
th
v
st
ac
igure 5: Ten M
To fur
he first rando
was used. Fir
ata (Table 6
ight variable
nd on the 20
he variable a
ariable had h
tudents who
cademic ach
Most Frequen
rther expand
om sample d
rst, the MVA
). Using the
es had signif
012-2013SY
and those wh
higher mean
were not pe
hievement in
ntly Occurring
d on what is
dataset, the m
A confirmed
separate t-te
ficant differe
reading nor
ho were not.
n values than
erforming eit
n both math a
88
g Patterns of
known abou
missing value
the variable
ests provided
ences on the
rmalized sco
In all cases,
n those missi
ther of these
and reading.
Missing Data
ut the missin
e analysis (M
s found to h
d by the MV
2012-2013S
re between s
students wh
ing the varia
e online stude
Educationa
a
ng data and d
MVA) modu
ave more tha
VA, it was fo
SY math nor
students who
ho were not
able. This sug
ent behavior
l researchers
data patterns
ule in IBM S
an 10% miss
ound then tha
rmalized sco
o were missi
missing the
ggests that
rs had lower
s found that
of
SPSS
sing
at
ore
ing
r
as
89
student engagement increases academic achievement as measured by student grades and
state assessment scores also increases (Lam, 2014; Pierson, 1992; Skinner,1993). Since
previous research has established a positive correlation between student engagement
levels and academic achievement, we infer that these students also have lower student
engagement levels and we should see this difference in the person logit scores from the
developed measure.
Lastly, MVA provides a table of tabulated patterns in missing data to evaluate how
missing data in each variable relates to other variables. The most frequently observed
patterns were:
1. If math practice is missing then reading practice is missing
2. If math internal assessment is missing then reading internal assessment is missing
3. If 2012-2013SY reading normalized score is missing then 2012-2013SY math
normalized score is missing
4. If ELA percent complete is missing then ELA ratio of time and progress is
missing
5. If math percent complete is missing then math ratio of time and progress is
missing
6. If ELA summative assessments mastered is missing then ELA formative
assessments mastered is missing
All of these missing patterns has a reasonable explanation through understanding how
the variables relate to each other. Understanding the patterns of missing data and
90
potential sources of missing data helps to explain why some students have lower levels
of online student engagement. For measure devlopement, with the partial credit Rasch
model, no adjustment was made for missing data, setting students who are missing all
student behaviors as the lowest levels of online student engagement.
Multicollinearity
Multicollinearity exists when independent variables or items in a measure are so
strongly related to each other that they skew the results of analysis, and thus also those of
measure development.. Correlation coefficients over 0.9 would identify a multicollinear
pair of variables/items.
All variables/items were checked for multicollinearity starting with the first
random sample of cases to be used for measurement development. All the total and
average variables were removed because of their strong correlations with other variables.
In addition, it was found that the 2012-2013SY math normalized score and the 2012-
2013SY reading normalized score had a statistically significant correlation coefficient of
0.96, yet instead of removing either of these variables they were combined into a 2012-
2013SY normalized score. Once the 2012-2013SY normalized score was generated and
total/average variables were removed, there were no statistically significant correlations
with coefficients over 0.9. As such it was assumed that variables were related enough to
measure a latent factor of student engagement but not related so highly as to skew the
results with multicollinearity.

91
Later in the measure development process it was found that the dataset needed to
be separated by grade segments (grades 3 to 5 and grades 6 to 8), so multicollinearity was
checked again, this time including the total/average variables in order to identify other
variables that could be included in the measure core.
For grades 3 to 5, math ratio of time and progress, 2012-2013SY normalized
reading score, total time, ELA logins, ELA percent complete, average practice, ratio of
total time and average progress complete, total formative assessments mastered, total
summative assessments mastered, total practice, and 2012-2013SY normalized score
were removed to avoid multicollinearity. Once these variables/items were removed there
were no statistically significant correlations over 0.9. For grades 6 to 8, 2012-2013SY
normalized score interaction, total summative assessments mastered, ratio of total time
and average progress, math practice, ELA practice, average percent complete, total
logins, total time, and total formative assessments mastered were removed from the
dataset to avoid multicollinearity.
Once the listed variables were removed due to multicollinearity they were not
present for any of the analyses or measure development procedure.
Clustering
Clustering was evaluated to ensure there was no clustering among students’
patterns of online student behaviors, meaning that particular student behavior patterns
would not cause identification of latent factors other than those that are to be measured. A
principal components analysis (PCA) for the first random sample that included all of the
92
grades together, resulted in a scree plot that showed potentially 4 or 5 factors. A parallel
analysis compared with the non-rotated eigenvalues found that there were six factors
identified among the items. When the six factors were analyzed it was seen that nearly
every item crossloaded onto multiple factors. When the same items were then forced into
a three-factor model, as theorized previously for student engagement, it was found that
most of the items selected for behavioral engagement loaded on the first factor and most
of the items identified for cognitive engagement loaded on the third factor while the
affective engagement items loaded on the second factor, with items crossloading on the
other two factors. It was decided that measure development and item categorization
would continue as planned, in hopes that multiple subscales containing measure cores
would be identified.
When the dataset needed to be split into grade segments (grades 3 to 5 and grades
6 to 8), the clustering effects amongst items were re-analyzed. For both grades 3 to 5 and
grades 6 to 8 samples, a varimax rotation was used.
For grades 3 to 5 the scree plot showed that there were potentially three or four
factors, yet comparing eigenvalues to a parallel analysis found that there were up to six
factors. The loading patterns were then examined for the six-factor model, a four-factor
model and a three-factor model.
Once the 2012-2013SY normalized state test score variables were removed, it was
apparent that there were potentially two factors containing items for cognitive
engagement and behavioral engagement. The item number of years enrolled did not fit

93
into either one of these factors, but crossloaded across both so it was retained with the
understanding that it could potentially be removed if it did not fit well with either
subscale. The items identified with the cognitive engagement component were math
percent complete, math practice, ELA practice, math formative assessments mastered,
ELA formative assessments mastered, math summative assessments mastered, ELA
summative assessments mastered, math internal assessment score, reading internal
assessment score, and average percent complete. The items identified with the behavioral
engagement component were math total time, ELA total time, math login, ELA ratio
between total time and progress, and total logins.
A PCA with a varimax rotation was used to analyze the sample of grades 6 to 8.
The scree plot originally showed that there were three or four factors identified. The use
of a parallel analysis showed that there were up to five factors identified among items.
The items were analyzed in a five-factor model, a four-factor model, and a three-factor
model. Based on these results, both of the affective engagement items—month of
enrollment and number of years enrolled—were removed from the sample. In addition, it
was found that the items associated with the 2012-2013SY state test scores loaded
together on a separate factor for all models examined, these items were excluded as
measuring academic achievement more than student engagement. This resulted in a
cognitive engagement factor and a behavioral engagement factor. Similar to grades 3 to
5, it was found that the percent complete items loaded with the cognitive engagement
component as grade to date instead of on the behavioral component as progress in course.
The final items included in the cognitive engagement factor were math percent complete,

94
ELA percent complete, math formative assessments mastered, ELA formative
assessments mastered, math summative assessments mastered, ELA summative
assessments mastered, math internal assessment score, reading internal assessment score,
and average practice. The final items included in the behavioral engagement factor were
Math total time, ELA total time, Math logins, ELA logins, and math ratio between total
time and progress.
Nesting Effects
Educational data are actually nested with students within classrooms and
classrooms within schools, yet it was important to make sure that the nesting effect was
not accounting for a large portion of the variance in the items. Students were unable to be
assigned to individual teachers, because most students had a homeroom teacher, a math
teacher, and an English language arts teacher. So the school nesting effect was assessed.
The intraclass correlation (ICC) was calculated for both the math normalized current state
test scores, and the reading normalized current state test scores. The ICC is a calculation
of the amount of variance between groups for an outcome, and represents the variance
explained by the nesting effect. The equation for the ICC was given above (p. 58).
Both of the randomly selected data sets of 5000 students each were assessed for
nesting effects by school. Hierarchical linear modeling was used where each outcome
was a level one outcome with no level I or level II predictors. This would be considered
the null model. The following are the model equations (Equations 8 and 9) used to
evaluate the amount of variance explained by the nesting effect between schools:
95
@1314SYMij = γ00 + u0j+ rij (8)
@1314SYRij = γ00 + u0j+ rij (9)
Nesting effects were evaluated by school, starting with the first random sample.
For the first random sample 4.1% of the variance was explained by nesting for the math
outcome and 5.6% of the variance was explained by nesting for the reading outcome.
When it was discovered that there was not invariance for the developing measure
across elementary (grades 3 to 5) and middle school (grades 6 to 8) grade levels, the
sample was split into grade segments and the nesting effect was re-evaluated to see
whether it had a greater influence on particular grade segments. For grades 3 to 5, 5.8%
of the variance in the math score was due to nesting and 6.9% of the variance in reading
was due to nesting. For grades 6 to 8, 3.7% of the variance in the math score was due to
nesting and 3.0% of the variance in the reading score was due to nesting. The differences
in the grade segments could be due to varying requirements or changes in curriculum.
For math in grades 3, 4, 5, and 8, less than 10% of the variance was explained by
nesting of schools, while grade 6 had 10.4% of the variance in math explained by the
nesting of schools and grade 7 had 16.3% of the variance in math score, which is
explained by the nesting of schools. Grade 7 had 12.1% of the variance in reading score
explained by nesting schools while grade 3 had 97.6% of the variance in reading score
explained by the nesting effect of schools. For grade 3 reading a .976 ICC means that
nearly all (97.6%) of the variance in reading normalized state test score can be explained
by which school a student attended. Grade 3 is the first year students are required to take
state testing, which requires a lot of reading. It is also the first year where students are
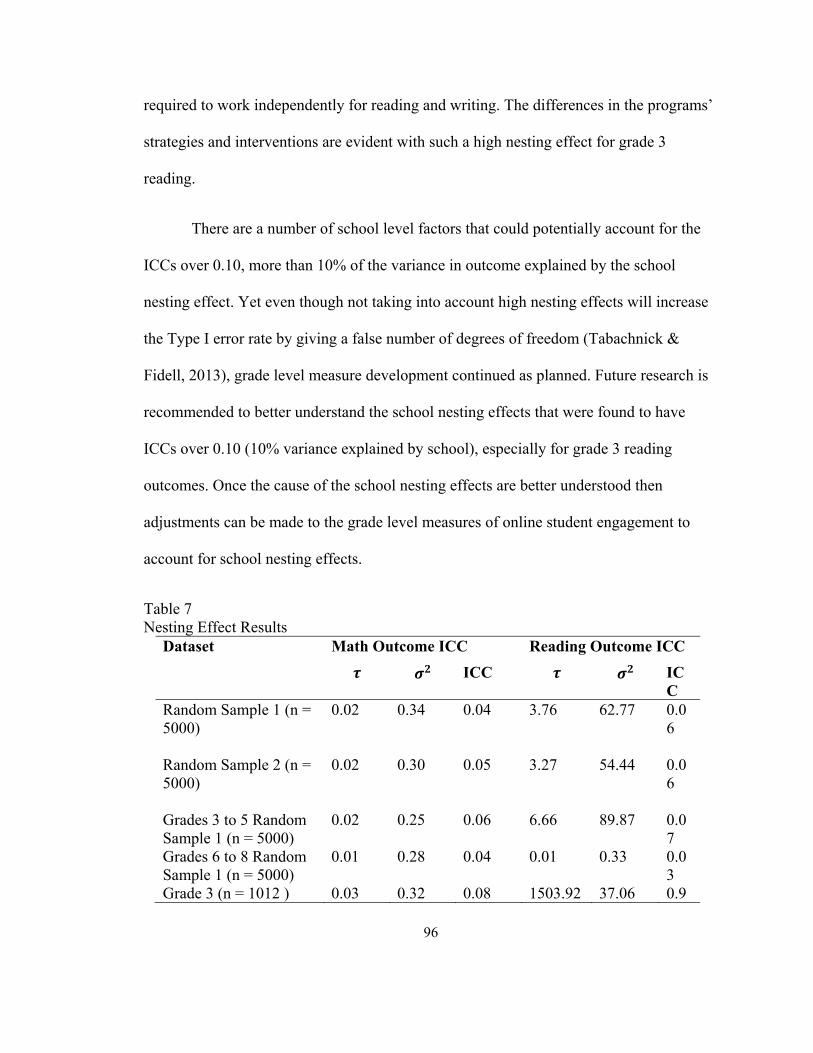
96
required to work independently for reading and writing. The differences in the programs’
strategies and interventions are evident with such a high nesting effect for grade 3
reading.
There are a number of school level factors that could potentially account for the
ICCs over 0.10, more than 10% of the variance in outcome explained by the school
nesting effect. Yet even though not taking into account high nesting effects will increase
the Type I error rate by giving a false number of degrees of freedom (Tabachnick &
Fidell, 2013), grade level measure development continued as planned. Future research is
recommended to better understand the school nesting effects that were found to have
ICCs over 0.10 (10% variance explained by school), especially for grade 3 reading
outcomes. Once the cause of the school nesting effects are better understood then
adjustments can be made to the grade level measures of online student engagement to
account for school nesting effects.
Table 7 Nesting Effect Results
Dataset Math Outcome ICC Reading Outcome ICC
ICC ICC
Random Sample 1 (n = 5000)
0.02 0.34 0.04 3.76 62.77 0.06
Random Sample 2 (n = 5000)
0.02 0.30 0.05 3.27 54.44 0.06
Grades 3 to 5 Random Sample 1 (n = 5000)
0.02 0.25 0.06 6.66 89.87 0.07
Grades 6 to 8 Random Sample 1 (n = 5000)
0.01 0.28 0.04 0.01 0.33 0.03
Grade 3 (n = 1012 ) 0.03 0.32 0.08 1503.92 37.06 0.9
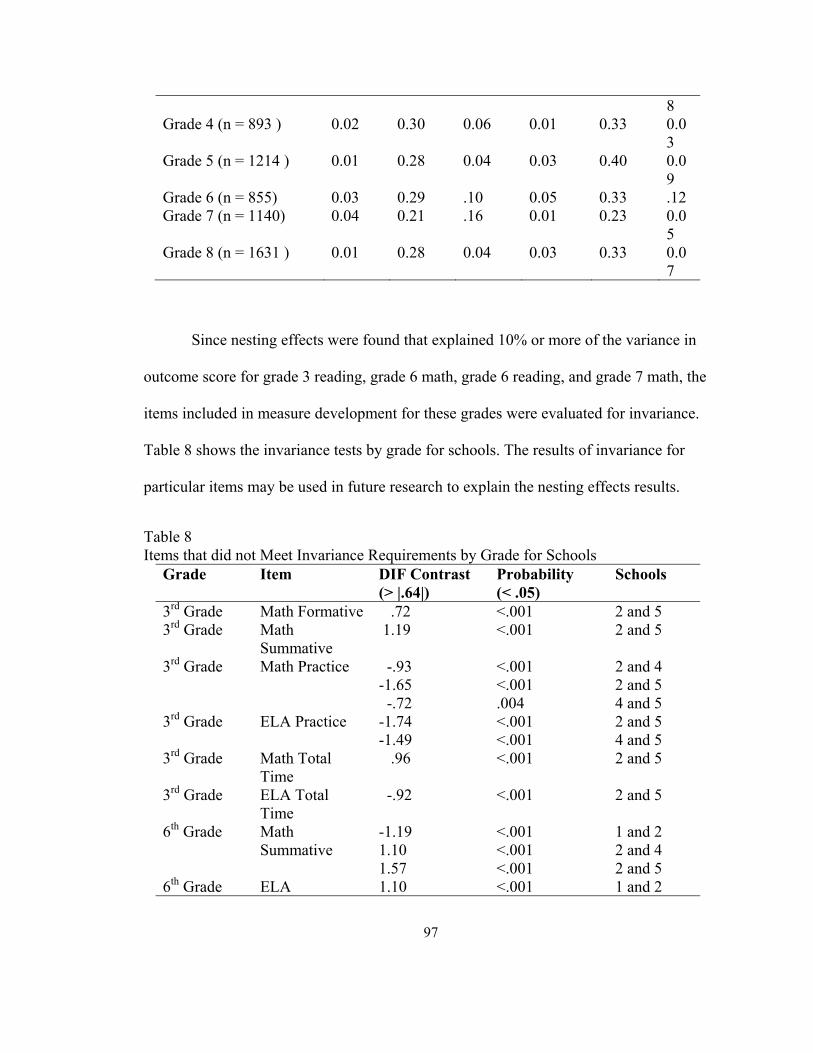
97
8 Grade 4 (n = 893 ) 0.02 0.30 0.06 0.01 0.33 0.0
3 Grade 5 (n = 1214 ) 0.01 0.28 0.04 0.03 0.40 0.0
9 Grade 6 (n = 855) 0.03 0.29 .10 0.05 0.33 .12 Grade 7 (n = 1140) 0.04 0.21 .16 0.01 0.23 0.0
5 Grade 8 (n = 1631 ) 0.01 0.28 0.04 0.03 0.33 0.0
7
Since nesting effects were found that explained 10% or more of the variance in
outcome score for grade 3 reading, grade 6 math, grade 6 reading, and grade 7 math, the
items included in measure development for these grades were evaluated for invariance.
Table 8 shows the invariance tests by grade for schools. The results of invariance for
particular items may be used in future research to explain the nesting effects results.
Table 8 Items that did not Meet Invariance Requirements by Grade for Schools
Grade Item DIF Contrast (> |.64|)
Probability (< .05)
Schools
3rd Grade Math Formative .72 <.001 2 and 5 3rd Grade Math
Summative 1.19 <.001 2 and 5
3rd Grade Math Practice -.93 <.001 2 and 4 -1.65 <.001 2 and 5 -.72 .004 4 and 5
3rd Grade ELA Practice -1.74 <.001 2 and 5 -1.49 <.001 4 and 5
3rd Grade Math Total Time
.96 <.001 2 and 5
3rd Grade ELA Total Time
-.92 <.001 2 and 5
6th Grade Math Summative
-1.19 <.001 1 and 2 1.10 <.001 2 and 4 1.57 <.001 2 and 5
6th Grade ELA 1.10 <.001 1 and 2
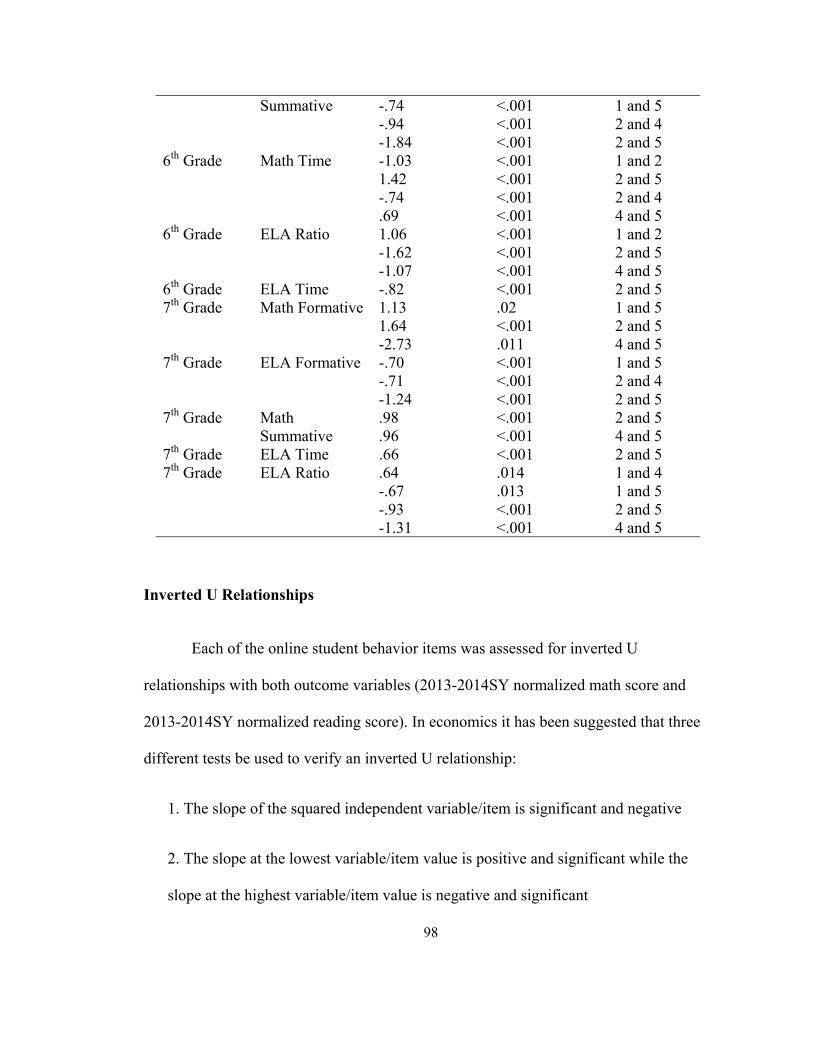
98
Summative -.74 <.001 1 and 5 -.94 <.001 2 and 4 -1.84 <.001 2 and 5
6th Grade Math Time -1.03 <.001 1 and 2 1.42 <.001 2 and 5 -.74 <.001 2 and 4 .69 <.001 4 and 5
6th Grade ELA Ratio 1.06 <.001 1 and 2 -1.62 <.001 2 and 5 -1.07 <.001 4 and 5
6th Grade ELA Time -.82 <.001 2 and 5 7th Grade Math Formative 1.13 .02 1 and 5
1.64 <.001 2 and 5 -2.73 .011 4 and 5
7th Grade ELA Formative -.70 <.001 1 and 5 -.71 <.001 2 and 4 -1.24 <.001 2 and 5
7th Grade Math Summative
.98 <.001 2 and 5
.96 <.001 4 and 5 7th Grade ELA Time .66 <.001 2 and 5 7th Grade ELA Ratio .64 .014 1 and 4
-.67 .013 1 and 5 -.93 <.001 2 and 5 -1.31 <.001 4 and 5
Inverted U Relationships
Each of the online student behavior items was assessed for inverted U
relationships with both outcome variables (2013-2014SY normalized math score and
2013-2014SY normalized reading score). In economics it has been suggested that three
different tests be used to verify an inverted U relationship:
1. The slope of the squared independent variable/item is significant and negative
2. The slope at the lowest variable/item value is positive and significant while the
slope at the highest variable/item value is negative and significant
99
3. The turning point (first derivative of the regression equation) and its calculated
95% confidence interval are well within the data range of the variable/item
When these three criteria were used to evaluate the types of relationships between items
and outcome variables it was found that there were no inverted U relationships between
any of the items and the outcome variables for the first random sample, so all of these
relationships were assumed to be linear for measurement development.
Inverted U relationships were evaluated again when the random sample was split
by grade segments (grades 3 to 5 and grades 6 to 8). Again, there were no items for either
of the grade segment samples that met all three of the criteria for an inverted U
relationship, yet several items met two of the three criteria, as seen in Tables 9 and 10.
This resulted in speculation that nonlinear quadratic relationships do exist amongst these
items and outcomes. Inverted U relationships were also explored for each individual
grade level. No inverted U relationships were found for any of the items at any of the
grade levels, yet several items met two of the three requirements for inverted U
relationships. Future research should include the examination of the types of relationships
and relationship patterns that exist amongst online student behaviors and state test score
outcomes.
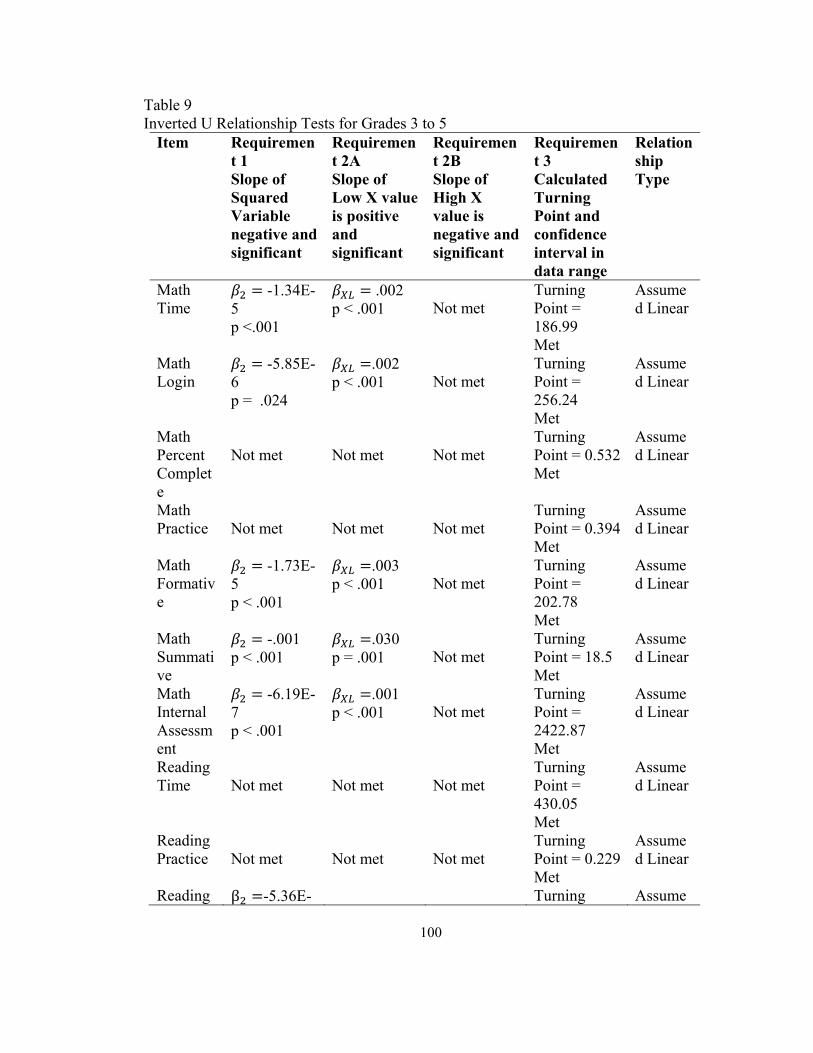
100
Table 9 Inverted U Relationship Tests for Grades 3 to 5
Item Requirement 1 Slope of Squared Variable negative and significant
Requirement 2A Slope of Low X value is positive and significant
Requirement 2B Slope of High X value is negative and significant
Requirement 3 Calculated Turning Point and confidence interval in data range
Relationship Type
Math Time
-1.34E-5 p <.001
.002 p < .001
Not met
Turning Point = 186.99 Met
Assumed Linear
Math Login
-5.85E-6 p = .024
.002 p < .001
Not met
Turning Point = 256.24 Met
Assumed Linear
Math Percent Complete
Not met
Not met
Not met
Turning Point = 0.532 Met
Assumed Linear
Math Practice
Not met
Not met
Not met
Turning Point = 0.394 Met
Assumed Linear
Math Formative
-1.73E-5 p < .001
.003 p < .001
Not met
Turning Point = 202.78 Met
Assumed Linear
Math Summative
-.001 p < .001
.030 p = .001
Not met
Turning Point = 18.5 Met
Assumed Linear
Math Internal Assessment
-6.19E-7 p < .001
.001 p < .001
Not met
Turning Point = 2422.87 Met
Assumed Linear
Reading Time
Not met
Not met
Not met
Turning Point = 430.05 Met
Assumed Linear
Reading Practice
Not met
Not met
Not met
Turning Point = 0.229 Met
Assumed Linear
Reading β -5.36E- Turning Assume

101
Ratio 8 p = .040
Not met Not met Point = 0 Met
d Linear
Reading Formative
Not met
Not met
Not met
Not met
Assumed Linear
Reading Summative
Not met
Not met
Not met
Turning Point = 15.76 Met
Assumed Linear
ELA Internal Assessment
Not met
Not met
Not met
Turning Point = 5407.35 Met
Assumed Linear
Average % Complete
β -.665 p = .007
Not met
Not met
Turning Point = 0.70 Met
Assumed Linear
Table 10 Inverted U Relationship Tests for Grades 6 to 8
Item Requirement 1 Slope of Squared Variable negative and significant
Requirement 2A Slope of Low X value is positive and significant
Requirement 2B Slope of High X value is negative and significant
Requirement 3 Calculated Turning Point and confidence interval
Relationship Type
Math Time
β -7.42E-6 p < .001
β .002 p < .001
Not met
Turning Point = 202.16 Met
Assumed Linear
Math Login
Not met
Not met
Not met
Turning Point = 29.75 Met
Assumed Linear
Math Percent Complete
Not met
Not met
Not met
Turning Point = -1.15 Met
Assumed Linear
Math Ratio
β -2.63E-5 p < .001
β .001 p < .001
Not met
Turning Point = 380.23 Met
Assumed Linear
Math Formati
β -2.03E-5
Not met
Not met
Turning Point =
Assumed Linear
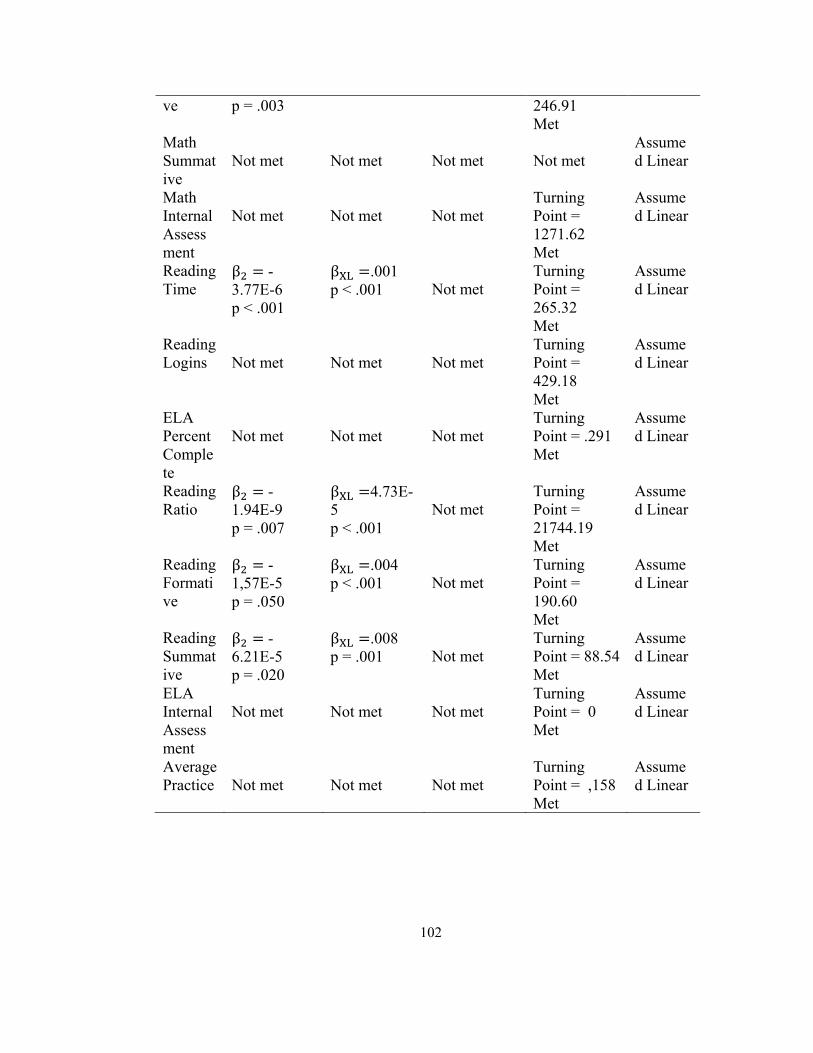
102
ve p = .003 246.91 Met
Math Summative
Not met
Not met
Not met
Not met
Assumed Linear
Math Internal Assessment
Not met
Not met
Not met
Turning Point = 1271.62 Met
Assumed Linear
Reading Time
β -3.77E-6 p < .001
β .001 p < .001
Not met
Turning Point = 265.32 Met
Assumed Linear
Reading Logins
Not met
Not met
Not met
Turning Point = 429.18 Met
Assumed Linear
ELA Percent Complete
Not met
Not met
Not met
Turning Point = .291 Met
Assumed Linear
Reading Ratio
β -1.94E-9 p = .007
β 4.73E-5 p < .001
Not met
Turning Point = 21744.19 Met
Assumed Linear
Reading Formative
β -1,57E-5 p = .050
β .004 p < .001
Not met
Turning Point = 190.60 Met
Assumed Linear
Reading Summative
β -6.21E-5 p = .020
β .008 p = .001
Not met
Turning Point = 88.54 Met
Assumed Linear
ELA Internal Assessment
Not met
Not met
Not met
Turning Point = 0 Met
Assumed Linear
Average Practice
Not met
Not met
Not met
Turning Point = ,158 Met
Assumed Linear
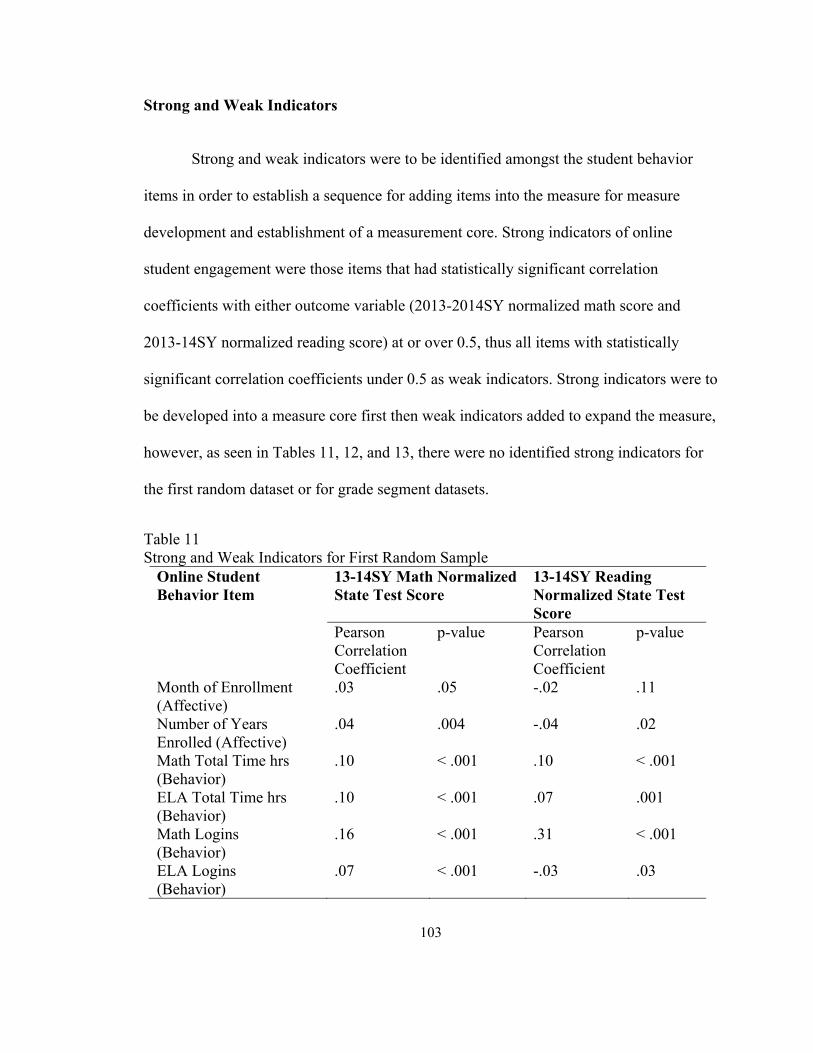
103
Strong and Weak Indicators
Strong and weak indicators were to be identified amongst the student behavior
items in order to establish a sequence for adding items into the measure for measure
development and establishment of a measurement core. Strong indicators of online
student engagement were those items that had statistically significant correlation
coefficients with either outcome variable (2013-2014SY normalized math score and
2013-14SY normalized reading score) at or over 0.5, thus all items with statistically
significant correlation coefficients under 0.5 as weak indicators. Strong indicators were to
be developed into a measure core first then weak indicators added to expand the measure,
however, as seen in Tables 11, 12, and 13, there were no identified strong indicators for
the first random dataset or for grade segment datasets.
Table 11 Strong and Weak Indicators for First Random Sample
Online Student Behavior Item
13-14SY Math Normalized State Test Score
13-14SY Reading Normalized State Test Score
Pearson Correlation Coefficient
p-value Pearson Correlation Coefficient
p-value
Month of Enrollment (Affective)
.03 .05 -.02 .11
Number of Years Enrolled (Affective)
.04 .004 -.04 .02
Math Total Time hrs (Behavior)
.10 < .001 .10 < .001
ELA Total Time hrs (Behavior)
.10 < .001 .07 .001
Math Logins (Behavior)
.16 < .001 .31 < .001
ELA Logins (Behavior)
.07 < .001 -.03 .03
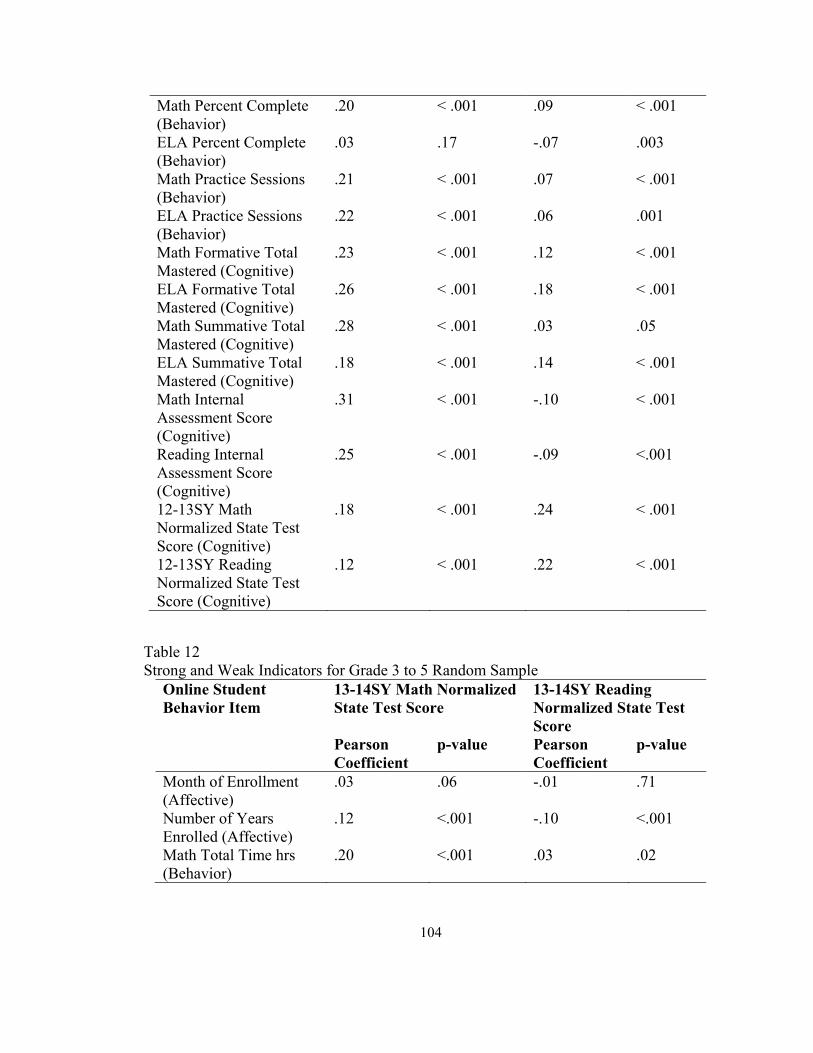
104
Math Percent Complete (Behavior)
.20 < .001 .09 < .001
ELA Percent Complete (Behavior)
.03 .17 -.07 .003
Math Practice Sessions (Behavior)
.21 < .001 .07 < .001
ELA Practice Sessions (Behavior)
.22 < .001 .06 .001
Math Formative Total Mastered (Cognitive)
.23 < .001 .12 < .001
ELA Formative Total Mastered (Cognitive)
.26 < .001 .18 < .001
Math Summative Total Mastered (Cognitive)
.28 < .001 .03 .05
ELA Summative Total Mastered (Cognitive)
.18 < .001 .14 < .001
Math Internal Assessment Score (Cognitive)
.31 < .001 -.10 < .001
Reading Internal Assessment Score (Cognitive)
.25 < .001 -.09 <.001
12-13SY Math Normalized State Test Score (Cognitive)
.18 < .001 .24 < .001
12-13SY Reading Normalized State Test Score (Cognitive)
.12 < .001 .22 < .001
Table 12 Strong and Weak Indicators for Grade 3 to 5 Random Sample
Online Student Behavior Item
13-14SY Math Normalized State Test Score
13-14SY Reading Normalized State Test Score
Pearson Coefficient
p-value Pearson Coefficient
p-value
Month of Enrollment (Affective)
.03 .06 -.01 .71
Number of Years Enrolled (Affective)
.12 <.001 -.10 <.001
Math Total Time hrs (Behavior)
.20 <.001 .03 .02

105
ELA Total Time hrs (Behavior)
.09 <.001 -.02 .08
Total Time hrs (Behavior)
.15 <.001 .001 .93
Math Logins (Behavior)
.15 <.001 .01 .45
ELA Logins (Behavior)
.02 .13 -.05 .001
Total Logins (Behavior) .05 <.001 -.04 .01 Math Percent Complete (Behavior)
.21 <.001 .09 <.001
ELA Percent Complete (Behavior)
.05 .03 -.11 <.001
Average Percent Complete (Behavior)
.16 <.001 -.03 .26
Math Practice Sessions (Behavior)
.30 <.001 .07 <.001
ELA Practice Sessions (Behavior)
.32 <.001 .06 .001
Average Practice Sessions (Behavior)
.32 <.001 .07 <.001
Math Formative Total Mastered (Cognitive)
.29 <.001 .14 <.001
ELA Formative Total Mastered (Cognitive)
.11 <.001 .10 <.001
Total Formative Mastered (Cognitive)
.25 <.001 .17 <.001
Math Summative Total Mastered (Cognitive)
.28 <.001 .17 <.001
ELA Summative Total Mastered (Cognitive)
.30 <.001 .08 <.001
Total Summative Mastered (Cognitive)
.31 <.001 .09 <.001
Math Internal Assessment Score (Cognitive)
.20 <.001 -.07 <.001
Reading Internal Assessment Score (Cognitive)
.19 <.001 -.07 <.001
Average Internal Assessment Scores (Cognitive)
.21 <.001 -.07 <.001

106
12-13SY Math Normalized State Test Score (Cognitive)
.21 <.001 .20 <.001
12-13SY Reading Normalized State Test Score (Cognitive)
.19 <.001 .21 <.001
Math Ratio (Behavior) .12 <.001 .17 <.001 ELA Ratio (Behavior) .01 .52 .09 <.001 Ratio Total Time and Average Progress
.06 .01
.15 <.001
Table 13 Strong and Weak Indicators for Grades 6 to 8 Random Sample
Online Student Behavior Item
13-14SY Math Normalized State Test Score
13-14SY Reading Normalized State Test Score
Pearson Coefficient
p-value Pearson Coefficient
p-value
Month of Enrollment (Affective)
.02 .17 .02 .25
Number of Years Enrolled (Affective)
.02 .10 -.01 .45
Math Total Time hrs (Behavior)
.19 <.001 .13 <.001
ELA Total Time hrs (Behavior)
.19 <.001 .13 <.001
Total Time hrs (Behavior)
.20 <.001 .28 <.001
Math Logins (Behavior)
.17 <.001 .07 <.001
ELA Logins (Behavior)
.12 <.001 .03 .02
Total Logins (Behavior) .14 <.001 .04 .002 Math Percent Complete (Behavior)
.37 <.001 .28 <.001
ELA Percent Complete (Behavior)
.24 <.001 .15 <.001
Average Percent Complete (Behavior)
.37 <.001 .26 <.001
Math Practice Sessions (Behavior)
.28 <.001 .16 <.001
ELA Practice Sessions (Behavior)
.27 <.001 .22 <.001
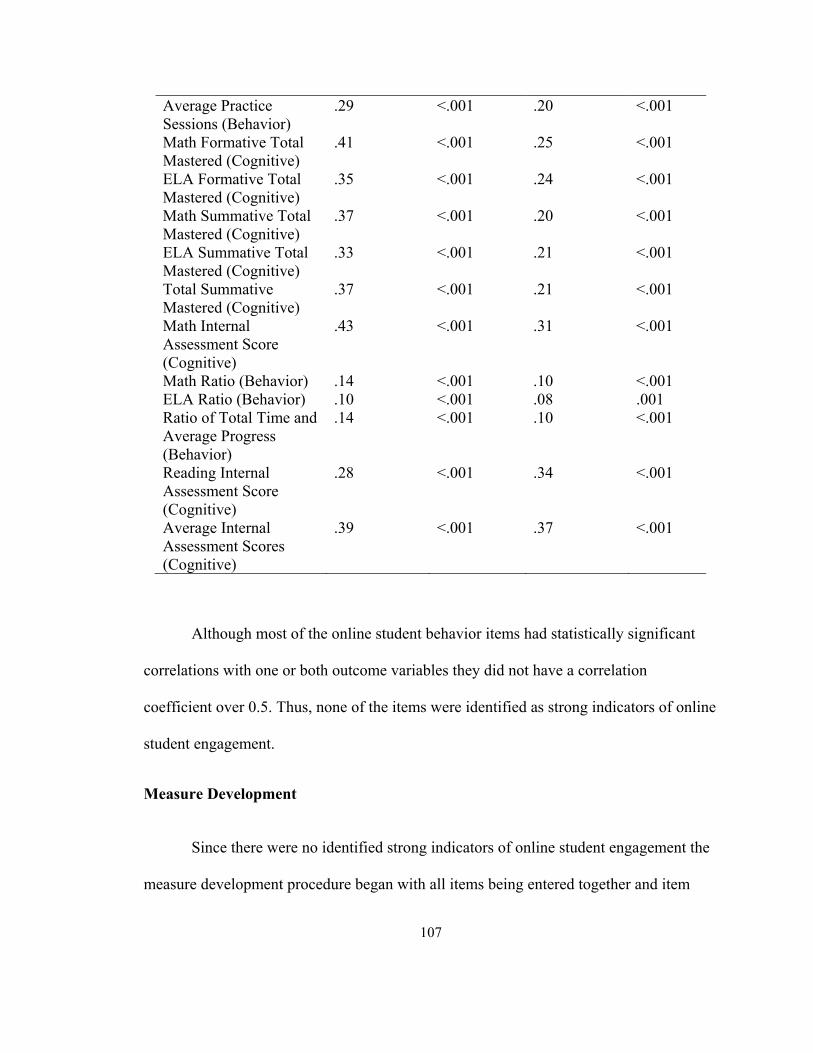
107
Average Practice Sessions (Behavior)
.29 <.001 .20 <.001
Math Formative Total Mastered (Cognitive)
.41 <.001 .25 <.001
ELA Formative Total Mastered (Cognitive)
.35 <.001 .24 <.001
Math Summative Total Mastered (Cognitive)
.37 <.001 .20 <.001
ELA Summative Total Mastered (Cognitive)
.33 <.001 .21 <.001
Total Summative Mastered (Cognitive)
.37 <.001 .21 <.001
Math Internal Assessment Score (Cognitive)
.43 <.001 .31 <.001
Math Ratio (Behavior) .14 <.001 .10 <.001 ELA Ratio (Behavior) .10 <.001 .08 .001 Ratio of Total Time and Average Progress (Behavior)
.14 <.001 .10 <.001
Reading Internal Assessment Score (Cognitive)
.28 <.001 .34 <.001
Average Internal Assessment Scores (Cognitive)
.39 <.001 .37 <.001
Although most of the online student behavior items had statistically significant
correlations with one or both outcome variables they did not have a correlation
coefficient over 0.5. Thus, none of the items were identified as strong indicators of online
student engagement.
Measure Development
Since there were no identified strong indicators of online student engagement the
measure development procedure began with all items being entered together and item
108
categorization being done until a measurement core was identified. This process was
iterative and required many passes through the data. Decisions made related to (a)
deciding on the number of categories that were optimal for items, (b) achieving
reasonable unidimensionality, (c) achieving item fit, (d) seeking and failing to find a
measure that was invariant across grades, (e) resorting to creating a measure separately
for each grade and revisiting all the prior steps, and (f) deciding on the best potential
measure for each grade while allowing items and categorization to vary across grades.
Specifics of this process that detail the decisions made at various points in the analysis
are provided in Appendix B.
To begin the measure development process for each grade level the behavioral
and cognitive items were all included in each grade level dimensionality review. Then the
dimensionality for all grade level measures that included both the cognitive and
behavioral items were evaluated, in particular the contrasts that appear to be potential
dimensions (Table 14). See Appendix B for more detail on the measure development
process undertaken in this study.
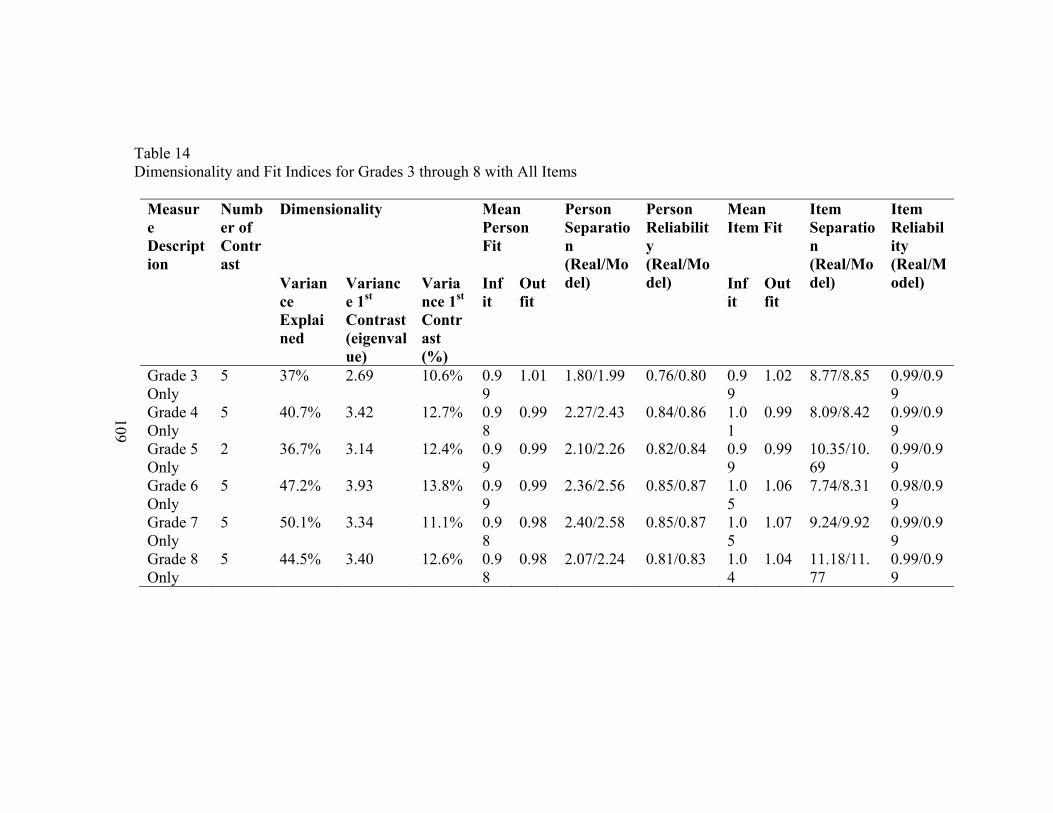
109
Table 14 Dimensionality and Fit Indices for Grades 3 through 8 with All Items
Measure Description
Number of Contrast
Dimensionality Mean Person Fit
Person Separation (Real/Model)
Person Reliability (Real/Model)
Mean Item Fit
Item Separation (Real/Model)
Item Reliability (Real/Model) Varian
ce Explained
Variance 1st Contrast (eigenvalue)
Variance 1st Contrast (%)
Infit
Outfit
Infit
Outfit
Grade 3 Only
5 37% 2.69 10.6% 0.99
1.01 1.80/1.99 0.76/0.80 0.99
1.02 8.77/8.85 0.99/0.99
Grade 4 Only
5 40.7% 3.42 12.7% 0.98
0.99 2.27/2.43 0.84/0.86 1.01
0.99 8.09/8.42 0.99/0.99
Grade 5 Only
2 36.7% 3.14 12.4% 0.99
0.99 2.10/2.26 0.82/0.84 0.99
0.99 10.35/10.69
0.99/0.99
Grade 6 Only
5 47.2% 3.93 13.8% 0.99
0.99 2.36/2.56 0.85/0.87 1.05
1.06 7.74/8.31 0.98/0.99
Grade 7 Only
5 50.1% 3.34 11.1% 0.98
0.98 2.40/2.58 0.85/0.87 1.05
1.07 9.24/9.92 0.99/0.99
Grade 8 Only
5 44.5% 3.40 12.6% 0.98
0.98 2.07/2.24 0.81/0.83 1.04
1.04 11.18/11.77
0.99/0.99

110
As seen in Table 14, Grade 5 had the smallest number of potential dimensions
(number of contrasts) and fit most closely to the measurement structure theorized to
include the three components of student engagement--behavioral, cognitive, and
affective. For these reasons grade 5 was selected to identify measure core items, establish
items related to the multiple dimensions representing the three student engagement
components, and be used as a foundation for the other grade level measures of online
student engagement.
The first step in identifying measurement core items using the grade 5 dataset was
to remove all items that had an infit value over 1.2. Boone, Staver, and Yale (2014)
reiterate the suggestion of Wright and Lincre (1994) to use outfit MNSQ values to
identify measurement core items. Yet while Bond and Fox suggest a range of 0.6 to 1.4
for infit/outfit MNSQ, Wright and Linacre found Item infit/outfit MNSQ values between
0.5 and 1.5 are productive of measurement. Item infit/outfit MNSQ is a chi-square
statistic that gets closer to a value of 1.0 as the sample size increases. A conservative
choice of using 1.2 instead of higher values (1.4 or 1.5) was made to account for the large
sample size. Eight items were removed in groups of two or three that had an infit value
over 1.2 and eight items remained. Tables 15 and 16 display the item categorization steps
taken to identify the measurement core items for the 1st and 2nd dimensions of Grade 5
Online Student Engagement measure.
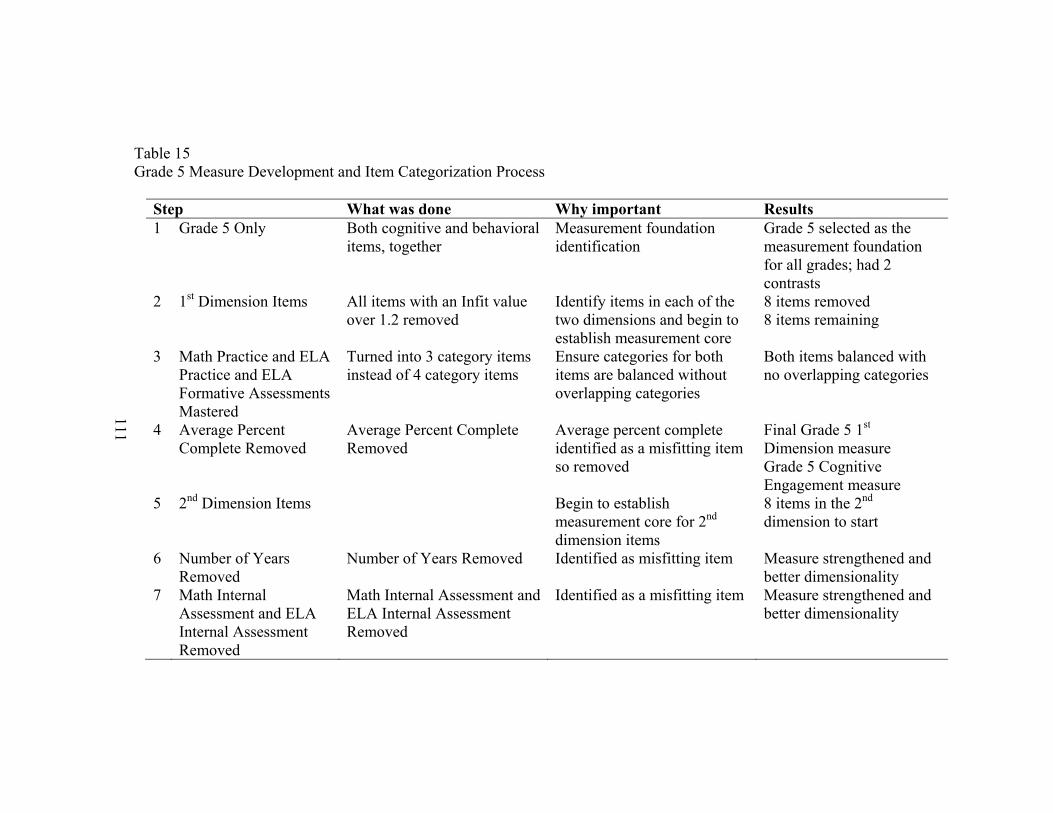
111
Table 15 Grade 5 Measure Development and Item Categorization Process
Step What was done Why important Results 1 Grade 5 Only Both cognitive and behavioral
items, together Measurement foundation identification
Grade 5 selected as the measurement foundation for all grades; had 2 contrasts
2 1st Dimension Items All items with an Infit value over 1.2 removed
Identify items in each of the two dimensions and begin to establish measurement core
8 items removed 8 items remaining
3 Math Practice and ELA Practice and ELA Formative Assessments Mastered
Turned into 3 category items instead of 4 category items
Ensure categories for both items are balanced without overlapping categories
Both items balanced with no overlapping categories
4 Average Percent Complete Removed
Average Percent Complete Removed
Average percent complete identified as a misfitting item so removed
Final Grade 5 1st Dimension measure Grade 5 Cognitive Engagement measure
5 2nd Dimension Items Begin to establish measurement core for 2nd dimension items
8 items in the 2nd dimension to start
6 Number of Years Removed
Number of Years Removed Identified as misfitting item Measure strengthened and better dimensionality
7 Math Internal Assessment and ELA Internal Assessment Removed
Math Internal Assessment and ELA Internal Assessment Removed
Identified as a misfitting item Measure strengthened and better dimensionality

112
8 Total Logins and Math Logins Removed
Total Logins Removed Math Logins Removed
Both items removed for multicollinearity concerns.
Final Grade 5 2nd Dimension measure Grade 5 Behavioral Engagement measure
Table 16 Dimensionality and Fit Indices for Grade 5 Measure Development and Item Categorization Process Steps
Measure Description
Dimensionality Mean Person Fit
Person Separation (Real/Model)
Person Reliability (Real/Model)
Mean Item Fit
Item Separation (Real/Model)
Item Reliability (Real/Model)
Variance Explained
Variance 1st Contrast (eigenvalue)
Variance 1st Contrast (%)
Infit
Outfit
Infit
Outfit
Grade 5 Only 36.7% 3.14 12.4% 0.99
0.99 2.10/2.26 0.82/0.84 0.99
0.99
10.35/10.69
0.99/0.99
1st Dimension Items (cognitive)
56.6% 1.92 10.4% 0.96
0.96 1.86/2.06 0.78/0.81 1.02
0.98
15.07/15.71
0.99/0.99
Math Practice, ELA Practice and ELA Formative Assessments Mastered
54.5% 1.92 10.9% 0.97
0.97 1.77/1.95 0.76/0.79 1.02
0.99
10.64/11.05
0.99/0.99

113
Average Percent Complete Removed
55.4% 1.91 12.2% 0.98
0.98 1.73/1.92 0.75/0.79 1.02
0.99
12.12/12.54
0.99/0.99
2nd Dimension Items (behavioral)
34.5% 2.64 21.7% 0.99
0.99 1.41/1.57 0.67/0.71 0.99
0.99
9.16/9.51 0.99/0.99
Number of Years Removed
37.6% 2.48 22.1% 0.99
0.99 1.32/1.49 0.64/0.69 0.99
1.01
8.14/8.53 0.99/0.99
Math Internal Assessment and ELA Internal Assessment Removed
54.5% 2.51 22.8% 0.98
0.99 1.53/1.75 0.70/0.75 0.99
1.01
10.85/11.04
0.99/0.99
Total Logins and Math Logins Removed
66.4% 2.01 22.4% 0.93
0.94 1.49/1.79 0.69/0.76 0.97
0.95
4.18/4.29 0.95/0.95
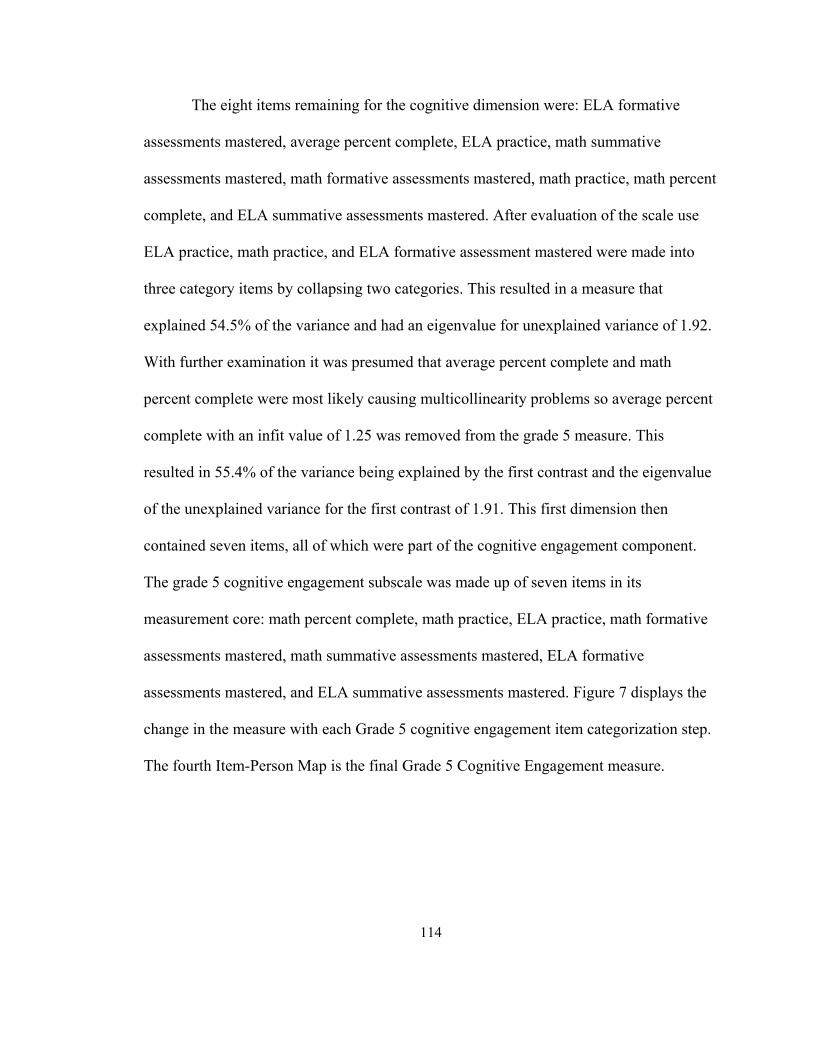
114
The eight items remaining for the cognitive dimension were: ELA formative
assessments mastered, average percent complete, ELA practice, math summative
assessments mastered, math formative assessments mastered, math practice, math percent
complete, and ELA summative assessments mastered. After evaluation of the scale use
ELA practice, math practice, and ELA formative assessment mastered were made into
three category items by collapsing two categories. This resulted in a measure that
explained 54.5% of the variance and had an eigenvalue for unexplained variance of 1.92.
With further examination it was presumed that average percent complete and math
percent complete were most likely causing multicollinearity problems so average percent
complete with an infit value of 1.25 was removed from the grade 5 measure. This
resulted in 55.4% of the variance being explained by the first contrast and the eigenvalue
of the unexplained variance for the first contrast of 1.91. This first dimension then
contained seven items, all of which were part of the cognitive engagement component.
The grade 5 cognitive engagement subscale was made up of seven items in its
measurement core: math percent complete, math practice, ELA practice, math formative
assessments mastered, math summative assessments mastered, ELA formative
assessments mastered, and ELA summative assessments mastered. Figure 7 displays the
change in the measure with each Grade 5 cognitive engagement item categorization step.
The fourth Item-Person Map is the final Grade 5 Cognitive Engagement measure.
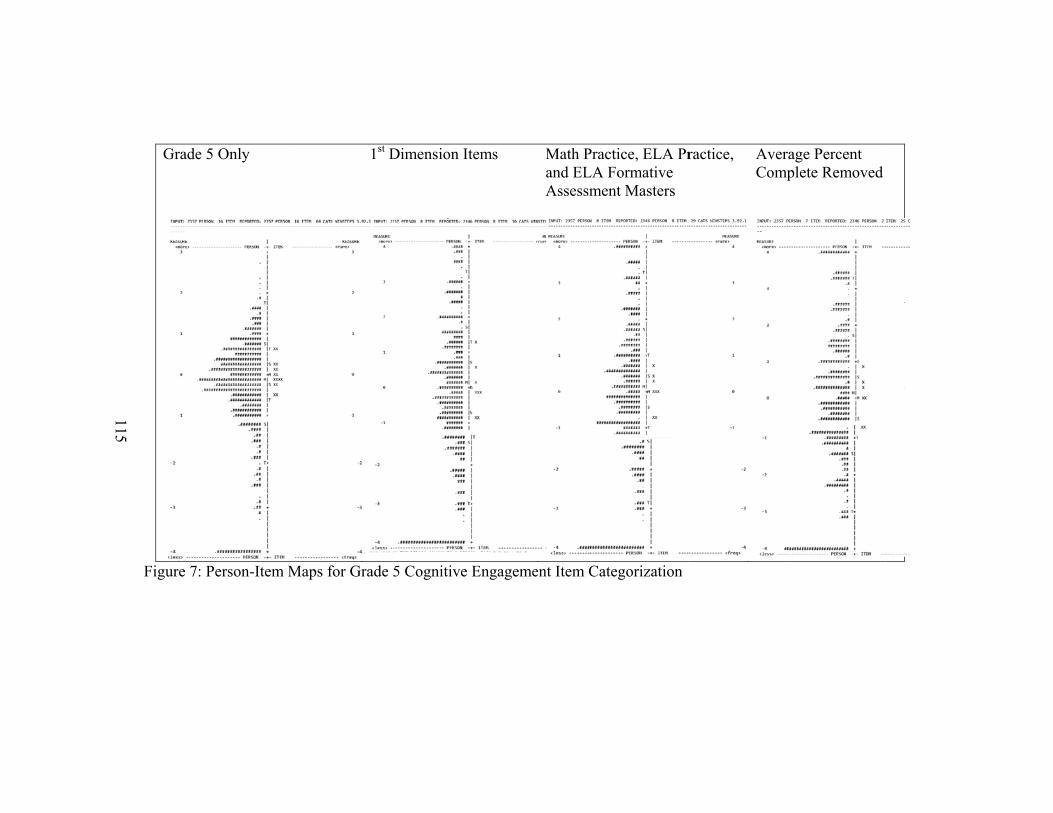
115
Grade
Figure 7
e 5 Only
: Person-Item M
1st D
Maps for Grade 5
Dimension Item
5 Cognitive Eng
s Math Pand ELAssessm
gagement Item C
Practice, ELA PrLA Formative ment Masters
Categorization
ractice, AverComp
rage Percent plete Removed

116
Figure 8 show the response category probability curves and the item categorization changes in the curves of the Grade 5 Cognitive Engagement items. Only the items retained at the conclusion of the item categorization process are displayed.
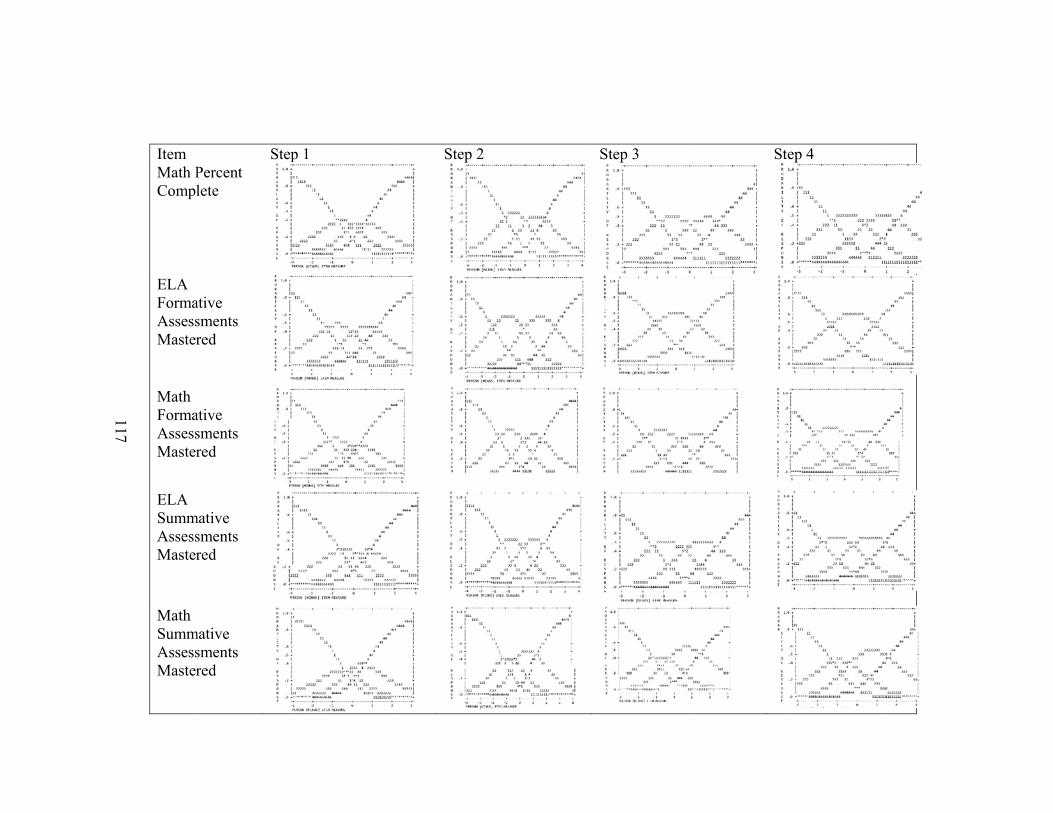
117
Item Math PCompl
ELA FormaAssessMaster
Math FormaAssessMaster
ELA SummAssessMaster
Math SummAssessMaster
StepPercent lete
ative sments red
ative sments red
mative sments red
mative sments red
p 1 Step 2
Step 3 St
ep 4
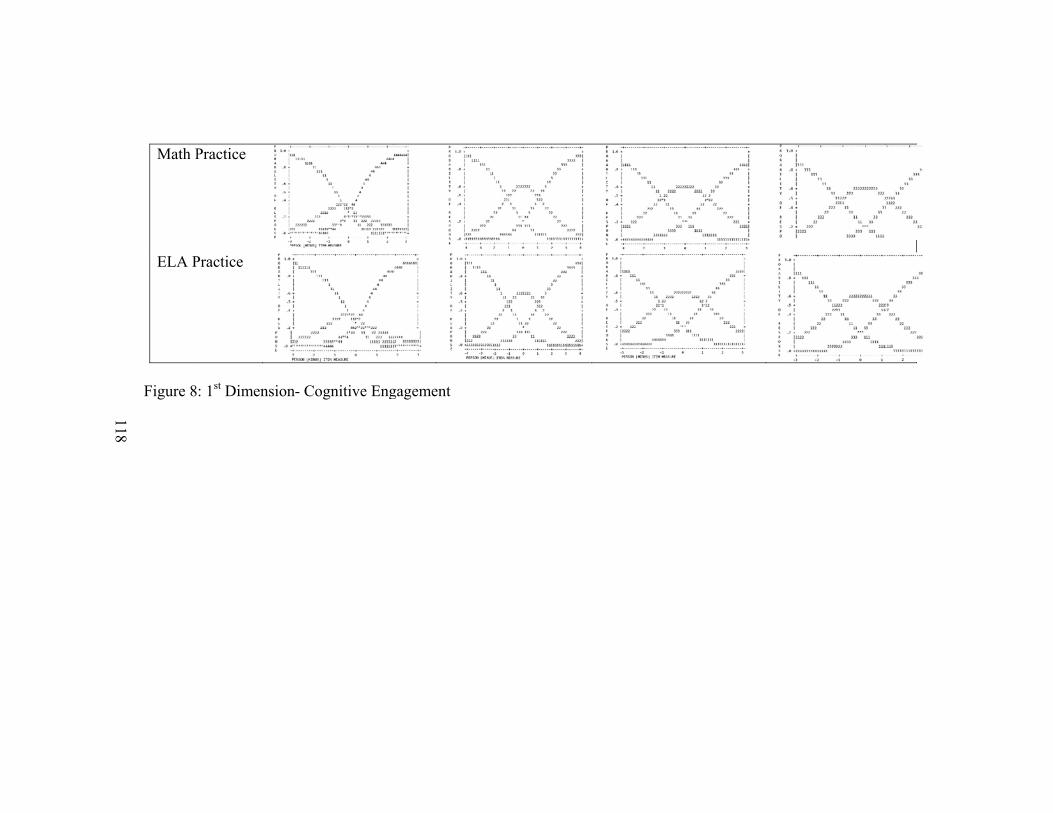
118
Math P
ELA P
Figure 8
Practice
Practice
: 1st Dimension- Cognitive Eng
gagement
119
Once the measurement core items were identified as the cognitive engagement
subscale the original eight items that were removed for being underfit with infit values
over 1.2 were evaluated for an additional dimension/factor.
When all eight items were part of one measure, 34.5% of the variance was
explained with an eigenvalue for unexplained variance in the first contrast of 2.64. Next,
all items with an infit value over 1.2? were removed. This step removed three items and
retained five items that explained 54.5% of the variance and had an eigenvalue for the
unexplained variance of 2.51. The remaining five items were total logins, ELA ratio of
time and progress, math total time, ELA total time, and math logins. Through single
elimination re-evaluation of items, it was found that total logins and math logins only fit
in the measure when both were included in the measure, potentially causing
multicollinearity problems. For this reason both total logins and math logins were
removed from the measure, resulting in a three item measure made up of math total time,
ELA total time, and ELA ratio of time and progress. This three item measure accounted
for 66.4% of the variance explained and had an eigenvalue for the unexplained variance
of 2.01. These three items were all behavioral engagement items, so this dimension/factor
was considered the behavioral engagement subscale.
Figure 9 displays the measure continuum changes for each Grade 5 behavioral
engagement item categorization step. The fifth Item-Person Map represents the final
Grade 5 Behavioral engagement measure made up of three items. Figure 10 displays the
final Grade 5 behavioral engagement items’ category probability curves after each item
categorization process step.
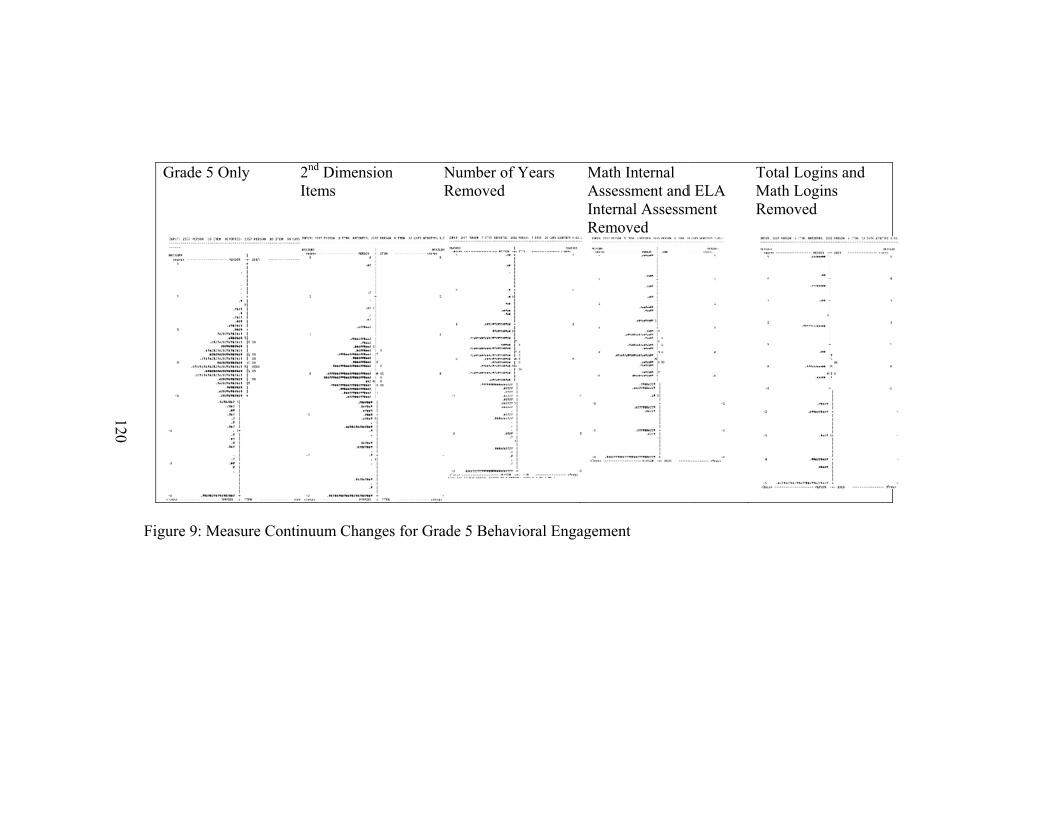
120
Grade
Figure 9
e 5 Only
: Measure Cont
2nd Dimension Items
tinuum Changes
NumberRemove
s for Grade 5 Be
r of Years ed
MAIR
ehavioral Engag
Math Internal Assessment andInternal AssessmRemoved
gement
d ELA ment
TotalMathRemo
l Logins and h Logins oved
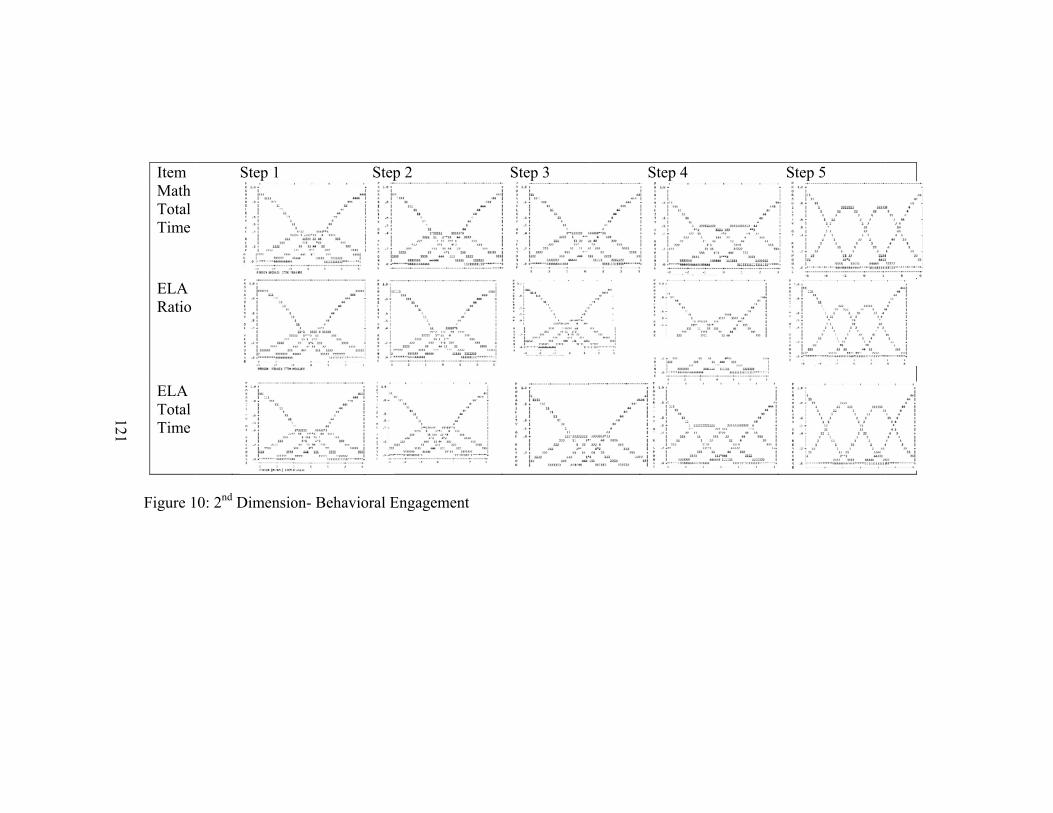
121
Item Math Total Time
ELA Ratio
ELA Total Time
Figure 1
Step 1
0: 2nd Dimensio
Step
on- Behavioral E
p 2
Engagement
Step 3
Step 4
SStep 5
122
Both the grade 5 cognitive engagement subscale and the grade 5 behavioral
engagement subscale were then used as a foundation to construct similar measures in
other grades (Table 16). Figures 11 to 15 show the initial item-person maps side-by-side
with the final item-person maps for grades 3, 4, 6, 7, and 8. Each grade’s initial measure
contained all items while final measures were separated between the cognitive
engagement measure and the behavioral engagement measure.
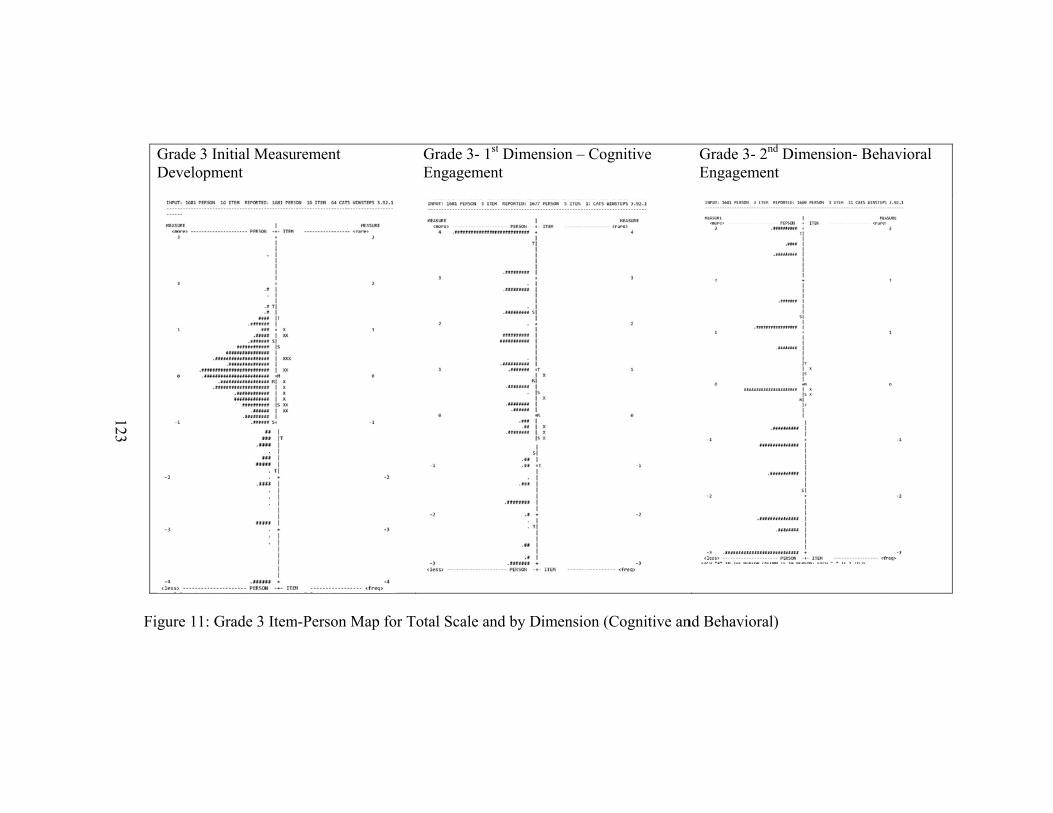
123
Grade Develo
Figure 1
3 Initial Measuopment
1: Grade 3 Item
urement
m-Person Map fo
Grade 3- 1Engagemen
or Total Scale an
st Dimension – Cnt
nd by Dimensio
Cognitive
on (Cognitive an
Grade 3- 2nd DEngagement
nd Behavioral)
Dimension- Behhavioral

124
Grade Develo
Figure 1
4 Initial Measuopment
2: Grade 4 Item
urement
m-Person Map fo
Grade 4- 1st
Engagemen
or Total Scale an
t Dimension- Cont
nd by Dimensio
ognitive
on (Cognitive an
Grade 4- 2nd DEngagement
nd Behavioral)
Dimension- Behaavioral

125
Grade
Figure 1
e 6 Initial Measu
3: Grade 6 Item
ure Developmen
m-Person Map fo
nt Grade 6- 1s
Engagemen
or Total Scale an
st Dimension- Cnt
nd by Dimensio
Cognitive
on (Cognitive an
Grade 6- 2nd DEngagement
nd Behavioral)
Dimension- Behhavioral
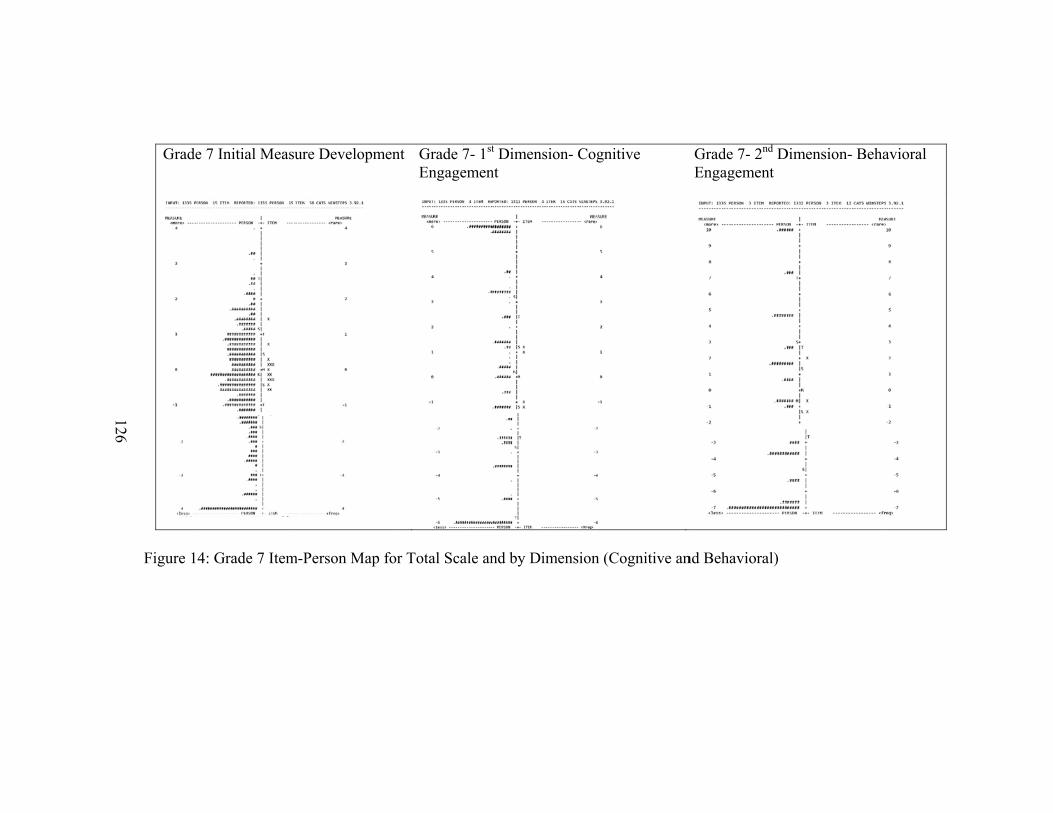
126
Grade
Figure 1
e 7 Initial Measu
4: Grade 7 Item
ure Developmen
m-Person Map fo
nt Grade 7- 1st
Engagemen
or Total Scale an
t Dimension- Cont
nd by Dimensio
ognitive
on (Cognitive an
Grade 7- 2nd DEngagement
nd Behavioral)
Dimension- Behaavioral
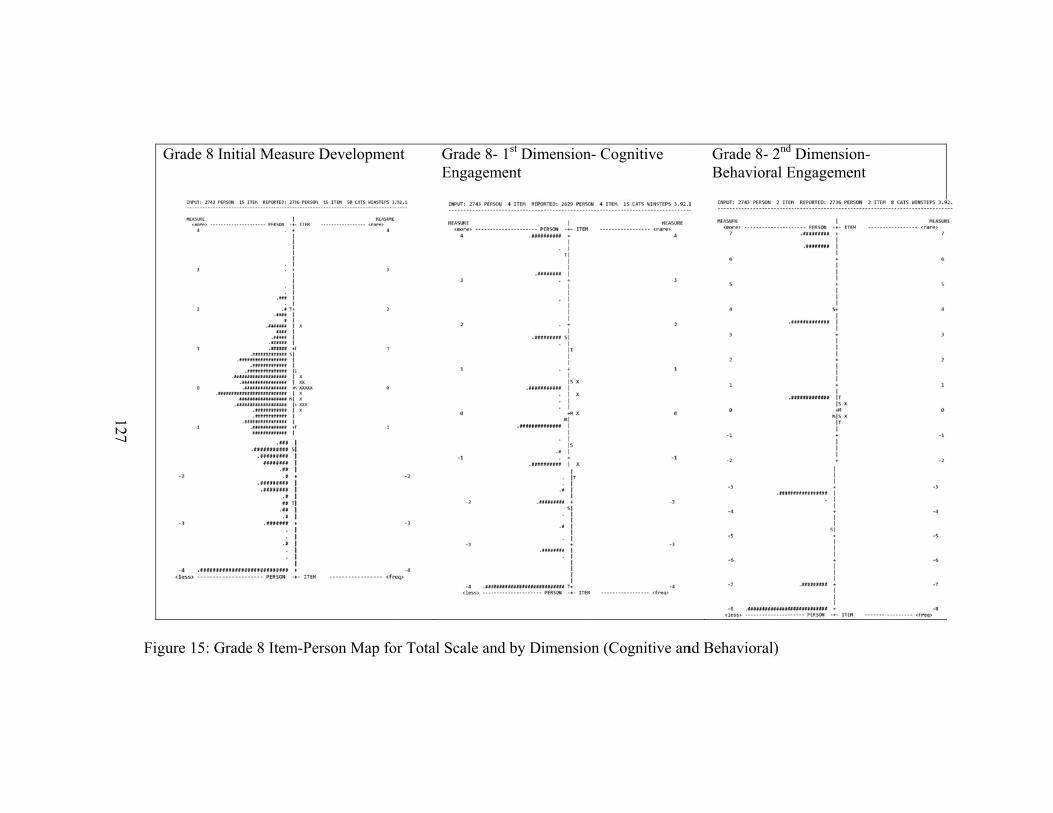
127
Grade
Figure 1
e 8 Initial Measu
5: Grade 8 Item
ure Developmen
m-Person Map fo
nt Grade 8Engagem
or Total Scale an
- 1st Dimensionment
nd by Dimensio
n- Cognitive
on (Cognitive an
Grade 8- 2nd
Behavioral E
nd Behavioral)
d Dimension- Engagement
128
While an attempt was made to keep item categories and item definition constant
across grades, doing so resulted in either a suggestion of an additional dimension or
misfitting items or disordered probability curves. Thus categories and items were
adapted for each grade as follows. For grade 3, ELA formative assessments mastered and
math summative assessments mastered were removed from the cognitive engagement
subscale, along with math summative assessments mastered being changed from a four
category item to a three category item. This resulted in 51.4% of the variance being
explained by the measure with a 2.42 eigenvalue for the first contrast (Table 20). No
changes were made to the cognitive engagement subscale for grade 4, which resulted in
54.1% of the variance being explained by the first contrast with a 1.98 eigenvalue for
unexplained variance in the first contrast (Table 20). The cognitive engagement subscale
for grades 6, 7 and 8 used average practice instead of math practice and ELA practice as
individual items. For the grade 6 cognitive engagement subscale, math percent complete,
average practice and ELA formative assessments mastered were removed from the
measure. This resulted in 70.7% of the variance being explained by the first contrast with
a 1.70 eigenvalue for variance unexplained by the first contrast (Table 20). The grade 7
cognitive engagement subscale had math percent complete and average practice removed
from the measure. This resulted in 69.7% of the variance being explained by the measure
with an eigenvalue for the first contrast of 1.67 (Table 20).
Math percent complete and average practice were removed from the grade 8
cognitive engagement subscale resulting in 58% of the variance being explained by the

129
first contrast with a 1.83 eigenvalue for the variance unexplained by the first contrast
(Table 20).
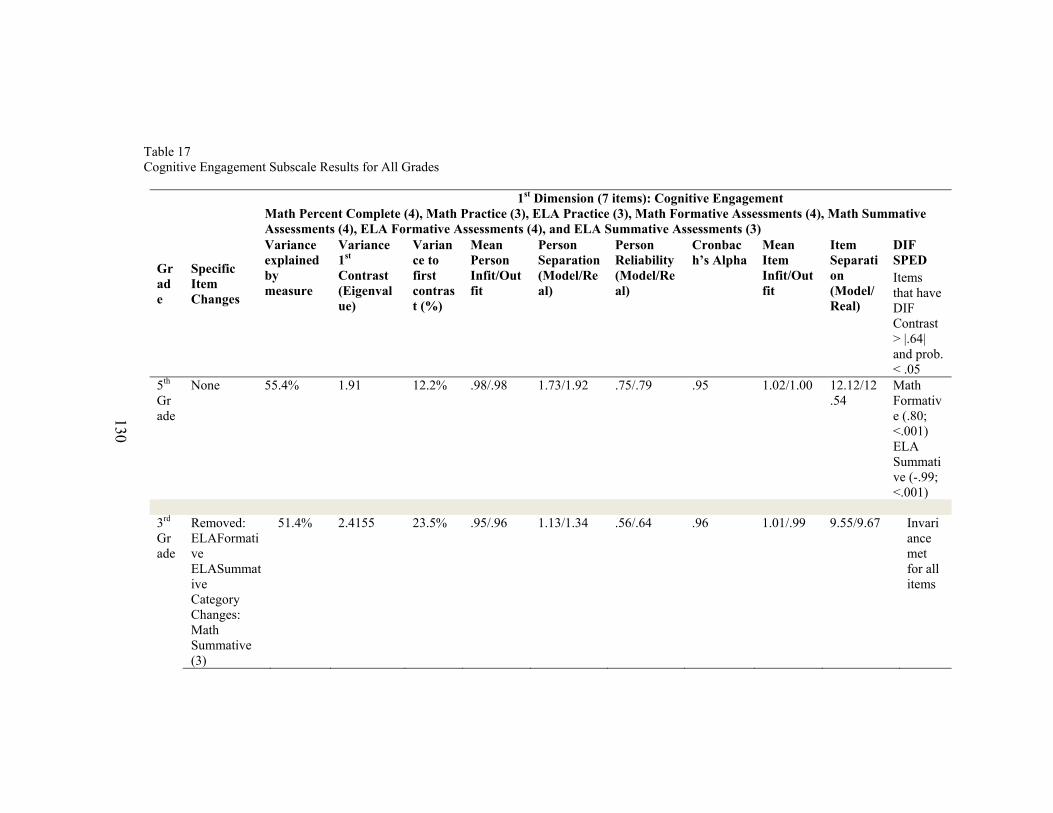
130
Table 17 Cognitive Engagement Subscale Results for All Grades
Grade
Specific Item Changes
1st Dimension (7 items): Cognitive Engagement Math Percent Complete (4), Math Practice (3), ELA Practice (3), Math Formative Assessments (4), Math Summative Assessments (4), ELA Formative Assessments (4), and ELA Summative Assessments (3) Variance explained by measure
Variance 1st Contrast (Eigenvalue)
Variance to first contrast (%)
Mean Person Infit/Outfit
Person Separation (Model/Real)
Person Reliability (Model/Real)
Cronbach’s Alpha
Mean Item Infit/Outfit
Item Separation (Model/Real)
DIF SPED Items that have DIF Contrast > |.64| and prob. < .05
5th
Grade
None 55.4% 1.91 12.2% .98/.98 1.73/1.92 .75/.79 .95 1.02/1.00 12.12/12.54
Math Formative (.80; <.001) ELA Summative (-.99; <.001)
3rd Grade
Removed: ELAFormative ELASummative Category Changes: Math Summative (3)
51.4% 2.4155 23.5% .95/.96 1.13/1.34 .56/.64 .96 1.01/.99 9.55/9.67 Invariance met for all items
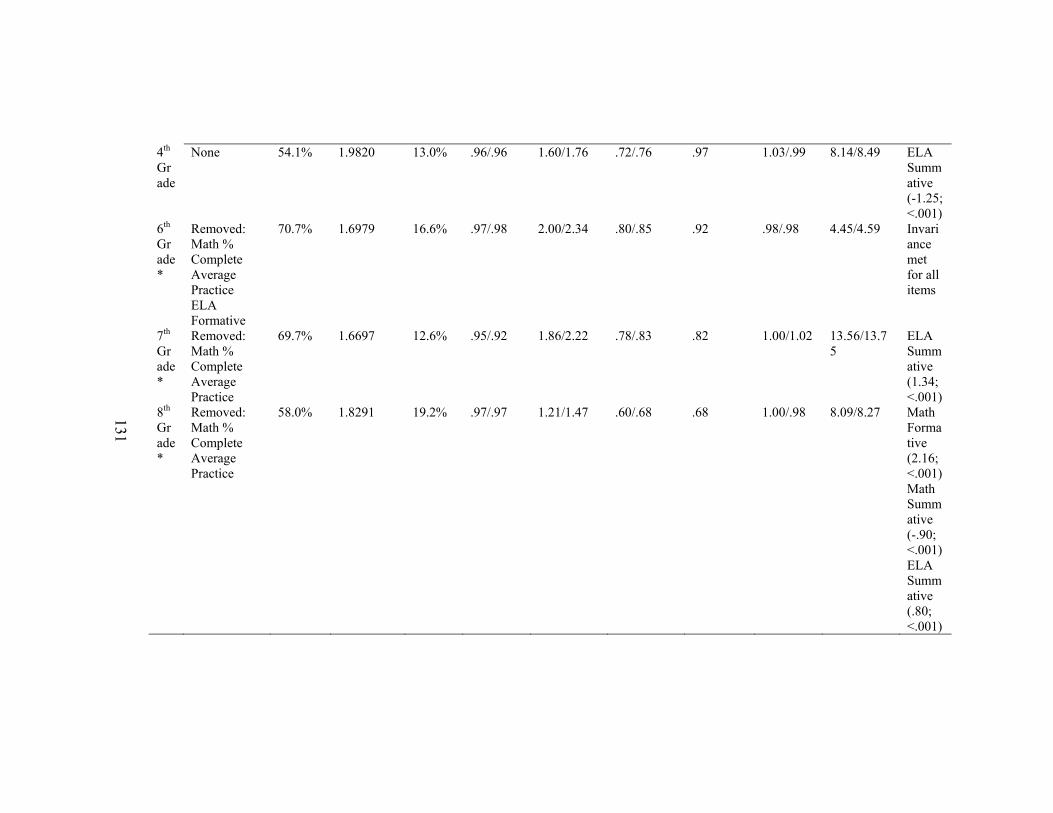
131
4th Grade
None 54.1% 1.9820 13.0% .96/.96 1.60/1.76 .72/.76 .97 1.03/.99 8.14/8.49 ELA Summative (-1.25; <.001)
6th Grade*
Removed: Math % Complete Average Practice ELA Formative
70.7% 1.6979 16.6% .97/.98 2.00/2.34 .80/.85 .92 .98/.98 4.45/4.59 Invariance met for all items
7th Grade*
Removed: Math % Complete Average Practice
69.7% 1.6697 12.6% .95/.92 1.86/2.22 .78/.83 .82 1.00/1.02 13.56/13.75
ELA Summative (1.34; <.001)
8th Grade*
Removed: Math % Complete Average Practice
58.0% 1.8291 19.2% .97/.97 1.21/1.47 .60/.68 .68 1.00/.98
8.09/8.27 Math Formative (2.16; <.001) Math Summative (-.90; <.001) ELA Summative (.80; <.001)

132
The grade 3 behavioral engagement subscale had the ELA ratio of time and
progress item changed from a four category item to a three category item, resulting in
52.9% of the variance being explained by the first contrast with a 2.22 eigenvalue for the
variance unexplained by the first contrast (Table 18).
No changes from the grade 5 behavioral engagement subscale were needed for the
grade 4 behavioral engagement subscale. The grade 4 behavioral engagement subscale
accounted for 63.9% of the variance with an eigenvalue of 2.01 for variance to the first
contrast (Table 18).
No changes in the grade 5 behavioral engagement subscale were made for grades
6, 7, or 8 behavioral subscales. The grade 6 behavioral engagement subscale accounted
for 71.2% of the variance explained with an eigenvalue of 1.85 for the variance to the
first contrast (Table 8). The grade 7 behavioral engagement subscale accounted for 74.8%
of the variance explained by the measure with an eigenvalue of 1.85 for the variance to
the first contrast (Table 18). The grade 8 behavioral engagement subscale accounted for
76.9% of the variance explained with an eigenvalue of 1.84 for the variance to the first
contrast (Table 18).

133
Table 18 Behavioral Engagement Subscale Results for all Grades
Grade
Specific Item Changes
2nd Dimension (3 items): Behavioral Engagement ELA Ratio between Time (4) and Progress, ELA Total Time (4), and Math Total Time (4) Variance explained by measure
Variance 1st Contrast (Eigenvalue)
Variance to first contrast (%)
Mean Person Infit/Outfit
Person Separation (Model/Real?)
Person Reliability (Model/Real)
Cronbach’s Alpha
Mean Item Infit/Outfit
Item Separation (Model/Real)
DIF SPED Items that have DIF Contrast > |.64| and prob. < .05
5th
Grade
None 66.4% 2.0054 22.4% .93/.94 1.49/1.79 .69/.76 .74 .97/.95 4.18/4.29 Math Total Time (-.80; <.001)
3rd Grade
Category Changes: ELA Ratio (3)
52.9% 2.2169 34.8% .93/.93 .84/1.11 .41/.55 .67 .95/.90 3.83/3.97 Math Total Time (-1.21; <.001) ELA Ratio (1.16; <.001)
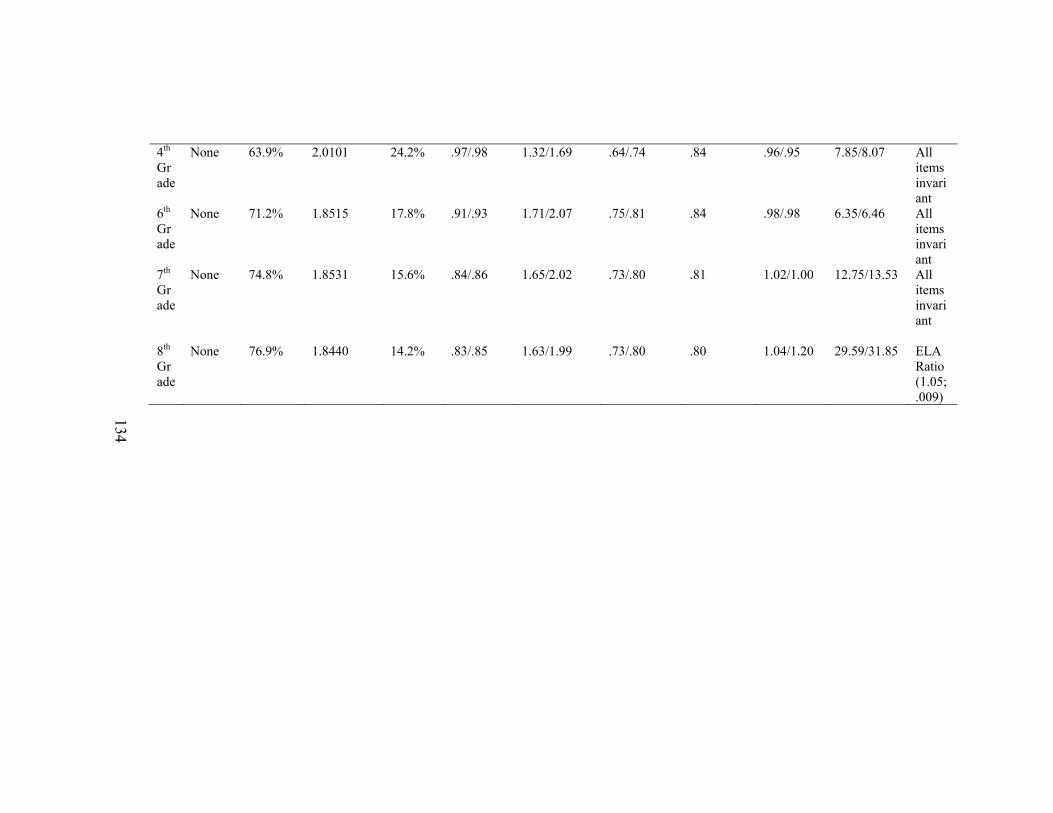
134
4th Grade
None 63.9% 2.0101 24.2% .97/.98 1.32/1.69 .64/.74 .84 .96/.95 7.85/8.07 All items invariant
6th Grade
None 71.2% 1.8515 17.8% .91/.93 1.71/2.07 .75/.81 .84 .98/.98 6.35/6.46 All items invariant
7th Grade
None 74.8% 1.8531 15.6% .84/.86 1.65/2.02 .73/.80 .81 1.02/1.00 12.75/13.53 All items invariant
8th Grade
None 76.9% 1.8440 14.2% .83/.85 1.63/1.99 .73/.80 .80 1.04/1.20 29.59/31.85 ELA Ratio (1.05; .009)
135
Reliability and Validity
Split Sample
The original dataset containing approximately 20,000 online students in grades
three through 8 was the source for the two random samples, each with 5,000 students.
The second of these random samples was separated by grade then used to test the
structure of each measure developed.
Since grade 5 was used to develop the measures for online cognitive engagement
and online behavioral engagement, it was the first measure to be retested with the second
sample. For online cognitive engagement the second sample confirmed the grade 5
measure, including the invariance problem of Math Formative assessments mastered and
ELA Summative assessments mastered for students receiving special education services.
For online behavioral engagement the second sample confirmed the grade 5 measure, yet
the second sample was invariant for all items while the first sample was not invariant for
Math Total Time for students receiving special education services.
All of the other grade level measures (grades 3, 4, 6, 7, and 8), both for online
cognitive engagement and for online behavioral engagement were retested using the
second random sample. Table 19 shows the results validating all of the measures for
online cognitive engagement and online behavioral engagement for all grade levels. Yet
while the first random sample for grade 8 online cognitive engagement had a person
separation of 1.04, the grade 8 online cognitive engagement measure for the second
random sample did not meet the expectations for separation, not even after the removal of

136
the Math Formative assessments mastered item that was found to be misfitting. This low
person separation could imply that the measure of online cognitive engagement for grade
8 may not be sensitive enough to separate person ability (engagement level) into high and
low groupings (Linacre, 2012).
For all grades, for both the first random sample and the second random sample,
the measures for online cognitive engagement and online behavioral engagement had low
person separation values (< 2) (Boone, Staver, & Yale). This indicates that all the
measures have low sensitivity for separation of online student engagement levels and
more items need to be added to both the measure of online cognitive engagement and the
measure of online behavioral engagement.
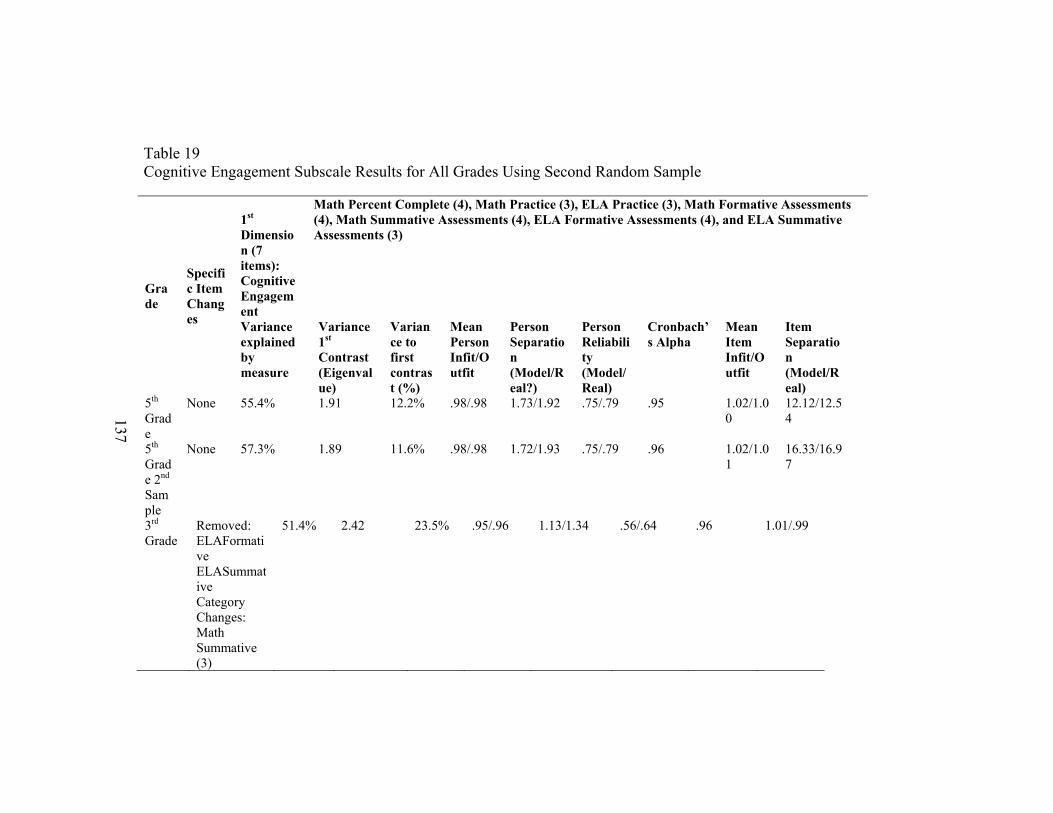
137
Table 19 Cognitive Engagement Subscale Results for All Grades Using Second Random Sample
Grade
Specific Item Changes
1st Dimension (7 items): Cognitive Engagement
Math Percent Complete (4), Math Practice (3), ELA Practice (3), Math Formative Assessments (4), Math Summative Assessments (4), ELA Formative Assessments (4), and ELA Summative Assessments (3)
Variance explained by measure
Variance 1st Contrast (Eigenvalue)
Variance to first contrast (%)
Mean Person Infit/Outfit
Person Separation (Model/Real?)
Person Reliability (Model/Real)
Cronbach’s Alpha
Mean Item Infit/Outfit
Item Separation (Model/Real)
5th
Grade
None 55.4% 1.91 12.2% .98/.98 1.73/1.92 .75/.79 .95 1.02/1.00
12.12/12.54
5th Grade 2nd Sample
None 57.3% 1.89 11.6% .98/.98 1.72/1.93 .75/.79 .96 1.02/1.01
16.33/16.97
3rd Grade
Removed: ELAFormative ELASummative Category Changes: Math Summative (3)
51.4% 2.42 23.5% .95/.96 1.13/1.34 .56/.64 .96 1.01/.99
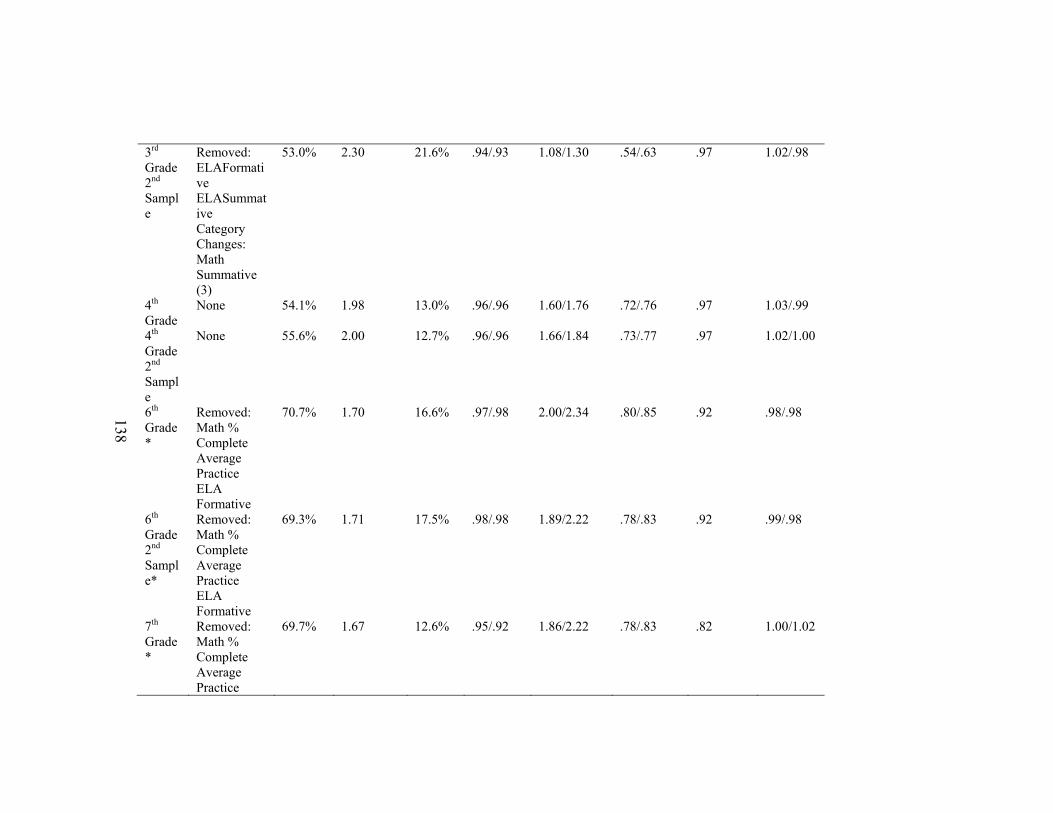
138
3rd Grade 2nd Sample
Removed: ELAFormative ELASummative Category Changes: Math Summative (3)
53.0% 2.30 21.6% .94/.93 1.08/1.30 .54/.63 .97 1.02/.98
4th Grade
None 54.1% 1.98 13.0% .96/.96 1.60/1.76 .72/.76 .97 1.03/.99
4th Grade 2nd Sample
None 55.6% 2.00 12.7% .96/.96 1.66/1.84 .73/.77 .97 1.02/1.00
6th Grade*
Removed: Math % Complete Average Practice ELA Formative
70.7% 1.70 16.6% .97/.98 2.00/2.34 .80/.85 .92 .98/.98
6th Grade 2nd Sample*
Removed: Math % Complete Average Practice ELA Formative
69.3% 1.71 17.5% .98/.98 1.89/2.22 .78/.83 .92 .99/.98
7th Grade*
Removed: Math % Complete Average Practice
69.7% 1.67 12.6% .95/.92 1.86/2.22 .78/.83 .82 1.00/1.02
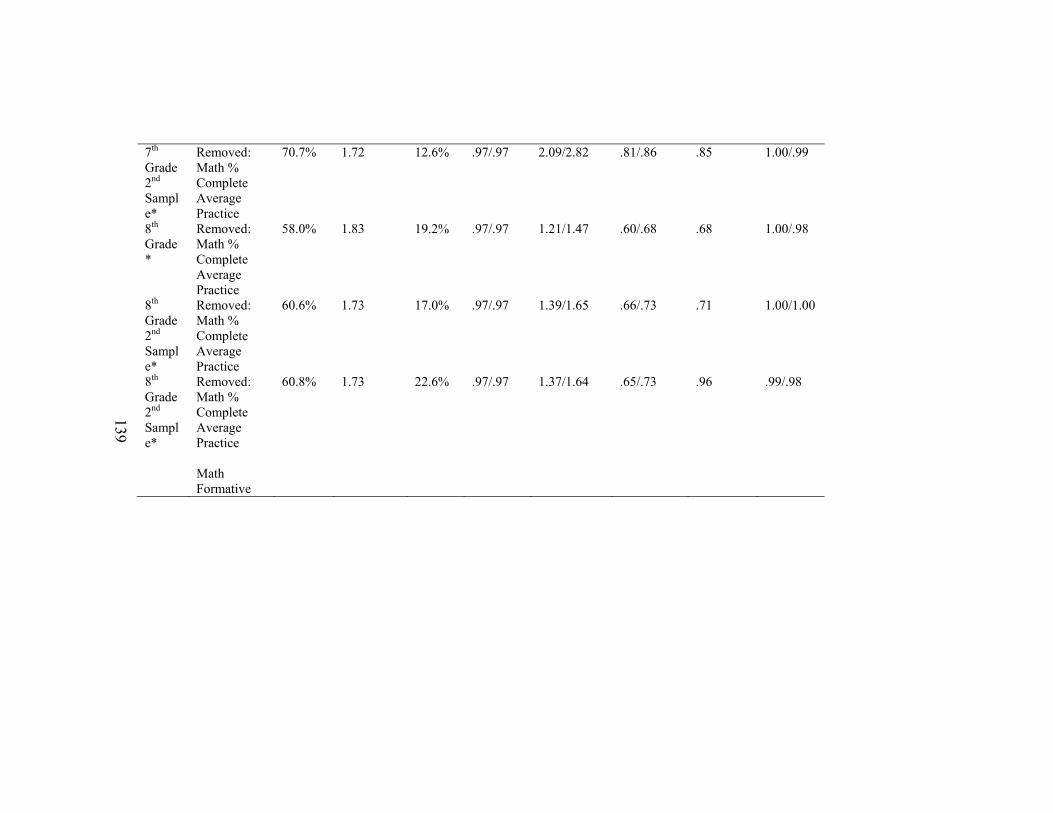
139
7th Grade 2nd Sample*
Removed: Math % Complete Average Practice
70.7% 1.72 12.6% .97/.97 2.09/2.82 .81/.86 .85 1.00/.99
8th Grade*
Removed: Math % Complete Average Practice
58.0% 1.83 19.2% .97/.97 1.21/1.47 .60/.68 .68 1.00/.98
8th Grade 2nd Sample*
Removed: Math % Complete Average Practice
60.6% 1.73 17.0% .97/.97 1.39/1.65 .66/.73 .71 1.00/1.00
8th Grade 2nd Sample*
Removed: Math % Complete Average Practice Math Formative
60.8% 1.73 22.6% .97/.97 1.37/1.64 .65/.73 .96 .99/.98

140
Table 20 Behavioral Engagement Subscale Results for All Grades Using Second Random Sample
Grade
Specific Item Changes
2nd Dimension (3 items): Behavioral Engagement ELA Ratio between Time (4) and Progress, ELA Total Time (4), and Math Total Time (4) Variance explained by measure
Variance 1st Contrast (Eigenvalue)
Variance to first contrast (%)
Mean Person Infit/Outfit
Person Separation (Model/Real?)
Person Reliability (Model/Real)
Cronbach’s Alpha
Mean Item Infit/Outfit
Item Separation (Model/Real)
5th
Grade
None 66.4% 2.01 22.4% .93/.94 1.49/1.79 .69/.76 .74 .97/.95 4.18/4.29
5th Grade 2nd Sample
None 64.6% 2.06 24.3% .95/.93 1.38/1.69 .66/.74 .81 .96/.92 13.38/13.67
3rd Grade
Category Changes: ELA Ratio (3)
52.9% 2.22 34.8% .93/.93 .84/1.11 .41/.55 .67 .95/.90
3rd Grade 2nd Sample
Category Changes: ELA Ratio (3)
54.0% 2.21 33.8% .95/.95 .88/1.15 .44/.57 .69 .94/.91

141
4th Grade
None 63.9% 2.01 24.2% .97/.98 1.32/1.69 .64/.74 .84 .96/.95
4th Grade 2nd Sample
None 62.3% 2.00 25.1% .96/.95 1.28/1.61 .62/.72 .80 .96/.94
6th Grade
None 71.2% 1.85 17.8% .91/.93 1.71/2.07 .75/.81 .84 .98/.98
6th Grade 2nd Sample
None 68.7% 1.92 20.1% .93/.93 1.58/1.94 .71/.79 .85 .99/.98
7th Grade
None 74.8% 1.85 15.6% .84/.86 1.65/2.02 .73/.80 .81 1.02/1.00
7th Grade 2nd Sample
None 74.8% 1.90 15.9% .87/.87 1.70/2.10 .74/.82 .87 1.01/.96
8th Grade
None 76.9% 1.84 14.2% .83/.85 1.63/1.99 .73/.80 .80 1.04/1.20
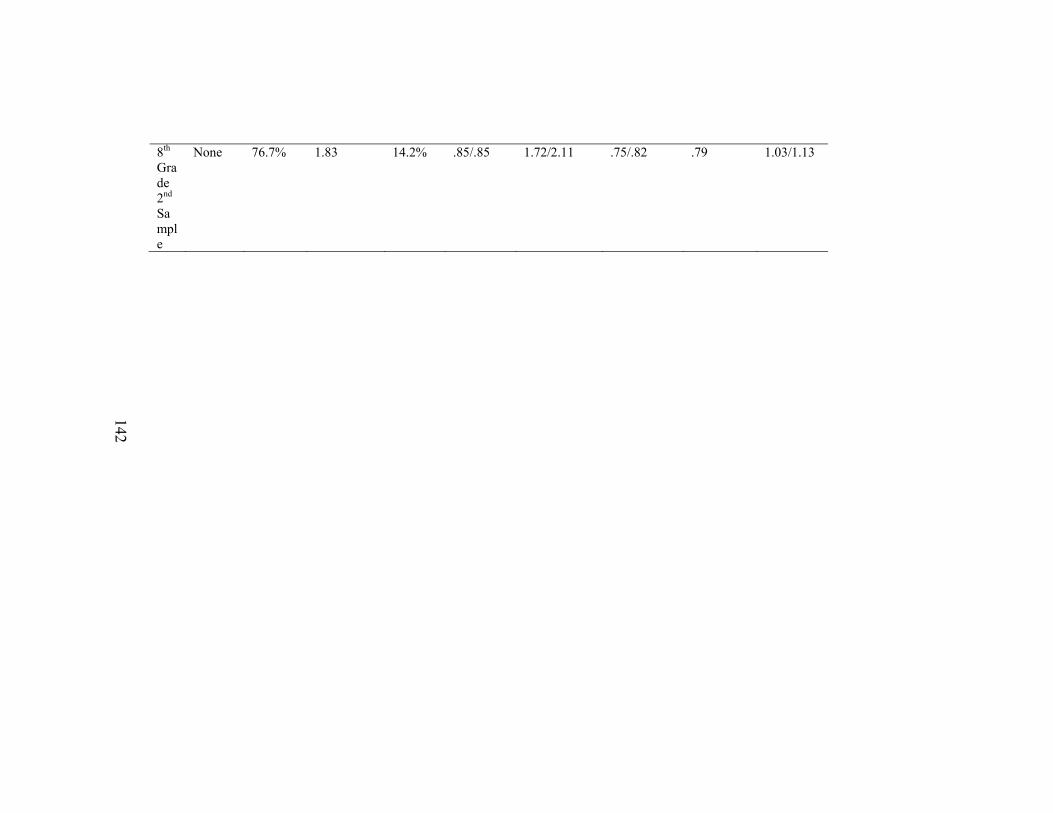
142
8th Grade 2nd Sample
None 76.7% 1.83 14.2% .85/.85 1.72/2.11 .75/.82 .79 1.03/1.13
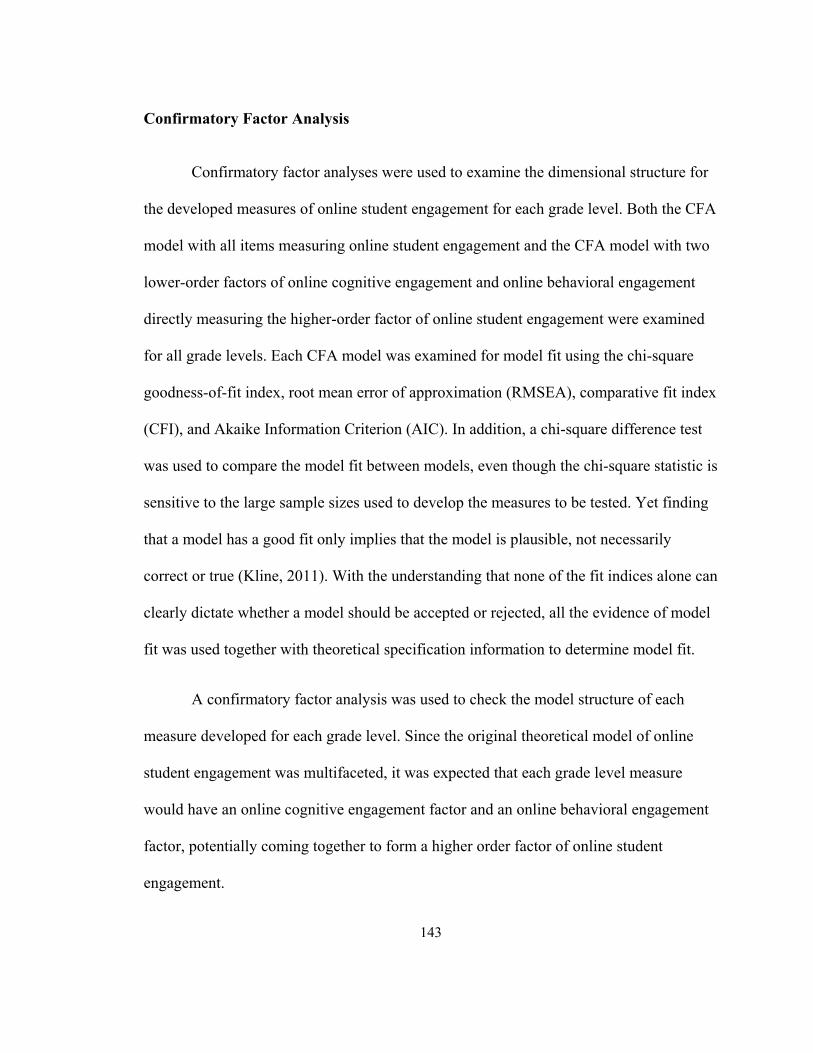
143
Confirmatory Factor Analysis
Confirmatory factor analyses were used to examine the dimensional structure for
the developed measures of online student engagement for each grade level. Both the CFA
model with all items measuring online student engagement and the CFA model with two
lower-order factors of online cognitive engagement and online behavioral engagement
directly measuring the higher-order factor of online student engagement were examined
for all grade levels. Each CFA model was examined for model fit using the chi-square
goodness-of-fit index, root mean error of approximation (RMSEA), comparative fit index
(CFI), and Akaike Information Criterion (AIC). In addition, a chi-square difference test
was used to compare the model fit between models, even though the chi-square statistic is
sensitive to the large sample sizes used to develop the measures to be tested. Yet finding
that a model has a good fit only implies that the model is plausible, not necessarily
correct or true (Kline, 2011). With the understanding that none of the fit indices alone can
clearly dictate whether a model should be accepted or rejected, all the evidence of model
fit was used together with theoretical specification information to determine model fit.
A confirmatory factor analysis was used to check the model structure of each
measure developed for each grade level. Since the original theoretical model of online
student engagement was multifaceted, it was expected that each grade level measure
would have an online cognitive engagement factor and an online behavioral engagement
factor, potentially coming together to form a higher order factor of online student
engagement.
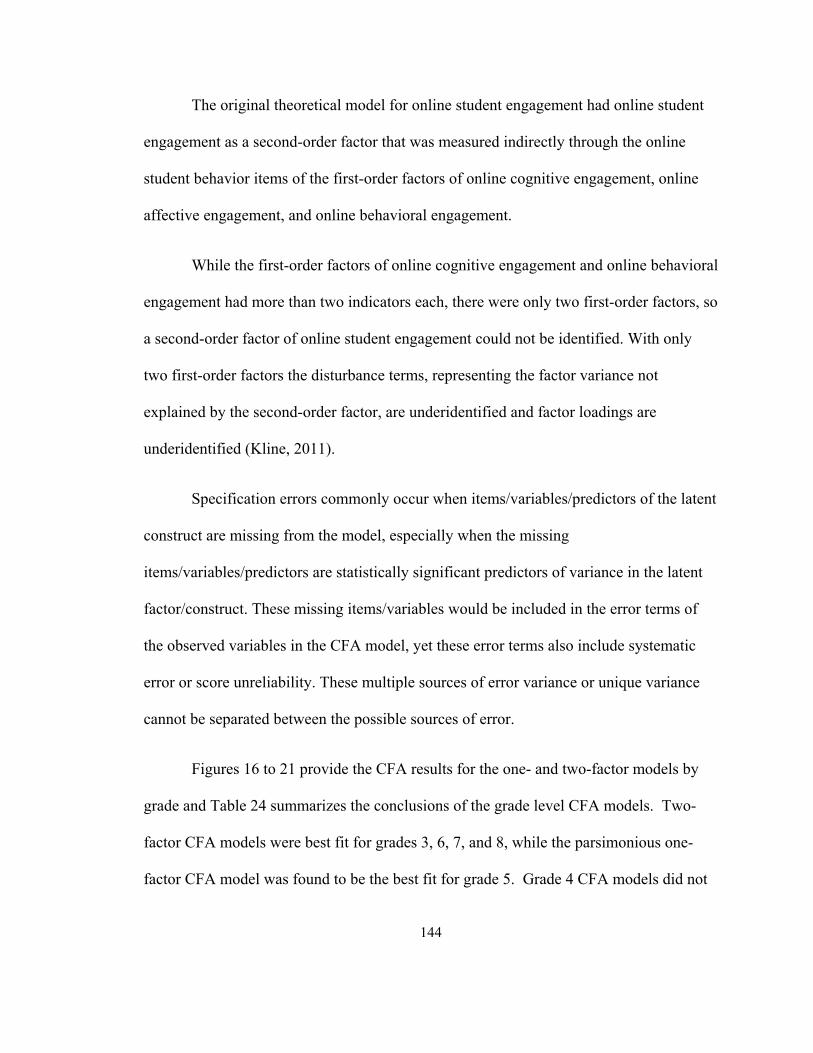
144
The original theoretical model for online student engagement had online student
engagement as a second-order factor that was measured indirectly through the online
student behavior items of the first-order factors of online cognitive engagement, online
affective engagement, and online behavioral engagement.
While the first-order factors of online cognitive engagement and online behavioral
engagement had more than two indicators each, there were only two first-order factors, so
a second-order factor of online student engagement could not be identified. With only
two first-order factors the disturbance terms, representing the factor variance not
explained by the second-order factor, are underidentified and factor loadings are
underidentified (Kline, 2011).
Specification errors commonly occur when items/variables/predictors of the latent
construct are missing from the model, especially when the missing
items/variables/predictors are statistically significant predictors of variance in the latent
factor/construct. These missing items/variables would be included in the error terms of
the observed variables in the CFA model, yet these error terms also include systematic
error or score unreliability. These multiple sources of error variance or unique variance
cannot be separated between the possible sources of error.
Figures 16 to 21 provide the CFA results for the one- and two-factor models by
grade and Table 24 summarizes the conclusions of the grade level CFA models. Two-
factor CFA models were best fit for grades 3, 6, 7, and 8, while the parsimonious one-
factor CFA model was found to be the best fit for grade 5. Grade 4 CFA models did not

145
converge and so grade 4 online student engagement measure was not able to be fully
validated. Recommended future research should include the addition of items, potential
mediators/moderators impacts and affective engagement subscale. With these additions
the grade level models could change further and become more reliable.
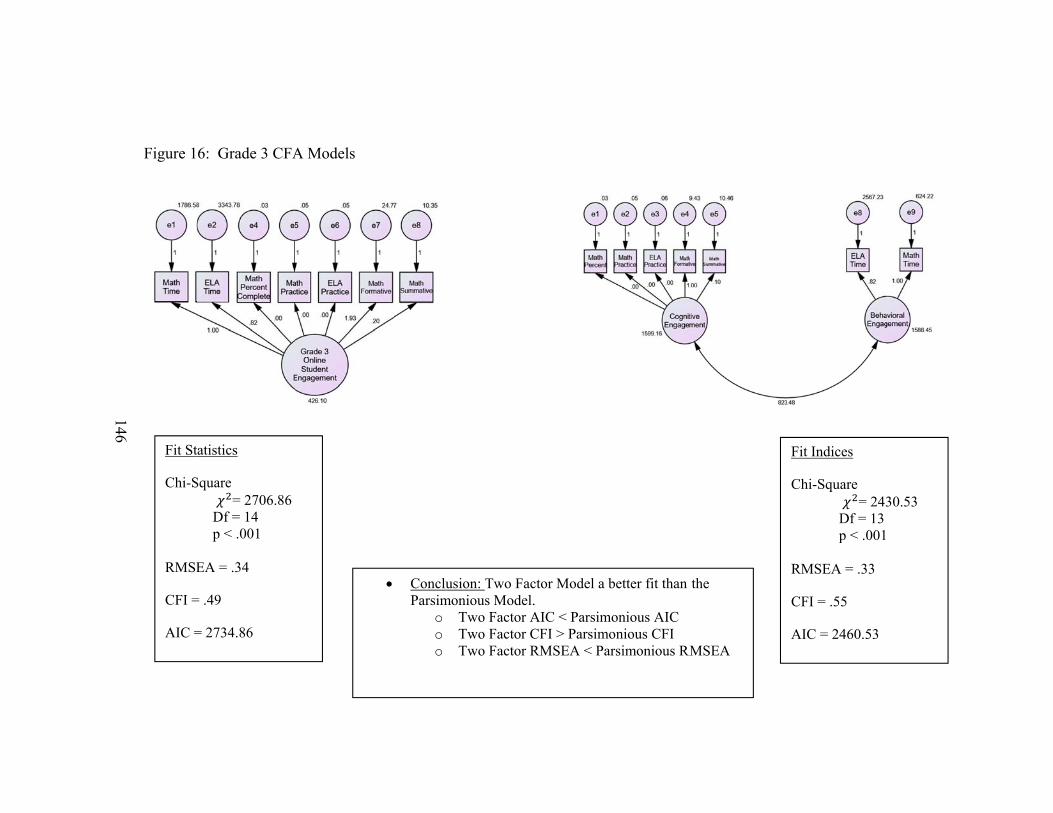
146
Figure 1
Fit St
Chi-S
RMSE
CFI =
AIC =
6: Grade 3 CFA
tatistics
Square = 2706.86 Df = 14 p < .001
EA = .34
= .49
= 2734.86
A Models
Conclusion: TParsimonious
o Two Fo Two Fo Two F
Two Factor ModeModel.
Factor AIC < ParFactor CFI > ParsFactor RMSEA <
l a better fit than
simonious AIC simonious CFI
< Parsimonious R
the
RMSEA
Fit Indices
Chi-Square = 24
Df = 13 p < .001 RMSEA = .33
CFI = .55
AIC = 2460.53
30.53
1

147
Figure 1
7: Grade 4 CFA
A Models
Conclusion: OParsimonious would convergthe data
Evaluation of changes and awill need to octhe future
Only the Model ge for
measure additions ccur in

148
Figure 1
Fit In
Chi-S
RMSE
CFI =
AIC =
8: Grade 5 CFA
ndices
Square = 7997.93 Df = 35 p < .001
EA = .34
= .45
= 8037.93
A Models
Conclusion: Two Factor M
Formative an
Parsimonious MoModel did not connd Math Time we
odel a better fit nverge when Mat
ere used as scalinath ng items
Fit Indices
Chi-Square =
Df = RMSEA =
CFI =
AIC = 111383.7
74

149
Figure 1
Fit In
Chi-S
RMSE
CFI =
AIC =
9: Grade 6 CFA
ndices
Square = 2268.18 Df = 9 p < .001
EA = .52
= .569
= 2292.18
A Models
Conclusion: TParsimonious
o Two Fo Two Fo Two F
Two Factor ModeModel
Factor AIC < ParFactor CFI > ParsFactoe RMSEA <
l a better fit than
simonious AIC simonious CFI < Parsimonious R
the
RMSEA
Fit Indices
Chi-Square = 50
Df = 8 p < .001 RMSEA = .26
CFI = .90
AIC = 535.14
9.14
1
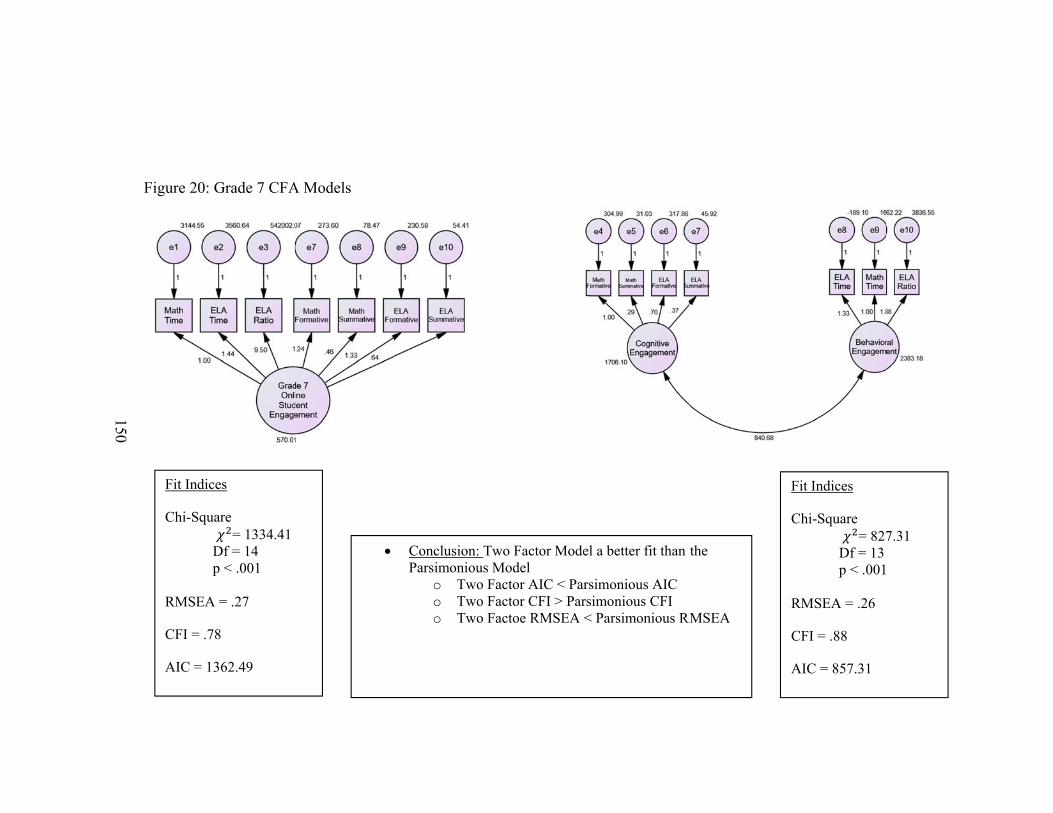
150
Figure 2
Fit In
Chi-S
RMSE
CFI =
AIC =
0: Grade 7 CFA
ndices
Square = 1334.41 Df = 14 p < .001
EA = .27
= .78
= 1362.49
A Models
Conclusion: TParsimonious
o Two Fo Two Fo Two F
wo Factor ModelModel
Factor AIC < ParsFactor CFI > ParsFactoe RMSEA <
l a better fit than
simonious AIC simonious CFI < Parsimonious R
the
RMSEA
Fit Indices
Chi-Square = 82
Df = 13 p < .001 RMSEA = .26
CFI = .88
AIC = 857.31
7.31
1

151
Figure 2
Fit In
Chi-S
RMSE
CFI =
AIC =
1: Grade 8 CFA
ndices
Square = 5344.33 Df = 14 p < .001
EA = .37
= .61
= 5372.33
A Models
Conclusion: TParsimonious
o Two Fo Two Fo Two F
Two Factor ModeModel
Factor AIC < ParFactor CFI > ParsFactoe RMSEA <
l a better fit than
simonious AIC simonious CFI < Parsimonious R
the
RMSEA
Fit Indices
Chi-Square = 28
Df = 13 p < .001 RMSEA = .284
CFI = .790
AIC = 2911.66
81.66
1
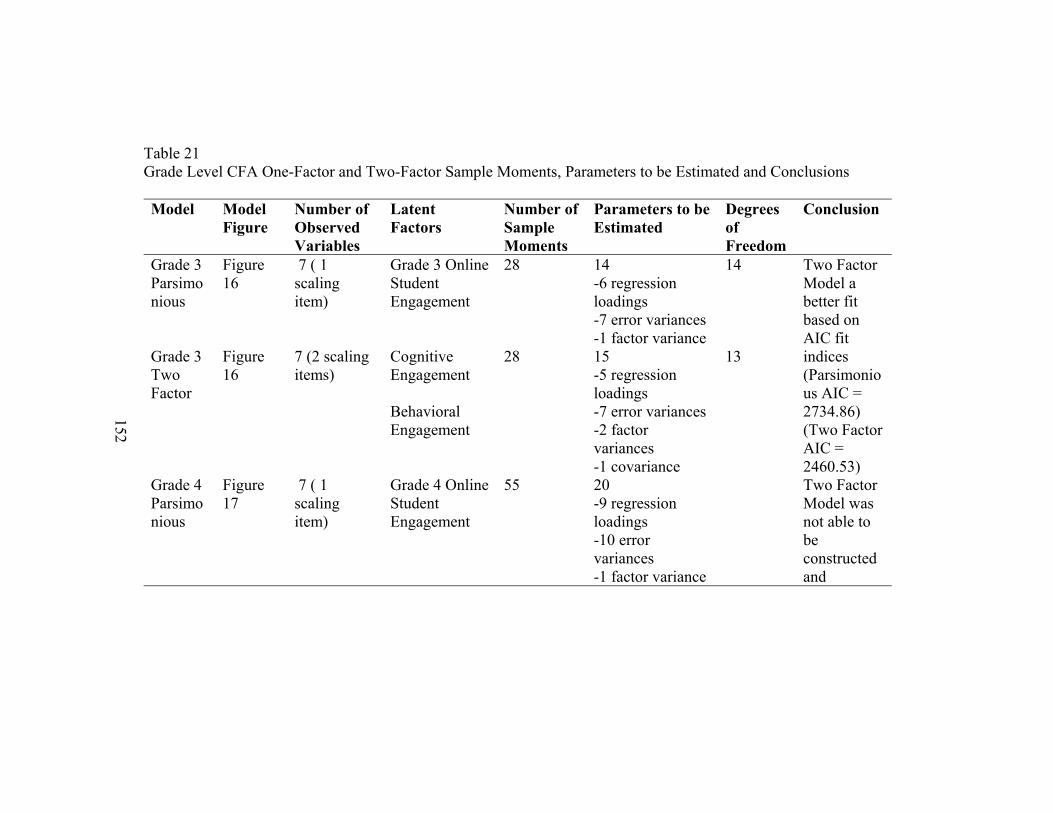
152
Table 21 Grade Level CFA One-Factor and Two-Factor Sample Moments, Parameters to be Estimated and Conclusions Model Model
Figure Number of Observed Variables
Latent Factors
Number of Sample Moments
Parameters to be Estimated
Degrees of Freedom
Conclusion
Grade 3 Parsimonious
Figure 16
7 ( 1 scaling item)
Grade 3 Online Student Engagement
28 14 -6 regression loadings -7 error variances -1 factor variance
14 Two Factor Model a better fit based on AIC fit indices (Parsimonious AIC = 2734.86) (Two Factor AIC = 2460.53)
Grade 3 Two Factor
Figure 16
7 (2 scaling items)
Cognitive Engagement Behavioral Engagement
28 15 -5 regression loadings -7 error variances -2 factor variances -1 covariance
13
Grade 4 Parsimonious
Figure 17
7 ( 1 scaling item)
Grade 4 Online Student Engagement
55 20 -9 regression loadings -10 error variances -1 factor variance
Two Factor Model was not able to be constructed and

153
Grade 4 Two Factor
Figure 17
7 (2 scaling items)
Cognitive Engagement Behavioral Engagement
Model not Possible
Model not Possible
Model not Possible
Parsimonious model generated without fit statistics. Grade 4 Online Student Engagement Model not validated.
Grade 5 Parsimonious
Figure 18
7 ( 1 scaling item)
Grade 5 Online Student Engagement
55 20 -9 regression loadings -10 error variances -1 factor variance
35 Parsimonious Model a better fit based on AIC fit indices. (Parsimonious AIC = 8037.93) (Two Factor AIC = 111383.74)
Grade 5 Two Factor
Figure 18
7 (2 scaling items)
Cognitive Engagement Behavioral Engagement
55 21 -8 regression loadings -10 error variances -2 factor variances -1 covariance
34
Grade 6 Parsimonious
Figure 19
7 ( 1 scaling item)
Grade 6 Online Student Engagement
21 12 -5 regression loadings -6 error variances -1 factor variance
9 Two Factor Model a better fit based on AIC fit
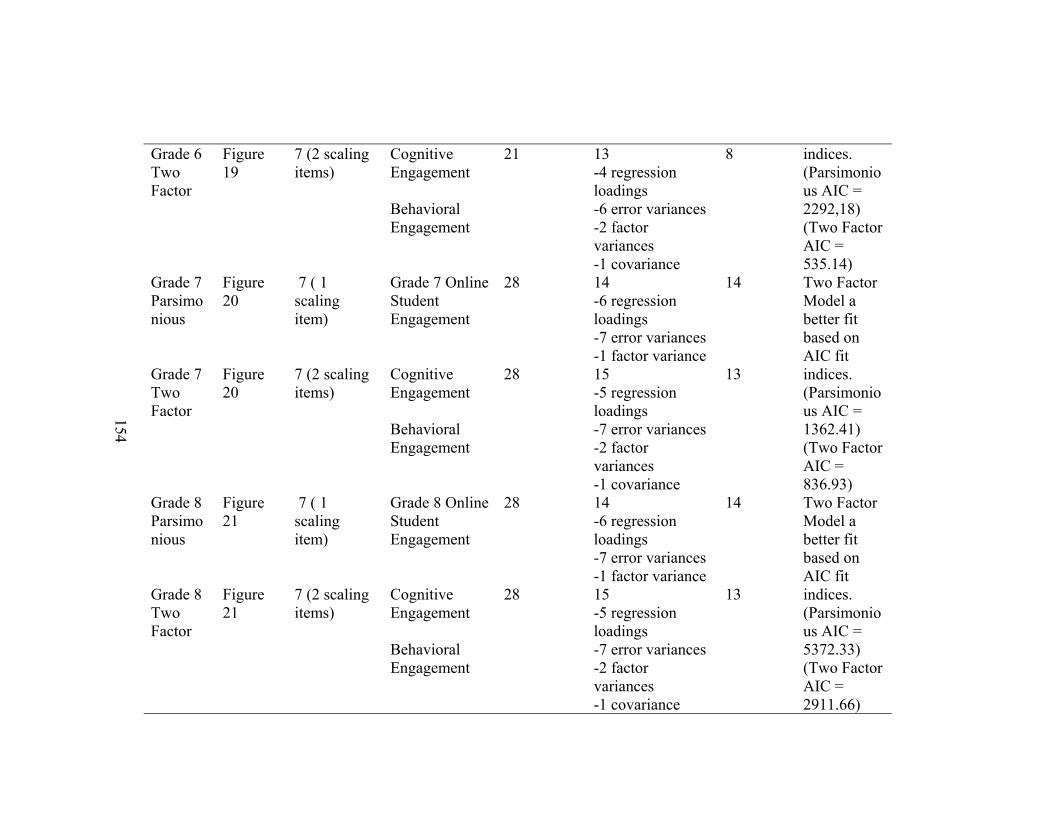
154
Grade 6 Two Factor
Figure 19
7 (2 scaling items)
Cognitive Engagement Behavioral Engagement
21 13 -4 regression loadings -6 error variances -2 factor variances -1 covariance
8 indices. (Parsimonious AIC = 2292,18) (Two Factor AIC = 535.14)
Grade 7 Parsimonious
Figure 20
7 ( 1 scaling item)
Grade 7 Online Student Engagement
28 14 -6 regression loadings -7 error variances -1 factor variance
14 Two Factor Model a better fit based on AIC fit indices. (Parsimonious AIC = 1362.41) (Two Factor AIC = 836.93)
Grade 7 Two Factor
Figure 20
7 (2 scaling items)
Cognitive Engagement Behavioral Engagement
28 15 -5 regression loadings -7 error variances -2 factor variances -1 covariance
13
Grade 8 Parsimonious
Figure 21
7 ( 1 scaling item)
Grade 8 Online Student Engagement
28 14 -6 regression loadings -7 error variances -1 factor variance
14 Two Factor Model a better fit based on AIC fit indices. (Parsimonious AIC = 5372.33) (Two Factor AIC = 2911.66)
Grade 8 Two Factor
Figure 21
7 (2 scaling items)
Cognitive Engagement Behavioral Engagement
28 15 -5 regression loadings -7 error variances -2 factor variances -1 covariance
13
155
Confirmatory factor analyses were used to identify if a two factor model or
parsimonious model of online student engagement was a better fit. All the grade level
measures of online student engagement were validated based on the CFA results. Yet
while for four grade levels- grades 3, 6, 7, and 8- two factor models as determined by the
AIC fit indices (Table X) were the better fitting, for grades 4 and 5 the parsimonious
model fit best as determined by the AIC fit indices . Grades 4 and 5 had the most online
student behavior items included in their measures, with 55 sample moments in each
model. This could suggest that as more items are added to the measures of online student
engagement there were more poorly defined boundaries of measurement between the
components of student engagement--behavioral and cognitive.
The parsimonious models for grades 4 and 5 had 55 sample moments while the
two factor models of grades 3, 4, 6, 7, and 8 had 21 to 28 sample moments. This is the
result of more online student behaviors being included in the models for grade 4 and 5.
While these additional observed variables expand the measure continuum they also cause
the theoretical multidimensionality of online student engagement to not be as clear. As
additional items are added to these grade level measures in future research it will be
pertinent to observe if the two factor models remain multidimensional measures or
become more stable as a parsimonious model. For this research study the measures of
cognitive engagement and behavioral engagement established using IRT were used for
grades 4 and 5, keeping in mind that CFA validation will need to be conducted as the
measures are expanded.
156
Additional CFA Results
Regardless of model type, it was found that the observed variables of Math
Formative Assessments and/or ELA Ratio had the highest regression unstandardized
loading for each of the models. Math Formative Assessment was the most impactful on
level of online student engagement for grades 3, 4, 5, and 6; ELA Time was the second
most impactful on these grades. For grades 3, 4, 5, and 6 the cognitive engagement item
of Math Formative Assessments contributed most to their level of online student
engagement, followed by the behavioral engagement item of ELA Time. For grades 7
and 8, ELA Ratio had the highest regression unstandardized loading, therefore was the
most impactful on the measure of online student engagement. Also for grade 7 and 8
ELA Time was the second most impactful item followed by Math Formative
Assessments and ELA Formative Assessments. This reveals that for grades 7 and 8 the
behavioral engagement items of ELA Ratio and ELA Time have more weight in the
measure of online student engagement than the cognitive engagement item of Math
Formative Assessments.
The behavioral engagement items seemed to be the most unstable since they had
the highest error variances for all grade level models. Two to three behavioral
engagement items (Math Time, ELA Time, and ELA Ratio) were included in each of the
grade level measures and when modeled using CFA had error variances over 1000.
For all grade levels, except grade 4, regardless of whether the parsimonious model is a
better fit, the covariance between cognitive engagement and behavioral engagement was
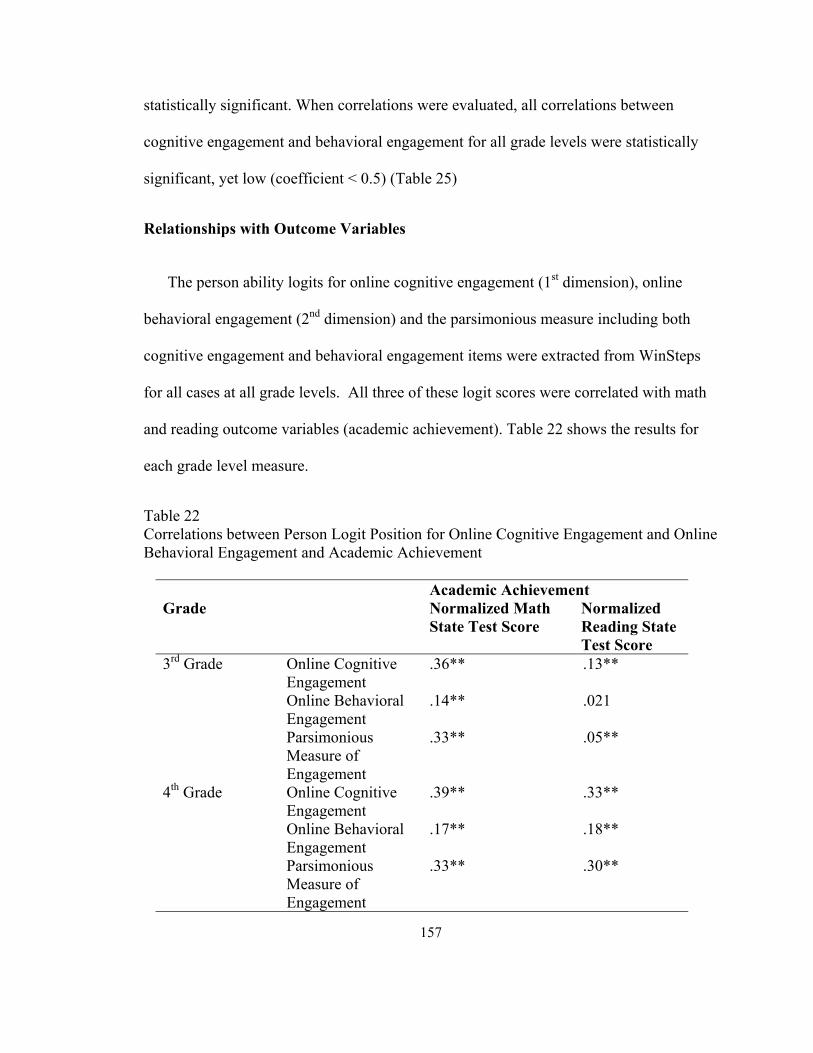
157
statistically significant. When correlations were evaluated, all correlations between
cognitive engagement and behavioral engagement for all grade levels were statistically
significant, yet low (coefficient < 0.5) (Table 25)
Relationships with Outcome Variables
The person ability logits for online cognitive engagement (1st dimension), online
behavioral engagement (2nd dimension) and the parsimonious measure including both
cognitive engagement and behavioral engagement items were extracted from WinSteps
for all cases at all grade levels. All three of these logit scores were correlated with math
and reading outcome variables (academic achievement). Table 22 shows the results for
each grade level measure.
Table 22 Correlations between Person Logit Position for Online Cognitive Engagement and Online Behavioral Engagement and Academic Achievement
Grade
Academic Achievement Normalized Math State Test Score
Normalized Reading State Test Score
3rd Grade Online Cognitive Engagement
.36** .13**
Online Behavioral Engagement
.14** .021
Parsimonious Measure of Engagement
.33** .05**
4th Grade Online Cognitive Engagement
.39** .33**
Online Behavioral Engagement
.17** .18**
Parsimonious Measure of Engagement
.33** .30**
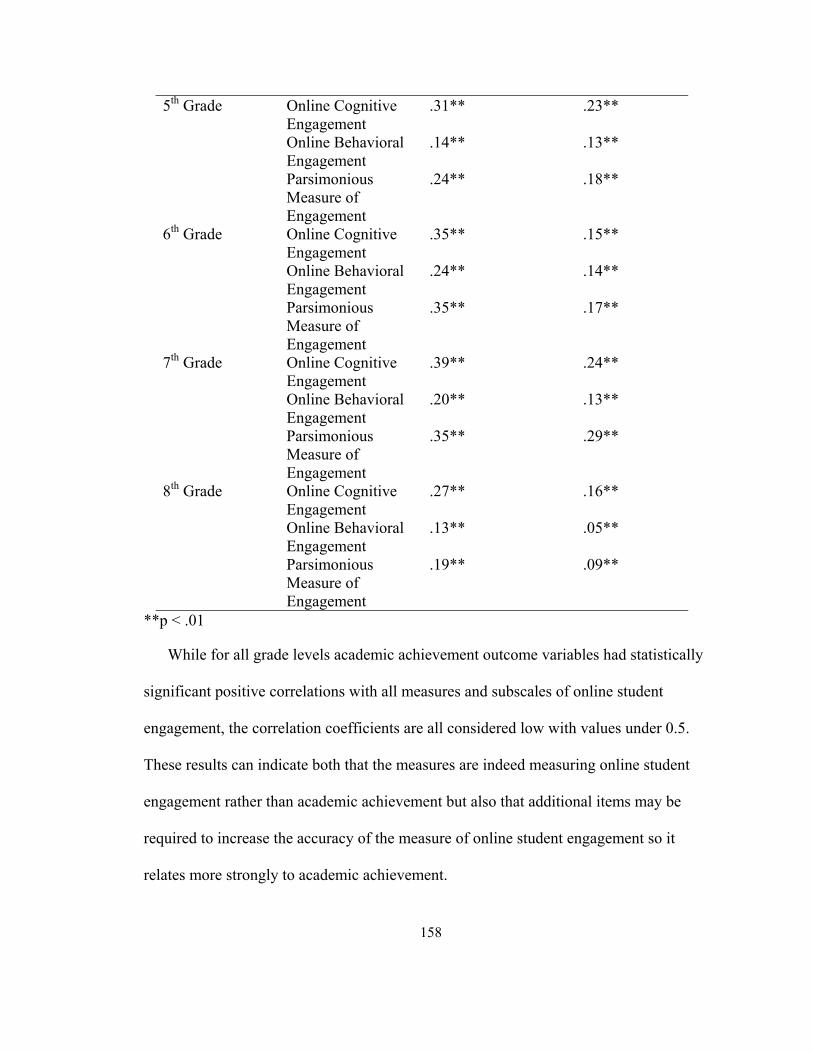
158
5th Grade Online Cognitive Engagement
.31** .23**
Online Behavioral Engagement
.14** .13**
Parsimonious Measure of Engagement
.24** .18**
6th Grade Online Cognitive Engagement
.35** .15**
Online Behavioral Engagement
.24** .14**
Parsimonious Measure of Engagement
.35** .17**
7th Grade Online Cognitive Engagement
.39** .24**
Online Behavioral Engagement
.20** .13**
Parsimonious Measure of Engagement
.35** .29**
8th Grade Online Cognitive Engagement
.27** .16**
Online Behavioral Engagement
.13** .05**
Parsimonious Measure of Engagement
.19** .09**
**p < .01
While for all grade levels academic achievement outcome variables had statistically
significant positive correlations with all measures and subscales of online student
engagement, the correlation coefficients are all considered low with values under 0.5.
These results can indicate both that the measures are indeed measuring online student
engagement rather than academic achievement but also that additional items may be
required to increase the accuracy of the measure of online student engagement so it
relates more strongly to academic achievement.
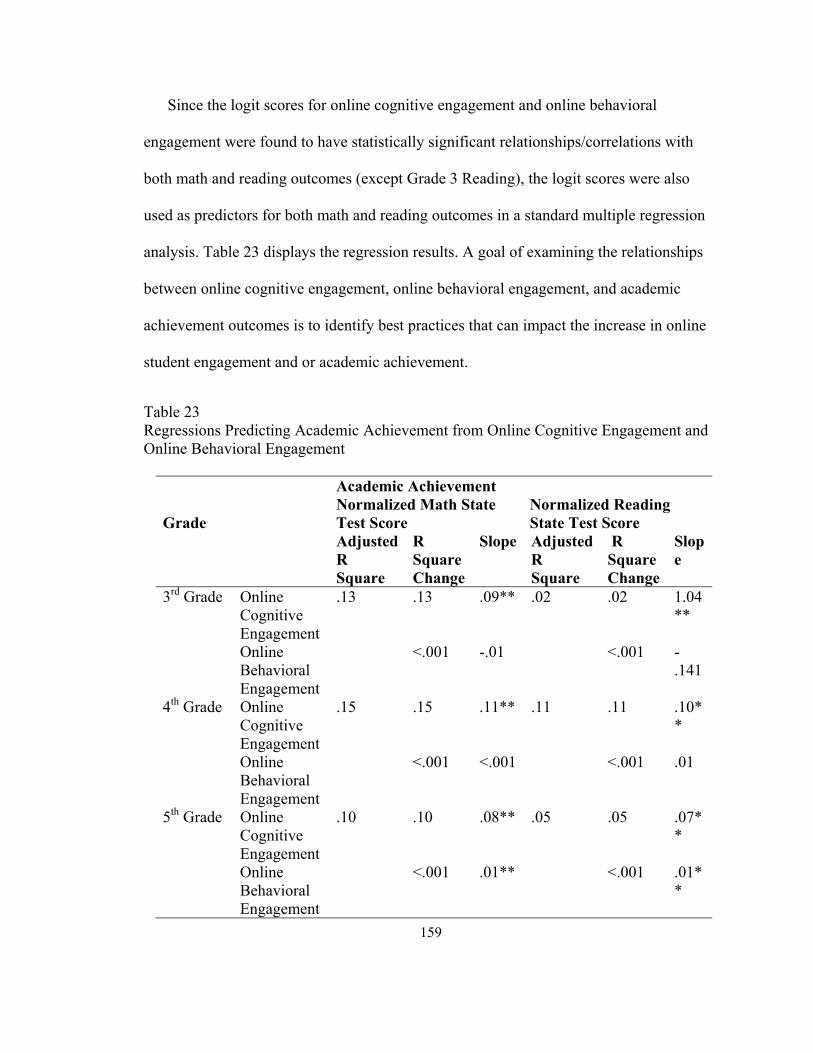
159
Since the logit scores for online cognitive engagement and online behavioral
engagement were found to have statistically significant relationships/correlations with
both math and reading outcomes (except Grade 3 Reading), the logit scores were also
used as predictors for both math and reading outcomes in a standard multiple regression
analysis. Table 23 displays the regression results. A goal of examining the relationships
between online cognitive engagement, online behavioral engagement, and academic
achievement outcomes is to identify best practices that can impact the increase in online
student engagement and or academic achievement.
Table 23 Regressions Predicting Academic Achievement from Online Cognitive Engagement and Online Behavioral Engagement
Grade
Academic Achievement Normalized Math State Test Score
Normalized Reading State Test Score
Adjusted R Square
R Square Change
Slope Adjusted R Square
R Square Change
Slope
3rd Grade Online Cognitive Engagement
.13 .13 .09** .02 .02 1.04**
Online Behavioral Engagement
<.001 -.01 <.001 -.141
4th Grade Online Cognitive Engagement
.15 .15 .11** .11 .11 .10**
Online Behavioral Engagement
<.001 <.001 <.001 .01
5th Grade Online Cognitive Engagement
.10 .10 .08** .05 .05 .07**
Online Behavioral Engagement
<.001 .01** <.001 .01**
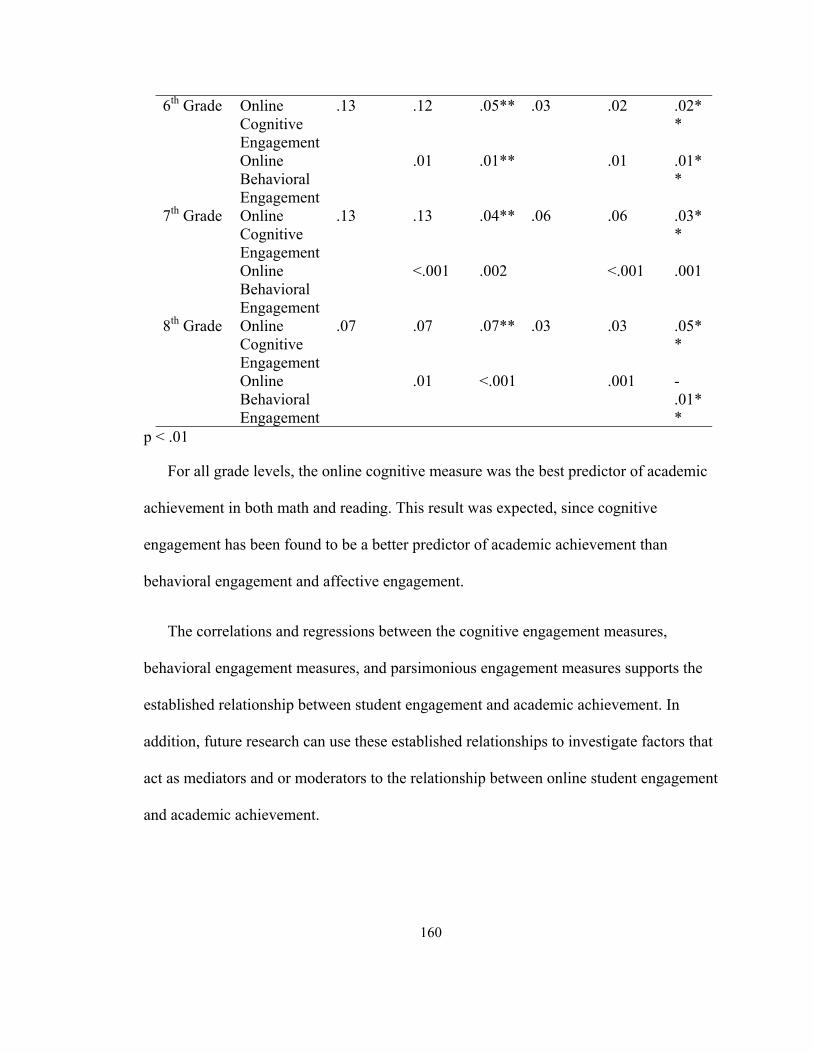
160
6th Grade Online Cognitive Engagement
.13 .12 .05** .03 .02 .02**
Online Behavioral Engagement
.01 .01** .01 .01**
7th Grade Online Cognitive Engagement
.13 .13 .04** .06 .06 .03**
Online Behavioral Engagement
<.001 .002 <.001 .001
8th Grade Online Cognitive Engagement
.07 .07 .07** .03 .03 .05**
Online Behavioral Engagement
.01 <.001 .001 -.01**
p < .01
For all grade levels, the online cognitive measure was the best predictor of academic
achievement in both math and reading. This result was expected, since cognitive
engagement has been found to be a better predictor of academic achievement than
behavioral engagement and affective engagement.
The correlations and regressions between the cognitive engagement measures,
behavioral engagement measures, and parsimonious engagement measures supports the
established relationship between student engagement and academic achievement. In
addition, future research can use these established relationships to investigate factors that
act as mediators and or moderators to the relationship between online student engagement
and academic achievement.
161
Chapter 4: Discussion
Summary of Findings
Research Question:
Does a measure of online student engagement from grade 3 through 8 comprised
of continuous online student behavior items scaled using a polytomous Rasch
partial credit model meet the expectations of dimensionality, model fit, item fit,
construct reliability, and construct validity?
It was found that online student behaviors were useful in creating a measure of
online cognitive engagement and online behavioral engagement but not a fully
comprehensive measure of online student engagement. When measures were developed
for each grade level (grades 3, 4, 5, 6, 7, and 8), dimensionality, model fit, person fit, and
item fit expectations were met. Through reliability assessment at each grade level,
reliability of measures of online cognitive engagement and online behavioral engagement
was supported. Lastly, through the use of confirmatory factor analysis models the
measures were validated as two factor measures of online student engagement.
In the future, other models--such as the continuous response model--and item
categorization processes, such as starting all items with 100 splits regardless of indicator
162
status, -could be used to re-evaluate the possibilities of using continuous online student
behaviors as items in the measure of online student engagement.
Hypothesis 1:
The online student engagement measure for grades 3 through 8 encompasses three
dimensions of student engagement- behavioral, affective, and cognitive-
displaying fit statistics that support a three-factor model over a one-factor model
for the overall measure of online student engagement for grades 3 through 8.
Using a partial credit Rasch model, grade level measures of online cognitive
engagement and online behavioral engagement were established. These measures met
dimensionality, person fit, and item fit expectations, as well as were validated through
using a second random sample. Yet a three factor model was not able to be established
for any of the grade level measures.
A three-factor model was not possible for the online student engagement measure
for grades 3 through 8 since the majority of the affective engagement items were not
included in the measure development process. Future research on how to measure
affective engagement for students in an online learning environment is needed in order to
eventually develop a full three-factor model of student engagement for online students. A
two factor model was established for grades 3, 5, 6, 7, and 8 that was made up of an
online cognitive engagement factor and an online behavioral engagement factor. All of
the loadings/regression weights for the items on each of the latent factors were
statistically significant and the variances of both latent factors were statistically

163
significant for all grades, except for grade 4. These CFA results validate the construct
validity of the measures of online cognitive engagement and online behavioral
engagement for grades 3, 5, 6, 7, and 8. Future research will benecessary in order to
determine the adjustments needed for the measure of grade 4 online student engagement
and to identify additional items that would make the measure continuum more robust for
all measures.
Hypothesis 2:
The online student engagement measure for grades 3 through 8 is invariant across
student special education status and grade level.
To ensure the measure of online student engagement as invariant for grades 3 to
8, two measures were developed for each grade level, an online cognitive engagement
measure and an online behavioral engagement measure. These measures developed in
this research study will require future development as they are made up of weak
indicators. The identification of additional online student engagement items is a part of a
future research plan.
Since each grade level has grade level specific online curriculua, academic
standards, and online behavior expectations, these differences may have led to the
variations in the online student behaviors that required measures to be developed for each
individual grade level. In addition, after examining the nesting effect analyses done for
the outcomes at each grade level it may be that the nesting effect of schools and/or
teachers is having more of an effect on online student behaviors and or differences in
164
online student behaviors than originally anticipated. It was assumed that since each grade
level was using the same curriculum and online platform that the online student behaviors
would be similar enough across schools to be assumed to be equivalent; this may not be
the case. Future research is needed.
The invariance across student online behavior items used in the developed
measures was also evaluated for students receiving special education services. It was
found that for many of the grade level measures there was one or more items that were
found to not be invariant (DIF Contrast > |.64| and p < .05) for students receiving special
education services. This may indicate that there are so many differences in the academic
expectations and curriculum alterations for students receiving special education services
that the online student behavior patterns are not the same as for students receiving general
education services. Future research is needed around the development of measures of
online student engagement, specifically for students receiving special education services.
A separate measure of engagement for students receiving special education services may
be indicated.
Hypothesis 3:
The online student engagement measure for grades 3 through 8 displays
statistically significant positive correlations with academic achievement for any
subscales that make up the measure.
Once the grade-level specific subscale measures for online cognitive engagement
and online behavioral engagement were established, the person ability (online student
165
engagement level) logits were exported from Winsteps and combined with the outcomes
data set. Correlations and regressions were used to examine the relationships between the
logit scores from the new measures and the normalized math and reading outcome
variables. It was found that while all the grade level measures had statistically significant
positive correlations with both outcome variables, these correlations were weak with
Pearson correlation coefficients of less than .5. For all grades, the online cognitive
engagement measures had a higher correlation coefficient with the math and reading
outcomes than the online behavioral engagement measures.
For all grade levels, adjusted r square values were between 0.07 to 0.15 for math
and between .02 and 0.11 for reading. However, the online cognitive engagement scores
(r square change values ranging from 0.02 to 0.11) were more predictive of both math
and reading academic achievement than the online behavioral engagement scores (r
square change values ranging from <.001 to 0.02). The online cognitive engagement
scores were statistically significant predictors for all grade level academic achievement in
both math and reading, while the online behavioral engagement scores were statistically
significant predictors for only grades 5, 6, and 8 in math and reading. Lastly, the math
outcome had stronger relationships (correlations) with and was predicted more strongly
by the online cognitive engagement measure and the online behavioral engagement
measure than the reading outcome for all grade levels.

166
Limitations
The limitations of this study both affected the results and illuminated additional
future research that is necessary in the field of K-12 online learning. Some of the
limitations are embedded within an overarching limitation of assuming learning in an
online learning environment is the same as learning in a brick-and-mortar learning
environment. This assumption has been and continues to be the greatest limitation for
online learning researchers. Within this main assumption are the limitations of:
1. Assuming student behaviors in the online learning environment equate in the
same way as in the brick-and-mortar learning environment
2. Assuming the school nesting effect for academic achievement (measured by state
assessments) of students in schools does not have a significant effect on the
measure development results
3. Assuming relationships between online student behaviors and academic
achievement are linear
It has been assumed that a student behavior such as brick-and-mortar school
attendance is the same as the online student behavior of number of online course logins.
This type of parallel equating has not been empirically tested and may be a source of
error for research results related to online learning environments. For this research study,
the online student behaviors were selected using empirical and theoretical evidence of
similar variables being related to student engagement in brick-and-mortar environments
but the measure of the online student behaviors was not related to the associated brick-

167
and-mortar variables. This limitation of online student behaviors not equating similarly to
brick-and-mortar student behaviors should be the source of future research.
It was found that there were statistically significant school nesting effects for math
achievement (grades 6 and 7) and reading achievement (grades 3 and 6). This means that
10% or more of the variance explained was due to the school enrollment of a student.
While these statistically significant school nesting effects can highlight areas of future
exploration, they should be accounted for and adjusted for in inferential research that
includes multiple schools or multiple states.
There have been research studies that have examined academic achievement in online
learning environments and research studies that have compared academic achievement in
online learning environments to brick-and-mortar learning environments but none of
these studies have mentioned the school nesting effect that could be skewing their results.
For this research study when a school nesting effect was examined for the whole sample
and by grade segments (grades 3 to 5 and grades 6 to 8), the school nesting effect seemed
minimal with less than 10% of the variance in academic achievement (math and reading)
being explained by which school students attended. Yet, examination by grade, showed
that school nesting effect explained more than 10% of the variance in math achievement
for grade 6 and grade 7 and 98% of the variance in 3rd grade reading. This is concerning
when the distribution of the students within the sample plays an important role in the
establishment of the measure continuum. Although having a large school nesting effect
does not indicate that there is a large nesting effect for other variables, it does highlight
the possibility of clustering affecting results. Hedges (2007) demonstrated the use of “a
168
multiplicative factor depending on the total sample size, the cluster size, and the
intraclass correlation” (p. 151) to account for clustering and or nesting effects. This
adjustment or a similar adjustment for a nesting effect should be applied in future
research studies once more is understood about the school level factors contributing to
the school nesting effects.
Although it was found that none of the online student behavior items met all three
requirements of inverted U relationships for math or reading achievement, the fact that
most of the online student behavior items met two of the three inverted U requirements
leads to the question of the possibility of non-linear relationships. Both item response
theory and structural equation modeling assume that the distributions of the online
student behaviors as well as that the online student behavior items have linear
relationships with latent factors and academic achievement. Linearity is a major
assumption/requirement that must be met for both univariate and multivariate statistical
analyses. According to Tabachnick and Fidell (2013) “Pearson’s r only captures the
linear relationships among variables” (p.83) while non-linear relationships are ignored.
When relationships between variables are non-linear, correlation and regression
(foundations for higher statistical models) results are either inflated or deflated and are
always flawed. Inverted U relationships are one of several potential curvilinear
relationships amongst variables. When bivariate scatterplots are examined for (variable;
time or progress) and academic achievement it is clear why it was theorized that some of
the relationships between online student behaviors and academic achievement were
actually non-linear. Yet a main source of non-linear relationships between variables is
169
one or both variables not being normally distributed. A variable that does not have a
normal distribution can have degraded statistical solutions. When future research is
conducted to identify and examine non-linear relationships among online student
behaviors and academic achievement, normality will need to also be extensively
evaluated. Additional research should explore the distribution patterns and relationship
patterns of online student behaviors and academic achievement, then adjustments should
be used before inferential research using these variables is conducted.
In addition to the limitations embedded in the assumption that online learning
environments mimics brick-and-mortar learning environments, there were also
limitations within the process of converting the continuous student behaviors to nominal
items for measure development. When a continuous variable is converted to a nominal
(categorical) variable there is inherently a loss of information. The loss of information
could have led to the shrinking of the measure continuum or focused the measure in order
to find the measurement core of online student engagement for grades 3 through 8. The
identification of only weak indicators (correlation coefficients under .5 with academic
achievement) suggests that more categories or use of the full continuous items would not
have yielded additional separation between persons’ ability. Future research will include
the use of alternative response models, such as the continuous response model, to
compare with the measures developed in this research study.
Coupled with the loss of information from the conversion of continuous variables to
categorical variables is the large amount of missing data. Examination of missing data
found that 88.24% of cases included in the first random sample had at least one missing
170
value and that students who were missing one online student behavior were most likely
missing multiple online student behaviors. Missing data was not removed because it was
assumed that the more online student behaviors that a student lacked the less engaged
they were, leaving students with no online student behaviors as the lowest level of online
student engagement. This assumption leads to the large amount of students with missing
data remaining in the dataset and patterns of missing data not at random. The missing
data not only limited the analyses that were able to be conducted but also introduced
multiple sources of Type I error. If the limitation of missing data only affected one or two
online student behaviors then multiple imputation or other imputation techniques could
be used but in this case all of the online student behavior variables are affected by
missing data making imputation not feasible. For future research, a new engagement
minimum should be established so students who are missing all student behaviors can be
removed from measurement/analyses.
For all grades, for both the first random sample and the second random sample, the
measures of online cognitive engagement and online behavioral engagement had low
person separation values (< 2) (Boone, Staver, & Yale). This indicates that all the
measures had low sensitivity for separation of online student engagement levels and more
items need to be added to both the measure of online cognitive engagement and the
measure of online behavioral engagement.
171
Implications
The research study concentrated on the development of measures of online
student engagement for grades 3 through 8 using tracked online student behaviors as
items. Even with the removal of several items, online student engagement was found to
be multifaceted with a cognitive engagement component and a behavioral engagement
component, although missing the third hypothesized component of affective engagement.
The measures of online student engagement for grades 3 through 8 developed in this
research study have extended the understanding of student engagement in an online
learning environment. The online student engagement measures for grades 3 through 8
are expected to be expanded and solidified then used to support online school decision
making, student intervention developments, and overall improvement of academic
success in an online learning environment. This research could also be used to foster the
identification of student characteristics and behaviors that lead to successful online
academic performance; allowing students to be grouped by potential success online at the
time of enrollment. Utilizing the measures to establish student engagement levels will
provide vital information for schools and teachers on how to make focused improvements
for students (Appleton et al., 2008; Carter, Reschly, Lovlace, Appleton, & Thompson,
2012). In addition, rolling up student engagement levels to get the average student
engagement of a particular grade, student group, or entire school will provide essential
information on how to focus strategies/methods on the improvement in student retention
and academic success (Ett, 2008; Casper, DeLuca, & Estacion, 2012). This research
supports the motivated improvement of the online learning environment.
172
Future Research
This research study has led to the following questions that can be the emphasis of
future research:
1. Would the identification and addition of items to the online cognitive engagement
measure, for all grades, make it more robust, increasing the person separation?
2. Would the identification and addition of items to the online behavioral
engagement measure, for all grades, make it more robust, increasing the person
separation?
3. Would the use of the continuous response model produce a similar measure? How
would this measure differ from the one produced using the polytomous partial
credit Rasch model?
4. Can online affective engagement be measured using data that is already being
collected from the learning management system? Could new online data sources
provide the data needed to measure online affective engagement without the use
of surveys/questionnaires?
5. Do the data generated by students attending synchronous sessions produce online
student behaviors that could be added to the measures of online student
engagement?
6. Do click data generated by students’ navigations through their online courses
produce online student behaviors that could be added to the measures of online
student engagement?
173
7. Do the data generated by students’ online communication with teachers and
classmates produce online student behaviors that could be added to the measures
of online student engagement, in particular representing the factor of affective
engagement?
8. Would establishing a new lowest level of online student engagement other than
students with no online student behavior activity, relieve the limitation due to
missing data? How can amounts of missing data be better accounted for in the
measures of online student engagement?
9. How does cognitive engagement differ in an online learning environment from a
brick-and-mortar learning environment?
10. Could the variability in the normalized/standardized state test scores be
statistically significant and contributing to the weak correlations between online
student engagement and academic achievement?
11. How does behavioral engagement differ in an online learning environment from a
brick-and-mortar learning environment?
12. Can a measure for online student engagement be developed specifically for
students receiving special education services using tracked online student
behaviors as items?
13. What can be learned from school nesting effects in an online learning
environment? How can school nesting effect be accounted for in online learning
empirical research using inferential statistics?
14. In the K-12 online learning environment, what are the strong indicators of
academic achievement when measured using normalized state test scores?
174
15. Can the online student engagement measures developed for grades 3 through 8 be
expanded to kindergarten to grade 2?
16. Can the online student engagement measures developed for grades 3 through 8 be
expanded to high school grades 9 through 12?
17. How does online student engagement relate to student retention?
Value to Practitioners
Every year new strategies, techniques, and resources are developed and released
to practitioners in an effort to grow schools into meeting accountability requirements. Yet
most of these strategies, techniques, and resources were developed in and for brick-and-
mortar learning environments. This research study contributes to the tactics made
specifically for the schools operating in the online learning environment, yet still aligning
with state and federal accountability policy requirements.
Since the second G.W. Bush administration states, districts, schools, and teachers
have been trying to adhere to the No Child Left Behind (NCLB) policy requirements. In
2015, the second Obama administration enhanced NCLB with the Every Student
Succeeds Act (ESSA). While NCLB focused solely on academic achievement, ESSA
attempts to take more of a “whole student” approach to accountability by requiring states
to use both an academic achievement measure (state test scores) and at least one measure
of non-academic accountability. Student engagement is one of the recommendations of a
measure of non-academic accountability. Online K-12 schools are expected to adhere to
and be judged by these policies as well.
175
The online student engagement measures developed in this research study could
assist online schools to meet the non-academic accountability measurement of ESSA, as
well as fit into student support frameworks designed to support students academically and
behaviorally. One example of this type of framework is the Multi-tiered System of
Supports (MTSS). MTSS combines the academic intervention framework of response to
intervention (RtI) with the positive behavioral interventions and supports (PBIS)
framework.
“Successful implementation of MTSS requires schools to implement a continuum of systematic, coordinated, evidence-based practices targeted to being responsive to the varying intensity of needs students have related to their academic and social emotional/behavioral development” (Utley & Oralar, 2015, p. 1).
While the developed measures of online cognitive engagement and online behavioral
engagement can be used as a non-academic indicator for ESSA and help to identify
academic needs as well as contribute malleable items to improve academic achievement,
the future development of a measure for online affective engagement could potentially
support the social emotional/behavioral component of MTSS.
MTSS is made up of five essential components:
1. Team-Driven Shared Leadership
2. Data-Driven Problem Solving and Decision-Making
3. Family, School, and Community Partnering
4. Layered Continuum of Supports
5. Evidence-Based Practices
176
The essential component of Data-Driven Problem Solving and Decision-Making is where
the measure of online student engagement could be the most useful. Online student
engagement levels could be used with academic factors and non-academic factors to
identify problems in student achievement and make decisions to remedy identified
problems. Online student engagement levels could also be used with the other essential
components as an identifier for student grouping for interventions. For example, a student
identified as having a low cognitive engagement level but a high behavioral engagement
level would have a different set of interventions than a student with a high cognitive
engagement level but low behavioral engagement level. Figure 22 shows an example of a
dashboard for identifying grade 8 students who are eligible for free lunch (low
socioeconomic status) and are new to the online learning environment. The graph shows
how many students and which students have high/low cognitive engagement versus
high/low behavioral engagement.
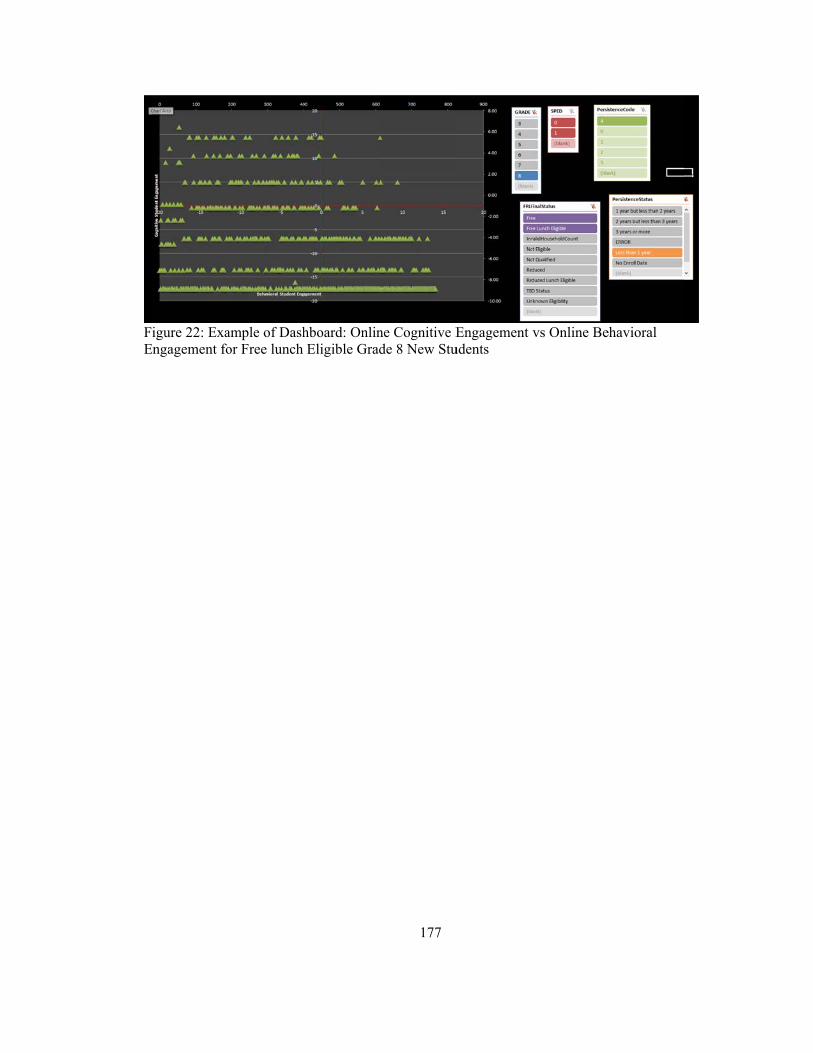
FE
igure 22: ExaEngagement fo
ample of Dashor Free lunch
hboard: OnlinEligible Grad
177
ne Cognitive Ede 8 New Stu
Engagement vudents
vs Online Beehavioral
178
References
Ames, C., & Ames, R. (1984). Research on motivation in education vl. 1 student
motivation. San Diego, CA: Academic Press.
Appleton, J. J., Christenson, S. L., & Furlong, M. J. (2008). Student engagement with
school: Critical conceptual and methodological issues of the construct.
Psychology in the Schools, 45(5), 369-386. doi:10.1002/pits.20303
Appleton, J. J., Christenson, S. L., Kim, D., & Reschly, A. L. (2006). Measuring
cognitive and psychological engagement: Validation of the student engagement
instrument. Journal of School Psychology, 44(5), 427-445.
doi:10.1016/j.jsp.2006.04.002
Axelson, R. D., & Flick, A. (2010). Defining Student Engagement. Change: The
Magazine of Higher Learning, 43(1), 38-43. doi:10.1080/00091383.2011.533096
Axelson, R. D., & Flick, A. (2011). Defining Student Engagement. Change: The
Magazine of Higher Learning, 43(1), 38-43.
Baker, J. G., Rounds, J. B., & Zevon, M. A. (2000). A comparison of graded response
and rasch partial credit models with subjective well-being. Journal of Educational
and Behavioral Statistics, 25(3), 253-270. Retrieved from <Go to
ISI>://WOS:000165131300001
Baker, R. S., Corbett, A. T., & Koedinger, K. R. (2004). Detecting student misuse of
intelligent tutoring systems. Intelligent Tutoring Systems, Proceedings, 3220,
531-540. Retrieved from <Go to ISI>://WOS:000223806300050
179
Bejar, I. (1977). An Applicatio of the Continuous Response Model to Personality
Measurement. Applied Psychological Measurement, 1(4), 509-521.
Bobko, P. (2001). Correlation and regression: Applications for industrial organizational
psychology and management (second ed.). Thousand Oaks, CA: Sage
Publications.
Bond, T., & Fox, C. (2007). Applying The Rasch Model: Fundamental Measurement in
the Human Sciences (2nd ed.). New York: Routledge.
Boone, W. L., Staver, J. R., & Yale, M. S. (2014). Rasch Analysis in the Human
Sciences. New York: Springer.
Bowers, A. J. (2010). Grades and Graduation: A Longitudinal Risk Perspective to
Identify Student Dropouts. Journal of Educational Research, 103(3), 191-207.
Retrieved from <Go to ISI>://WOS:000283883400004
Browne, M., & Cudeck, R. (1993). Alternative ways of assessing model fit Testing
structural equation models (pp. 136-162). Newbury Park, CA: Sage.
Bulger, M. E., Mayer, R. E., Almeroth, K. C., & Blau, S. D. (2008). Measuring Learner
Engagement in Computer-Equipped College Classrooms. Journal of Educational
Multimedia and Hypermedia, 17(2), 129-143. Retrieved from
http://search.proquest.com/docview/61967582?accountid=14608
Cano, D. R. (2015). The effect of engagement on at risk student achievement: A
correlational investigation. (3712155 Ed.D.), Dallas Baptist University, Ann
Arbor. ProQuest Dissertations & Theses Global database.
Caron, S. (2015). Tomorrow's Workforce: What Students Need.
180
Carter, C. P., Reschly, A. L., Lovelace, M. D., Appleton, J. J., & Thompson, D. (2012).
Measuring student engagement among elementary students: pilot of the Student
Engagement Instrument--Elementary Version. Sch Psychol Q, 27(2), 61-73.
doi:10.1037/a0029229
Chapin, J. M. (2008). Assessing the effect of Achieving the Dream activities at Guilford
Technical Community College (NC) on student engagement and success.
(3308325 Ph.D.), The University of Nebraska - Lincoln, Ann Arbor. ProQuest
Central; ProQuest Dissertations & Theses Global database.
Chapman, M., Skinner, E., & Bates, P. (1991). Interpreting correlations between
children's perceived control and cognitive performance: Control, agency, or
mean-ends beliefs? Developmental Psychology, 23, 246-253.
Chen, P. S. D., Gonyea, R., & Kuh, G. D. (2008). Learning at a Distance: Engaged or
Not? Innovate, 4(3), 7-13.
Chen, P. S. D., Lambert, A. D., & Guidry, K. R. (2010). Engaging online learners: The
impact of Web-based learning technology on college student engagement.
Computers & Education, 54(4), 1222-1232. doi:10.1016/j.compedu.2009.11.008
Chi, M. T. H., & Wylie, R. (2014). The ICAP Framework: Linking Cognitive
Engagement to Active Learning Outcomes. Educational Psychologist, 49(4), 219-
243. doi:10.1080/00461520.2014.965823
Coates, H. (2007). A Model of Online and General Campus-Based Student Engagement.
Assessment & Evaluation in Higher Education, 32(2), 121-141.
181
Connell, J. P., & Wellborn, J. G. (1991). Competence, autonomy, and relatedness: A
motivational analysis of self-system processes Self processes and development.
(pp. 43-77): Lawrence Erlbaum Associates, Inc, Hillsdale, NJ.
Cremascoli, K. (2011). Tuning-in to close the gaps: A study of student engagement,
ethnicity and achievement. (3460629 Ph.D.), Capella University, Ann Arbor.
ProQuest Dissertations & Theses Global database.
Dewey, J. (1946). Interest and Effort in Education. Cambridge, MA: The Riverside Press.
Dweck, C., & Elliot, E. (1983). Achievement motivation. In P. Mussen & E.
Hetherington (Eds.), Handbook of child psychology. New York: Wiley.
Ett, J. A. (2008). A study of an outperforming urban high school and the factors which
contribute to its increased academic achievement with attention to the
contribution of student engagement. (3311164 Ed.D.), University of Southern
California, Ann Arbor. ProQuest Central; ProQuest Dissertations & Theses
Global database.
Ferguson, G. (1942). Item selection by the constaint process. Psychometrika, 7, 19-29.
Finn, J. D. (1989). Withdrawing From School. Review of Educational Research, 59(2),
117-142. doi:http://dx.doi.org/10.3102/00346543059002117
Finn, J. D., Folger, J., & Cox, D. (1991). Measuring Participation among Elementary
Grade Students. Educational and Psychological Measurement, 51(2), 393-402.
Finn, J. D., Pannozzo, G., & Voelkl, K. E. (1995). Disruptive and Inattentive-Withdrawn
Behavior and Achievement among Fourth Graders. Retrieved from
182
Finn, J. D., & Zimmer, K. S. (2012). Student engagement: What is it? Why does it
matter? In S. L. Christenson, A. L. Reschly, & C. Wylie (Eds.), The handbook of
research on student engagement (pp. 97-130). New York, NY: Springer.
Fredricks, J. A., Blumenfeld, P. C., & Paris, A. H. (2004). School Engagement: Potential
of the Concept, State of the Evidence (Vol. 74, pp. 59-109): American
Educational Research Association. 1230 17th St. NW, Washington, DC 20036-
3078.
Fredricks, J. A., & McColskey, W. (2012). The measurement of student engagement: A
comparative analysis of various methods and student self-report instruments
Handbook of research on student engagement. (pp. 763-782): Springer Science +
Business Media, New York, NY.
Garcia, T., & Pintrich, P. R. (1995). Assessing Students' Motivation and Learning
Strategies: The Motivated Strategies for Learning Questionnaire. Retrieved from
http://search.proquest.com/docview/62744109?accountid=14608
Gasper, J., DeLuca, S., & Estacion, A. (2012). Switching Schools: Reconsidering the
Relationship Between School Mobility and High School Dropout. Am Educ Res
J, 49(3), 487-519. doi:10.3102/0002831211415250
Gobert, J. D., Baker, R. S., & Wixon, M. B. (2015). Operationalizing and Detecting
Disengagement Within Online Science Microworlds. Educational Psychologist,
50(1), 43-57. doi:10.1080/00461520.2014.999919
Goodman, M., Finnegan, R., Mohadjer, L., Krenzke, T., & Hogan, J. (2013). Literacy,
Numeracy, and Problem Solving in Technology-Rich Environments among U.S.
Adults: Results from the Program for the International Assessment of Adult
183
Competencies 2012. First Look. NCES 2014-008. Retrieved from
http://search.proquest.com/docview/1509085346?accountid=14608
Hamane, A. C. (2014). Student engagement in an online course and its impact on student
success. (3615910 Ed.D.), Pepperdine University, Ann Arbor. ProQuest
Dissertations & Theses Global database.
Handelsman, M., Briggs, W., Sullivan, N., & Towler, A. (2005). A measure of college
student course engagement. The Journal of Educational Research, 184.
Harbaugh, A. G., & Cavanagh, R. F. (2012). Associations between the Classroom
Learning Environment and Student Engagement in Learning 2: A Structural
Equation Modelling Approach. Retrieved from
http://search.proquest.com/docview/1361838513?accountid=14608
Hattie, J. (2009). Visible learning: A synthesis of over 800 meta-analyses related to
achievemebt (1st ed.). New York: Roultledge.
Hektner, J. M., Schmidt, J., & Csikszentmihalyi, M. (2007). Experience sampling
method: Measuring the quality of everyday life. Thousand Oaks, CA: Sage.
Jao, L. (2013). Perceptions, Pedagogies, and Practices: Teacher Perspectives of Student
Engagement in Grade 9 Applied Mathematics Classrooms. (NR96099 Ph.D.),
University of Toronto (Canada), Ann Arbor. ProQuest Dissertations & Theses
Global database.
Katz-Buonincontro, J., & Hektner, J. M. (2014). Using experience sampling methodology
to understand how educational leadership students solve problems on the fly.
Journal of Educational Administration, 52(3), 379-403.
doi:http://dx.doi.org/10.1108/JEA-12-2012-0135

184
Kline, R. (2011). Principles and practice of structural equation modeling (Third ed.). New
York: The Guilford Press.
Kuh, G. D. (2009). The national survey of student engagement: Conceptual and empirical
foundations. New Directions for Institutional Research, 2009(141), 5-20.
doi:10.1002/ir.283
Ladd, G. W., & Birch, S. H. (1997). The Teacher-Child Relationship and Children's Early
School Adjustment. Journal of School Psychology, 35(1), 61-79.
Lam, S. F., Jimerson, S., Wong, B. P., Kikas, E., Shin, H., Veiga, F. H., . . . Zollneritsch,
J. (2014). Understanding and measuring student engagement in school: the results
of an international study from 12 countries. Sch Psychol Q, 29(2), 213-232.
doi:10.1037/spq0000057
Lazarsfeld, P. (1959). Latent structure analysis (Vol. 3). New York: McGraw-Hill.
Leach, L., & Zepke, N. (2011). Engaging students in learning: a review of a conceptual
organiser. Higher Education Research & Development, 30(2), 193-204.
doi:10.1080/07294360.2010.509761
Lemke, M., & Gonzales, P. (2006). U.S. Student and Adult Performance on International
Assessments of Educational Achievement. Findings from "The Condition of
Education, 2006." NCES 2006-073 (pp. 35): ED Pubs, P.O. Box 1398, Jessup,
MD 20794-1398.
Lemke, M., Sen, A., Pahlke, E., Partelow, L., Miller, D., Williams, T., . . . Jocelyn, L.
(2004). International Outcomes of Learning in Mathematics Literacy and Problem
Solving: PISA 2003 Results from the U.S. Perspective. Highlights. NCES 2005-
003 (pp. 133): ED Pubs, P.O. Box 1398, Jessup, MD 20794-1398.
185
Lerma, M. d. P. (2010). Wired and engaged?: Student engagement in online learning at
the community college level. (3472523 Ed.D.), California State University, Long
Beach, Ann Arbor. ProQuest Central; ProQuest Dissertations & Theses Global
database.
Linacre, J. M. (2002). Optimizing rating scale category effectiveness. J Appl Meas, 3(1),
85-106. Retrieved from http://www.ncbi.nlm.nih.gov/pubmed/11997586
Linacre, J. M. (2015). Winsteps Manual (Version 3.91.0).
Lord, F. (1952). A theory of test scores. Psychometrika Monograph, 7.
Masters, G. N. (1982). A Rasch Model for Partial Credit Scoring. Psychometrika, 47(2),
149-174. doi:Doi 10.1007/Bf02296272
McIver, D., Stipek, D., & Daniels, D. (1991). Explaining within-semester changes in
student effort in junior high school and senior high school courses. Journal of
Educational Psychology, 83, 201-211.
McNeal, K. S., Spry, J. M., Mitra, R., & Tipton, J. L. (2014). Measuring Student
Engagement, Knowledge, and Perceptions of Climate Change in an Introductory
Environmental Geology Course. Journal of Geoscience Education, 62(4), 655-
667.
Meece, J. L., Blumenfeld, P. C., & Hoyle, R. (1988). Student's Goal Orientations and
Cognitive Engagementin Classroom Axtivities. Journal of Educational
Psychology, 80(4), 514-523.
Meece, J. L., Blumerfeld, P., & Hoyle, R. (1988). Students' Goal Orientations and
Cognitive Engagement in Classroom Activities. Journal of Educational
Psychology, 80(4), 514-523.
186
Morris, L. V., Finnegan, C., & Wu, S.-S. (2005). Tracking Student Behavior, Persistence,
and Achievement in Online Courses. Internet and Higher Education, 8(3), 221-
231.
Morris, L. V., Wu, S.-S., & Finnegan, C. L. (2005). Predicting Retention in Online
General Education Courses. American Journal of Distance Education, 19(1), 23-
36. doi:10.1207/s15389286ajde1901_3
Nicholls, J. (1984). Achievement motivation: Conceptions of ability, subjective
experience, task choice, and performance. Psychological Review, 91, 328-346.
Ostini, R., Finkelman, M., & Nering, M. (2015). Selecting Among Polytomous IRT
Models Handbook of item response theory modeling: Applications to typical
performance assssment (pp. 285-304).
Peterson, P., Swing, S., Stark, K., & Waas, G. (1984). Student's cognitions and time on
task during mathematics instruction. American Educational Research Journal,
21(3), 487-515.
Pierson, L., & Connell, J. (1992). Effect of Grade Retention on Self-System Processes,
School Engagement, and Academic Performance. Journal of Educational
Psychology, 84(3), 300-307.
Pintrich, P. R., & De Groot, E. V. (1990). Motivational and Self-Regulated Learning
Components of Classroom Academic Performance. Journal of Educational
Psychology, 82(1), 33-40.
Ramirez, A., & Cox, C. (2012). Improving on the Range Rule of Thumb. Rose-Hulman
Undergraduate Mathematics Journal, 13(2).
187
Schiefele, U. (1991). Interest learning and motivation. Educational Psychologist, 26, 299-
324.
Schunk, D. (1991). Self-efficacy and academic motivation. Educational Psychology, 26,
207-232.
Shernoff, D., Csikszentmihalyi, M., Schneider, B. L., & Shernoff, E. (2003). Student
Engagement in High School Classrooms from the Perspective of Flow Theory.
School Psychology Quarterly, 18(2), 158-176.
Shernoff, D., & Schmidt, J. (2008). Further Evidence of Engagement-Acheievement
Paradox Among U.S. High School Students. J Youth Adolescence, 37, 564-580.
Sinclair, M. F., Christenson, S. L., Lehr, C. A., & Anderson, A. R. (2003). Facilitating
student learning and engagement: Lessons from Check & Connect longitudinal
studies. The California School Psychologist, 8, 29-41.
Singh, S. (2015). Testing links between stereotype awareness, student engagement and
academic achievement for immigrantorigin young adults in community colleges:
A theoretically grounded analysis. (3682320 Ph.D.), New York University, Ann
Arbor. ProQuest Dissertations & Theses Global database.
Skinner, E., & Belmont, M. (1993a). Motivation in the Classroom: Reciprocal Effects of
Teacher Behavior and Student Engagement Access. Journal of Educational
Psychology, 85(4), 571-581.
Skinner, E., & Belmont, M. (1993b). Motivation in the classroom: Reciprocal effects of
teacher behavior and students engagement across the school-year. Journal of
Educational Psychology, 85(4), 571-581.
188
Skinner, E., Furrer, C., Marchand, G., & Kindermann, T. (2008). Engagement and
disaffection in the classroom: Part of a larger motivational dynamic? Journal of
Educational Psychology, 100(4), 765-781. doi:10.1037/a0012840
Spanjers, D. M., Burns, M. K., & Wagner, A. R. (2008). Systematic Direct Observation
of Time on Task as a Measure of Student Engagement. Assessment for Effective
Intervention, 33(2), 120-126.
Stokes, S. B. S. (2011). The Relationship between Suspension, Student Engagement, and
Dropout. (3457217 Ph.D.), University of Minnesota, Ann Arbor. ProQuest
Dissertations & Theses Global database.
Turner, J., & Meyer, D. (2000). Studying and understanding the instructional context of
classroom: Using our past to forge our future. Educational Psychologist, 35, 69-
85.
Voelkl, K. E. (1997). Identification with school. Journal of Education(105), 204-319.
Watson, J. (2015). Keeping pace with K-12 digital learning: An annual review of policy
and practice. Retrieved from
Weiner, B. (1986). An attributional theory of motivation and emotion. New York:
Springer-Verlag.
Weisz, J., & Cameron, A. (1985). Individual differences in student's sense of control
(Vol. 2, pp. 93-145). San Diego, CA: Academic Press.
Wigfield, A., Guthrie, J., Perenchevich, K., Taboala, A., Klanda, S., McCrae, A., &
Barbosa, P. (2008). Role of reading engagement in mediating effects of reading
comprehension instruction on reading outcomes. Psychology in the Schools, 45,
432-445.

189
Wigfield, A., & Karpathian, M. (1991). Who am I and what can I do? Children's self-
concepts and motivation in academic situations. Educational Psychologist, 26,
237-262.
Wright, B. D. (1994). Rasch Factor Analysis. Retrieved from MESA, Education,
University of Chicago:
Wright, B. D. (1996). Comparing Rasch Measurement and Factor Analysis. Structural
Equation Modeling: A Multidisciplinary Journal, 3(1), 3-24.
Yair, G. (2000). Educational battlefields in America: The tug of war over students'
engagement with instruction. Sociology of Education, 73, 247-269.
Yazzie-Mintz, E. (2007). Voices of students on engagement: A report on the 2006 high
school survey of student engagement. Retrieved from Bloomington, IN:
Zopluoglu, C. (2012). EstCRM: An R Package for Samejima's Continuous IRT Model.
Applied Psychological Measurement, 36(2), 149-150.
doi:10.1177/0146621612436599
Zopluoglu, C. (2013). A comparison of two estimation algorithms for Samejima's
continuous IRT model. Behav Res Methods, 45(1), 54-64. doi:10.3758/s13428-
012-0229-6
190
Appendix A: Glossary of Terms
Ability The level of successful performance of the objects of measurement (persons) on the latent variable. Each person's location on the unidimensional variable measured in "additive Rasch units", usually logits
Ability estimate
The location of a person on a variable, inferred by using the collected observations (Bond & Fox, 2007)
Additive scale
Scale of measurement in which the units have the properties of simple addition, so that "one more unit = the same amount extra regardless of the amount you already have". Typical measuring devices such as tape measures and thermometers have additive scales. Rasch additive scales are usually delineated in logits
Bias
A change in logit values based on the particular agents or objects measured
BOTTOM The value shown in the Results Table for an agent on which all objects were successful, (so it was of bottom difficulty), or for an object which had no success on any agent (so it was of bottom ability)
Bottom Category the response category at which no level of successful performance has been manifested
Calibration a difficulty measure in logits used to position the agents of measurement (usually test items) along the latent variable
Cell Location of data in the spreadsheet, given by a column letter designation and row number designation e.g. B7
Classical Test Theory Item analysis in which the raw scores are treated as additive numbers
Common person equating
The procedure that allows the difficulty estimates of two different groups of items to be plotted on a single scale when the two tests have been used on a common group of persons. (Bond & Fox, 2007)

191
Common test equating
The procedure that allows the ability estimates of two different groups of people to be plotted on a single scale when the two tests have been used on a common group of persons. (Bond & Fox, 2007)
Complete data Data in which every persons responds to every item. It makes a completely-filled rectangular data matrix. There are no missing data.
Construct validity
The correlation between the item difficulties and the latent trait as intended by the test constructor. "Is the test measuring what it is intended to measure?"
Continuation line A separate line of text which Winsteps analyses as appended to the end of the previous line. These are shown with "+".
Contrast component In the principal components analysis of residuals, a principal component (factor) which is interpreted by contrasting the items (or persons) with opposite loadings (correlations) on the component.
Control file A DOS-text file on your disk drive containing the Winsteps control variables.
Convergence
The point at which further improvement of the item and person estimates makes no useful difference in the results. Rasch calculation ends at this point.
CTT Classical Test Theory
Deterministic Exactly predictable without any uncertainty. This contrasts with Probabilistic.
Dichotomous Response A response format of two categories such as correct-incorrect, yes-no, agree-disagree.
DIF Differential item functioning Change of item difficulty depending on which person classification-group is responding to the item, also called "item bias"
192
Difficulty
The level of resistance to successful performance of the agents of measurement on the latent variable. An item with high difficulty has a low marginal score. The Rasch item difficulty is the location on the unidimensional latent variable, measured in additive Rasch units, usually logits. Item difficulty measures are the locations on the latent variable (Rasch dimension) where the highest and lowest categories of the item are equally probable, regardless of the number of categories the item has.
Dimension A latent variable which is influencing the data values.
Disturbance One or more unexpected responses.
Diverging The estimated calibrations at the end of an iteration are further from convergence than at the end of the previous iteration.
Easiness The level of susceptibility to successful performance of the agents of measurement on the latent variable. An item with high easiness has a high marginal score.
Eigenvalue The value of a characteristic root of a matrix, the numerical "size" of the matrix
Element Individual in a facet, e.g., a person, an item, a judge, a task, which participates in producing an observation.
Equating Putting the measures from two tests in the same frame of reference
Error The difference between an observation and a prediction or estimation; the deviation score (Bond & Fox, 2007)
Error estimate
The difference between the observed and the expected response associated with item difficulty or person ability. (Bond & Fox, 2007)

193
Estimate
A value obtained from the data. It is intended to approximate the exactly true, but unknowable value.
Expected value Value predicted for this situation based on the measures
Expected Response The predicted response by an object to an agent, according to the Rasch model analysis.
Extreme item An item with an extreme score. Either everyone in the sample scored in the top category on the item, or everyone scored in the bottom category. An extreme measure is estimated for this item, and it fits the Rasch model perfectly, so it is omitted from fit reports.
Extreme person A person with an extreme score. This person scored in the top category on the every item, or in the bottom category on every item. An extreme measure is estimated for this person, who fits the Rasch model perfectly, so is omitted from fit reports.
Facet The components conceptualized to combine to produce the data, e.g., persons, items, judges, tasks.
Fit The degree of match between the pattern of observed responses and the modeled expectations. This can express either the pattern of responses observed for a candidate on each item (person fit) or the pattern for each item on all persons (item fit). (Bond & Fox, 2007)
Fit Statistic
A summary of the discrepancies between what is observed and what we expect to observe.
Frame of reference The measurement system within which measures are directly comparable
Hypothesis test Fit statistics report on a hypothesis test. Usually the null hypothesis to be tested is something like "the data fit the model", "the means are the same", "these is no DIF". The null hypothesis is rejected if the results of the fit test are significant
194
(p≤.05) or highly significant (p≤.01). The opposite of the null hypothesis is the alternate hypothesis.
Imputed data Data generated by the analyst or assumed by the analytical process instead of being observed.
Independent Not dependent on which particular agents and objects are included in the analysis. Rasch analysis is independent of agent or object population as long as the measures are used to compare objects or agents which are of a reasonably similar nature.
Infit An information-weighted or inlier-sensitive fit statistic that focuses on the overall performance of an item or person, i.e., the information-weighted average of the squared standardized deviation of observed performance from expected performance. The statistic plotted and tabled by Rasch is this mean square normalized.
Infit mean square One of the two alternative measures that indicate the degree of fit of an item or a person (the other being standardized infit). Infit mean square is a transformation of the residuals, the difference between the predicted and the observed, for easy interpretation. Its expected value is 1. As a rule of thumb, values between 0.70 and 1.30 are generally regarded as acceptable. Values greater than 1.30 are termed misfitting, and those less than 0.70 as overfitting. (Bond & Fox, 2007)
Interval scale
Scale of measurement on which equal intervals represent equal amounts of the variable being measured. Rasch analysis constructs interval scales with additive properties.
Invariance The maintenance of the identity of a variable from one occasion to the next. For example, item estimates remain stable across suitable samples; person estimates remain stable across suitable tests.
Item Agent of measurement (prompt, probe, "rating scale"), not necessarily a test question, e.g., a product rating. The items define the intended latent trait.
Item characteristic curve (ICC) An ogive-shaped plot of the probabilities of a correct response on an item for any value of the underlying trait in a respondent. (Bond & Fox, 2007)
195
Item difficulty
An estimate of an item’s underlying difficulty calculated from the total number of persons in an appropriate sample who succeeded on that item. (Bond & Fox, 2007)
Item fit statistics
Indices that show the extent to which each item performance matches the Rasch-modeled expectations. Fitting items imply a unidimensional variable. (Bond & Fox, 2007)
Item reliability index
The estimate of the replicability of item placement within a hierarchy of items along the measured variable if these same items were to be given to another sample of comparable ability. Analogous to Cronbach’s alpha, it is bounded by 0 and 1. (Bond & Fox, 2007)
Item separation index
An estimate of the spread or separation of items on the measured variable. It is expressed in standard error units, that is, the adjusted item standard deviation divided by the average measurement error. (Bond & Fox, 2007)
Iteration
One run through the data by the Rasch calculation program, done to improve estimates by minimizing residuals.
Latent Trait The idea of what we want to measure. A latent trait is defined by the items or agents of measurement used to elicit its manifestations or responses.
Local independence The items of a test are statistically independent of each sub-population of examinees whose members are homogenous with respect to the latent trait measured. (Bond & Fox, 2007)
Local origin
Zero point we have selected for measurement, such as sea-level for measuring mountains, or freezing-point for Celsius temperature. The zero point is chosen for convenience (similarly to a "setting-out point"). In Rasch measurement, it is often the average difficulty of the items.
Logit "Log-odds unit": the unit of measure used by Rasch for calibrating items and measuring persons on the latent variable. A logarithmic transformation of the ratio
196
of the probabilities of a correct and incorrect response, or of the probabilities of adjacent categories on a rating scale.
Logistic curve-fitting An estimation method in which the improved value of an estimate is obtained by incrementing along a logistic ogive from its current value, based on the size of the current raw-score residual.
Logistic ogive The relationship between additive measures and the probabilities of dichotomous outcomes.
Logit-linear The Rasch model written in terms of log-odds, so that the measures are seen to form a linear, additive combination
Map A bar chart showing the frequency and spread of agents and objects along the latent variable.
Mean-square Also called the relative chi-square and the normed chi-square. A mean-square fit statistic is a chi-square statistic divided by its degrees of freedom (d.f.). Its expectation is 1.0. Values below 1.0 indicate that the data are too predictable = overly predictable = overfit of the data to the model. Values above 1.0 indicate the data too unpredictable = underfit of the data to the model
Measure/Measurement The location (usually in logits) on the latent variable. The Rasch measure for persons is the person ability. The Rasch measure for items is the item difficulty.
Misfit Any difference between the data the model predictions. Misfit usually refers to "underfit". The data are too unpredictable.
Missing data Data which are not responses to the items. They can be items which the examinees did not answer (usually score as "wrong") or items which were not administered to the examinee (usually ignored in the analysis).
Model
Mathematical conceptualization of a relationship
197
Muted Overfit to the Rasch model. The data are too predictable. The opposite is underfit, excessive noise.
Noise 1. Randomness in the data predicted by the Rasch model. 2. Underfit: excessive unpredictability in the data, perhaps due to excessive randomness or multidimensionality.
Normalized 1. The transformation of the actual statistics obtained so that they are theoretically part of a unit-normal distribution. "Normalized" means "transformed into a unit-normal distribution". We do this so we can interpret the values as "unit-normal deviates", the x-values of the normal distribution. Important ones are ±1.96, the points on the x-axis for which 5% of the distribution is outside the points, and 95% of the distribution is between the points. 2. Linearly adjusting the values so they sum to a predetermined amount. For instance, probabilities always sum to 1.0.
Odds ratio Ratio of two probabilities, e.g., "odds against" is the ratio of the probability of losing (or not happening) to the probability of winning (or happening).
Outfit An outlier-sensitive fit statistic that picks up rare events that have occurred in an unexpected way. It is the average of the squared standardized deviations of the observed performance from the expected performance. Rasch plots and tables use the normalized unweighted mean squares so that the graphs are symmetrically centered on zero.
Outliers Unexpected responses usually produced by agents and objects far from one another in location along the latent variable.
Overfit The data are too predictable. There is not enough randomness in the data. This may be caused by dependency or other constraints.
Perfect score Every response "correct" or the maximum possible score. Every observed response in the highest category.
Person The object of measurement, not necessarily human, e.g., a product.
198
Person fit statistics Indices that estimate the extent to which the responses of any person conform to the Rasch model expectation. (Bond & Fox, 2007)
Person measure/Person ability
An estimate of a person’s underlying ability based on that person’s performance on a set of items that measure a single trait. It is calculated from the total number of items to which the person responses successfully in an appropriate test. (Bond & Fox, 2007)
Person reliability index
The estimate of the reliability of person placement that can be expected if this sample of persons were to be given another set of items measuring the same construct. Analogous to Chronbach’s alpha, it is bounded by 0 and 1. (Bond & Fox, 2007)
Person separation index
An estimate of the spread or separation of persons on the measured variable. It is expressed in standard error units, that is, the adjusted person standard deviation divided by the average measurement error. (Bond & Fox, 2007)
Point-measure correlation (PT-MEASURE, PTMEA)
The correlation between the observations in the data and the measures of the items or persons producing them.
Polarity The direction of the responses on the latent variable. If higher responses correspond to more of the latent variable, then the polarity is positive. Otherwise the polarity is negative.
Polytomous response Responses in more than two ordered categories, such as Likert rating-scales.
Predictive validity This is the amount of agreement between results obtained by the evaluated instrument and results obtained from more directly, e.g., the correlation between success level on a test of carpentry skill and success level making furniture for customers. "Do the person measures correspond to more and less of what we are looking for?"
Probabilistic Predictable to some level of probability, not exactly. This contrasts with Deterministic.

199
Rasch measure linear, additive value on an additive scale representing the latent variable
Rasch Model A mathematical formula for the relationship between the probability of success (P) and the difference between an individual's ability (B) and an item's difficulty (D). P=exp(B-D)/(1+exp(B-D)) or log [P/(1-P)] = B – D
Rasch-Andrich Threshold Step calibration. Location on the latent variable (relative to the center of the rating scale) where adjacent categories are equally probable.
Rating Scale A format for observing responses wherein the categories increase in the level of the variable they define, and this increase is uniform for all agents of measurement.
Raw score The marginal score; the sum of the scored observations for a person, item or other element.
Reliability Reliability (reproducibility) = True Variance / Observed Variance (Spearman, 1904, etc.). It is the ratio of sample or test variance, corrected for estimation error, to the total variance observed.
Residuals The difference between data observed and values expected.
Response The value of an observation or data-point indicating the degree of success by an object (person) on an agent (item)
Rigidity When agents, objects and steps are all anchored, this is the logit inconsistency between the anchoring values, and is reported on the Iteration Screen and Results Table. 0 represents no inconsistency.
Rule-of-thumb A tentative suggestion that is not a requirement nor a scientific formula, but is based on experience and inference from similar situations. Originally, the use of the thumb as a unit of measurement.
Sample the persons (or items) included in this analysis
200
Scale
The quantitative representation of a latent variable.
Scree plot Plot showing the fraction of total variance in the data in each variance component.
Segmentation When tests with items at different developmental levels are submitted to Rasch analysis, items representing different stages should be contained in different segments of the scale with a nonzero distance between segments. The items should be mapped in the order predicted by the theory. (Bond & Fox, 2007)
Separation
The ratio of sample or test standard deviation, corrected for estimation error, to the average estimation error. This is the number of statistically different levels of performance that can be distinguished in a normal distribution with the same "true" S.D. as the current sample. Separation = 2: high measures are statistically different from low measures.
Standard Deviation: P.SD, S.SD The root mean square of the differences between the sample of values and their mean value. In Winsteps, all standard deviations are "population standard deviations" (the sample is the entire population) = P.SD. For the larger "sample standard deviation" (the sample is a random selection from the population) = S.SD, please multiply the Winsteps standard deviation by square-root (sample-size / (sample size - 1)).
Standard Error An estimated quantity which, when added to and subtracted from a logit measure or calibration, gives the least distance required before a difference becomes meaningful.
Step difficulty Rasch-Andrich threshold. Location on the latent variable (relative to the center of the rating scale) where adjacent categories are equally probable.
Steps The transitions between adjacent categories as ordered by the definition of the latent variable.

201
Strata = (4*Separation+1)/3 This is the number of statistically different levels of performance that can be distinguished in a normal distribution with the same "true" S.D. as the current sample, when the tales of the normal distribution are due to "true" measures, not measurement error. Strata=3: very high, middle, and very low measures can be statistically distinguished.
Targeted When the item difficulty is close to the person ability, so that he probability of success on a dichotomous item is near to 50%, or the expected rating is near to the center of the rating scale.
Targeting Choosing items with difficulty equal to the person ability.
Test reliability The reliability (reproducibility) of the measure (or raw score) hierarchy of sample like this sample for this test. The reported reliability is an estimate of (true variance)/(observed variance), as also are Cronbach Alpha and KR-20.
TOP The value shown in the Results Table for an agent on which no objects were successful, (so it was of top difficulty), or for an object which succeeded on every agent (so it was of top ability)
Top Category The response category at which maximum performance is manifested.
Threshold The level at which the likelihood of failure to agree with or endorse a given response category (below the threshold) turns to the likelihood of agreeing with or endorsing category (above the threshold). (Bond & Fox, 2007)
True score model
The model indicates that any observed test score could be envisioned as the composite of two hypothetical components: a true score and a random error component. (Bond & Fox, 2007)
Underfit
The data are too unpredictable. The data underfit the model. This may be because of excessive guessing, or contradictory dimensions in the data.
Unidimensionality A basic concept in scientific measurement that one attributes of an object (e.g., length, width, weight, temperature, etc.) be measured at a time. The Rasch model
202
requires a single construct to be underlying the items that form a hierarchical continuum. (Bond & Fox, 2007)
Unweighted
The situation in which all residuals are given equal significance in fit analysis, regardless of the amount of the information contained in them.
Weighted The adjustment of a residual for fit analysis, according to the amount of information contained in it.
Zero score Every response "incorrect" or the minimum possible score. Every observed response in the lowest category.
ZSTD Probability of a mean-square statistic expressed as a z-statistic, i.e., a unit-normal deviate. For p≤.05 (double-sided), ZSTD>|1.96|.

203
Appendix B: Measure Development and Item Categorization for All Grades and Grade Segments
As recommended by Linacre, because all items were considered to be weak
indicators, they were split into two categories using the item mean as the splitting point.
This made all items into dichotomous items. When all the dichotomous items were
reviewed in Winsteps the dimensionality looked appropriate. Yet the majority of persons
were considered to be misfit with infit values over 4.0 and the majority of the items also
misfit, with mean square fit values over 1.4. Examining the item person map showed that
the distribution of person ability and the distribution of item difficulty did not align at all.
This explains why the majority of persons and items were misfitting.
All items were then split into four categories using the mean values of the two
dichotomous categories as splitting points. Dimensionality still looked adequate yet
displayed the possibility of multiple dimensions and minimal underfit occurred in person
fit. In addition, the person separation and reliability had improved, and there were fewer
persons identified as misfitting. When examining item separation, however, there was
excessive noise or inconsistent results, even though item separation improved from the
first iteration using dichotomous items. Month of enrollment and ELA percent complete
were found to be misfitting. The item person map shows that person ability and item
difficulty were more appropriately targeted but not enough to ensure fewer persons were
misfitting. Items were converted to be eight category items to examine if the spread of
items across the measurement continuum improved. It was found that eight category
items had too much category overlap to function appropriately. Figure 6 shows an
204
example of an item, Math Total Time, as a dichotomous item, a four category item and an
eight category item. The four category scale was selected for all items for their spread of
responses and limited overlap of categories. The item categorization process yielded
minor adjustments to these categories for each item found to be part of the measurement
core.
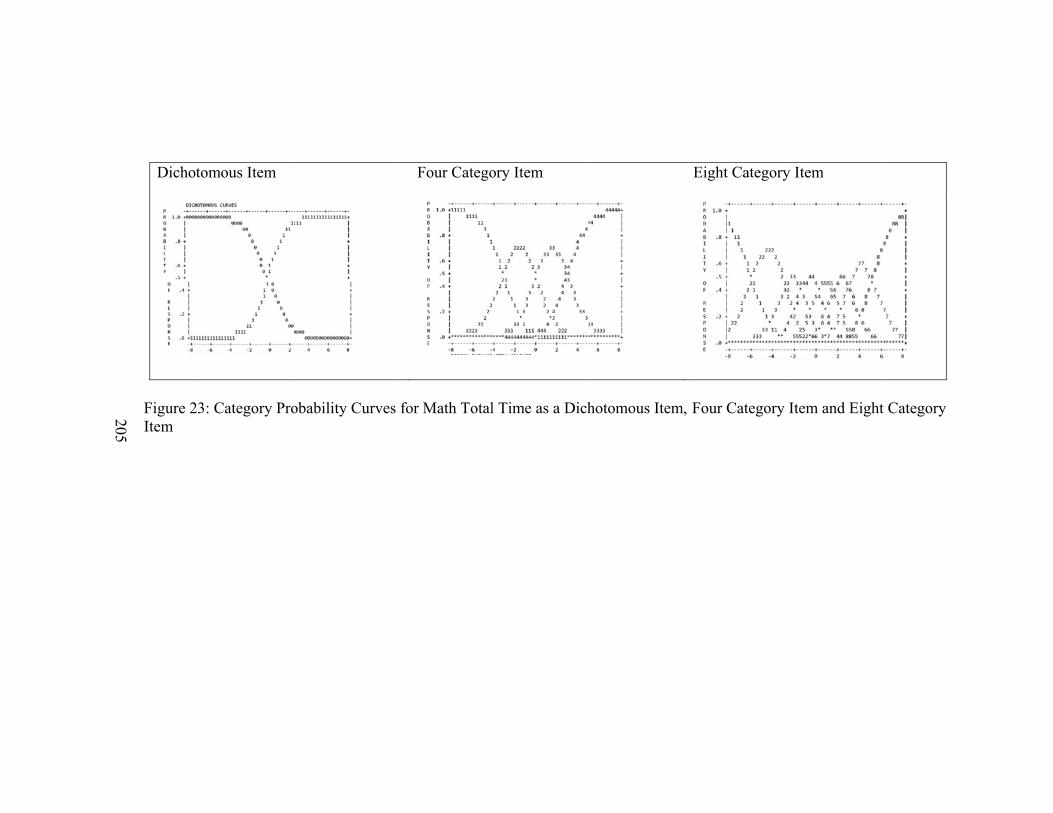
205
Dichot
Figure 2Item
tomous Item
3: Category Pro
obability Curves
Four Catego
s for Math Total
ory Item
l Time as a Dich
hotomous Item,
Eight Category
Four Category
y Item
Item and Eight
Category
206
For the next iteration month of enrollment was allowed to have 12 categories
representing each month of the year. When scale use for month of enrollment was
examined, the categories were disordered, signifying that categories need an adjustment
for key months of enrollment. Most students enrolled in the months of August and
September; these students would be considered most affectively engaged in their school.
This would mean that categories eight and nine should in fact be the top categories for the
measurement of student engagement. Future research must be done to identify how this
item should be categorized but for this study month of enrollment was removed.
Number of years enrolled, the other affective engagement item, was kept with
four categories. All categories were ordered appropriately with all categories being most
probable at some point on the scale.
Table 24 provides an overview of the iterations in the measure development
process, and the effects on dimensionality, fit, separation, and reliability at each step.
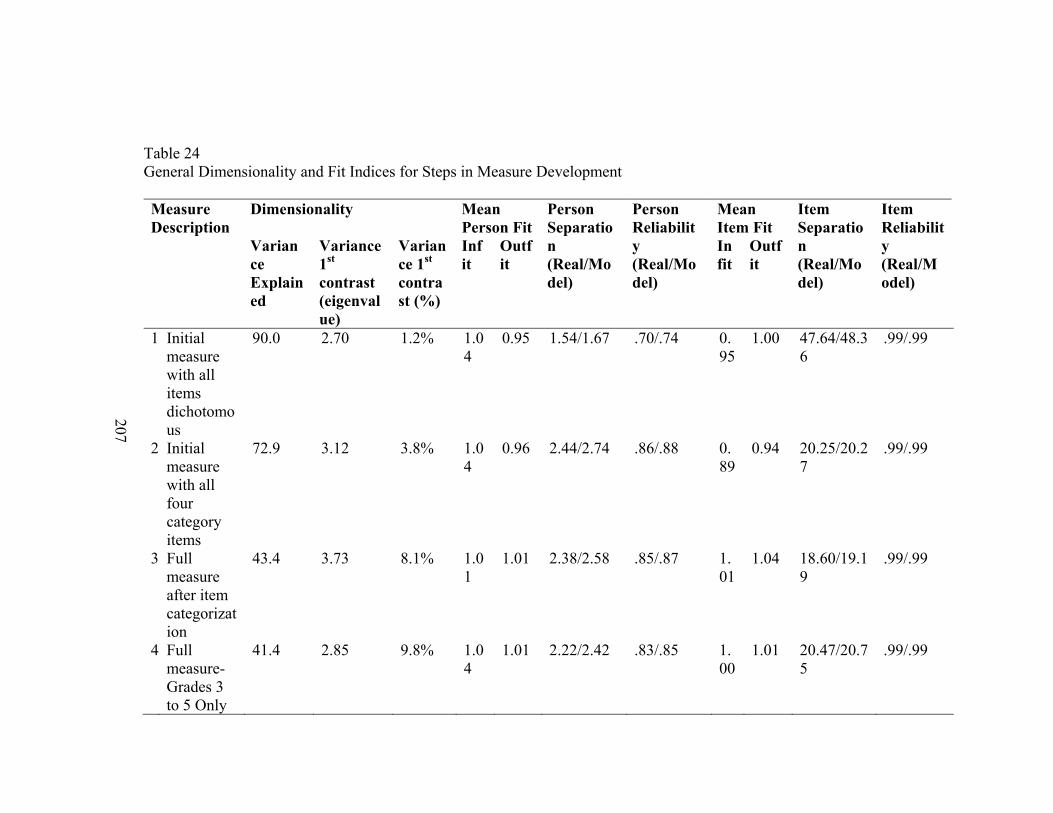
207
Table 24 General Dimensionality and Fit Indices for Steps in Measure Development Measure Description
Dimensionality Mean Person Fit
Person Separation (Real/Model)
Person Reliability (Real/Model)
Mean Item Fit
Item Separation (Real/Model)
Item Reliability (Real/Model)
Variance Explained
Variance 1st contrast (eigenvalue)
Variance 1st contrast (%)
Infit
Outfit
Infit
Outfit
1 Initial measure with all items dichotomous
90.0 2.70 1.2% 1.04
0.95 1.54/1.67 .70/.74 0.95
1.00 47.64/48.36
.99/.99
2 Initial measure with all four category items
72.9 3.12 3.8% 1.04
0.96 2.44/2.74 .86/.88 0.89
0.94 20.25/20.27
.99/.99
3 Full measure after item categorization
43.4 3.73 8.1% 1.01
1.01 2.38/2.58 .85/.87 1.01
1.04 18.60/19.19
.99/.99
4 Full measure- Grades 3 to 5 Only
41.4 2.85 9.8% 1.04
1.01 2.22/2.42 .83/.85 1.00
1.01 20.47/20.75
.99/.99
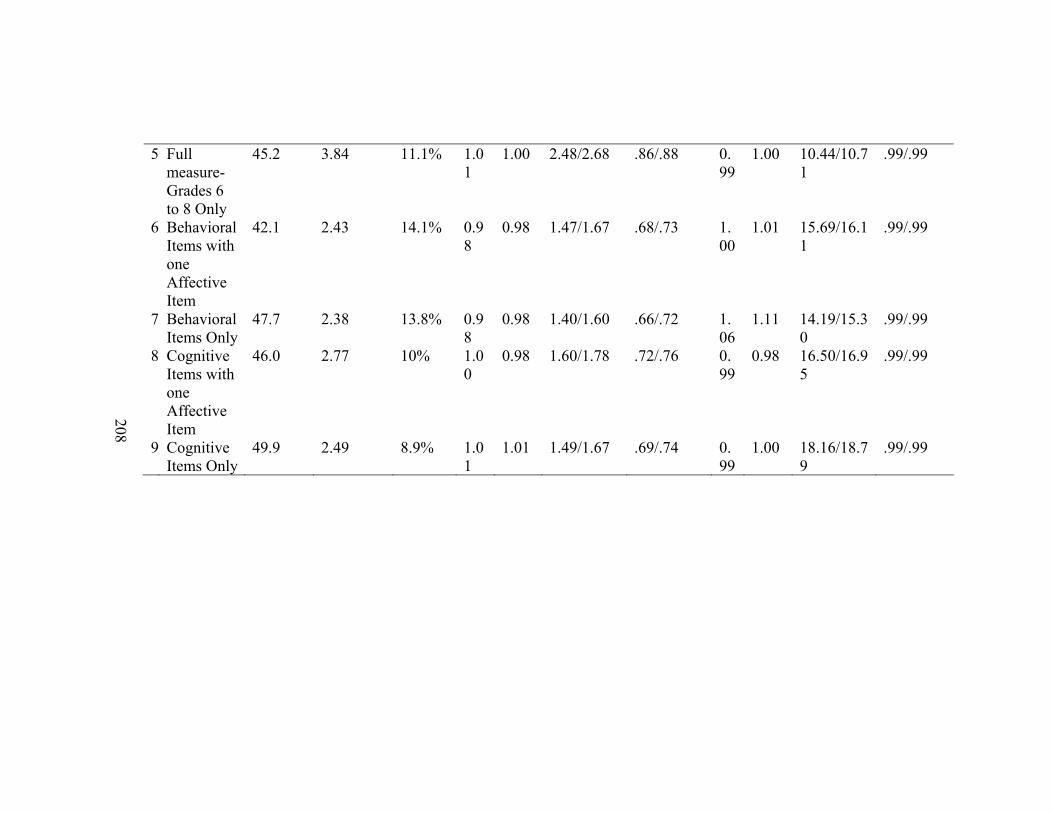
208
5 Full measure- Grades 6 to 8 Only
45.2 3.84 11.1% 1.01
1.00 2.48/2.68 .86/.88 0.99
1.00 10.44/10.71
.99/.99
6 Behavioral Items with one Affective Item
42.1 2.43 14.1% 0.98
0.98 1.47/1.67 .68/.73 1.00
1.01 15.69/16.11
.99/.99
7 Behavioral Items Only
47.7 2.38 13.8% 0.98
0.98 1.40/1.60 .66/.72 1.06
1.11 14.19/15.30
.99/.99
8 Cognitive Items with one Affective Item
46.0 2.77 10% 1.00
0.98 1.60/1.78 .72/.76 0.99
0.98 16.50/16.95
.99/.99
9 Cognitive Items Only
49.9 2.49 8.9% 1.01
1.01 1.49/1.67 .69/.74 0.99
1.00 18.16/18.79
.99/.99
209
As the measure development process continued, several items (ELA time, math
logins, math ratio, ELA ratio, ELA formative assessments mastered, and reading internal
assessment) were made into three category items by collapsing two of their categories, in
most cases categories 3 and 4 (the high end of the measure continuum). Further, the
practice items for both math and ELA were converted back to dichotomous items,
measuring whether or not a student practices enough.
Next, the invariance by grade was examined for the initial measure to examine if
the inclusion of different grade segments (grades 3 to 5 and grades 6 to 8) could be part
of the cause for not meeting the unidimensionality requirements. It was found that all
items, except for ELA practice, had statistically significant DIF comparisons between
grade segments. Eight items (Math percent complete, ELA percent complete, math
formative assessments mastered, ELA formative assessments mastered, math summative
assessments mastered, ELA summative assessments mastered, math practice and ELA
practice) had DIF contrast values over |.64|, which confirms that they were not invariant
(Table 25). The eight items that had DIF contrast values over |.64| and were statistically
significant were split by grade segment into two items, one for grades 3 to 5 and a second
item for grades 6 to 8. It was anticipated that by making these splits all grades could
remain within the same measure and measure continuum.
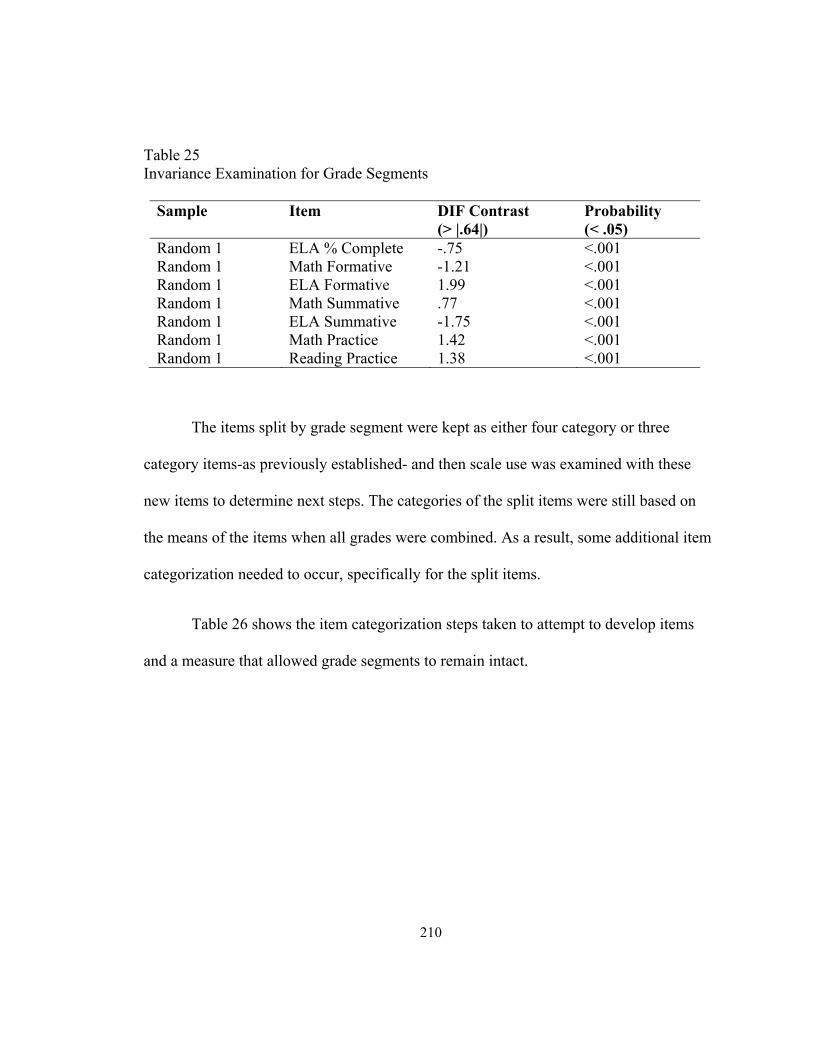
210
Table 25 Invariance Examination for Grade Segments
Sample Item DIF Contrast (> |.64|)
Probability (< .05)
Random 1 ELA % Complete -.75 <.001 Random 1 Math Formative -1.21 <.001 Random 1 ELA Formative 1.99 <.001 Random 1 Math Summative .77 <.001 Random 1 ELA Summative -1.75 <.001 Random 1 Math Practice 1.42 <.001 Random 1 Reading Practice 1.38 <.001
The items split by grade segment were kept as either four category or three
category items-as previously established- and then scale use was examined with these
new items to determine next steps. The categories of the split items were still based on
the means of the items when all grades were combined. As a result, some additional item
categorization needed to occur, specifically for the split items.
Table 26 shows the item categorization steps taken to attempt to develop items
and a measure that allowed grade segments to remain intact.
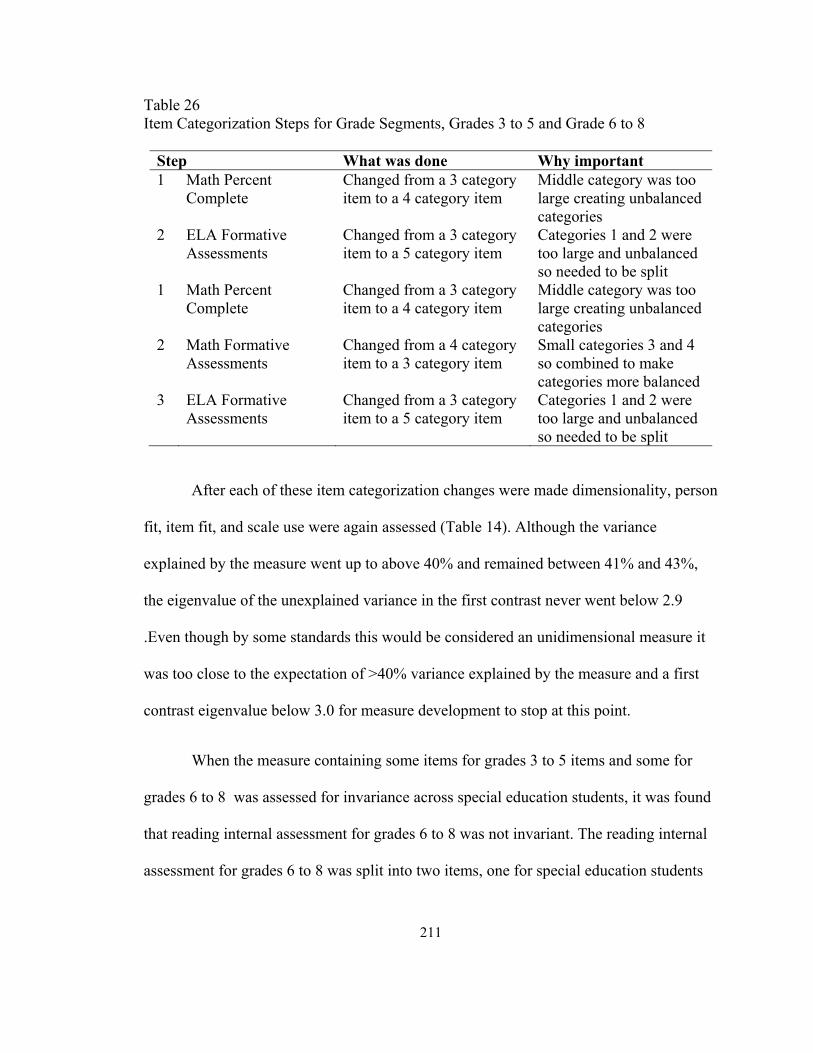
211
Table 26 Item Categorization Steps for Grade Segments, Grades 3 to 5 and Grade 6 to 8
Step What was done Why important 1 Math Percent
Complete Changed from a 3 category item to a 4 category item
Middle category was too large creating unbalanced categories
2 ELA Formative Assessments
Changed from a 3 category item to a 5 category item
Categories 1 and 2 were too large and unbalanced so needed to be split
1 Math Percent Complete
Changed from a 3 category item to a 4 category item
Middle category was too large creating unbalanced categories
2 Math Formative Assessments
Changed from a 4 category item to a 3 category item
Small categories 3 and 4 so combined to make categories more balanced
3 ELA Formative Assessments
Changed from a 3 category item to a 5 category item
Categories 1 and 2 were too large and unbalanced so needed to be split
After each of these item categorization changes were made dimensionality, person
fit, item fit, and scale use were again assessed (Table 14). Although the variance
explained by the measure went up to above 40% and remained between 41% and 43%,
the eigenvalue of the unexplained variance in the first contrast never went below 2.9
.Even though by some standards this would be considered an unidimensional measure it
was too close to the expectation of >40% variance explained by the measure and a first
contrast eigenvalue below 3.0 for measure development to stop at this point.
When the measure containing some items for grades 3 to 5 items and some for
grades 6 to 8 was assessed for invariance across special education students, it was found
that reading internal assessment for grades 6 to 8 was not invariant. The reading internal
assessment for grades 6 to 8 was split into two items, one for special education students
212
and one for general education students. Even with this change, the measure still did not
explain more than 42% of the variance and had a first contrast eigenvalue of 2.9.
The decision was made to split the first random sample dataset into two datasets;
one for grades 3 to 5 and the other for grades 6 to 8. At this point, the total and average
variables that were found not to be multicollinear were added back into the datasets to
give more options for items that could potentially be part of the measurement core.
Multicollinearity, clustering, nesting effects and inverted U relationships were
reassessed before continuing with measure development.
The grades 3 to 5 dataset was then evaluated with all dichotomous items, all four-
category items, and all eight-category items. When only the dichotomous items were
used, 23% of the variance was explained by the measure and the eigenvalue of the
unexplained variance was 2.3 for the first contrast. When all four category items were
used 35.3% of the variance was explained by the measure and there was a 2.95
eigenvalue for the variance for the first contrast. Lastly, when all eight category items
were used, 40.3% of the variance was explained by the measure with a first contrast
eigenvalue of 3.12. As the number of categories increased, the variance explained by the
measure also increased, but unfortunately the eigenvalue of the first contrast also
increased. The decision was made to start with all four category items and use the item
categorization process to increase the amount of variance explained by the measure and
keep the eigenvalue of the variance in the first contrast under 3.0.
213
The grades 6 to 8 dataset was also evaluated with all dichotomous items, all four-
category items, and all eight-category items. Similar to the grades 3 to 5 dataset, when
only dichotomous items were used, only 28% of the variance was explained by the
measure with a first contrast eigenvalue of 2.69. When all four category items were used,
46.3% of the variance was explained by the measure, yet the eigenvalue for the first
contrast increased to 3.5. It was observed that as the number of categories increased, both
the variance explained and the eigenvalue of the first contrast increased. Once it was
established that the four-category items worked well for most of the items the eight
category items were not assessed. For the grades 6 to 8 dataset, all items started with four
categories and item categorization efforts were made to decrease the eigenvalue of the
variance unexplained by the first contrast to under 3.0.
Before item categorization was concluded, grade segment datasets were split
between behavioral engagement items and cognitive engagement items. These two
datasets were assessed for dimensionality and fit (Table 14).
When the grades 3 to 5 dataset was split between behavioral engagement items
and cognitive engagement items, it was found that although the requirements for
dimensionality and fit were met, there were still problems with invariance across grades.
The behavioral engagement subscale for grades 3 to 5 explained 52.4% of the variance
and its unexplained variance eigenvalue was 2,04.. Math logins and total logins did not
have invariance for grade 3. This led to the decision to evaluate the behavioral
engagement subscale without grade 3 students. The behavioral engagement subscale for
grades four and five was able to explain 54.4% of the variance with an eigenvalue of 2.25

214
for unexplained variance. The cognitive engagement subscale for grades 3 to 5 explained
47.8% of the variance and had an eigenvalue of 2.02 for the unexplained variance, yet
items on the cognitive engagement subscale for grades 3 to 5 were found not to have
been invariant for grade 3. When grade 3 was removed from the sample 57.8% of the
variance was explained with a first contrast eigenvalue of 2.02, but it was math formative
assessments mastered and math internal assessment that were found to fail invariance for
grades 4 and 5. In addition, the ELA ratio of time and progress was found to misfit for the
cognitive engagement subscale. Based on these results, it was decided that both the
behavioral and cognitive subscales should be re-evaluated for each grade individually.
The grades 6 to 8 dataset was split between behavioral engagement items and
cognitive engagement items. It was found that the requirements for dimensionality and fit
were met but there were problems with invariance across grades. The behavioral
engagement subscale for grades 6 to 8 explained 60.8% of the variance and had a first
contrast eigenvalue of 2.36. Math logins did not have invariance for grades 6 and 8.
When grade 6 was removed from the behavioral engagement subscale the measure was
able to explain 60.6% of the variance with an eigenvalue for unexplained variance of
2.40. There were no problems with invariance between grades 7 and 8. The cognitive
engagement subscale for grades 6 to 8 explained 48.4% of the variance with an
eigenvalue of 2.35 for unexplained variance. Yet five items were found not to be
invariant for grades 6 and 8. When grade 6 was removed the cognitive engagement
subscale was able to explain 47.1% of the variance with the unexplained eigenvalue of
2.27. For grades six and seven ELA ratio between time and progress was not invariant
215
and ELA ratio between time and progress along with math ratio between time and
progress were found to be misfitting. Since the cognitive engagement subscale needed to
be separated by grade both the behavioral and the cognitive engagement subscale for
grades 6 to 8 were separated by grade and re-evaluated.

216
Appendix C: Measure Development and Item Categorization by Grade
Table 27 Grade 3 Measure Development and Item Categorization Process
Step What was done Why important Results 1 Grade 5 1st Dimension
measurement foundation
7 final items in cognitive engagement measure used to start building Grade 3 measure
Measurement foundation identification
Start with 7 items
2 ELA Summative assessments mastered and ELA Formative assessments mastered Removed
Two items removed Two items identified as misfitting items
Measure strengthened and better dimensionality
3 Math Summative Turned into 3 category item instead of 4 category item
Ensure categories for both items are balanced without overlapping categories
Final Grade 3 1st Dimension measure Grade 3 Cognitive Engagement measure
4 Grade 5 2nd Dimension measurement foundation
3 final items in behavioral engagement measure used to start building Grade 3 measure
Measure foundation identification
Start with 3 items
5 ELA Ratio Turned into 3 category item instead of 4 category item
Ensure categories for both items are balanced without overlapping categories
Final Grade 3 2nd Dimension measure Grade 3 Behavioral Engagement measure
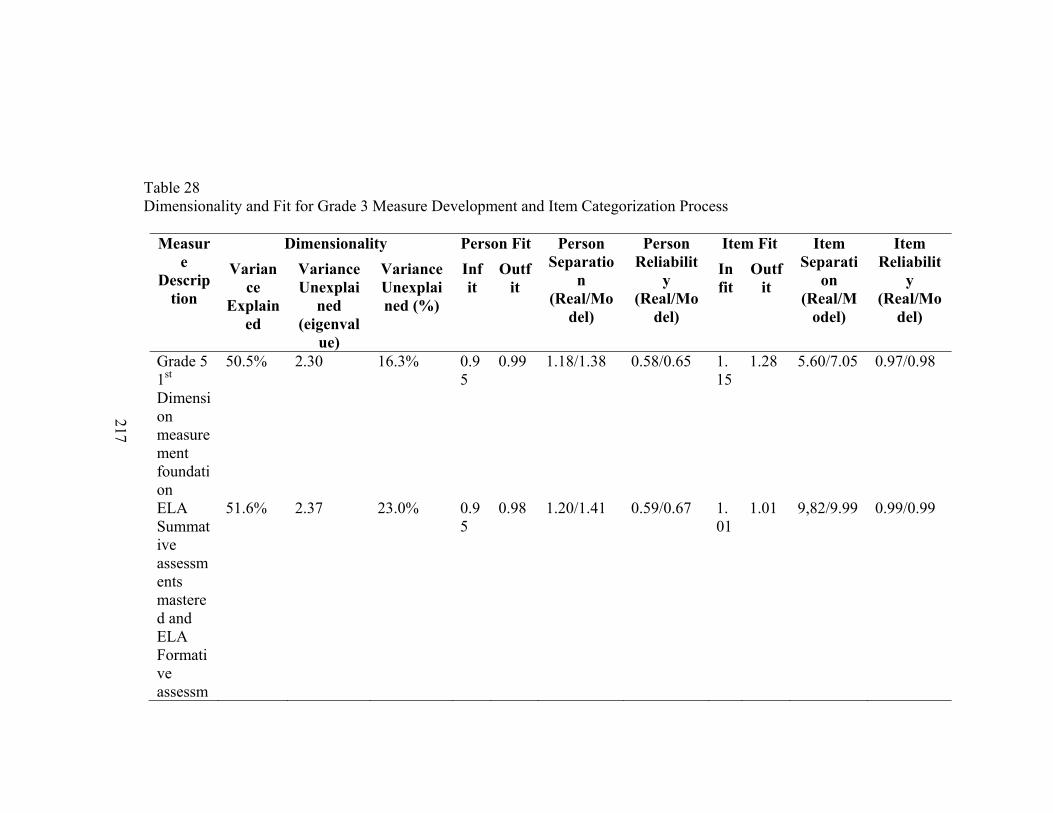
217
Table 28 Dimensionality and Fit for Grade 3 Measure Development and Item Categorization Process
Measure
Description
Dimensionality Person Fit Person Separatio
n (Real/Mo
del)
Person Reliabilit
y (Real/Mo
del)
Item Fit Item Separati
on (Real/M
odel)
Item Reliabilit
y (Real/Mo
del)
Variance
Explained
Variance Unexplai
ned (eigenval
ue)
Variance Unexplained (%)
Infit
Outfit
Infit
Outfit
Grade 5 1st Dimension measurement foundation
50.5% 2.30 16.3% 0.95
0.99 1.18/1.38 0.58/0.65 1.15
1.28 5.60/7.05 0.97/0.98
ELA Summative assessments mastered and ELA Formative assessm
51.6% 2.37 23.0% 0.95
0.98 1.20/1.41 0.59/0.67 1.01
1.01 9,82/9.99 0.99/0.99
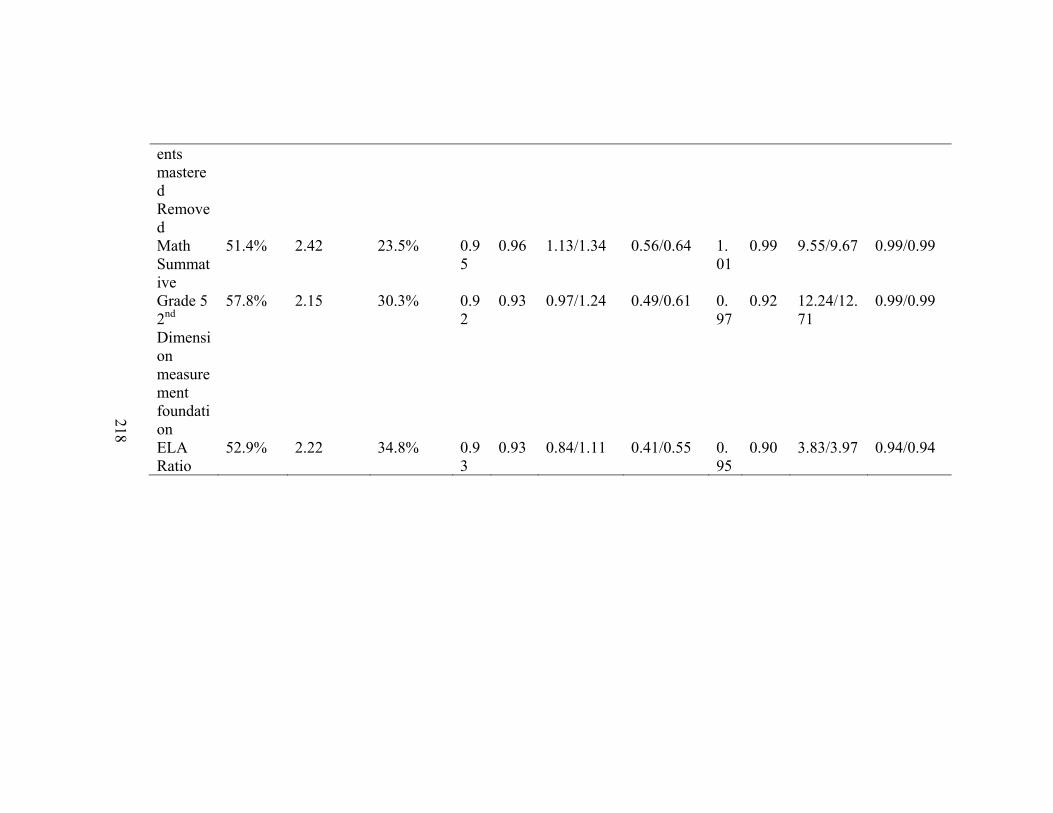
218
ents mastered Removed Math Summative
51.4% 2.42 23.5% 0.95
0.96 1.13/1.34 0.56/0.64 1.01
0.99 9.55/9.67 0.99/0.99
Grade 5 2nd Dimension measurement foundation
57.8% 2.15 30.3% 0.92
0.93 0.97/1.24 0.49/0.61 0.97
0.92 12.24/12.71
0.99/0.99
ELA Ratio
52.9% 2.22 34.8% 0.93
0.93 0.84/1.11 0.41/0.55 0.95
0.90 3.83/3.97 0.94/0.94

219
GradeDeve
Figure 2
e 3 Initial Measulopment
4: Grade 3 Item
urement
m-Person Map fo
Grade 3- 1Engagemen
or Total Scale an
st Dimension- Cnt
nd by Dimensio
Cognitive
on (Cognitive an
Grade 3- 2nd DEngagement
nd Behavioral)
Dimension- Behhavioral
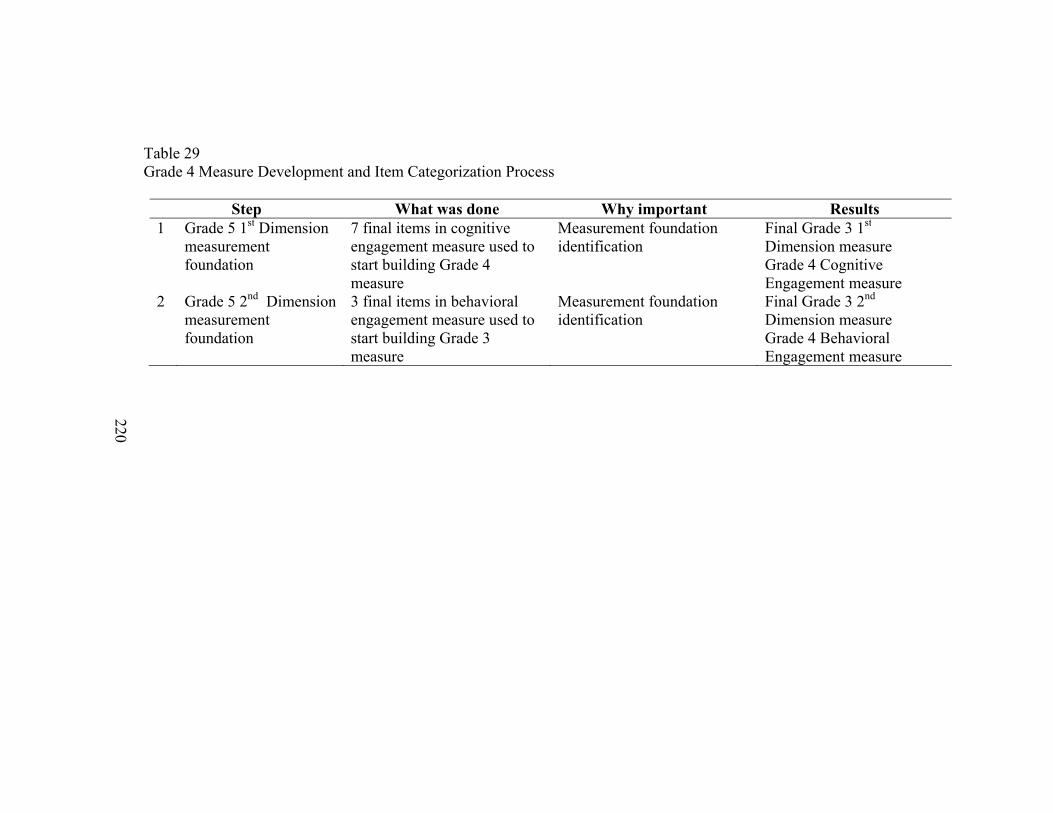
220
Table 29 Grade 4 Measure Development and Item Categorization Process
Step What was done Why important Results 1 Grade 5 1st Dimension
measurement foundation
7 final items in cognitive engagement measure used to start building Grade 4 measure
Measurement foundation identification
Final Grade 3 1st Dimension measure Grade 4 Cognitive Engagement measure
2 Grade 5 2nd Dimension measurement foundation
3 final items in behavioral engagement measure used to start building Grade 3 measure
Measurement foundation identification
Final Grade 3 2nd Dimension measure Grade 4 Behavioral Engagement measure
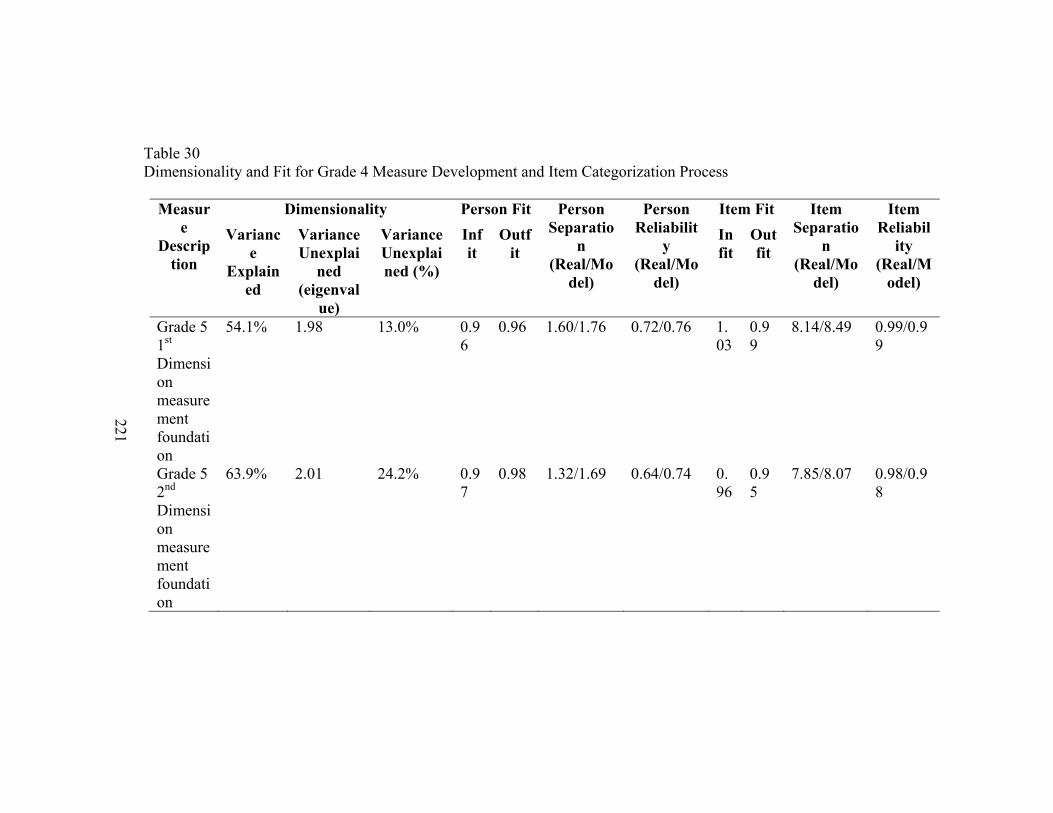
221
Table 30 Dimensionality and Fit for Grade 4 Measure Development and Item Categorization Process
Measure
Description
Dimensionality Person Fit Person Separatio
n (Real/Mo
del)
Person Reliabilit
y (Real/Mo
del)
Item Fit Item Separatio
n (Real/Mo
del)
Item Reliabil
ity (Real/M
odel)
Variance
Explained
Variance Unexplai
ned (eigenval
ue)
Variance Unexplained (%)
Infit
Outfit
Infit
Outfit
Grade 5 1st Dimension measurement foundation
54.1% 1.98 13.0% 0.96
0.96 1.60/1.76 0.72/0.76 1.03
0.99
8.14/8.49 0.99/0.99
Grade 5 2nd Dimension measurement foundation
63.9% 2.01 24.2% 0.97
0.98 1.32/1.69 0.64/0.74 0.96
0.95
7.85/8.07 0.98/0.98
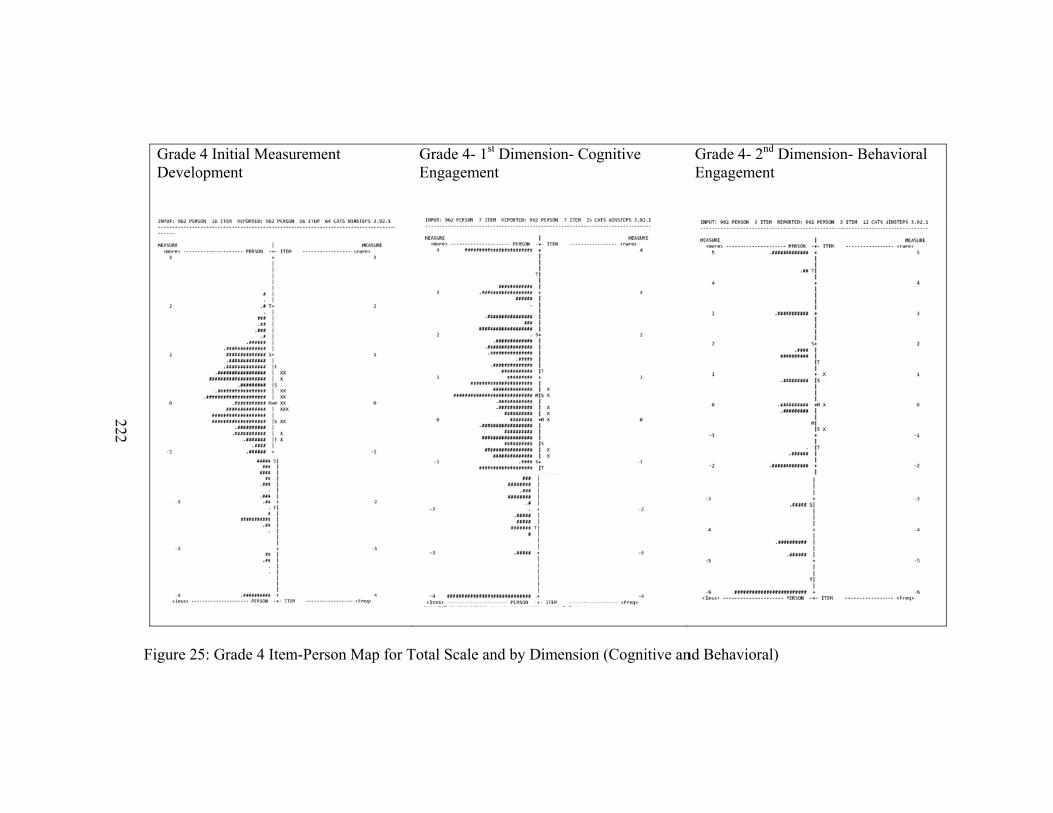
222
Grade Develo
Figure 2
4 Initial Measuopment
5: Grade 4 Item
urement
m-Person Map fo
Grade 4- 1st
Engagemen
or Total Scale an
t Dimension- Cont
nd by Dimensio
ognitive
on (Cognitive an
Grade 4- 2nd DEngagement
nd Behavioral)
Dimension- Behaavioral

223
Table 31 Grade 5 Measure Development and Item Categorization Process
Step What was done Why important Results 1 Grade 5 Only Both cognitive and
behavioral items, together Measurement foundation identification
Grade 5 selected as the measurement foundation for all grades; had 2 contrasts
2 1st Dimension Items All items with an Infit value over 1 removed
Identify items in each of the two dimensions and begin to establish measurement core
8 items removed 8 items remaining
3 Math Practice and ELA Practice and ELA Formative Assessments Mastered
Turned into 3 category items instead of 4 category items
Ensure categories for both items are balanced without overlapping categories
Both items balanced with no overlapping categories
4 Average Percent Complete Removed
Average Percent Complete Removed
Average percent complete identified as a misfitting item so removed
Final Grade 5 1st Dimension measure Grade 5 Cognitive Engagement measure
5 2nd Dimension Items Begin to establish measurement core for 2nd dimension items
8 items in the 2nd dimension to start
6 Number of Years Removed
Number of Years Removed Identified as misfitting item Measure strengthened and better dimensionality
7 Math Internal Assessment and ELA Internal Assessment Removed
Math Internal Assessment and ELA Internal Assessment Removed
Identified as a misfitting item
Measure strengthened and better dimensionality
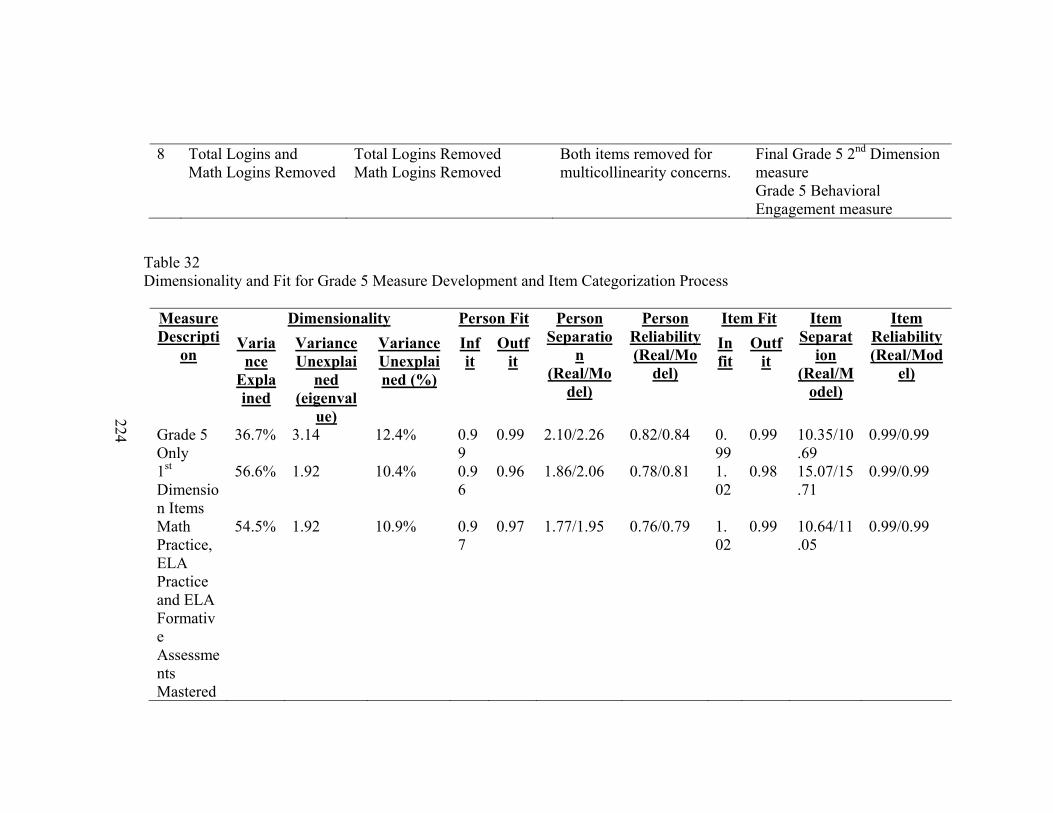
224
8 Total Logins and Math Logins Removed
Total Logins Removed Math Logins Removed
Both items removed for multicollinearity concerns.
Final Grade 5 2nd Dimension measure Grade 5 Behavioral Engagement measure
Table 32 Dimensionality and Fit for Grade 5 Measure Development and Item Categorization Process
Measure Descripti
on
Dimensionality Person Fit Person Separatio
n (Real/Mo
del)
Person Reliability (Real/Mo
del)
Item Fit Item Separat
ion (Real/M
odel)
Item Reliability (Real/Mod
el)
Variance
Explained
Variance Unexplai
ned (eigenval
ue)
Variance Unexplained (%)
Infit
Outfit
Infit
Outfit
Grade 5 Only
36.7% 3.14 12.4% 0.99
0.99 2.10/2.26 0.82/0.84 0.99
0.99 10.35/10.69
0.99/0.99
1st Dimension Items
56.6% 1.92 10.4% 0.96
0.96 1.86/2.06 0.78/0.81 1.02
0.98 15.07/15.71
0.99/0.99
Math Practice, ELA Practice and ELA Formative Assessments Mastered
54.5% 1.92 10.9% 0.97
0.97 1.77/1.95 0.76/0.79 1.02
0.99 10.64/11.05
0.99/0.99

225
Average Percent Complete Removed
55.4% 1.91 12.2% 0.98
0.98 1.73/1.92 0.75/0.79 1.02
0.99 12.12/12.54
0.99/0.99
2nd Dimension Items
34.5% 2.64 21.7% 0.99
0.99 1.41/1.57 0.67/0.71 0.99
0.99 9.16/9.51
0.99/0.99
Number of Years Removed
37.6% 2.48 22.1% 0.99
0.99 1.32/1.49 0.64/0.69 0.99
1.01 8.14/8.53
0.99/0.99
Math Internal Assessment and ELA Internal Assessment Removed
54.5% 2.51 22.8% 0.98
0.99 1.53/1.75 0.70/0.75 0.99
1.01 10.85/11.04
0.99/0.99
Total Logins and Math Logins Removed
66.4% 2.01 22.4% 0.93
0.94 1.49/1.79 0.69/0.76 0.97
0.95 4.18/4.29
0.95/0.95
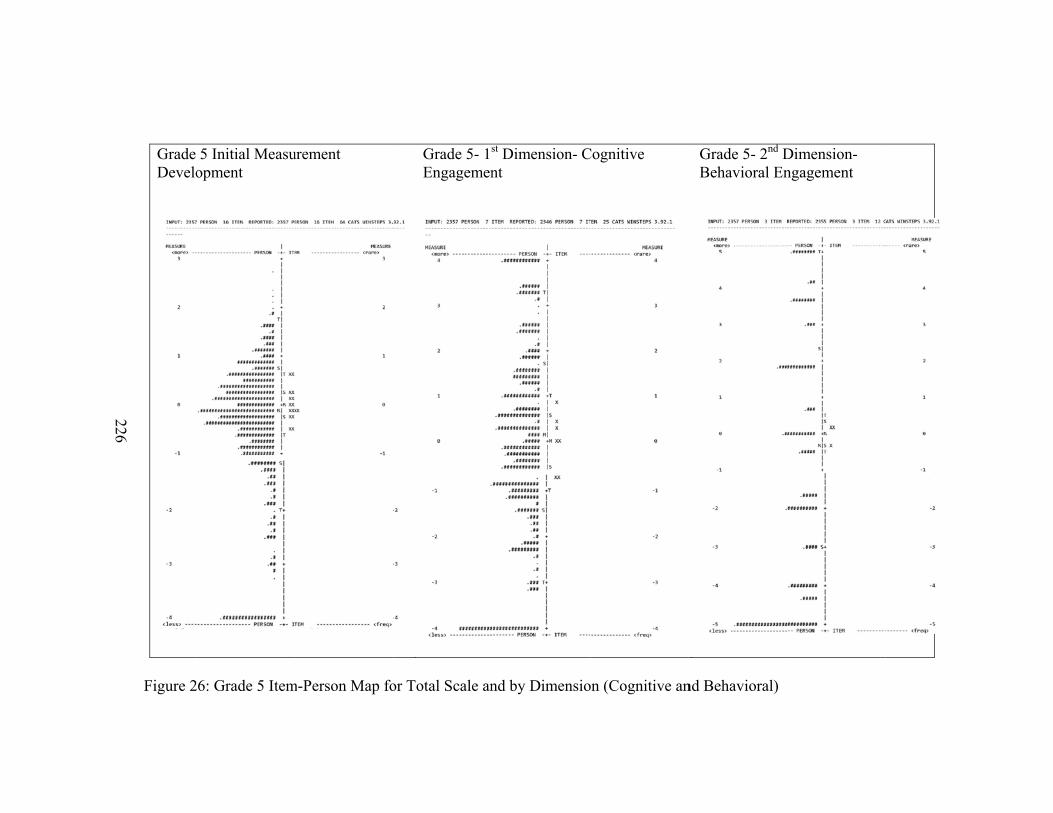
226
Grade Develo
Figure 2
5 Initial Measuopment
6: Grade 5 Item
urement
m-Person Map fo
Grade 5- 1s
Engagemen
or Total Scale an
st Dimension- Cnt
nd by Dimensio
Cognitive
on (Cognitive an
Grade 5- 2nd DBehavioral En
nd Behavioral)
Dimension- ngagement
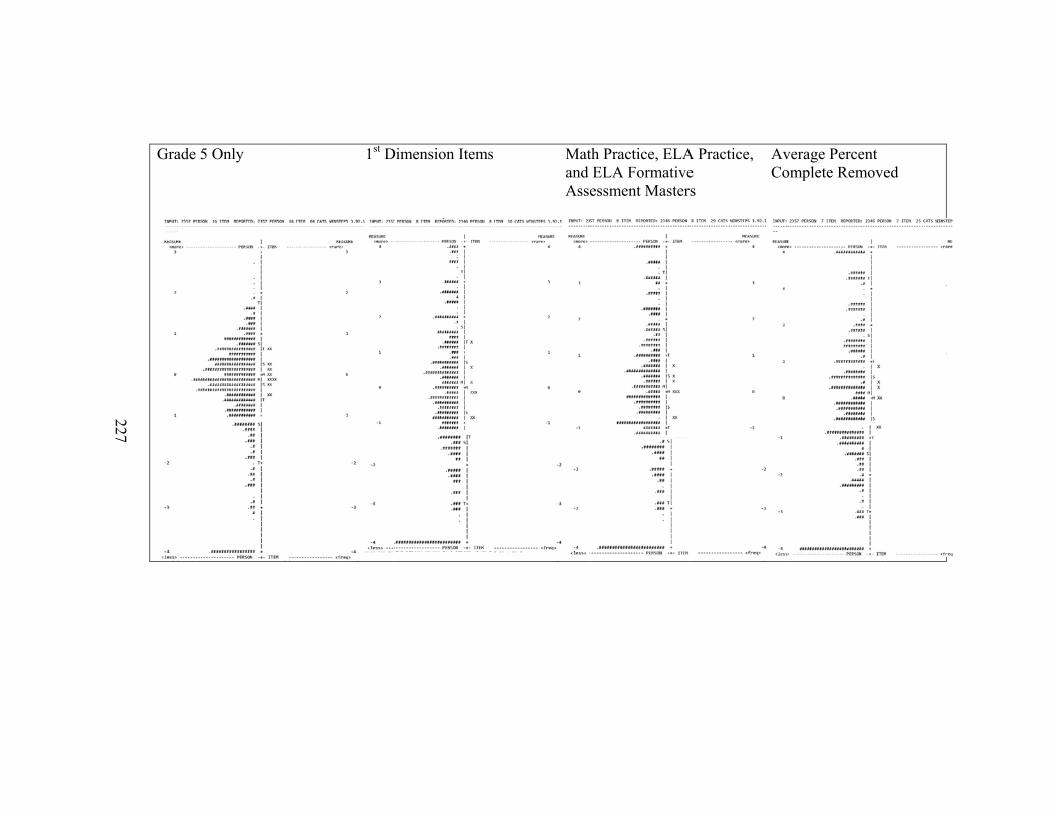
227
Grade
5 Only 1st D
Dimension Itemss Matand Asse
th Practice, ELAELA Formativeessment Master
A Practice, e rs
AvCo
verage Percent omplete Removeed
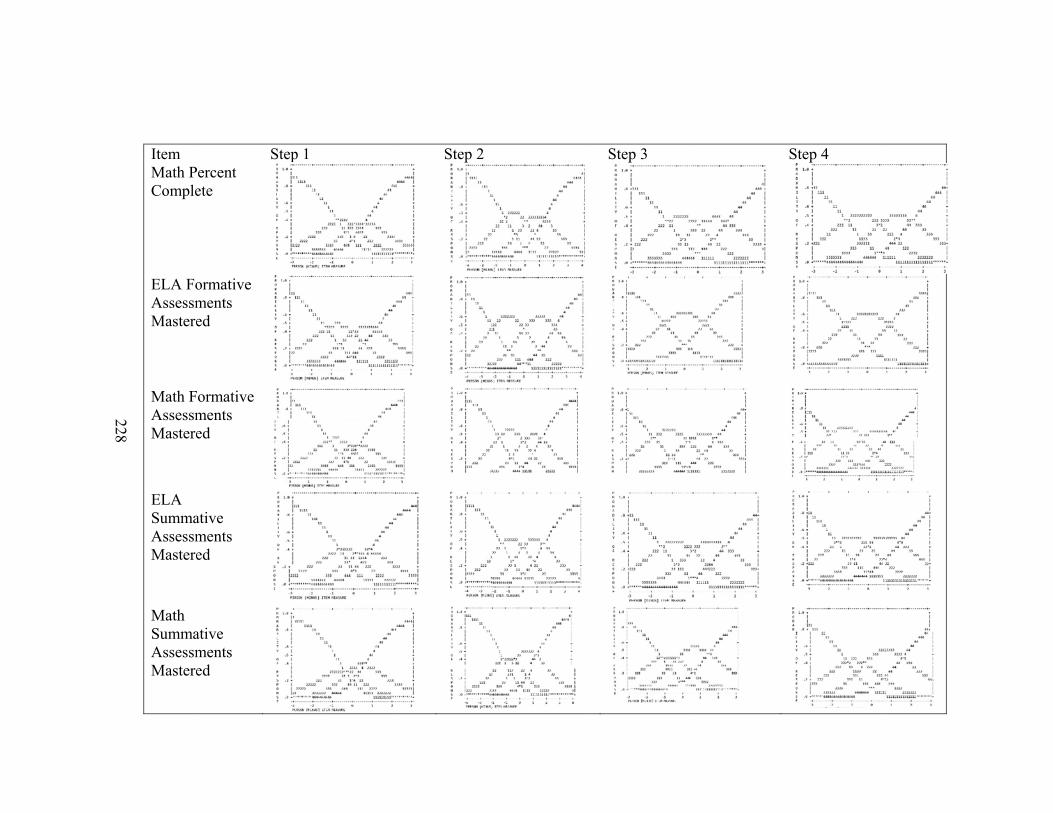
228
Item Math PComple
ELA FoAssessmMastere
Math FAssessmMastere
ELA SummaAssessmMastere
Math SummaAssessmMastere
StepPercent ete
ormative ments ed
Formative ments ed
ative ments ed
ative ments ed
p 1 Step 2
Step 3
Step 4

229
Math P
ELA Pr
Practice
ractice
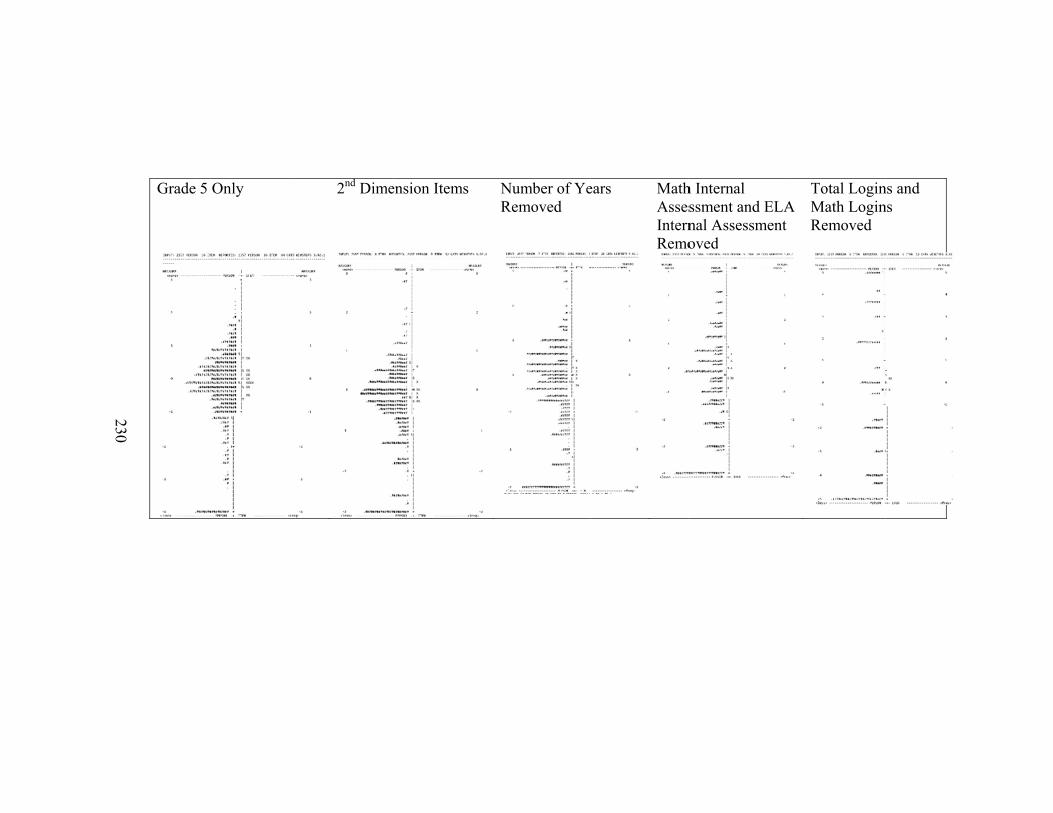
230
Grade
5 Only 2nd Dime
ension Items Number of YeRemoved
ears MathAssesInternRemo
h Internal ssment and ELAnal Assessment oved
A Total LoginMath LoginRemoved
ns and ns
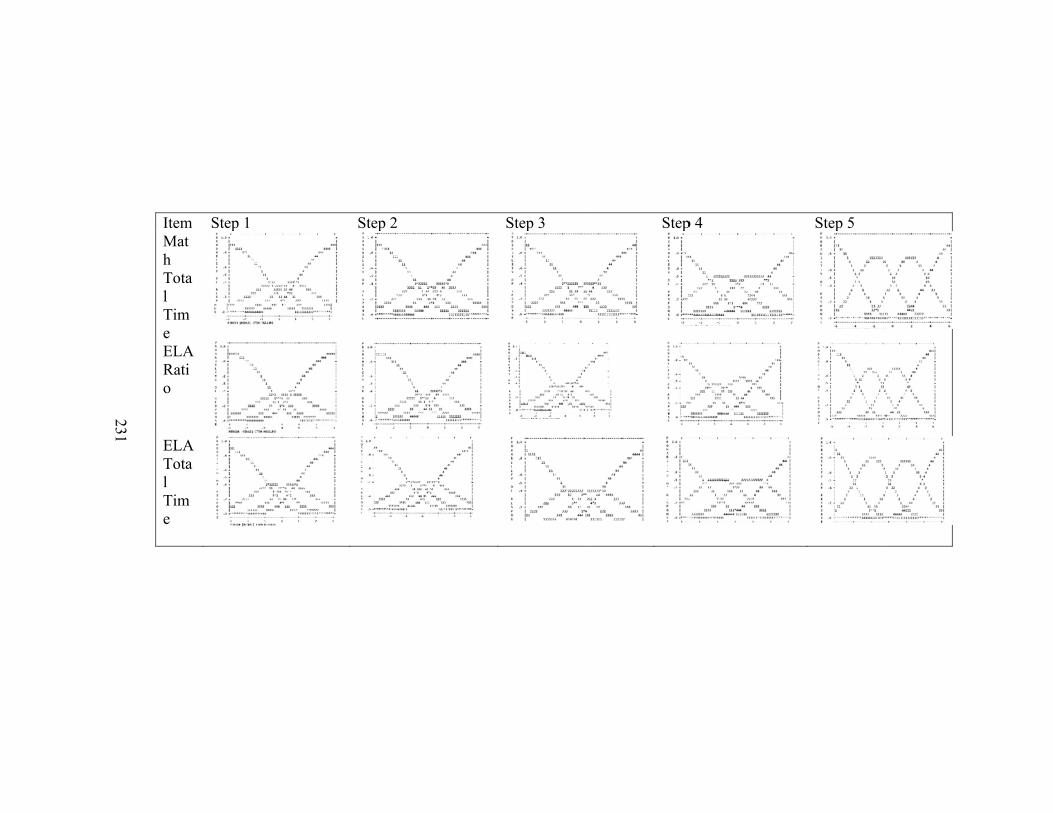
231
Item Math Total Time ELA Ratio
ELA Total Time
Step 1 Step 2
2
Step 3 Step
p 4 Step 5
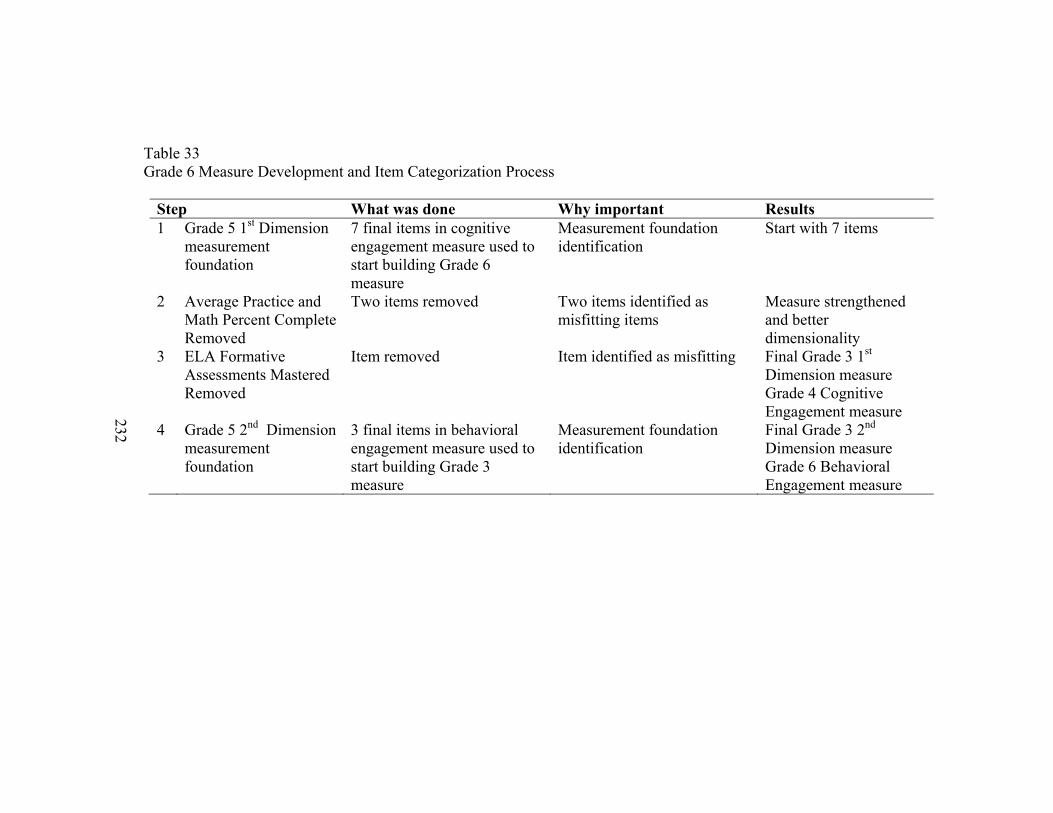
232
Table 33 Grade 6 Measure Development and Item Categorization Process
Step What was done Why important Results 1 Grade 5 1st Dimension
measurement foundation
7 final items in cognitive engagement measure used to start building Grade 6 measure
Measurement foundation identification
Start with 7 items
2 Average Practice and Math Percent Complete Removed
Two items removed Two items identified as misfitting items
Measure strengthened and better dimensionality
3 ELA Formative Assessments Mastered Removed
Item removed Item identified as misfitting Final Grade 3 1st Dimension measure Grade 4 Cognitive Engagement measure
4 Grade 5 2nd Dimension measurement foundation
3 final items in behavioral engagement measure used to start building Grade 3 measure
Measurement foundation identification
Final Grade 3 2nd Dimension measure Grade 6 Behavioral Engagement measure
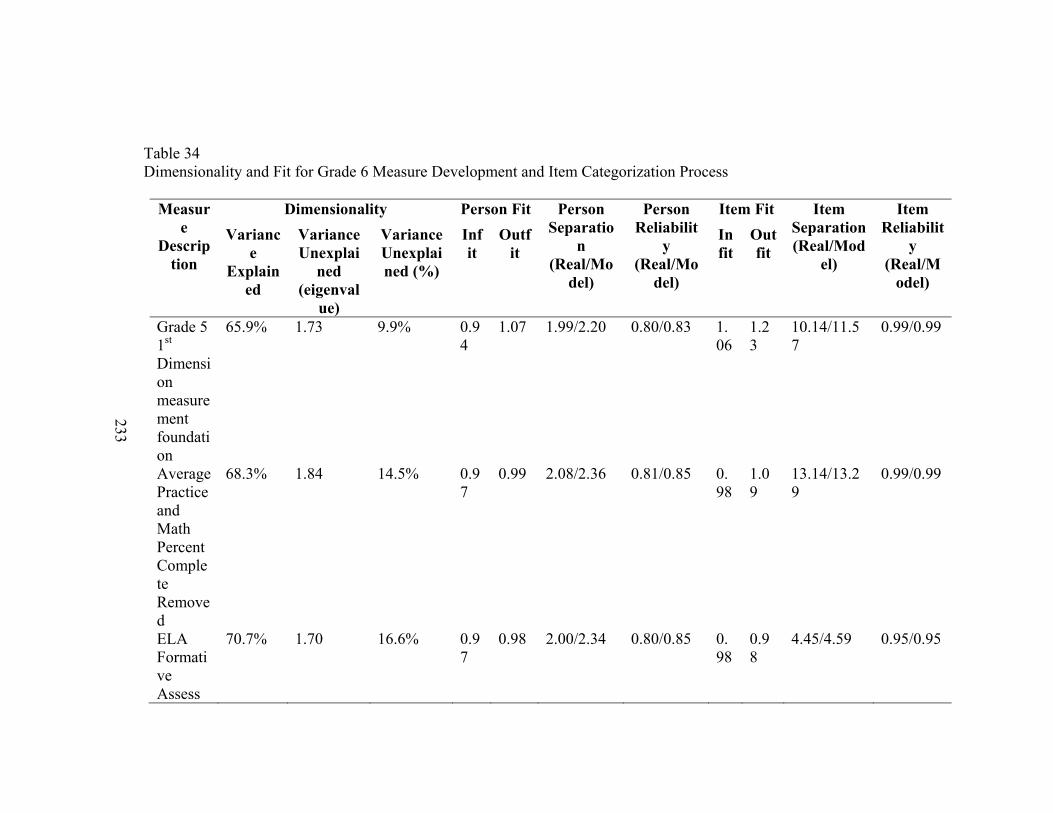
233
Table 34 Dimensionality and Fit for Grade 6 Measure Development and Item Categorization Process
Measure
Description
Dimensionality Person Fit Person Separatio
n (Real/Mo
del)
Person Reliabilit
y (Real/Mo
del)
Item Fit Item Separation (Real/Mod
el)
Item Reliabilit
y (Real/M
odel)
Variance
Explained
Variance Unexplai
ned (eigenval
ue)
Variance Unexplained (%)
Infit
Outfit
Infit
Outfit
Grade 5 1st Dimension measurement foundation
65.9% 1.73 9.9% 0.94
1.07 1.99/2.20 0.80/0.83 1.06
1.23
10.14/11.57
0.99/0.99
Average Practice and Math Percent Complete Removed
68.3% 1.84 14.5% 0.97
0.99 2.08/2.36 0.81/0.85 0.98
1.09
13.14/13.29
0.99/0.99
ELA Formative Assess
70.7% 1.70 16.6% 0.97
0.98 2.00/2.34 0.80/0.85 0.98
0.98
4.45/4.59 0.95/0.95

234
ments Mastered Removed Grade 5 2nd Dimension measurement foundation
71.2% 1.85 17.8% 0.91
0.93 1.71/2.07 0.75/0.81 0.98
0.98
6.35/6.46 0.98/0.98
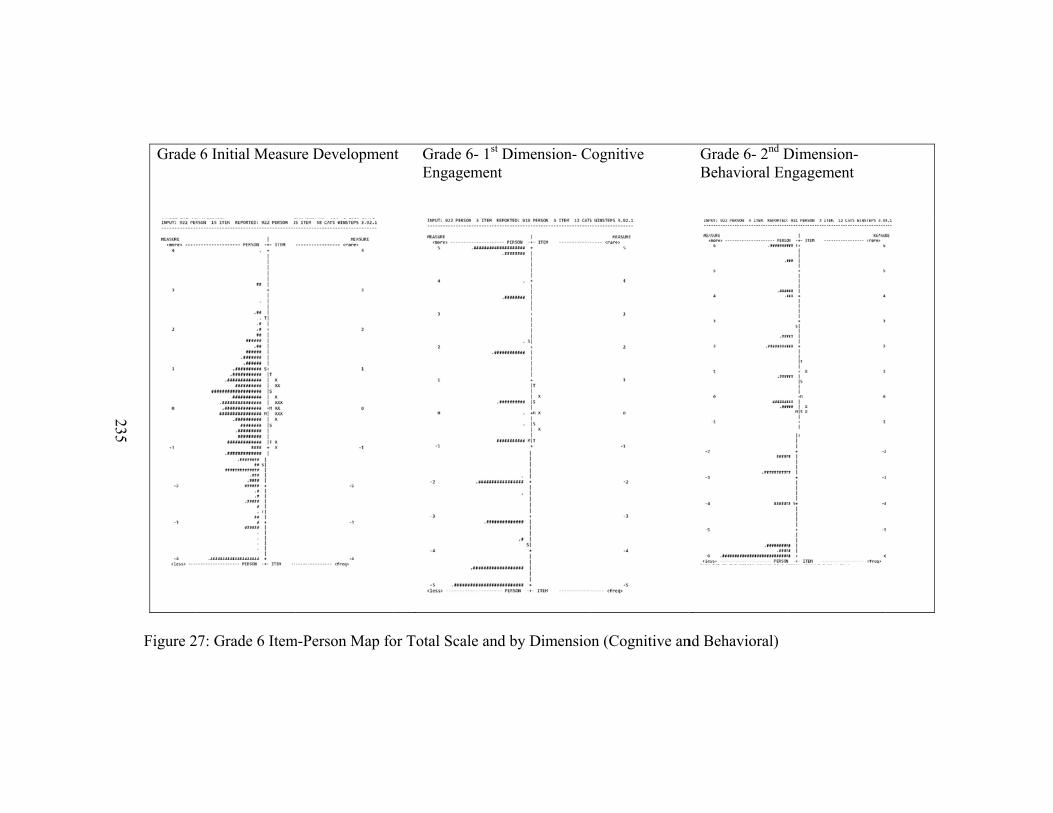
235
Grade
Figure 2
6 Initial Measu
7: Grade 6 Item
ure Developmen
m-Person Map fo
nt Grade 6- 1s
Engagemen
or Total Scale an
st Dimension- Cnt
nd by Dimensio
Cognitive
on (Cognitive an
Grade 6- 2nd DBehavioral En
nd Behavioral)
Dimension- ngagement
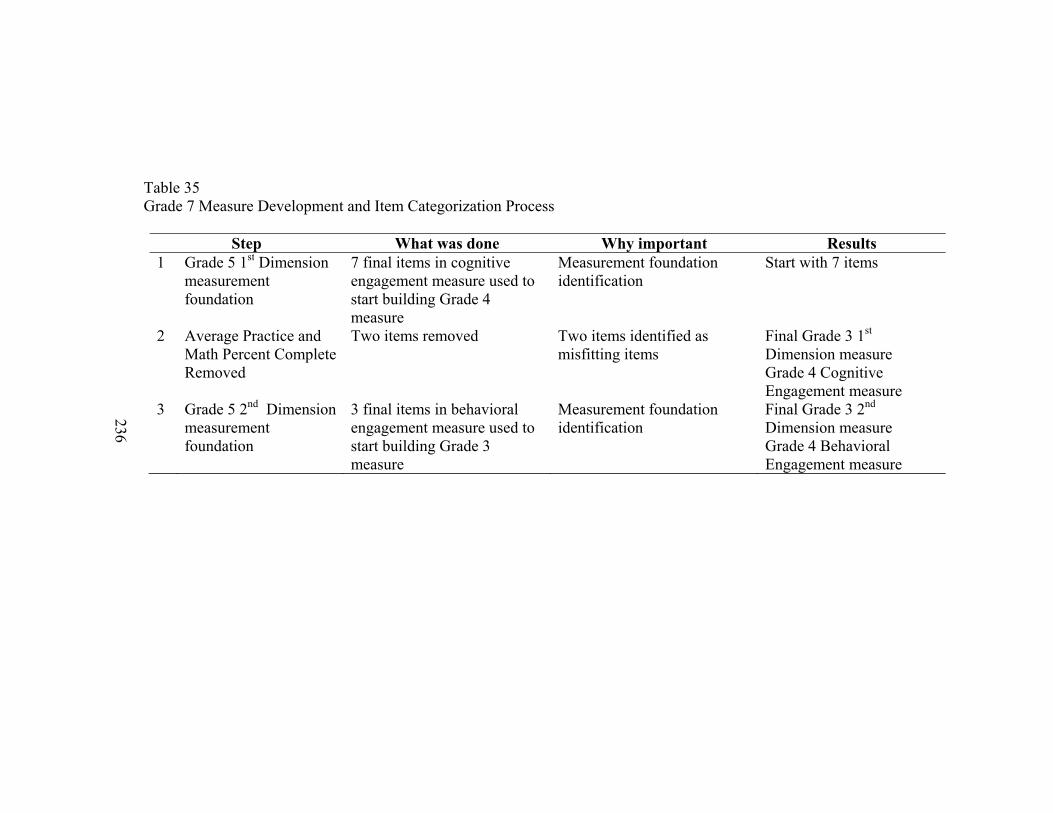
236
Table 35 Grade 7 Measure Development and Item Categorization Process
Step What was done Why important Results 1 Grade 5 1st Dimension
measurement foundation
7 final items in cognitive engagement measure used to start building Grade 4 measure
Measurement foundation identification
Start with 7 items
2 Average Practice and Math Percent Complete Removed
Two items removed Two items identified as misfitting items
Final Grade 3 1st Dimension measure Grade 4 Cognitive Engagement measure
3 Grade 5 2nd Dimension measurement foundation
3 final items in behavioral engagement measure used to start building Grade 3 measure
Measurement foundation identification
Final Grade 3 2nd Dimension measure Grade 4 Behavioral Engagement measure
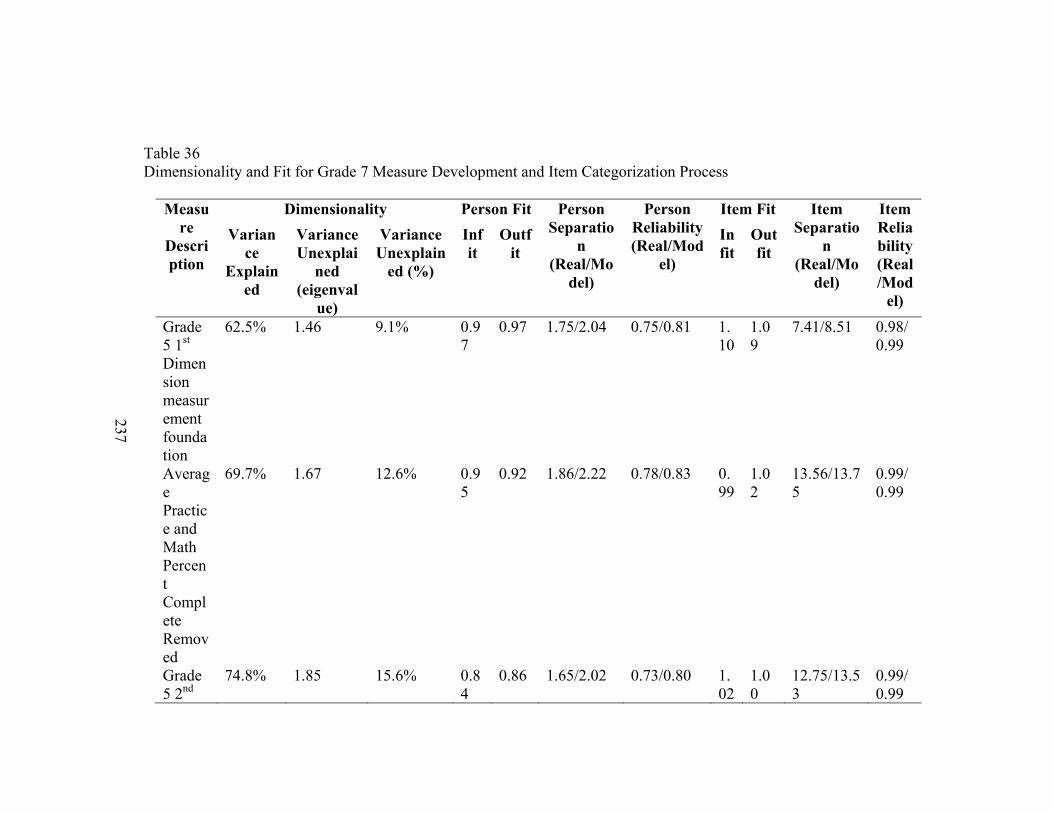
237
Table 36 Dimensionality and Fit for Grade 7 Measure Development and Item Categorization Process
Measure
Description
Dimensionality Person Fit Person Separatio
n (Real/Mo
del)
Person Reliability (Real/Mod
el)
Item Fit Item Separatio
n (Real/Mo
del)
Item Reliability (Real/Mod
el)
Variance
Explained
Variance Unexplai
ned (eigenval
ue)
Variance Unexplain
ed (%)
Infit
Outfit
Infit
Outfit
Grade 5 1st Dimension measurement foundation
62.5% 1.46 9.1% 0.97
0.97 1.75/2.04 0.75/0.81 1.10
1.09
7.41/8.51 0.98/0.99
Average Practice and Math Percent Complete Removed
69.7% 1.67 12.6% 0.95
0.92 1.86/2.22 0.78/0.83 0.99
1.02
13.56/13.75
0.99/0.99
Grade 5 2nd
74.8% 1.85 15.6% 0.84
0.86 1.65/2.02 0.73/0.80 1.02
1.00
12.75/13.53
0.99/0.99

238
Dimension measurement foundation
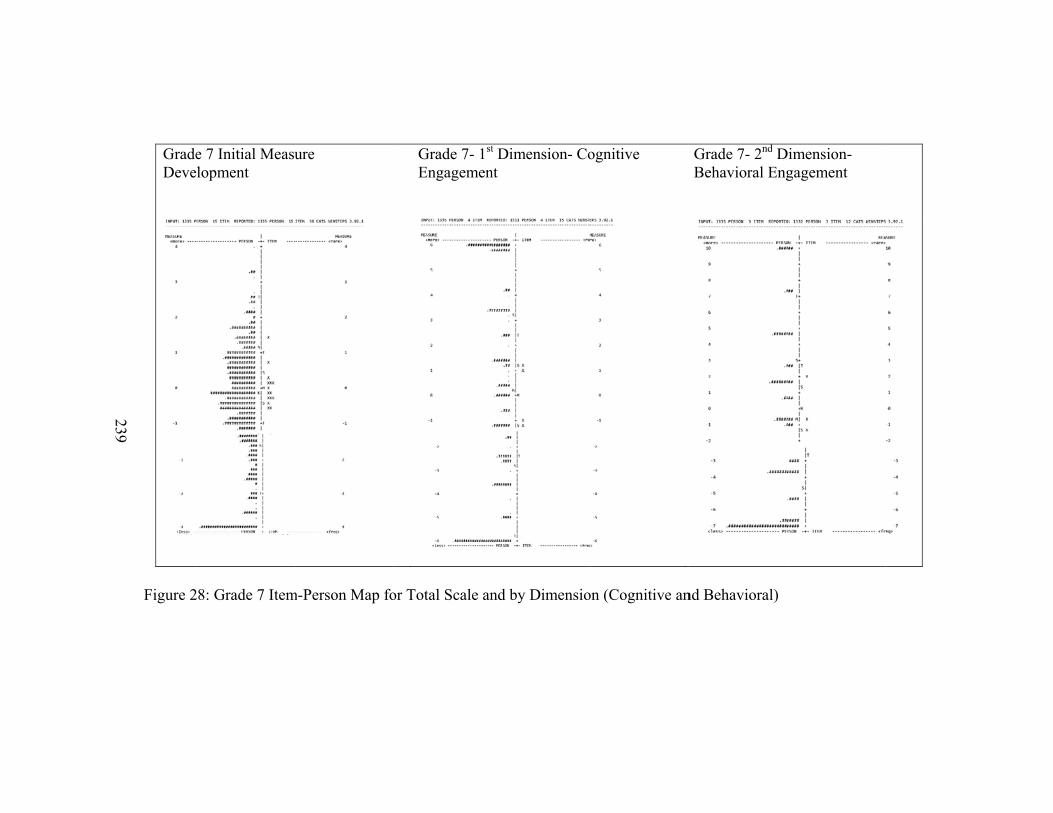
239
GradeDeve
Figure 2
e 7 Initial Measulopment
8: Grade 7 Item
ure
m-Person Map fo
Grade 7- 1st
Engagemen
or Total Scale an
t Dimension- Cont
nd by Dimensio
ognitive
on (Cognitive an
Grade 7- 2nd DBehavioral Eng
nd Behavioral)
Dimension- gagement
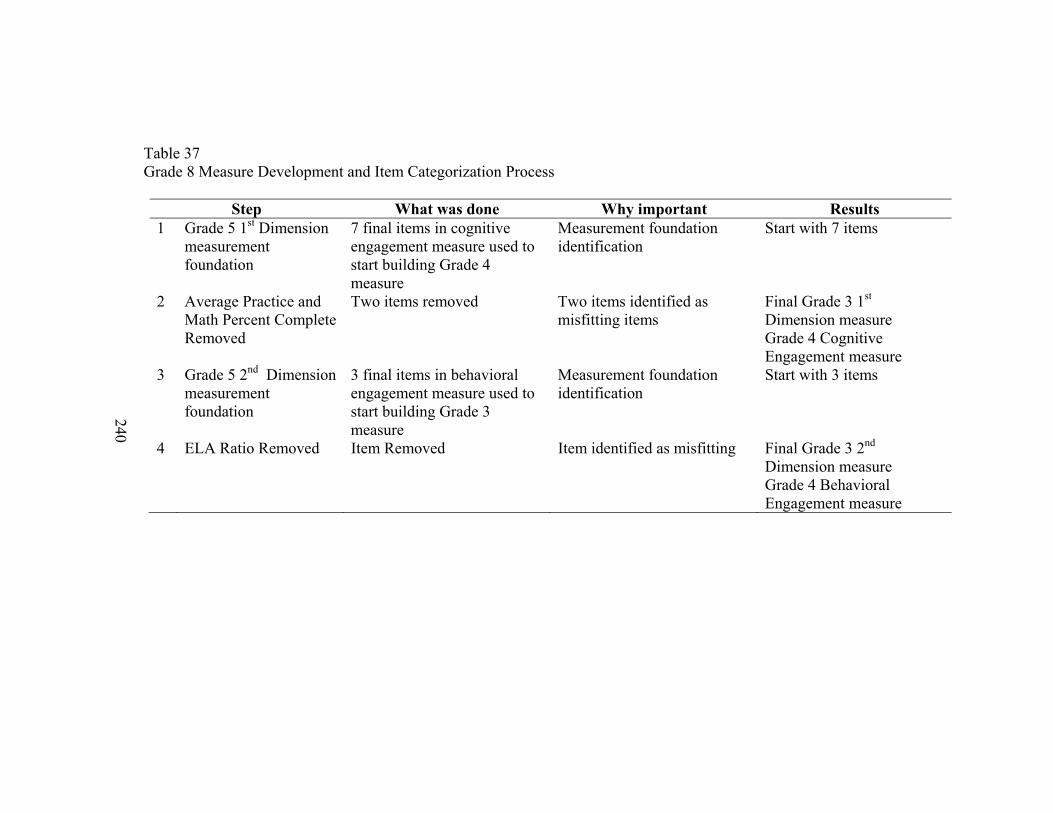
240
Table 37 Grade 8 Measure Development and Item Categorization Process
Step What was done Why important Results 1 Grade 5 1st Dimension
measurement foundation
7 final items in cognitive engagement measure used to start building Grade 4 measure
Measurement foundation identification
Start with 7 items
2 Average Practice and Math Percent Complete Removed
Two items removed Two items identified as misfitting items
Final Grade 3 1st Dimension measure Grade 4 Cognitive Engagement measure
3 Grade 5 2nd Dimension measurement foundation
3 final items in behavioral engagement measure used to start building Grade 3 measure
Measurement foundation identification
Start with 3 items
4 ELA Ratio Removed Item Removed Item identified as misfitting Final Grade 3 2nd Dimension measure Grade 4 Behavioral Engagement measure
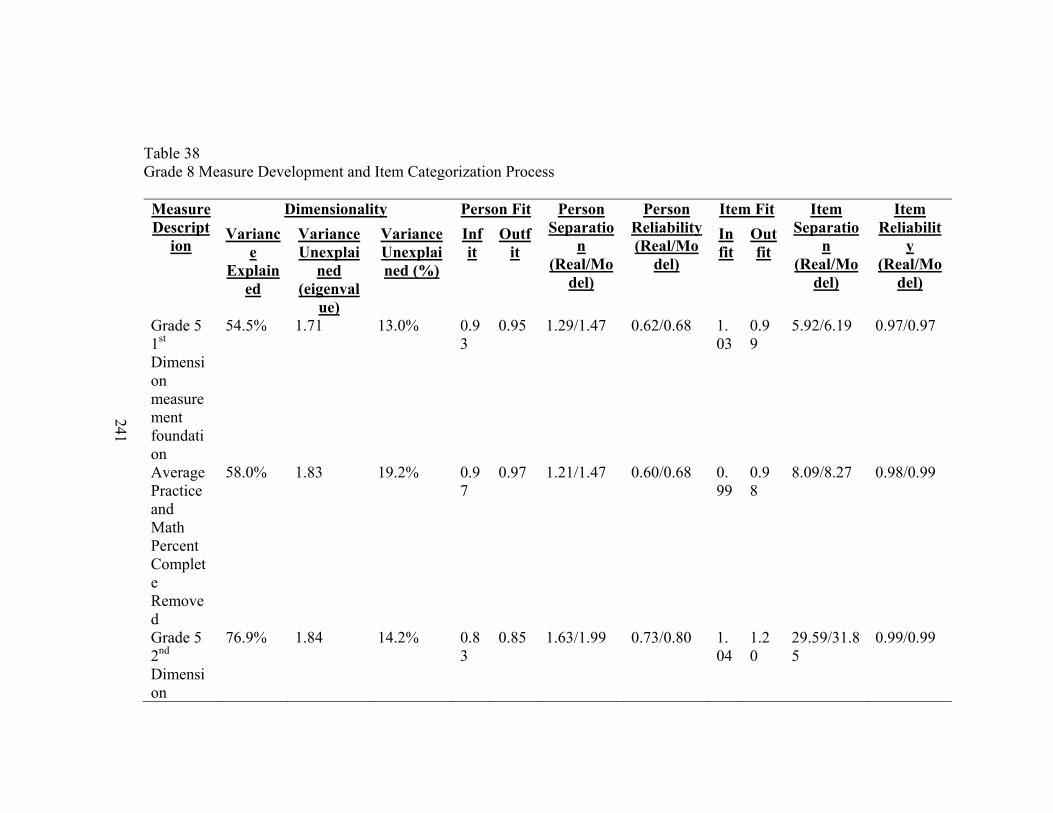
241
Table 38 Grade 8 Measure Development and Item Categorization Process Measure Descript
ion
Dimensionality Person Fit Person Separatio
n (Real/Mo
del)
Person Reliability (Real/Mo
del)
Item Fit Item Separatio
n (Real/Mo
del)
Item Reliabilit
y (Real/Mo
del)
Variance
Explained
Variance Unexplai
ned (eigenval
ue)
Variance Unexplained (%)
Infit
Outfit
Infit
Outfit
Grade 5 1st Dimension measurement foundation
54.5% 1.71 13.0% 0.93
0.95 1.29/1.47 0.62/0.68 1.03
0.99
5.92/6.19 0.97/0.97
Average Practice and Math Percent Complete Removed
58.0% 1.83 19.2% 0.97
0.97 1.21/1.47 0.60/0.68 0.99
0.98
8.09/8.27 0.98/0.99
Grade 5 2nd Dimension
76.9% 1.84 14.2% 0.83
0.85 1.63/1.99 0.73/0.80 1.04
1.20
29.59/31.85
0.99/0.99
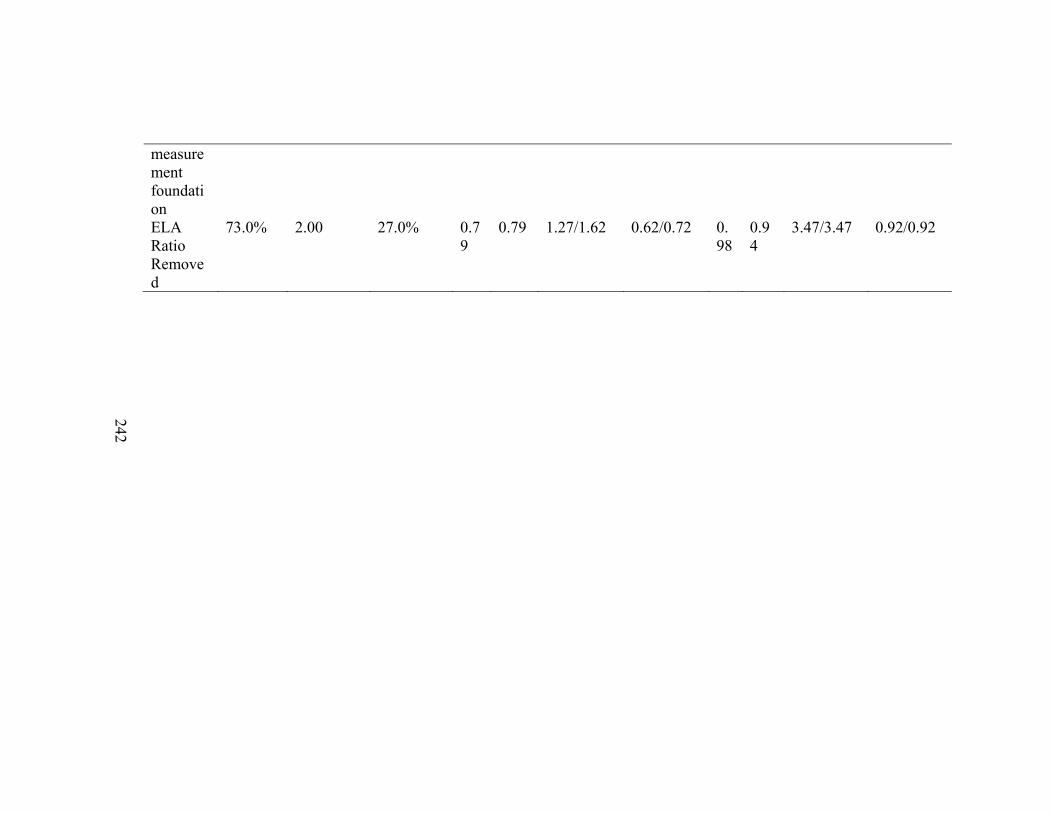
242
measurement foundation ELA Ratio Removed
73.0% 2.00 27.0% 0.79
0.79 1.27/1.62 0.62/0.72 0.98
0.94
3.47/3.47 0.92/0.92
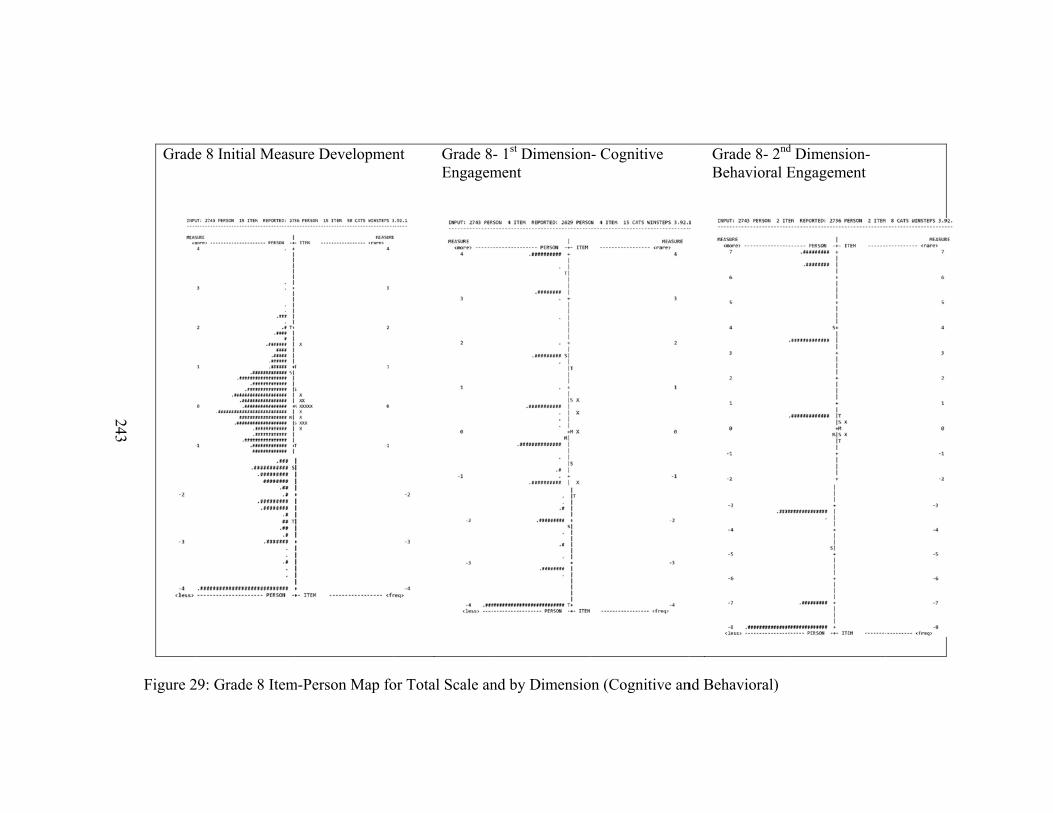
243
Grade
Figure 2
e 8 Initial Measu
9: Grade 8 Item
ure Developmen
m-Person Map fo
nt Grade 8Engagem
or Total Scale an
- 1st Dimensionment
nd by Dimensio
n- Cognitive
on (Cognitive an
Grade 8- 2nd
Behavioral E
nd Behavioral)
d Dimension- Engagement