measurement of structural vibration by using optic...
TRANSCRIPT

Contents lists available at ScienceDirect
Measurement
journal homepage: www.elsevier.com/locate/measurement
Measurement of structural vibration by using optic-electronic sensor
Qiwen Qiua, Denvid Laua,b,⁎
a Department of Architecture and Civil Engineering, City University of Hong Kong, Kowloon, Hong Kong, ChinabDepartment of Civil and Environmental Engineering, Massachusetts Institute of Technology, Cambridge, MA 02139, USA
A R T I C L E I N F O
Keywords:MeasurementMechanical vibrationOptic-electronic sensorRemote monitoringSignal processingStructural element
A B S T R A C T
Optic-electronic sensor offers the capacity to collect the information of vibration behavior for a structural ele-ment. It is attractive to be used in the structural health control and monitoring due to its simplicity and low cost.This study aims to develop a new methodology to quantitatively measure the structural vibration by using optic-electronic sensor. In this work, the optic-electronic based measurement of vibration is compared to accel-erometer measurement for validation. Our methodology is demonstrated towards a variety of material systems(i.e. fiber reinforced polymer (FRP)-bonded concrete panel, pine wood bar, cell phone screen, and real concretecolumn bonded with ceramic tiles). It is envisioned that our approach of measuring structural vibration by usingthe optic-electronic sensor will be much more economical than the existing approaches based on laser Dopplervibrometer.
1. Introduction
Using an appropriate sensor system for an accurate and swift col-lection of information (dynamic or static response) from a structure hasbecome an important issue in structural health control and monitoring.During the past few decades, a large amount of sensors have been de-veloped and demonstrated to be able to collect the dynamic data of avibrating structure. Most of the sensors depend on receiving the me-chanical wave propagation on or inside the structure, such as accel-erometer [1,2] and piezoelectric transducer [3,4]. These sensors canperform an extremely accurate interpretation of structural vibration,but a lot of preparation work is required such as installing the sensorson a structural surface [5]. Due to the requirement of contact withstructural surface, most mechanical-wave based sensors cannot be ap-plied in material systems located in extreme or prohibitive environ-ments. Besides, the additional mass from these sensors can greatly af-fect the measurement accuracy when the tested object is small incomparison to the sensor size [6]. To address the above limitations,non-contact sensors are desirable for structural vibration measurement.
Generally, non-contact sensors are worked by receiving the elec-tromagnetic wave from the tested object. Optic-electronic sensor is oneof the common non-contact sensors, which is promising to be adoptedfor structural vibration analysis. Currently, the optic-electronic sensorhas been used as a key device component in laser Doppler vibrometerthat can accurately measure the surface vibration. In fact, the laserDoppler vibrometer is quite expensive for product itself and the main-tenance cost. Besides, the big volume and heavy weight of laser Doppler
vibrometer make this device not conveniently used in a limited op-erational space. With the increasing demands of accurate, economicand miniaturized measurement, the present research work deals withdeveloping a new methodology which involves in using a small andbudget optic-electronic sensor for measuring the structural vibration.This measurement method is conducted by collecting the optical signal(laser light) reflected from a structure and transforming the opticalsignal into electrical signal. The electrical signal can be further col-lected by a data acquisition (DAQ) system and then presented by acomputer. When vibration of a structure occurs, the propagation ofreflective laser light is altered. This can result in the modification oflight intensity received by the optic-electronic sensor. Thus, the vibra-tion behavior of structural element can be characterized by the chan-ging electrical signal. The mathematical relationship between the sur-face vibration displacement and the measured electrical signal isquantified and validated in this study. It is believed that this metho-dology is more economical for surface vibration measurement com-pared with the existing laser Doppler vibrometer.
A large amount of methods have been proposed to excite the vi-bration of structural element so that evaluating the performance ofsensor measurement can be taken. Using the impact load is an effectiveway to excite a structural object before vibration measurement [7,8].But this mechanical force may impair the structure when the impactstrength is not well controlled. Partial vacuum by means of a suctioncup has also been adopted for creating the structural displacement [9].However, this method requires sophisticated instruments and techno-logical skill. Moreover, it is difficult to fix the suction cup on a small or
https://doi.org/10.1016/j.measurement.2017.12.040Received 23 March 2017; Received in revised form 26 October 2017; Accepted 29 December 2017
⁎ Corresponding author at: Department of Architecture and Civil Engineering, City University of Hong Kong, Kowloon, Hong Kong, ChinaE-mail address: [email protected] (D. Lau).
Measurement 117 (2018) 435–443
Available online 30 December 20170263-2241/ © 2017 Elsevier Ltd. All rights reserved.
T

cylinder structure. Among the existing methods for structural excita-tion, using the acoustic wave is attractive due to the following ad-vantages: no impairment to structure, remote operation, continuousexcitation, and wide frequency band stimulation [10–17]. With thepurpose to demonstrate the feasibility of optic-electronic sensor formeasuring the vibration towards a variety of objects, acoustic waveexcitation is used for structural excitation in this research.
The objective of this study is to develop a new methodology forstructural vibration measurement by optic-electronic sensor and de-monstrate how this sensor can be used with acoustic wave excitation toobtain the vibration properties of structural element. The measurementtheory of optic-electronic sensor is presented, and the extraction ofvibration displacement from the electrical signals generated by thesensor is explored. Our methodology is verified by comparing the re-sults from an optic-electronic sensor to those from an accelerometermeasurement. Further vibration measurement with optic-electronicsensor is conducted towards a FRP-bonded concrete panel, a pine woodbar, a cell phone screen product, and a real concrete column bondedwith ceramic tiles. Our research work contributes to new developmentand application of the science and technology in sensors and in-strumentation. Besides, the knowledge and findings shown in this paperwill be of prompt use in systems evaluation and structural healthmonitoring industry.
2. Analytical investigation
2.1. Correlation between light signal and structural vibration displacement
The reflective propagation path of a laser beam from an object canbe modified if motion of incident plane occurs. Based on this me-chanism, the laser beam can reflect the vibration information on astructural surface as the incident plane. The vibrational displacement ofa structure can be determined by measuring the distance of alteredpropagation path of laser beam, as shown in Fig. 1(a). When the in-cident angle of the laser beam is α, the relationship between the mod-ified distance of reflective beam path and the surface vibration ampli-tude is expressed by Eq. (1)
=X Dtanα (1)
where D is the modified distance of reflective light path, and X is thesurface vibration amplitude. The light signal carries the vibration in-formation for a structure, which is further received by an optic-elec-tronic sensor for data analysis.
2.2. Laser intensity profile
Numerous publications have indicated that the transverse light in-tensity distribution of laser beam exhibits an approximate Gaussian
intensity profile [18–21]. The transverse irradiance distribution ofGaussian beam is expressed by Eq. (2)
= =− −
L r L e Pπw
e( ) 2o
2rw
o2
2rw
2
o2
2
o2
(2)
where r denotes the diametrical distance of a point from the beamcenter; wo denotes the radius where the beam irradiance (intensity)diminishes to e1/ 2 (≈13.5%) of its peak (i.e. r=0), and P denotes thetotal power of laser beam [22–24]. Fig. 1(b) shows the irradianceprofile of a Gaussian mode for laser light.
2.3. Light signal received by optic-electronic sensor as a function ofvibration displacement
Under the surface vibration, the changed path of reflective laserbeam causes the movement of laser illumination region on the optic-electronic sensor. It can be assumed that the optic-electronic sensormoves within the laser illumination region when the displacement of astructure occurs. According to Eq. (2), the illuminance L versus thevibration displacement X can be expressed by Eq. (3)
= =− −
⎛⎝
⎞⎠
L X L e L e( ) o
Dw o
X
w2
o
α
o
22
2tan2
2
2 (3)
where the Lo is the largest illuminance and X is the vibration amplitudefor the structural surface. Thus, the modification of illuminance LΔ as afunction of structural vibration displacement X is obtained, as describedby Eq. (4).
= − = −− −
L X L L e L eΔ ( ) (1 )o o
x
w o
X
w
( ) ( )tan α
o
tan α
o
22
2
2
22
2
2 (4)
2.4. Relationship between the light signal and the electrical signal in anoptic-electronic sensor
The optic-electronic sensor can transfer the light signal into elec-trical signal due to the photoelectric effect. With the modification of thereceived light signals, the electrical signals produced by the optic-electronic sensor are changed accordingly. Many existing studies[25–28] indicate that the current I of optic-electronic sensor can beexpressed by the following Eq. (5)
⎜ ⎟= − = − ⎡⎣⎢
⎛⎝
−− ⎞
⎠⎤⎦⎥
I I I I Iq V IR
nk Texp
( )1r f r o
s
B (5)
where Ir is the reverse current under illumination; If is the forwardcurrent of the optic-electronic sensor; V is the voltage of the P-Njunction; Rs is the series resistance; q is the elementary charge,
Fig. 1. Characteristics of light signal and surface vibration: (a) motion of a structural surface and its influence on the reflective path of laser beam and (b) irradiance profile of a Gaussianmode for intensity distribution of laser light.
Q. Qiu, D. Lau Measurement 117 (2018) 435–443
436

× −1.6 10 19; n is the coefficient of the P-N junction, approximately 1–2;kB is the Boltzmann constant, × −1.38 10 23;T is the temperature; Io is thereverse saturation current given by
= ⎛⎝
−∅ ⎞
⎠∗I A A T
qkT
· · expoB2
(6)
where A is the contact area, ∗A is the Richardson constant, and ∅B is thebarrier height [29].
If the optic-electronic sensor is open-circuited, I=0, V becomes theopen circuit voltage. Eq. (5) turns out to be
⎜ ⎟= ⎡⎣⎢
⎛⎝
− ⎞⎠
⎤⎦⎥
I I expqV
nk T1r o
oc
B (7)
Note that Ir is often known as the short circuit current, let Isc denotesthe short circuit current. Thus, the expression of the open circuit vol-tage of a photodiode is given by
⎜ ⎟= ⎛⎝
+ ⎞⎠
V nk Tq
In II
1ocB sc
o (8)
Generally, the short circuit current has a linear functional re-lationship with the light illuminance [30–32], as indicated by Eq. (9).Fig. 2 shows the relationship between the short circuit current and thelight illuminance, which is obtained from the specification of a photo-diode product (LXD66CE-G).
= =−
I cL cL esc o
X
w
( )tan α
o
22
2
2 (9)
2.5. Relationship between the vibration amplitude and the electrical signalin an optic-electronic sensor
Based on Eqs. (3), (8) and (9), we have
=
⎛
⎝
⎜⎜⎜
+
⎞
⎠
⎟⎟⎟
−
V nk Tq
In cL eI
1ocB o
o
αX
wo
( 2tan2 ) 2
2
(10)
Given that under the laser illumination, ≫I Isc 0, ≫I I/ 1sc 0 [33], Eq.(10) can be simplified into Eq. (11).
≈
⎛
⎝
⎜⎜⎜
⎞
⎠
⎟⎟⎟
−
V nk Tq
In cL eIoc
B o
o
tan αX
wo
( 22 ) 2
2
(11)
Since that n, kB, T, q, c, Lo, Io, tan2α, and wo are constants, Eq. (11)can be simplified as
≈ +a bXVoc2 (12)
where a and b are constants to be determined. Here, the direct-current(DC) component can be eliminated by using capacitive coupling (alsoknown as AC coupling). Even though the capacitive coupling may resultin nonlinear distortion of signals at low frequencies, this can be avoidedby choosing capacitor types with low enough voltage coefficient (putthe cutoff frequency far lower than the signal frequencies). Hence, wefurther derive the AC voltage signal Vac.
≈V bXac2 (13)
Since that vibration displacement X may have two directions (−X and+X), the output signal Vac is rewritten accordingly by Eq. (14).
≈ ⎧⎨⎩
+ >− <
EbX XbX X
, ( 0), ( 0)ac
2
2 (14)
In Eq. (14), the positive and the negative values of X are referred totwo different directions of vibration displacement. This is the derivedrelationship between the electrical signal from optic-electronic sensorand the vibration amplitude of the tested surface. Let E have the fol-lowing Eq. (15).
= ⎧⎨⎩
>
− <E
E E
E E
, ( 0)| | , ( 0)
ac ac
ac ac (15)
Hence, Eq. (16) is obtained.
≈E kX (16)
Further experimental work should be carried out to examine that Xis proportional to E so that Eq. (16) is validated to calculate thestructural vibration displacement from the electrical signals measuredby optic-electronic sensor.
3. Experimental program
3.1. Sensors
The optic-electronic sensor utilized in this research was a siliconphotodiode, as shown in Fig. 3(a). The properties of the silicon pho-todiode are given in Table 1. In order to amplify the signals producedby the optic-electronic sensor, a signal simplifier (instrumentationamplifier AD8429) was used. The circuit diagram including the optic-electronic sensor and the signal simplifier is presented in Fig. 4(a), andthe corresponding product is shown in Fig. 4(b). The signal amplifica-tion was determined by Resistance B (30 Ω). The magnification factor Gfor the electrical signal was 201 (G=1 + 6000 Ω/Resistance B), ac-cording to the circuit designed in this work.
Accelerometer (Grove-3-Axis Digital Accelerometer) provided bySeeedstudio Co. Ltd was applied to obtain the actual vibration dis-placement of structural member, which was aimed to validate the re-sults from the optic-electronic sensor. Fig. 3(b) shows the configurationof the accelerometer and Table 1 lists its properties. In order to makethe two sensors (i.e. optic-electronic sensor and accelerometer) measurethe vibration of an object at the same time, a retroreflective tape wasattached on the accelerometer to reflect the laser beam towards optic-electronic sensor, as shown in Fig. 3(c). In this circumstance, the vi-bration of the accelerometer itself (actually representing the vibrationof tested object) could be obtained by the optic-electronic sensor.
3.2. Verification test
In order to verify the effectiveness of using the optic-electronicsensor to measure the vibration of structural elements, accelerometerwas adopted to measure the vibration at the same time and compare theresults to optic-electronic sensor. The verification test was conducted bymeasuring the free vibration of a cantilever metal plate. The accel-erometer (with retroreflective tape) was attached to the end of metal
Fig. 2. Relationship between the short circuit current and the light illuminance (from thespecification of a photodiode product LXD66CE-G).
Q. Qiu, D. Lau Measurement 117 (2018) 435–443
437

plate. The free vibration of structural surface was simultaneouslymeasured by the accelerometer itself and the optic-electronic sensor, asshown in Fig. 5. The incident angle of laser beam was 45 degree. Theoptic-electronic sensor was positioned at 1m distance away from thetested object. Technically, the minimum distance between sensor andobject was 20 cm since that the optic-electronic sensor required roomspace to be set up in front of structure. Since that laser beam reflectedfrom the object features spatially coherent and narrow low-divergence,the optic-electronic sensor can be placed at remote distance from theobject in field application.
Displacements in time series between these two sensors were com-pared. Due to limited range (from −5 to 5 V) of electrical signals
collected by the DAQ system in this research, the free vibration ofcantilever metal plate at the early time can cause the signal to exceedthis range. Based on our investigation, the DAQ system can normallywork when the vibration amplitude of cantilever metal plate is atte-nuated to about 0.1mm. Therefore, in this research, we recorded thesignal spectrum in a period of 1 s when the electrical response wasreduced to below 5 V.
3.3. Demonstration of vibration measurement for material systems underlaboratory condition
After validating the measurement effectiveness, the optic-electronicsensor was applied for vibration measurement for a variety of materialsystems including a carbon FRP (CFRP)-bonded concrete panel, a pinewood bar and a cell phone screen, as displayed in Fig. 6. Acoustic wavewas used to excite the vibration of these material systems, which wasperformed by a loudspeaker. In order to excite the object under dif-ferent frequencies, white noise with a wide frequency spectrum(0–20,000 Hz) was used as the acoustic source. The sound pressure levelwas set as 120 dB to provide adequate acoustic energy. The range ofavailable sampling rate was from 1 to 50,000, based on the capacity ofDAQ system used in this study. When measuring the above three ob-jects, the sampling rate was set as 50,000. This indicates that ourmeasurement technique can deal with the structural vibration withnatural frequency up to 25,000 Hz (corresponding Nyquist frequency),according to the Nyquist sampling criterion. When higher sampling rateis required for structural measurement, a better DAQ system can beadopted in this approach.
The dimension of CFRP-bonded concrete panel was
Fig. 3. Sensors used in this research work: (a) optic-electronic sensor; (b) accelerometer; (c) accelerometer attached with a retroreflective tape.
Table 1Properties of optic-electronic sensor and accelerometer (from the manufacturer).
Optic-electronic sensor Property Value UnitReverse voltage 5 VOperating temperature −20 to 80 °COpen circuit voltage 0.3 VShort circuit voltage 12 μADark current 5 nATerminal capacitance 500 pFPeak wavelength 550 nm
Accelerometer Size 1.5× 1.5 m2
Weight 1 gOperating voltage 3–5 VMeasurement range ± 14.7 m2/sSampling rate 100 N/sResolution 98 mm/s2
Fig. 4. Signal amplification: (a) schematic diagram and (b) photograph of circuit for amplifying the electrical signal from optic-electronic sensor.
Q. Qiu, D. Lau Measurement 117 (2018) 435–443
438
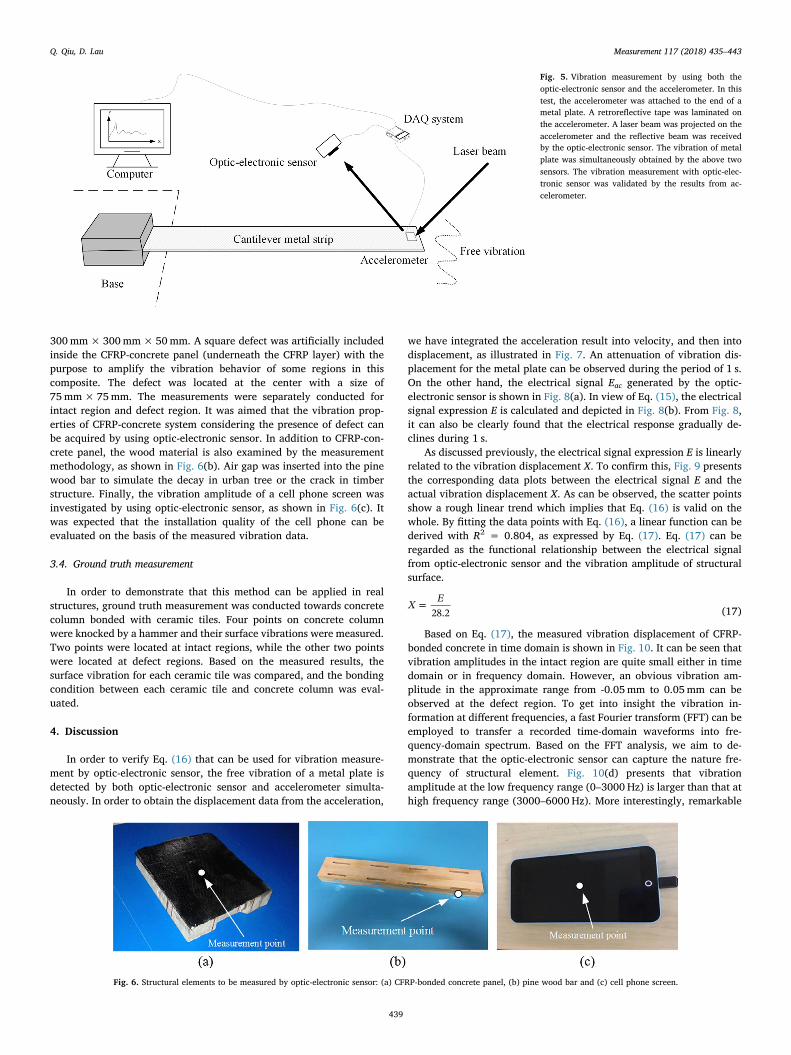
300mm×300mm×50mm. A square defect was artificially includedinside the CFRP-concrete panel (underneath the CFRP layer) with thepurpose to amplify the vibration behavior of some regions in thiscomposite. The defect was located at the center with a size of75mm×75mm. The measurements were separately conducted forintact region and defect region. It was aimed that the vibration prop-erties of CFRP-concrete system considering the presence of defect canbe acquired by using optic-electronic sensor. In addition to CFRP-con-crete panel, the wood material is also examined by the measurementmethodology, as shown in Fig. 6(b). Air gap was inserted into the pinewood bar to simulate the decay in urban tree or the crack in timberstructure. Finally, the vibration amplitude of a cell phone screen wasinvestigated by using optic-electronic sensor, as shown in Fig. 6(c). Itwas expected that the installation quality of the cell phone can beevaluated on the basis of the measured vibration data.
3.4. Ground truth measurement
In order to demonstrate that this method can be applied in realstructures, ground truth measurement was conducted towards concretecolumn bonded with ceramic tiles. Four points on concrete columnwere knocked by a hammer and their surface vibrations were measured.Two points were located at intact regions, while the other two pointswere located at defect regions. Based on the measured results, thesurface vibration for each ceramic tile was compared, and the bondingcondition between each ceramic tile and concrete column was eval-uated.
4. Discussion
In order to verify Eq. (16) that can be used for vibration measure-ment by optic-electronic sensor, the free vibration of a metal plate isdetected by both optic-electronic sensor and accelerometer simulta-neously. In order to obtain the displacement data from the acceleration,
we have integrated the acceleration result into velocity, and then intodisplacement, as illustrated in Fig. 7. An attenuation of vibration dis-placement for the metal plate can be observed during the period of 1 s.On the other hand, the electrical signal Eac generated by the optic-electronic sensor is shown in Fig. 8(a). In view of Eq. (15), the electricalsignal expression E is calculated and depicted in Fig. 8(b). From Fig. 8,it can also be clearly found that the electrical response gradually de-clines during 1 s.
As discussed previously, the electrical signal expression E is linearlyrelated to the vibration displacement X. To confirm this, Fig. 9 presentsthe corresponding data plots between the electrical signal E and theactual vibration displacement X. As can be observed, the scatter pointsshow a rough linear trend which implies that Eq. (16) is valid on thewhole. By fitting the data points with Eq. (16), a linear function can bederived with R2 = 0.804, as expressed by Eq. (17). Eq. (17) can beregarded as the functional relationship between the electrical signalfrom optic-electronic sensor and the vibration amplitude of structuralsurface.
=X E28.2 (17)
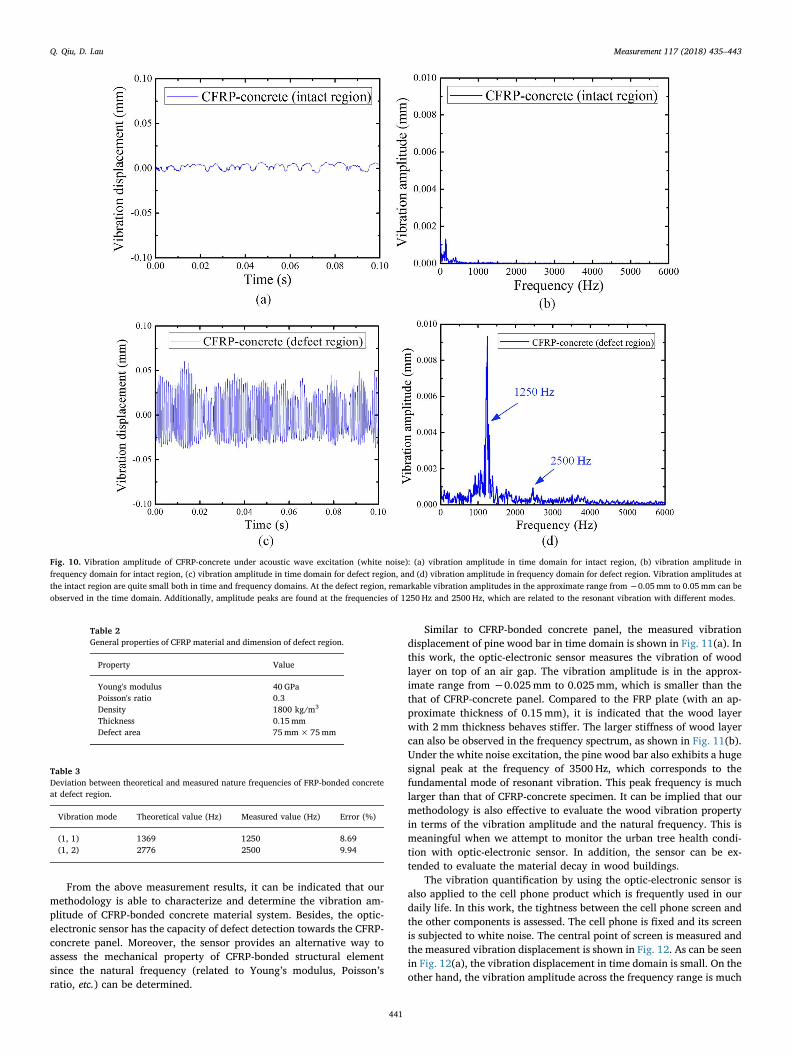
Based on Eq. (17), the measured vibration displacement of CFRP-bonded concrete in time domain is shown in Fig. 10. It can be seen thatvibration amplitudes in the intact region are quite small either in timedomain or in frequency domain. However, an obvious vibration am-plitude in the approximate range from -0.05mm to 0.05mm can beobserved at the defect region. To get into insight the vibration in-formation at different frequencies, a fast Fourier transform (FFT) can beemployed to transfer a recorded time-domain waveforms into fre-quency-domain spectrum. Based on the FFT analysis, we aim to de-monstrate that the optic-electronic sensor can capture the nature fre-quency of structural element. Fig. 10(d) presents that vibrationamplitude at the low frequency range (0–3000 Hz) is larger than that athigh frequency range (3000–6000 Hz). More interestingly, remarkable
Fig. 5. Vibration measurement by using both theoptic-electronic sensor and the accelerometer. In thistest, the accelerometer was attached to the end of ametal plate. A retroreflective tape was laminated onthe accelerometer. A laser beam was projected on theaccelerometer and the reflective beam was receivedby the optic-electronic sensor. The vibration of metalplate was simultaneously obtained by the above twosensors. The vibration measurement with optic-elec-tronic sensor was validated by the results from ac-celerometer.
Fig. 6. Structural elements to be measured by optic-electronic sensor: (a) CFRP-bonded concrete panel, (b) pine wood bar and (c) cell phone screen.
Q. Qiu, D. Lau Measurement 117 (2018) 435–443
439

signal peaks are appeared at the frequencies of 1250 Hz and 2500 Hz,which are attributed to the resonant vibration of FRP plate at the defectregion with different vibration modes. We confirm this measured peakfrequencies based on the plate vibration theory [14,34]. Given a seriesof general material properties (Table 2) for CFRP material and geo-metrical size (75mm×75mm) of defect region, the theoretical re-sonant frequencies at mode (1, 1) and mode (1, 2) are calculated as1369 Hz and 2776 Hz, following Eq. (18) [14,34].
=f λl
Dρh2 (18)
where f refers to resonant frequency; D refers to flexural rigidity of theFRP plate, which can be expressed by Eq. (19); EY, h, and v refer to theYoung’s modulus, thickness and Poisson’s ratio of FRP plate, respec-tively; λ refers to frequency parameter, 36 at mode (1,1) and 73 atmode (1,2); l refers to side length of the square plate.
=−
D E hv[12(1 )]
Y3
2 (19)
Table 3 lists the deviation between the calculated and theoreticalvalues of resonant frequency. It is claimed that the errors are less than10%, giving strong evidence that the optic-electronic sensor can effec-tively and reliably extract the nature frequency for a vibrating object.On the other hand, from Eq. (18), the defect area can be expressed byEq. (20).
=A λf
Dρh (20)
where A (l2) is the defect area. According to Eq. (20), the defect areacan be predicted by the nature frequency that is obtained from thefrequency wave spectrum.
Fig. 7. Measurement data for the vibration of a metal plate by using accelerometer: (a) acceleration signal; (b) velocity signal; (c) displacement signal.
Fig. 8. Measurement data of electrical signal (a) Eac and (b) E for the free vibration of a metal plate by using optic-electronic sensor. The attenuating electrical signals can be found duringthe period of 1 s.
Fig. 9. Relationship between the electrical signal and the actual vibration displacement.A linear trend is observed and the relationship can be expressed by X= E/28.2. It isdemonstrated that the quantitative relationship enables the measurement of vibrationdisplacement by simply using optic-electronic sensor.
Q. Qiu, D. Lau Measurement 117 (2018) 435–443
440
From the above measurement results, it can be indicated that ourmethodology is able to characterize and determine the vibration am-plitude of CFRP-bonded concrete material system. Besides, the optic-electronic sensor has the capacity of defect detection towards the CFRP-concrete panel. Moreover, the sensor provides an alternative way toassess the mechanical property of CFRP-bonded structural elementsince the natural frequency (related to Young’s modulus, Poisson’sratio, etc.) can be determined.
Similar to CFRP-bonded concrete panel, the measured vibrationdisplacement of pine wood bar in time domain is shown in Fig. 11(a). Inthis work, the optic-electronic sensor measures the vibration of woodlayer on top of an air gap. The vibration amplitude is in the approx-imate range from −0.025mm to 0.025mm, which is smaller than thethat of CFRP-concrete panel. Compared to the FRP plate (with an ap-proximate thickness of 0.15mm), it is indicated that the wood layerwith 2mm thickness behaves stiffer. The larger stiffness of wood layercan also be observed in the frequency spectrum, as shown in Fig. 11(b).Under the white noise excitation, the pine wood bar also exhibits a hugesignal peak at the frequency of 3500 Hz, which corresponds to thefundamental mode of resonant vibration. This peak frequency is muchlarger than that of CFRP-concrete specimen. It can be implied that ourmethodology is also effective to evaluate the wood vibration propertyin terms of the vibration amplitude and the natural frequency. This ismeaningful when we attempt to monitor the urban tree health condi-tion with optic-electronic sensor. In addition, the sensor can be ex-tended to evaluate the material decay in wood buildings.
The vibration quantification by using the optic-electronic sensor isalso applied to the cell phone product which is frequently used in ourdaily life. In this work, the tightness between the cell phone screen andthe other components is assessed. The cell phone is fixed and its screenis subjected to white noise. The central point of screen is measured andthe measured vibration displacement is shown in Fig. 12. As can be seenin Fig. 12(a), the vibration displacement in time domain is small. On theother hand, the vibration amplitude across the frequency range is much
Fig. 10. Vibration amplitude of CFRP-concrete under acoustic wave excitation (white noise): (a) vibration amplitude in time domain for intact region, (b) vibration amplitude infrequency domain for intact region, (c) vibration amplitude in time domain for defect region, and (d) vibration amplitude in frequency domain for defect region. Vibration amplitudes atthe intact region are quite small both in time and frequency domains. At the defect region, remarkable vibration amplitudes in the approximate range from −0.05mm to 0.05mm can beobserved in the time domain. Additionally, amplitude peaks are found at the frequencies of 1250 Hz and 2500 Hz, which are related to the resonant vibration with different modes.
Table 2General properties of CFRP material and dimension of defect region.
Property Value
Young's modulus 40 GPaPoisson's ratio 0.3Density 1800 kg/m3
Thickness 0.15mmDefect area 75mm×75mm
Table 3Deviation between theoretical and measured nature frequencies of FRP-bonded concreteat defect region.
Vibration mode Theoretical value (Hz) Measured value (Hz) Error (%)
(1, 1) 1369 1250 8.69(1, 2) 2776 2500 9.94
Q. Qiu, D. Lau Measurement 117 (2018) 435–443
441

smaller than the results of CFRP-concrete panel and pine wood bar, asshown in Fig. 12(b). Vibration signal at the low frequency domain isslightly larger than that at high frequency domain. However, there is nosignificant signal peak in the frequency spectrum. This means that thecell phone is well installed without critical flaws. It is believed that thismethodology can be used to assess the integrity of cell phone. Also, itbenefits the design optimization of cell phone when the screen bendingissue is concerned. In general, the large vibration signal may indicatethe weak resistance of cell phone against the bending force. In this case,the designers may need to optimize the configuration (e.g. geometryand raw material) of cell phone.
Apart from the laboratory testing, the ground truth measurement byusing this methodology is applied towards concrete column bondedwith ceramic tiles. Our investigation finds out that the vibration signalsat defect regions experience a sudden change when a knocking force isapplied. However, this phenomenon does not happen for intact regions.Additionally, obvious frequency peaks can be found for defect regions,while no remarkable peaks are noticed for intact regions. Based on themeasured results, the structural integrity of concrete column bondedwith ceramic tiles can be evaluated. In addition to this real structure,
our methodology can also be extended to FRP-bonded concrete beam orcolumn, steel frame with thermal coating and structural floor laminatedwith wood layer. Compared to the laboratory condition, the measure-ment performance in practical field with this method may be affectedby other vibration sources (e.g. vehicle movement). When applying thisapproach in real structures, the noise influence from the surroundingmechanical vibrations should be considered and appropriate actions forreducing the noise should be made.
At the current stage, this research work is fundamental and the basisfor applying a methodology of structural vibration measurement byusing optic-electronic sensor. As compared to the vision-based tech-nique as presented in the following literatures [6,35], the instrumentsof laser and optic-electronic sensor are set up separately when con-ducting the structural measurement. This requires a lot of time for eachmeasurement point. Future improvement can be made to combine allthe instruments into one machine given that the laser and optic-elec-tronic sensor have features of small size and light weight. In this case,the measurement becomes more portable and convenient. Besides,compared to image processing technique that can extract the defectfeatures on a structural surface by using deep learning method [36,37],
Fig. 11. Vibration characteristics of pine wood bar under acoustic wave excitation (white noise): (a) vibration amplitude in time domain, (b) vibration amplitude in frequency domain. Acontinuous vibration amplitude in the approximate range from −0.025mm to 0.025mm can be observed for the pine wood bar. Besides, it is found that an amplitude peak appears ataround 3500 Hz, which is corresponded to the resonant vibration.
Fig. 12. Vibration characteristics of cell phone screen under acoustic wave excitation (white noise): (a) vibration amplitude in time domain, (b) vibration amplitude in frequency domain.A continuous vibration amplitude in the approximate range from −0.01mm to 0.01mm can be observed for the cell phone screen, which is smaller compared to CFRP-concrete and pinewood bar. Besides, no significant signal peak is found in the frequency spectrum.
Q. Qiu, D. Lau Measurement 117 (2018) 435–443
442
our measurement is carried out at a localized point rather than ascanned surface at this stage. In order to improve the efficiency of thismethod in field application, the laser array as well as optic-electronicsensor array can be designed in future work so that each measurementcan be performed with multiple points. This can significantly improvethe efficiency of structural vibration measurement. Although our ap-proach for vibration measurement seems cumbersome, the cost of laserand optic-electronic sensor is low. In addition, remote measurement ofstructural vibration by this method can be achieved. The feature ofremote detection allows this method in measuring the structural ele-ments located in dangerous or prohibitive environments.
5. Conclusions
The present study develops a new methodology of using optic-electronic sensor in structural vibration measurement. This metho-dology can achieve a more cost-efficient and convenient vibrationmeasurement and defect detection, compared with the existing laserDoppler vibrometer. Our research investigates the correlation of elec-trical signal obtained by the sensor and vibration displacement ofstructural surface. Theoretical analysis indicates that surface vibrationof an object causes the change in light intensity received by optic-electronic sensor. The generated electrical signal is correlated with thesurface vibration displacement. The study finds out that the outputvoltage has certain functional relationship with the vibration dis-placement. Experimental work has been conducted to validate thisfunction to be used in the optic-electronic sensor for vibration mea-surement. With this methodology, the measurement by optic-electronicsensor is also demonstrated towards a CFRP-concrete panel, a pinewood bar, a cell phone product, and a real concrete column bondedwith ceramic tiles. It is anticipated that this technique can be served tooptimize the mechanical design for structural elements since the vi-bration property of product can be simply acquired by the optic-elec-tronic sensor. Besides, the new application of optic-electronic sensorbenefits the defect detection and structural health control.
Acknowledgments
The authors are grateful to the financial support from CroucherFoundation through the Start-up Allowance for Croucher Scholars (No.9500012). The support from the Research Grants Council (RGC) inHong Kong through the General Research Fund (GRF) (No. 11255616)is also gratefully acknowledged.
References
[1] J. Pan, C. Zhang, X. Zhang, Real-time accurate odometer velocity estimation aidedby accelerometers, Measurement 91 (2016) 468–473.
[2] S. Kavitha, R.J. Daniel, K. Sumangala, Design and analysis of MEMS comb drivecapacitive accelerometer for SHM and seismic applications, Measurement 93 (2016)327–339.
[3] A. Venugopal, A. Agrawal, S.V. Prabhu, Performance evaluation of piezoelectricand differential pressure sensor for vortex flowmeters, Measurement 50 (2014)10–18.
[4] Y.-J. Li, G.-C. Wang, J. Zhang, Z.-Y. Jia, Dynamic characteristics of piezoelectric six-dimensional heavy force/moment sensor for large-load robotic manipulator,Measurement 45 (2012) 1114–1125.
[5] A. Maekawa, T. Takahashi, T. Tsuji, M. Noda, Experimental validation of non-contacting measurement method using LED-optical displacement sensors for vi-bration stress of small-bore piping, Measurement 71 (2015) 1–10.
[6] J.G. Chen, N. Wadhwa, Y.-J. Cha, F. Durand, W.T. Freeman, O. Buyukozturk, Modalidentification of simple structures with high-speed video using motion magnifica-tion, J. Sound Vib. 345 (2015) 58–71.
[7] D. Lau, Q. Qiu, A review of nondestructive testing approaches using mechanical andelectromagnetic waves, Proceedings of the SPIE 9804, NondestructiveCharacterization and Monitoring of Advanced Materials, Aerospace, and CivilInfrastructure 2016, 98042E, April 22, 2016, Las Vegas, Nevada, United States,(2016).
[8] C. Hsiao, C.-C. Cheng, T. Liou, Y. Juang, Detecting flaws in concrete blocks usingthe impact-echo method, NDT and E Int. 41 (2008) 98–107.
[9] F. Taillade, M. Quiertant, K. Benzarti, C. Aubagnac, Shearography and pulsed sti-mulated infrared thermography applied to a nondestructive evaluation of FRPstrengthening systems bonded on concrete structures, Constr. Build. Mater. 25(2011) 568–574.
[10] Q. Qiu, D. Lau, The sensitivity of acoustic-laser technique for detecting the defectsin CFRP-bonded concrete systems, J. Nondestr. Eval. 35 (2016) 1–10.
[11] D. Lau, Q. Qiu, A. Zhou, C.L. Chow, Long term performance and fire safety aspect ofFRP composites used in building structures, Constr. Build. Mater. 126 (2016)573–585.
[12] T. Yu, T.K. Cheng, A. Zhou, D. Lau, Remote defect detection of FRP-bonded concretesystem using acoustic-laser and imaging radar techniques, Constr. Build. Mater. 109(2016) 146–155.
[13] Q. Qiu, D. Lau, Experimental evaluation on the effectiveness of acoustic-lasertechnique towards the FRP-bonded concrete system, Proceedings od the SPIE 9437,Structural Health Monitoring and Inspection of Advanced Materials, Aerospace, andCivil Infrastructure 2015, 943705, April 1, 2015, San Diego, California, UnitedStates, 2015.
[14] T.K. Cheng, D. Lau, Vibrational characteristics of FRP-bonded concrete interfacialdefects in a low frequency regime, Proceedings of SPIE 9063, NondestructiveCharacterization for Composite Materials, Aerospace Engineering, CivilInfrastructure, and Homeland Security 2014, 90630R, April 10, 2014, San Diego,California, United States, (2014).
[15] D. Lau, One dimensional predictive model of interfacial stiffness in FRP-bondedconcrete system using acoustic-laser technique, Proceedings of the SPIE 8694,Nondestructive Characterization for Composite Materials, Aerospace Engineering,Civil Infrastructure, and Homeland Security 2013, 86940W, April 16, 2013, SanDiego, California, United States, (2013).
[16] T.K. Cheng, D. Lau, A photophone-based remote NDT approach to interfacial defectdetection in FRP-bonded systems, Struct. Health Monitor. (2017) 1–10.
[17] Q. Qiu, D. Lau, A novel approach for near-surface defect detection in FRP-bondedconcrete systems using laser reflection and acoustic-laser techniques, Constr. Build.Mater. 141 (2017) 553–564.
[18] L. Lévesque, Divergence of far-infrared laser beam and collimation for Galilean andKeplerian system designs, Opt. Laser Technol. 41 (2009) 557–561.
[19] A.A. Alkelly, H. Al-Nadary, I.A. Alhijry, The intensity distribution of hollowGaussian beams focused by a lens with spherical aberration, Opt. Commun. 284(2011) 322–329.
[20] S.D. Patil, M.V. Takale, V.J. Fulari, D.N. Gupta, H. Suk, Combined effect of pon-deromotive and relativistic self-focusing on laser beam propagation in a plasma,Appl. Phys. B 111 (2013) 1–6.
[21] R.L. McCally, Measurement of Gaussian beam parameters, Appl. Opt. 23 (1984)2227.
[22] L.D. Dickson, Characteristics of a propagating gaussian beam, Appl. Opt. 9 (1970)1854–1861.
[23] I.A. Roberts, C.J. Wang, R. Esterlein, M. Stanford, D.J. Mynors, A three-dimensionalfinite element analysis of the temperature field during laser melting of metalpowders in additive layer manufacturing, Int. J. Mach. Tools Manuf 49 (2009)916–923.
[24] Y. Li, New expressions for flat-topped light beams, Opt. Commun. 206 (2002)225–234.
[25] F. Yakuphanoglu, Analysis of interface states of metal-insulator-semiconductorphotodiode with n-type silicon by conductance technique, Sens. Actuat., A 147(2008) 104–109.
[26] E.M. El-Menyawy, I.T. Zedan, Optical properties and device characteristics of 2-(antipyrin-4-ylhydrazono)-2-(4-nitrophenyl) acetonitrile thin films for photodiodeapplications, Spectrochim. Acta Part A Mol. Biomol. Spectrosc. 137 (2015)810–816.
[27] F. Yakuphanoglu, Photovoltaic properties of hybrid organic/inorganic semi-conductor photodiode, Synth. Met. 157 (2007) 859–862.
[28] S.M. Sze, Physics of Semiconductor Devices, John Wiley & Sons, New York, 1981.[29] E. Radziemska, E. Klugmann, Thermally affected parameters of the current-voltage
characteristics of silicon photocell, Energy Convers. Manage. 43 (2002) 1889–1900.[30] P. Schilinsky, C. Waldauf, C.J. Brabec, Recombination and loss analysis in poly-
thiophene based bulk heterojunction photodetectors, Appl. Phys. Lett. 81 (2002)3885–3887.
[31] Y. Yao, H.-Y. Chen, J. Huang, Y. Yang, Low voltage and fast speed all-polymericoptocouplers, Appl. Phys. Lett. 90 (2007) 053509.
[32] T. Yohannes, F. Zhang, M. Svensson, J.C. Hummelen, M. RAndersson, O. Inganäs,Polyfluorene copolymer based bulk heterojunction solar cells, Thin Solid Films 449(2004) 152–157.
[33] C.-F. Lin, S.-W. Liu, C.-C. Lee, J.-C. Hunag, W.-C. Su, T.-L. Chiu, C.-T. Chen, J.-H. Lee, Open-circuit voltage and efficiency improvement of subphthalocyanine-based organic photovoltaic device through deposition rate control, Sol. EnergyMater. Sol. Cells 103 (2012) 69–75.
[34] W. Soedel, Vibrations of Shells and Plates, Third Edition, CRC Press, Boca Raton,United States, 2004.
[35] Y.-J. Cha, J.G. Chen, O. Büyüköztürk, Output-only computer vision based damagedetection using phase-based optical flow and unscented Kalman filters, Eng. Struct.132 (2017) 300–313.
[36] Y.-J. Cha, W. Choi, O. Büyüköztürk, Deep learning-based crack damage detectionusing convolutional neural networks, Comput. – Aided Civ. Infrastruct. Eng. 32(2017) 361–378.
[37] Y.-J. Cha, W. Choi, Vision-based concrete crack detection using a convolutionalneural network, Dynam. Civil Struct. 2 (2017) 71–73.
Q. Qiu, D. Lau Measurement 117 (2018) 435–443
443