measurement of the in-plane shear moduli of bamboo-guadua using the iosipescu shear ......
TRANSCRIPT
10th World Bamboo Congress, Korea 2015
Theme: Architecture, Engineering and Social Housing
MEASUREMENT OF THE IN-PLANE SHEAR MODULI OF BAMBOO-GUADUA USING THE IOSIPESCU SHEAR TEST METHOD. Hector F. Archila Department of Architecture and Civil Engineering, University of Bath, Bath, UK [email protected] Martin P. Ansell Department of Mechanical Engineering, University of Bath, Bath, UK Pete Walker Department of Architecture and Civil Engineering, University of Bath, Bath, UK Abstract With the aim of assessing the in-plane shear modulus of small clear specimens of Guadua angustifolia Kunth (Guadua) before and after thermo-hydro-mechanical (THM) modifications, an Iosipescu shear test method was undertaken on small samples. This test method has been widely used in wood and composite materials but, scarcely applied on bamboo due to the difficulties associated with the production of small clear specimens according to the standards specifications. Same challenges are faced with Guadua due to its small wall thicknesses, curvature and variation in cross sectional density. This paper presents the results of the Iosipescu shear test undertaken on a control specimen (A) and specimens with two different THM treatments in an open system (B and C).Specimen B was treated from the dry state and specimen C was treated from the pre-soaked condition. Shear moduli ( ) results evaluated from the Iosipescu shear test demonstrated the effectivity of the THM treatment undertaken. For specimens A, B and C the mean results were 0.54GPa, 0.87GPa and 1.41GPa, respectively. Overall, the Iosipescu shear test method presented an adequate method for assessing the in-plane shear modulus of small samples of Guadua. Thiswork is part of ongoing research by the authorsonthe development of standardised industrial structural products from Guadua and the measurement and predicton of their mechanical behaviour. Keywords: Bamboo, Guadua angustifolia Kunth, Iosipescu shear test, Shear modulus. Introduction Although the Iosipescu shear test method was originally developed for metals and ceramics, it has been widely used for evaluating the in-plane shear properties of composite materials (ASTM 1998; Gédiac et al. 1994; Pierron & Vautrin 1994) and wood (Yoshihara et al. 1999; Kubojima et al. 2000; Xavier et al. 2004) which usually possess anisotropic properties. The Iosipescu shear test method uses a special test fixture and assumes a uniform distribution of pure shear stress between two V-notches at mid-length of the specimen. This is due to the action of two opposite loads of equal magnitude applied to the specimen that counteract the resulting moments producing a constant shear force at the specimen’s middle section. The shear and bending moment diagrams in Figure 1 illustrate this response.
10th World Bamboo Congress, Korea 2015
Theme: Architecture, Engineering and Social Housing
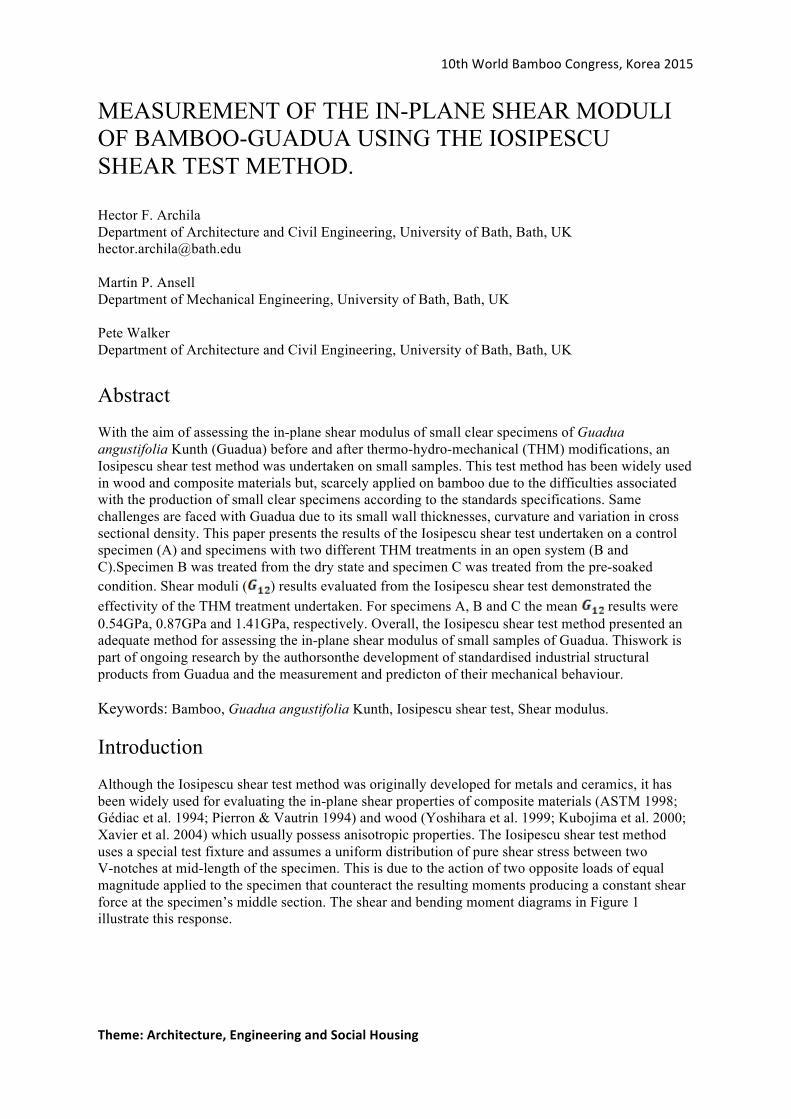
Figure 1. Iosipescu shear test: a) Force diagram, b) Shear diagram and c) Moment diagram. The cross sectional area under uniform shear stress is defined as the thickness of the specimen multiplied by the distance between the two 90º angle v-notches. Shear strain is measured between these notches by biaxial strain gauges placed on each face of the specimen at mid-length. The shear modulus is then calculated as the ratio of shear strain to shear stress. The ASTM D 5379 (ASTM 1998) standard states that elastic modulus measurements using the Iosipescu method are overestimated by about 10% in unidirectional fibre reinforced carbon/epoxy composites when tested in the 1-2 plane using samples with main fibre direction at 0º (along the X1 axis). Thus, this standard recommends the use of samples with fibre direction 0º/90º for the determination of in-plane shear modulus of unidirectional materials, which give the most accurate measurement. Errors in measurements can be introduced due to misalignment of the test fixture, twisting of the specimen and poor specimen preparation (Hodgkinson 2000). These will affect the uniform distribution of shear stress and introduce transverse tensile stresses at the notch edge. In order to account for these uncertainties correction factors can be introduced to determine the true shear moduli (Pierron & Vautrin 1994). However, studies by Xavier et al. 2004 and Yoshihara et al. 1999 on timber specimens have reported low statistical differences between apparent and true shear modulus. Other studies conducted by Chiang & He (2002) and Hawong et al. (2004) have proved through experimental and analytical models that a fairly uniform distribution of shear stress is produced in the central region of the cross-section; which is the area between the 90º angle notches. These results neglect the use of correction factors and provide confidence in the use of the Iosipescu test for determining the shear moduli of anisotropic materials such as wood and bamboo. In addition, the ASTM D 5379 (ASTM 1998)standard accepts the validity of results when strain values obtained from rosette-type strain gauges located on both sides of the specimens are averaged. Commonly, the assessment of the shear properties of Guadua is challenging and little research on the subject has been undertaken. Takeuchi-Tam (2004), Ghavami & Marinho (2005) and García et al. (2012) have reported shear moduli values that range between 0.58 and 0.644GPa using round culm sections. Shear properties of bamboo using the Iosipescu shear test fixture have never been reported (including the species Guadua). This is due to the curved geometry of bamboo and small wall thickness; however, in-plane shear modulus of samples along the direction of the grain can be assessed using the Iosipescu shear method. Based on the characteristics of the test procedure and the specimen requirements, the V-notched shear fixture was used to evaluate the shear modulus in the 1-2 plane (G12) were 1-direction denotes the orientation of the fibres and the 2-direction in which the load is applied to the Guadua samples.
a) b)
c)
10th World Bamboo Congress, Korea 2015
Theme: Architecture, Engineering and Social Housing
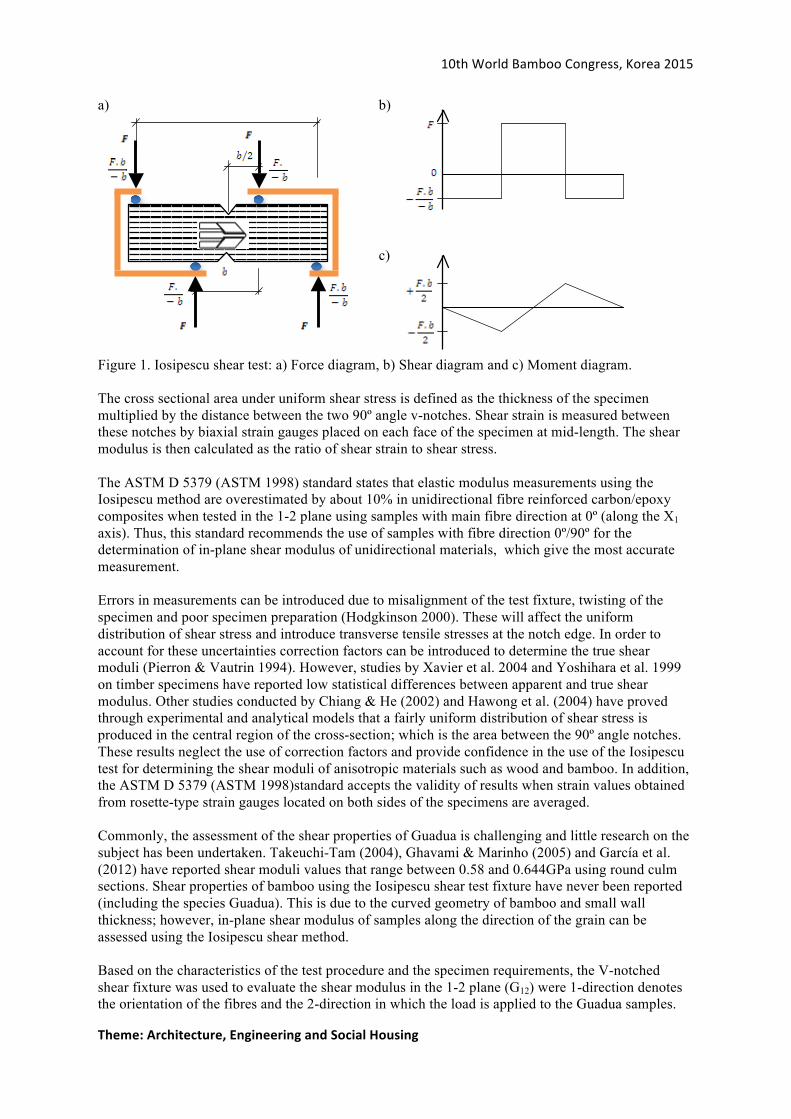
MATERIALS AND METHODS Specimens were classified as class A, B or C, depending on the treatment undertaken. Specimen A was the untreated control material. Specimen B was thermo mechanically (TM) treated from the dry state and Specimen C was thermo-hydro mechanically (THM) treated from the pre-soaked condition in an open system. Iosipescu shear test was undertaken on specimens A, B and C of Guadua angustifolia Kunth. For the preparation of the samples, two rectangular strips of A, B and C material were cut and glued longitudinally face to face using an epoxy resin. The faces of the specimens were aligned and manually clamped to guarantee a thin rigid glue line. Following a resin setting time of 24 hours, the samples were machined to a length and height of Ɩ=72mm and h=17mm, respectively. Subsequently, two 90º angle notches were machined in each sample to a depth of about 20% of their height (±4 mm). The faces and sides of the samples were sanded to the required dimensions (Figure 2). This process removed undesirable impurities to ensure good adhesion of the strain gauges.
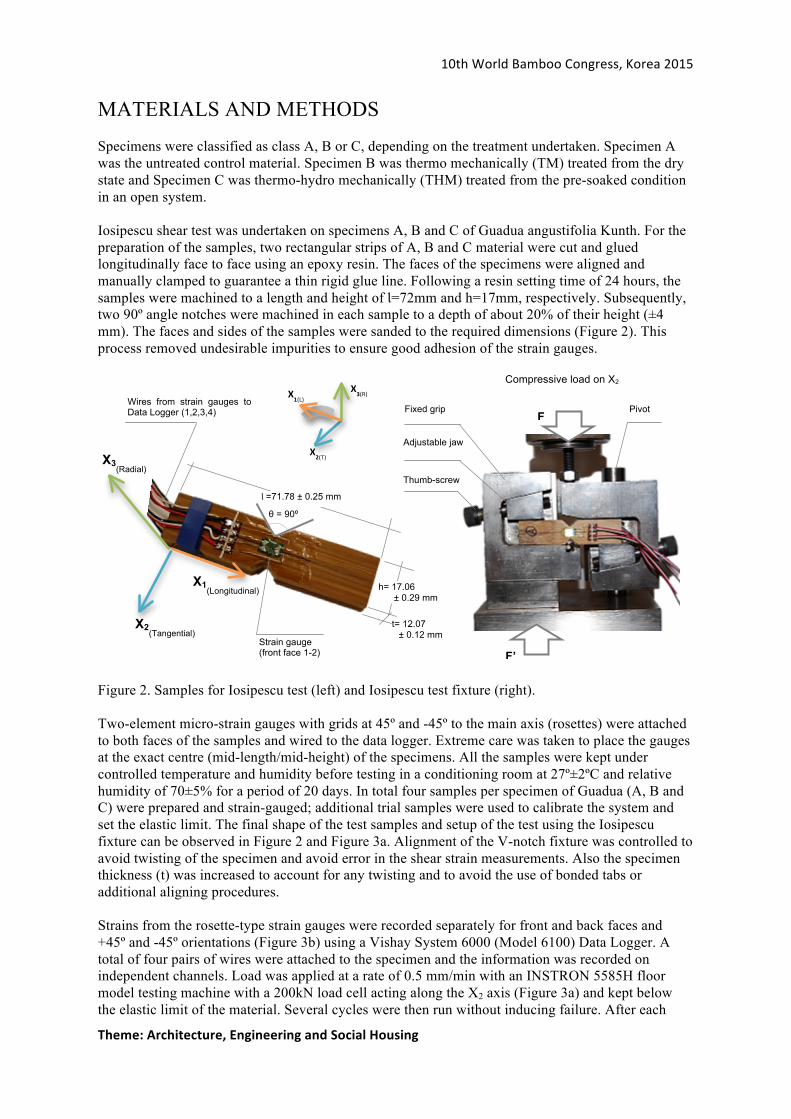
Figure 2. Samples for Iosipescu test (left) and Iosipescu test fixture (right). Two-element micro-strain gauges with grids at 45º and -45º to the main axis (rosettes) were attached to both faces of the samples and wired to the data logger. Extreme care was taken to place the gauges at the exact centre (mid-length/mid-height) of the specimens. All the samples were kept under controlled temperature and humidity before testing in a conditioning room at 27º±2ºC and relative humidity of 70±5% for a period of 20 days. In total four samples per specimen of Guadua (A, B and C) were prepared and strain-gauged; additional trial samples were used to calibrate the system and set the elastic limit. The final shape of the test samples and setup of the test using the Iosipescu fixture can be observed in Figure 2 and Figure 3a. Alignment of the V-notch fixture was controlled to avoid twisting of the specimen and avoid error in the shear strain measurements. Also the specimen thickness (t) was increased to account for any twisting and to avoid the use of bonded tabs or additional aligning procedures. Strains from the rosette-type strain gauges were recorded separately for front and back faces and +45º and -45º orientations (Figure 3b) using a Vishay System 6000 (Model 6100) Data Logger. A total of four pairs of wires were attached to the specimen and the information was recorded on independent channels. Load was applied at a rate of 0.5 mm/min with an INSTRON 5585H floor model testing machine with a 200kN load cell acting along the X2 axis (Figure 3a) and kept below the elastic limit of the material. Several cycles were then run without inducing failure. After each
θ = 90º
X3(Radial)
X1(Longitudinal)
X2(Tangential)
Ɩ =71.78 ± 0.25 mm
t= 12.07 ± 0.12 mm
h= 17.06 ± 0.29 mm
F’
Compressive load on X2
F Fixed grip Pivot
Adjustable jaw
Thumb-screw
Wires from strain gauges to Data Logger (1,2,3,4)
Strain gauge (front face 1-2)
X2(T)
X3(R)
X1(L)
10th World Bamboo Congress, Korea 2015
Theme: Architecture, Engineering and Social Housing
load cycle, the samples were taken out of the Iosipescu fixture, turned around and loaded again to offset the effects of boundary conditions.
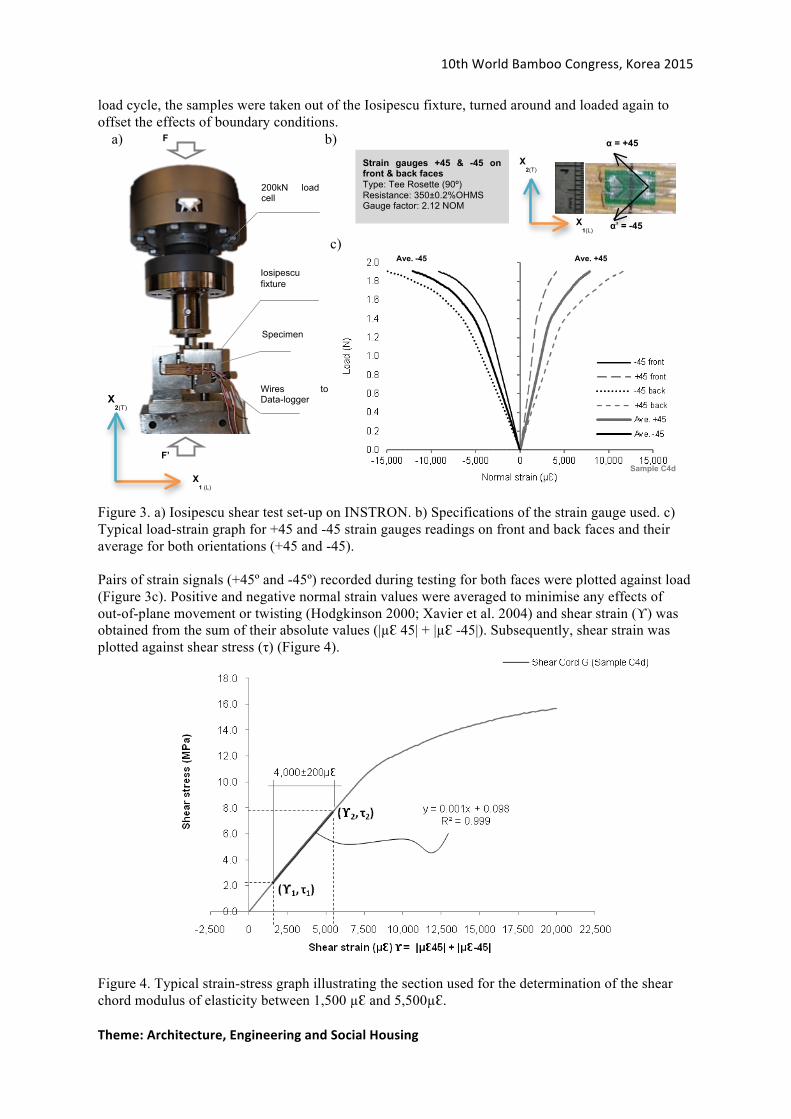
Figure 3. a) Iosipescu shear test set-up on INSTRON. b) Specifications of the strain gauge used. c) Typical load-strain graph for +45 and -45 strain gauges readings on front and back faces and their average for both orientations (+45 and -45). Pairs of strain signals (+45º and -45º) recorded during testing for both faces were plotted against load (Figure 3c). Positive and negative normal strain values were averaged to minimise any effects of out-of-plane movement or twisting (Hodgkinson 2000; Xavier et al. 2004) and shear strain (ϒ) was obtained from the sum of their absolute values (|µƐ 45| + |µƐ -45|). Subsequently, shear strain was plotted against shear stress (τ) (Figure 4).
Figure 4. Typical strain-stress graph illustrating the section used for the determination of the shear chord modulus of elasticity between 1,500 µƐ and 5,500µƐ.
Strain gauges +45 & -45 on front & back faces Type: Tee Rosette (90º) Resistance: 350±0.2%OHMS Gauge factor: 2.12 NOM
X2(T)
X1(L)
α = +45
α’ = -45
Iosipescu fixture
F’
X1 (L)
X2(T)
200kN load cell
F
Specimen
Wires to Data-logger
a) b)
c)
Sample C4d
Ave. +45
Ave. -45
10th World Bamboo Congress, Korea 2015
Theme: Architecture, Engineering and Social Housing
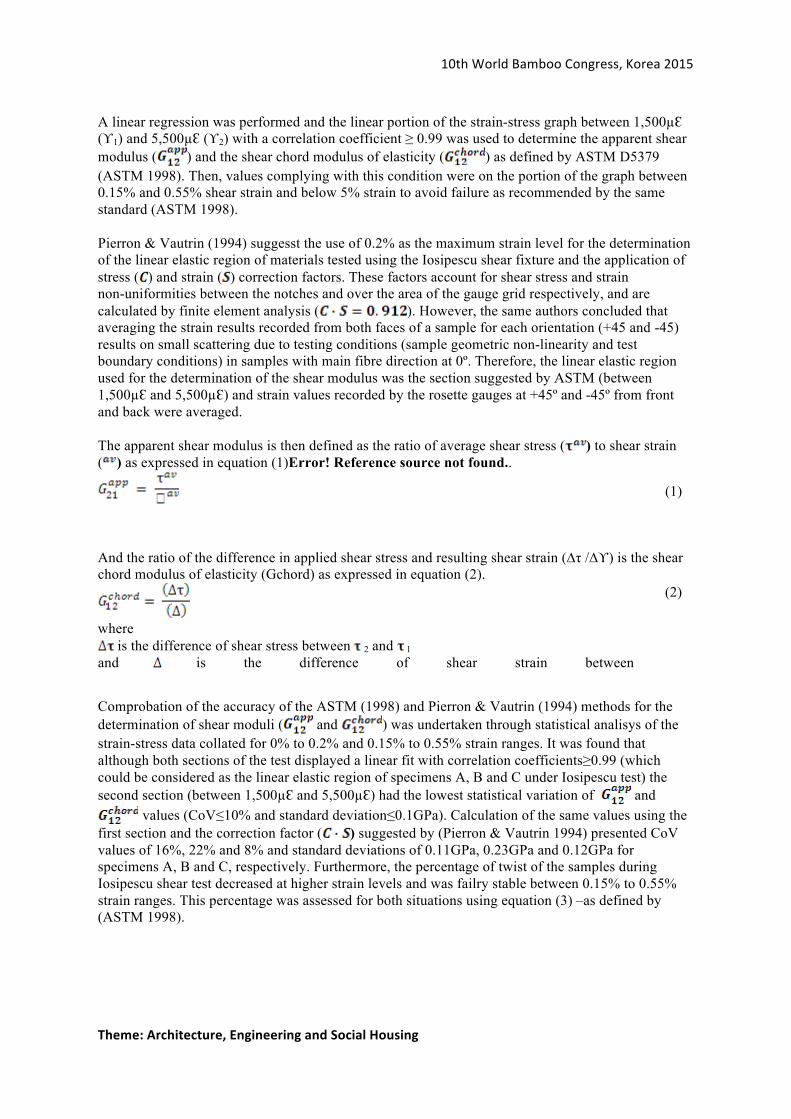
A linear regression was performed and the linear portion of the strain-stress graph between 1,500µƐ (ϒ1) and 5,500µƐ (ϒ2) with a correlation coefficient ≥ 0.99 was used to determine the apparent shear modulus ( ) and the shear chord modulus of elasticity ( ) as defined by ASTM D5379 (ASTM 1998). Then, values complying with this condition were on the portion of the graph between 0.15% and 0.55% shear strain and below 5% strain to avoid failure as recommended by the same standard (ASTM 1998). Pierron & Vautrin (1994) suggesst the use of 0.2% as the maximum strain level for the determination of the linear elastic region of materials tested using the Iosipescu shear fixture and the application of stress ( ) and strain ( ) correction factors. These factors account for shear stress and strain non-uniformities between the notches and over the area of the gauge grid respectively, and are calculated by finite element analysis ( ). However, the same authors concluded that averaging the strain results recorded from both faces of a sample for each orientation (+45 and -45) results on small scattering due to testing conditions (sample geometric non-linearity and test boundary conditions) in samples with main fibre direction at 0º. Therefore, the linear elastic region used for the determination of the shear modulus was the section suggested by ASTM (between 1,500µƐ and 5,500µƐ) and strain values recorded by the rosette gauges at +45º and -45º from front and back were averaged. The apparent shear modulus is then defined as the ratio of average shear stress ( ) to shear strain ( ) as expressed in equation (1)Error! Reference source not found..
And the ratio of the difference in applied shear stress and resulting shear strain (∆τ /∆ϒ) is the shear chord modulus of elasticity (Gchord) as expressed in equation (2).
Comprobation of the accuracy of the ASTM (1998) and Pierron & Vautrin (1994) methods for the determination of shear moduli ( and ) was undertaken through statistical analisys of the strain-stress data collated for 0% to 0.2% and 0.15% to 0.55% strain ranges. It was found that although both sections of the test displayed a linear fit with correlation coefficients≥0.99 (which could be considered as the linear elastic region of specimens A, B and C under Iosipescu test) the second section (between 1,500µƐ and 5,500µƐ) had the lowest statistical variation of and
values (CoV≤10% and standard deviation≤0.1GPa). Calculation of the same values using the first section and the correction factor ( ) suggested by (Pierron & Vautrin 1994) presented CoV values of 16%, 22% and 8% and standard deviations of 0.11GPa, 0.23GPa and 0.12GPa for specimens A, B and C, respectively. Furthermore, the percentage of twist of the samples during Iosipescu shear test decreased at higher strain levels and was failry stable between 0.15% to 0.55% strain ranges. This percentage was assessed for both situations using equation (3) –as defined by (ASTM 1998).
where
is the difference of shear stress between 2 and 1 and is the difference of shear strain between
2 and
1.
(2)
(1)

10th World Bamboo Congress, Korea 2015
Theme: Architecture, Engineering and Social Housing
RESULTS AND DISCUSSION Determination of G12 by Iosipescu shear testing. Values for the apparent shear modulus ( ) of four samples per specimen are presented in Table 1Error! Reference source not found. and plotted in Figure 5Error! Reference source not found.. Mean results per sample (e.g. A1, A2, etc.) correspond to the average of five load cycles undertaken during testing. Errors and coefficients of variation (CoV) obtained from the analysis of the results for all the samples are reported in both Table 1Error! Reference source not found. and Figure 5. This variability of results for of Guadua specimens is comparable to the widely reported variability of mechanical properties of wood (Wood 1960; Bodig & Jayne 1982; FPL 2010) where the CoV fluctuates between 10% and 30%. Table 1. Apparent shear moduli values for specimens A, B and C.
Sample Mean (GPa)
Max (GPa)
Min (GPa)
Stand dev.
CoV (%) Error (+) Error (-)
A1 0.57 0.66 0.50 0.04 7.72% 0.09 15% 0.07 12% A2 0.49 0.56 0.45 0.03 5.97% 0.07 15% 0.04 7% A3 0.54 0.64 0.44 0.07 12.15% 0.10 18% 0.10 18% A4 0.58 0.74 0.50 0.07 11.44% 0.16 28% 0.08 15%
Mean (µ) 0.54 0.05 9.3% B1 0.96 1.11 0.84 0.08 8.68% 0.15 15% 0.12 13% B2 0.89 1.05 0.78 0.08 8.94% 0.16 17% 0.12 13% B3 0.79 0.89 0.70 0.06 8.05% 0.10 12% 0.10 12% B4 0.84 0.95 0.76 0.06 6.61% 0.11 13% 0.08 10%
Mean (µ) 0.87 0.07 8.1% C1 1.41 1.53 1.28 0.08 5.37% 0.12 8% 0.13 9% C2 1.40 1.55 1.30 0.08 5.53% 0.15 11% 0.10 7% C3 1.41 1.56 1.31 0.07 5.18% 0.15 11% 0.10 7% C4 1.42 1.45 1.40 0.02 1.06% 0.03 2% 0.02 1%
Mean (µ) 1.41 0.06 4.3%
where
is the shear modulus of the sample’s side (a) and is the shear modulus of the sample’s side (b)
(3)
10th World Bamboo Congress, Korea 2015
Theme: Architecture, Engineering and Social Housing
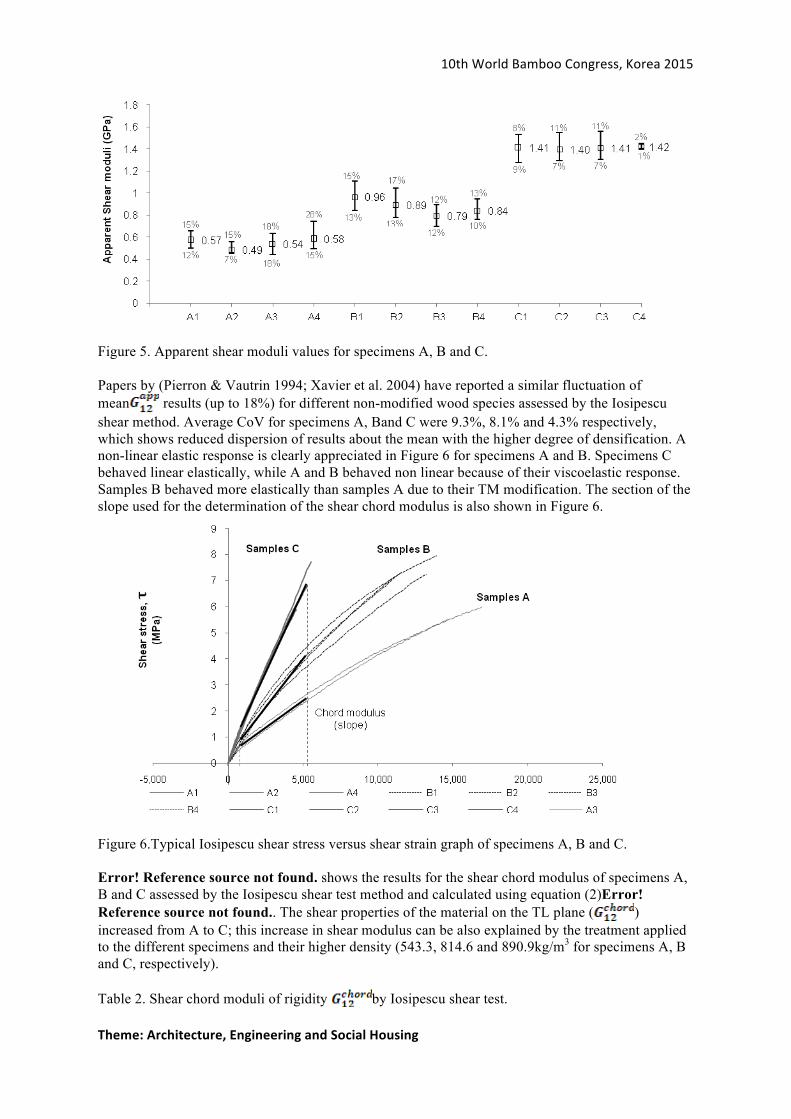
Figure 5. Apparent shear moduli values for specimens A, B and C. Papers by (Pierron & Vautrin 1994; Xavier et al. 2004) have reported a similar fluctuation of mean results (up to 18%) for different non-modified wood species assessed by the Iosipescu shear method. Average CoV for specimens A, Band C were 9.3%, 8.1% and 4.3% respectively, which shows reduced dispersion of results about the mean with the higher degree of densification. A non-linear elastic response is clearly appreciated in Figure 6 for specimens A and B. Specimens C behaved linear elastically, while A and B behaved non linear because of their viscoelastic response. Samples B behaved more elastically than samples A due to their TM modification. The section of the slope used for the determination of the shear chord modulus is also shown in Figure 6.
Figure 6.Typical Iosipescu shear stress versus shear strain graph of specimens A, B and C. Error! Reference source not found. shows the results for the shear chord modulus of specimens A, B and C assessed by the Iosipescu shear test method and calculated using equation (2)Error! Reference source not found.. The shear properties of the material on the TL plane ( ) increased from A to C; this increase in shear modulus can be also explained by the treatment applied to the different specimens and their higher density (543.3, 814.6 and 890.9kg/m3 for specimens A, B and C, respectively). Table 2. Shear chord moduli of rigidity by Iosipescu shear test.
10th World Bamboo Congress, Korea 2015
Theme: Architecture, Engineering and Social Housing
GA12
No. (GPa)
(GPa)
(GPa)
Twist (%)
GB12
No. (GPa)
(GPa)
(GPa)
Twist (%)
GC12
No. (GPa)
(GPa)
(GPa)
Twist (%)
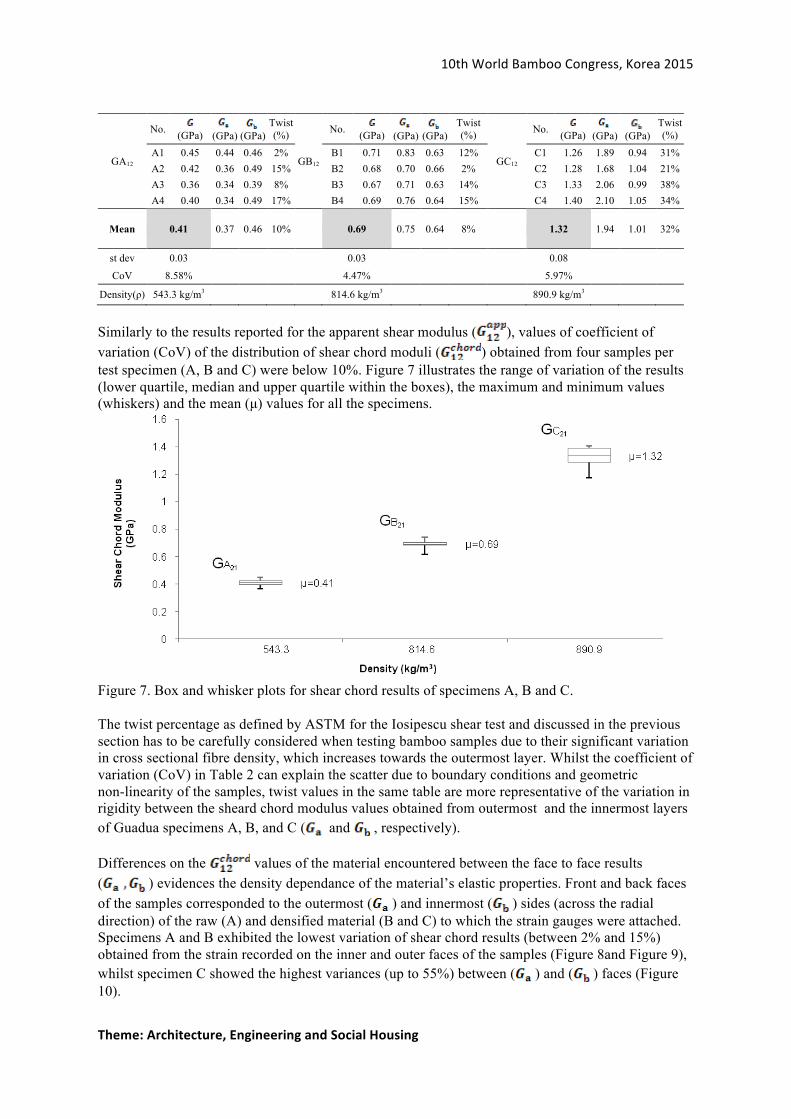
A1 0.45 0.44 0.46 2% B1 0.71 0.83 0.63 12% C1 1.26 1.89 0.94 31% A2 0.42 0.36 0.49 15% B2 0.68 0.70 0.66 2% C2 1.28 1.68 1.04 21% A3 0.36 0.34 0.39 8% B3 0.67 0.71 0.63 14% C3 1.33 2.06 0.99 38% A4 0.40 0.34 0.49 17% B4 0.69 0.76 0.64 15% C4 1.40 2.10 1.05 34%
Mean 0.41 0.37 0.46 10% 0.69 0.75 0.64 8% 1.32 1.94 1.01 32%
st dev 0.03 0.03 0.08
CoV 8.58% 4.47% 5.97%
Density(ρ) 543.3 kg/m3 814.6 kg/m3 890.9 kg/m3
Similarly to the results reported for the apparent shear modulus ( ), values of coefficient of variation (CoV) of the distribution of shear chord moduli ( ) obtained from four samples per test specimen (A, B and C) were below 10%. Figure 7 illustrates the range of variation of the results (lower quartile, median and upper quartile within the boxes), the maximum and minimum values (whiskers) and the mean (µ) values for all the specimens.
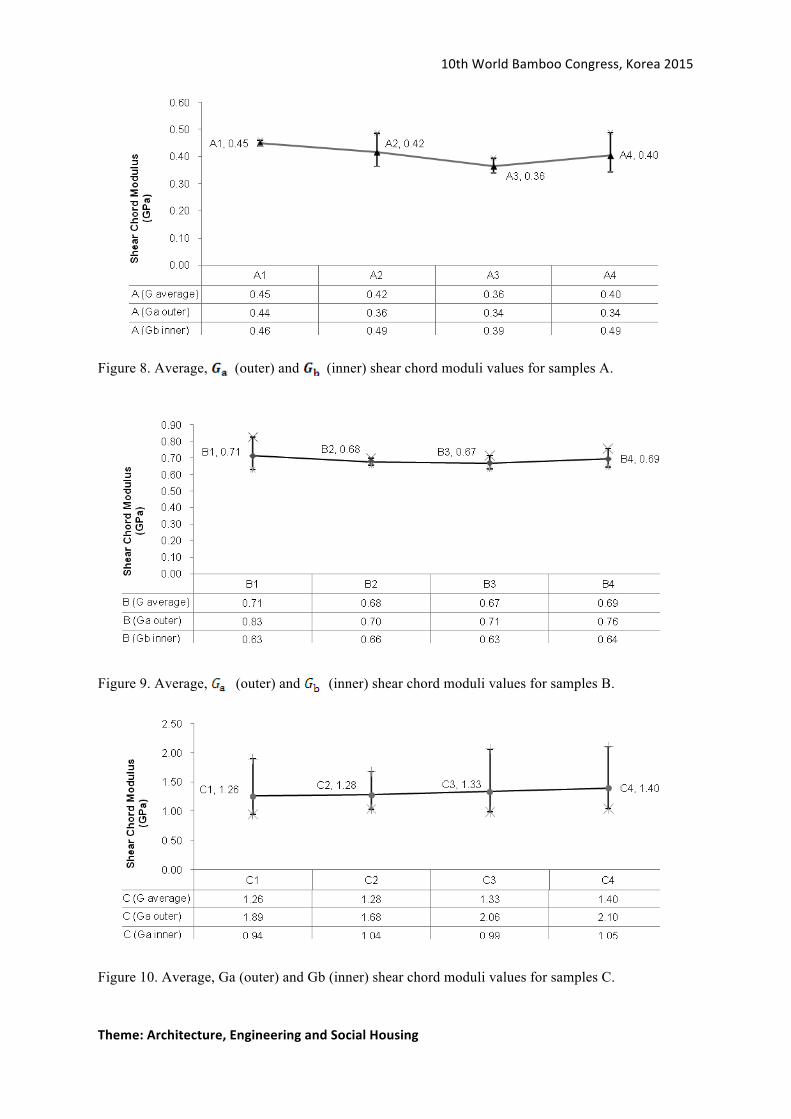
Figure 7. Box and whisker plots for shear chord results of specimens A, B and C. The twist percentage as defined by ASTM for the Iosipescu shear test and discussed in the previous section has to be carefully considered when testing bamboo samples due to their significant variation in cross sectional fibre density, which increases towards the outermost layer. Whilst the coefficient of variation (CoV) in Table 2 can explain the scatter due to boundary conditions and geometric non-linearity of the samples, twist values in the same table are more representative of the variation in rigidity between the sheard chord modulus values obtained from outermost and the innermost layers of Guadua specimens A, B, and C ( and , respectively). Differences on the values of the material encountered between the face to face results ( ) evidences the density dependance of the material’s elastic properties. Front and back faces of the samples corresponded to the outermost ( ) and innermost ( ) sides (across the radial direction) of the raw (A) and densified material (B and C) to which the strain gauges were attached. Specimens A and B exhibited the lowest variation of shear chord results (between 2% and 15%) obtained from the strain recorded on the inner and outer faces of the samples (Figure 8and Figure 9), whilst specimen C showed the highest variances (up to 55%) between ( ) and ( ) faces (Figure 10).
10th World Bamboo Congress, Korea 2015
Theme: Architecture, Engineering and Social Housing
Figure 8. Average, (outer) and (inner) shear chord moduli values for samples A.
Figure 9. Average, (outer) and (inner) shear chord moduli values for samples B.
Figure 10. Average, Ga (outer) and Gb (inner) shear chord moduli values for samples C.
10th World Bamboo Congress, Korea 2015
Theme: Architecture, Engineering and Social Housing
Higher values of at the faces of specimens C are the result of the higher degree of densification ocurring at the outer layer of Guadua subjected to the THM treatment. On separate calculations, results for the apparent shear moduli ( ) of Guadua specimens A, B and C were obtained using the strain ratio from 0% to 0.10% suggested by (Pierron & Vautrin 1994). These values were 0.69GPa, 1.03GPa and 1.56GPa with CoV of 16%, 22% and 8%, for specimens A, B and C, respectively; and resulted on values 27%, 18% and 10% higher than the results obtained in this study using the 0.15% to 0.55% strain range. Furthermore, when compared to the
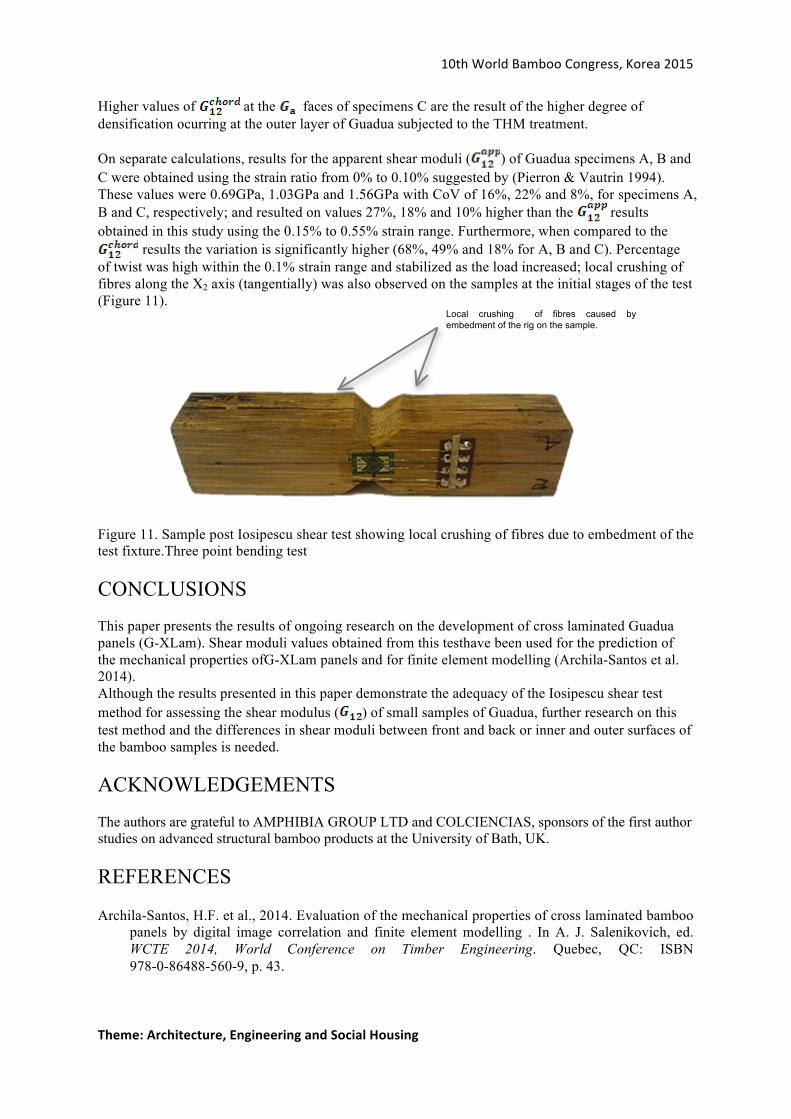
results the variation is significantly higher (68%, 49% and 18% for A, B and C). Percentage of twist was high within the 0.1% strain range and stabilized as the load increased; local crushing of fibres along the X2 axis (tangentially) was also observed on the samples at the initial stages of the test (Figure 11).
Figure 11. Sample post Iosipescu shear test showing local crushing of fibres due to embedment of the test fixture.Three point bending test CONCLUSIONS This paper presents the results of ongoing research on the development of cross laminated Guadua panels (G-XLam). Shear moduli values obtained from this testhave been used for the prediction of the mechanical properties ofG-XLam panels and for finite element modelling (Archila-Santos et al. 2014). Although the results presented in this paper demonstrate the adequacy of the Iosipescu shear test method for assessing the shear modulus ( ) of small samples of Guadua, further research on this test method and the differences in shear moduli between front and back or inner and outer surfaces of the bamboo samples is needed. ACKNOWLEDGEMENTS The authors are grateful to AMPHIBIA GROUP LTD and COLCIENCIAS, sponsors of the first author studies on advanced structural bamboo products at the University of Bath, UK. REFERENCES
Archila-Santos, H.F. et al., 2014. Evaluation of the mechanical properties of cross laminated bamboo panels by digital image correlation and finite element modelling . In A. J. Salenikovich, ed. WCTE 2014, World Conference on Timber Engineering. Quebec, QC: ISBN 978-0-86488-560-9, p. 43.
Local crushing of fibres caused by embedment of the rig on the sample.

10th World Bamboo Congress, Korea 2015
Theme: Architecture, Engineering and Social Housing
ASTM, 1998. ASTM D 5379, Standard Test Method for Shear Properties of Composite Materials by the V-Notched BEAM METHOD,
Bodig, J. & Jayne, B.A., 1982. Mechanics of wood and wood composites Reprint ed., New York, U.S.A.: Van Nostrand Reinhold Company.
Chiang, M.Y.M. & He, J., 2002. An analytical assessment of using the losipescu shear test for hybrid composites. Composites Part B: Engineering, 33(6), pp.461–470.
FPL, F.P.L., 2010. Wood Handbook: Wood as an Engineering Material, U.S. Department of Agriculture.
García, J.J., Rangel, C. & Ghavami, K., 2012. Experiments with rings to determine the anisotropic elastic constants of bamboo. Construction and Building Materials, 31, pp.52–57.
Gédiac, M., Pierron, F. & Vautrin, A., 1994. The Iosipescu in-plane shear test applied to composites: a new approach based on displacement field processing. Composites Science and Technology, 51, pp.409–417.
Ghavami, K. & Marinho, A.B., 2005. Propriedades físicas e mecânicas do colmo inteiro do bambu da espécie Guadua angustifolia. Revista Brasileira de Engenharia Agrícola e Ambiental, 9(1), pp.107–114.
Hawong, J.-S., Shin, D.-C. & Baek, U.-C., 2004. Validation of pure shear test device using finite element method and experimental methods. Engineering Fracture Mechanics, 71(2), pp.233–243.
Hodgkinson, J.M., 2000. Mechanical Testing of Advanced Fibre Composites 1st ed., Cambridge: Woodhead Publishing Ltd.
Kubojima, Y. et al., 2000. Accuracy of shear properties of wood obtained by simplified Iosipescu shear test. Journal of Wood Science, 46(4), pp.279–283.
Pierron, F. & Vautrin, A., 1994. Accurate comparative determination of the in-plane shear modulus of T300/914 by the Iosipescu and 45° off-axis tests. Composites Science and Technology, 52, pp.61–72.
Takeuchi-Tam, C.P., 2004. Comportamiento estructural de la guadua angustifolia . Uniones en guadua. REVISTA INGENIERÍA E INVESTIGACIÓN, (55), pp.3–7.
Wood, L.W., 1960. VARIATION OF STRENGTH PROPERTIES IN WOODS USED FOR STRUCTURAL PURPOSES. R1780.,
Xavier, J.C. et al., 2004. A comparison between the Iosipescu and off-axis shear test methods for the characterization of Pinus Pinaster Ait. Composites Part A: Applied Science and Manufacturing, 35(7-8), pp.827–840.
Yoshihara, H. et al., 1999. Applicability of the Iosipescu shear test on the measurement of the shear properties of wood. J Wood Sci, 45, pp.24–29.
10th World Bamboo Congress, Korea 2015
Theme: Architecture, Engineering and Social Housing
LIST OF FIGURES Figure 1. Iosipescu shear test: a) Force diagram, b) Shear diagram and c) Moment diagram. Figure 2. Samples for Iosipescu test (left) and Iosipescu test fixture (right). Figure 3. a) Iosipescu shear test set-up on INSTRON. b) Specifications of the strain gauge used. c) Typical load-strain graph for +45 and -45 strain gauges readings on front and back faces and their average for both orientations (+45 and -45). Figure 4. Typical strain-stress graph illustrating the section used for the determination of the shear chord modulus of elasticity between 1,500 µƐ and 5,500µƐ. Figure 5. Apparent shear moduli values for specimens A, B and C. Figure 6.Typical Iosipescu shear stress versus shear strain graph of specimens A, B and C. Figure 7. Box and whisker plots for shear chord results of specimens A, B and C. Figure 8. Average, (outer) and (inner) shear chord moduli values for samples A. Figure 9. Average, (outer) and (inner) shear chord moduli values for samples B. Figure 10. Average, Ga (outer) and Gb (inner) shear chord moduli values for samples C. Figure 11. Sample post Iosipescu shear test showing local crushing of fibres due to embedment of the test fixture.Three point bending test