measurement of thermal expansion coefficient using strain … · strain gage selection the type of...
TRANSCRIPT
V I S H A Y M I C R O - M E A S U R E M E N T S
MEASUREMENT OF THERMAL EXPANSION COEFFICIENT USING STRAIN GAGES
Tech Note TN-513-1
TE
CH
NO
TE
w w w. v i s h a y m g . c o m VMR-TC0513-0501
The thermal expansion coefficient is a very basic physi-cal property which can be of considerable importance in mechanical and structural design applications of a material. Although there are many published tabulations of expan-sion coefficients for the common metals and standard alloys, the need occasionally arises to measure this propertay for a specific material over a particular temperature range. In some cases (e.g., new or special alloys, composites, etc.), there is apt to be no published data whatsoever on expan-sion coefficients. In others, data may exist (and eventually be found), but may encompass the wrong temperature range, apply to somewhat different material, or be otherwise unsuited to the application.
Historically, the classical means for measuring expan-sion coefficients has been the “dilatometer”. In this type of instrument, the difference in expansion between a rod made from the test material and a matching length of quartz or vitreous silica is compared1,2. Their differential expansion is measured with a sensitive dial indicator, or with an electri-cal displacement transducer. When necessary, the expansion properties of the quartz or silica can be calibrated against the accurately known expansion of pure platinum or cop-per. The instrument is normally inserted in a special tubular furnace or liquid bath to obtain the required temperatures. Making measurements with the dilatometer is a delicate, demanding task, however, and is better suited to the mate-rials science laboratory than to the typical experimental stress analysis facility. This Tech Note provides an alternate method for easily and quite accurately measuring the expan-sion coefficient of a test material with respect to that of any reference material having known expansion characteristics.
The technique described here uses two well-matched strain gages, with one bonded to a specimen of the reference material, and the second to a specimen of the test material. The specimens can be of any size or shape compatible with the available equipment for heating and refrigeration (but specimens of uniform cross section will minimize potential problems with temperature gradients). Under stress-free conditions, the differential output between the gages on the two specimens, at any common temperature, is equal to the differential unit expansion (in/in, or m/m). Aside from the basic simplicity and relative ease of making thermal expansion measurements by this method, it has the distinct advantage of requiring no specialized instruments beyond those normally found in a stress analysis laboratory. This technique can also be applied to the otherwise difficult task
of determining directional expansion coefficients of materi-als with anisotropic thermal properties.
Because typical expansion coefficients are measured in terms of a few parts per million, close attention to proce-dural detail is required with any measurement method to obtain accurate results; and the strain gage method is not an exception to the rule. This Tech Note has been prepared as an aid to the gage user in utilizing the full precision of the modern foil strain gage for determining expansion coefficients. Given in the first of the following sections is an explanation of the technical principles underlying the method. The next section describes, in some detail, the strain-gage-related materials and procedures in making the measurement. Basically, the latter consists of essentially the same techniques required for any high-precision strain measurement in a variable thermal environment. Suggested refinements for achieving maximum accuracy are then given in the following section; after which, the principal limita-tions of the method are described.
Principle of The Measurement Method
When a resistance strain gage is installed on a stress-free specimen of any test material, and the temperature of the material is changed, the output of the gage changes cor-respondingly. This effect, present in all resistance strain gages, was formerly referred to as “temperature-induced apparent strain”, but is currently defined as thermal out-put3. It is caused by a combination of two factors. To begin with, in common with the behavior of most conductors, the resistivity of the grid alloy changes with temperature. An additional resistance change occurs because the thermal expansion coefficient of the grid alloy is usually different from that of the test material to which it is bonded. Thus, with temperature change, the grid is mechanically strained by an amount equal to the difference in expansion coef-ficients. Since the gage grid is made from a strain-sensitive alloy, it produces a resistance change proportional to the thermally induced strain. The thermal output of the gage is due to the combined resistance changes from both sources. The net resistance change can be expressed as the sum of resistivity and differential expansion effects as follows:
∆ = + −( ) ∆RR
F TG s G Gβ α α
(1)
For technical support, contact [email protected]
Tech Note TN-513-1Vishay Micro-Measurements
Measurement of Thermal Expansion Coefficient Using Strain Gages
Document Number: 11063Revision 04-Jan-05
www.vishaymg.com2
where:
ΔR/R = unit resistance change βG = thermal coefficient of resistivity of
grid material
αs – αG = difference in thermal expansion coefficients between specimen and grid, respectively
FG = gage factor of the strain gage
ΔT = temperature change from arbitrary initial reference temperature
The indicated strain due to a resistance change in the gage is:
εi
I
R RF
= ∆ /
(2)
where: FI = instrument gage factor setting
Then, the thermal output in strain units can be expressed as:
ε
β α αT O G S
G S G G
I
F T
F/ ( / ) =+ −( ) ∆
(3)
where:
εT/O(G/S) = thermal output for grid alloy G on specimen material S
Or, in the usual case, with the instrument gage factor set equal to that of the strain gage, so that FI = FG,
ε β α αT O G S
G
GS GF
T/ /( ) = + −( )
∆
(4)
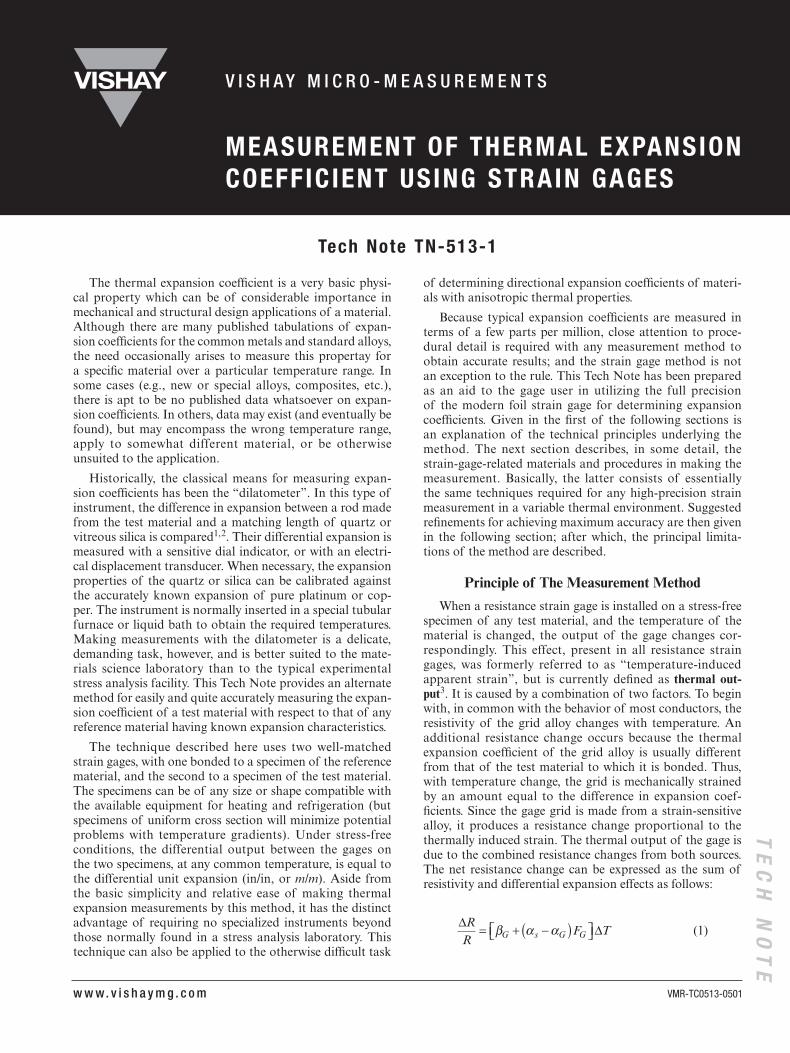
It should not be assumed from the form of Equation (4) that the thermal output is linear with temperature, since all of the coefficients within the brackets are themselves functions of temperature. As an example, typical thermal output characteristics for a Vishay Micro-Measurements A-alloy gage (self-temperature-compensated constantan grid), bonded to steel, are represented by the solid curve in Figure 1. The lot of foil identified in the upper right corner of the graph was specially processed to minimize the ther-mal output over the temperature range from about –50° to +300°F [–45° to +150°C]. Strain gages fabricated from this
lot of foil are intended for use only on material such as steel with a coefficient of expansion of approximately 6 x 10⁻⁶/°F [11 x 10-6/°C]. If the gages are installed on some other mate-rial with a different coefficient of expansion, the result is to effectively rotate the curve in Figure 1 about its reference point at +75°F [+24°C]. Installation on a material with a higher coefficient of expansion than steel will rotate the curve counterclockwise, while a material with a lower expan-sion coefficient than steel will cause clockwise rotation. For example, the broken curve labeled A in the figure illustrates the general effect of installing a gage from the subject lot on a beryllium alloy having an expansion coefficient of about 9 x 10⁻⁶/°F [16 x 10-6/°C]. Similarly, if a gage from this lot were bonded to a titanium alloy with a somewhat lower expansion coefficient than steel, the thermal output would be shifted in the manner of the broken curve labeled B.
The principle of measuring expansion coefficients with strain gages then becomes evident from Figure 1, since the rotation from one thermal output curve to the other is due only to the difference in thermal expansion properties between the materials represented by the two curves. An algebraic demonstration of the principle can be obtained by rewriting Equation (4) twice; once for the gage installed on a specimen of the test material of unknown expansion coefficient αS, and again for the same type of gage installed on a standard reference material with a known expansion coefficient αR:
ε β α αT O G S
G
GS GF
T/ /( ) = + −( )
∆
(5a)
ε β α αT O G R
G
GR GF
T/ /( ) = + −( )
∆
(5b)
Figure 1 – Rotation of the thermal output from a strain gage when installed on materials with
differing thermal expansion coefficients.
TEMPERATURE IN º CELSIUS
TEMPERATURE IN º FARENHEIT
+400
-50 0 +50
24ºC
A
B
STD
75ºF
+100 +150 -200 +250
+300
+200
+100
0
-100
-100 0 +100 +200 +300 +400 +500
-200
-300
-400
-500
AP
PAR
ENT
MIC
RO
STR
AIN
(Bas
ed o
n I
nst
rum
ent
G.F
. of
2.00
)
Lot No. A38AD497
For technical support, contact [email protected]
Measurement of Thermal Expansion Coefficient Using Strain Gages
Tech Note TN-513-1Vishay Micro-Measurements
Document Number: 11063Revision 04-Jan-05
www.vishaymg.com3
Subtracting Equation (5b) from (5a), and rearranging,
α α
ε εS R
T O G S T O G R
T− =
−( )/ ( / ) / ( / )
∆ (6)
Thus, the difference in expansion coefficients, referred to a particular temperature range, is equal to the unit differ-ence in thermal output for the same change in temperature. Although this technique for measuring expansion coef-ficients is widely applicable, and often the most practical approach, there is relatively little information about it in the technical literature. Representative applications are described in the bibliography to this Tech Note4,5.
Measurement Procedures
Reference Material
Selection of the material to be used as a reference stan-dard is naturally an important factor in the accuracy of the method, as it is for any other form of differential dila-tometry. In principle, the reference material could be any substance for which the expansion properties are accurately known over the temperature range of interest. In practice, however, it is often advantageous to select a material with expansion properties as close to zero as possible. Doing this will provide an output signal that closely corresponds to the “absolute” expansion coefficient of the test material, and permits a more straightforward test procedure. The thermal expansion of the reference material should also be highly repeatable, and stable with time at any constant temperature. In addition, the elastic modulus of the material should be great enough that mechanical reinforcement by the strain gage is negligible.
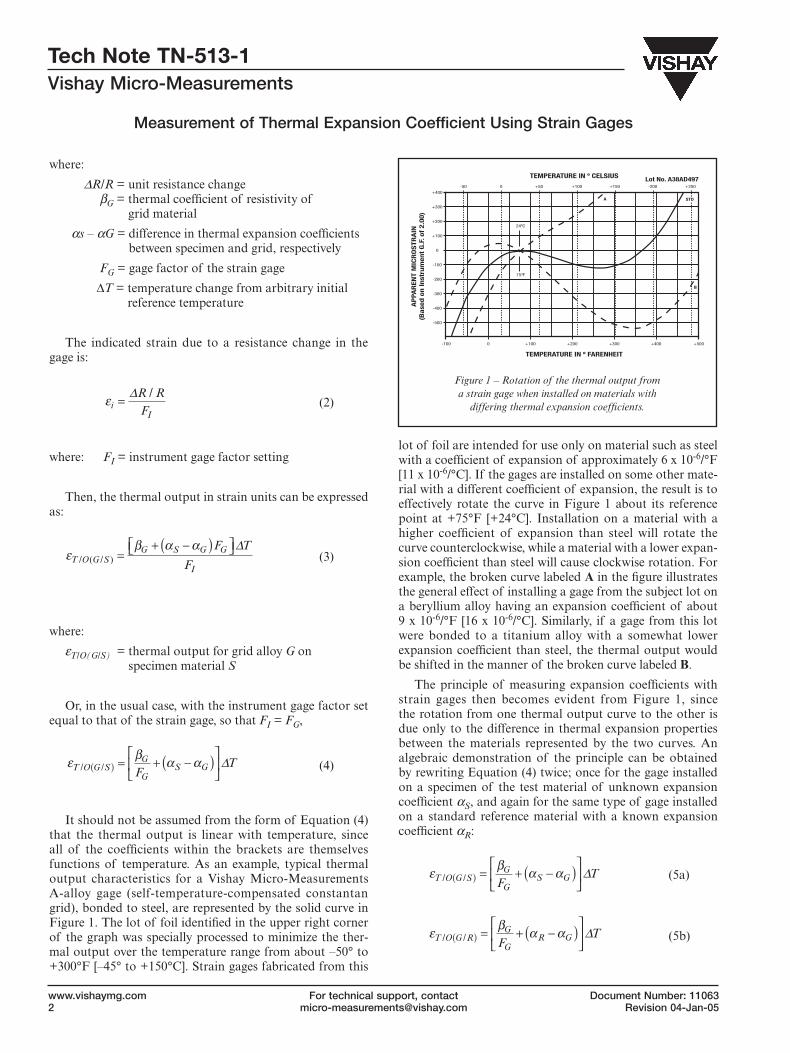
An excellent reference material with these and the other desirable properties is ULE™ Titanium Silicate Code 7971, available from Corning Glass Company, Corning, NY 14831.* As illustrated in Figure 2, this special glass has an extremely low thermal expansion coefficient, particularly over the temperature range from about –50° to +350°F [–45° to +175°C)]. It should be noted, however, that the mate-rial has a low coefficient of thermal conductivity, making it slow to reach thermal equilibrium. For optimum results, a dwell time of at least 45 minutes should be used at each new temperature point before taking data. Another potential disadvantage of titanium silicate as a reference material is its brittleness, since it will fracture readily if dropped on a hard surface. Because of the foregoing, a low-expansion metal (such as Invar or a similar alloy) may offer a prefer-able alternative if the alloy has repeatable and accurately known expansion properties over the temperature range of interest.
Strain Gage Selection
The type of strain gage selected for use in measuring expansion coefficients is also an important consideration, just as it is for stress analysis and transducer applications. Gage selection usually requires weighing a variety of fac-tors which can directly or indirectly affect the suitability of a particular gage type to a specified measurement task. To assist gage users in this process, our Tech Note TN-505 provides extensive background data for gage selection, along with procedures, recommendations, and application exam-ples6. The subject Tech Note should serve as the primary reference on gage selection, supplemented here by special considerations applicable to the measurement of expansion coefficients.
For good accuracy, combined with ease of installation, a gage from Vishay Micro-Measurements CEA Series is ordinarily a suitable choice. This assumes that the tempera-
Thermal Expansion: –80º to +150ºC
Temperature (ºC)
∆L
/L (
pp
m)
8
6
4
2
0
-2–80 –60 –40 –20 0 –20 –40 –60 –80 –100 –120 –140
Thermal Expansion: 0º to 150ºC
Temperature (ºC)
Code 7871
∆L
/L (
pp
m)
6
4
2
0
0 10 30 50 70 90 110 130 150
-2
Figure 2 – Thermal expansion characteristics of the titanium silicate reference material (data source: Corning Glass Company).
* Also available from Vishay Micro-Measurements as Part No. TSB-1. See Appendix for specimen dimensions.
For technical support, contact [email protected]
Tech Note TN-513-1Vishay Micro-Measurements
Measurement of Thermal Expansion Coefficient Using Strain Gages
Document Number: 11063Revision 04-Jan-05
www.vishaymg.com4
ture extremes for the measurements fall within the range of greatest stability and precision for the constantan foil in this type of gage [about –50° to +150°F (–45° to +65°C)]. If a wider temperature range is involved, a gage from the WK Series becomes the preferred choice. The latter gage type is somewhat stiffer, however, and consideration of reinforce-ment effects may be necessary if the test material has a low modulus of elasticity, or the test specimen is thin and nar-row.
In each of the foregoing cases, a 350Ω gage is preferable in order to minimize self-heating by the excitation current. The 350Ω gage is also advantageous in reducing the effects of small imbalances which may occur due to unsymmetric resistance changes in the leadwires with temperature. In addition, it is good practice, when feasible, to employ a medium gage length — say, 1/8 in [3 mm] or larger — for more stable operation and improved heat transfer to the substrate.
Another gage parameter to be specified is the self-tem-perature-compensation (S-T-C) number. In principle, as indicated by Equation (6), it should not matter what S-T-C number is selected. Only the difference in thermal output, for the same gage type on two different materials, is involved in the expansion calculations. Practically, however, there are two considerations which may influence the choice. One of these is the availability of the selected gage in the desired series, gage pattern, and resistance.
As a rule, the greatest selection of gages is available in the 06 and 13 S-T-C groups, since these are the most widely used compensations for stress analysis and transducer applica-tions. It will often be expedient, therefore, to specify one of the above for the S-T-C number.
When expansion measurements must be made over an extended temperature range, or at high or low temperature extremes, the S-T-C number should be carefully selected to obtain the best measurement accuracy. It is evident from Figure 1 that, with excessive mismatch between the S-T-C number of the gage and the expansion coefficient of the specimen, the slope of the thermal output curve can become very steep at one or both extreme temperatures. Under such
circumstances, a small error in temperature (or temperature deviation between the reference and test materials) can pro-duce a large error in the thermal output signal. Judicious selection of the S-T-C mismatch can be used to simultane-ously keep the slopes of the thermal output curves for both the test and reference materials under reasonably good con-trol in the temperature range of interest.
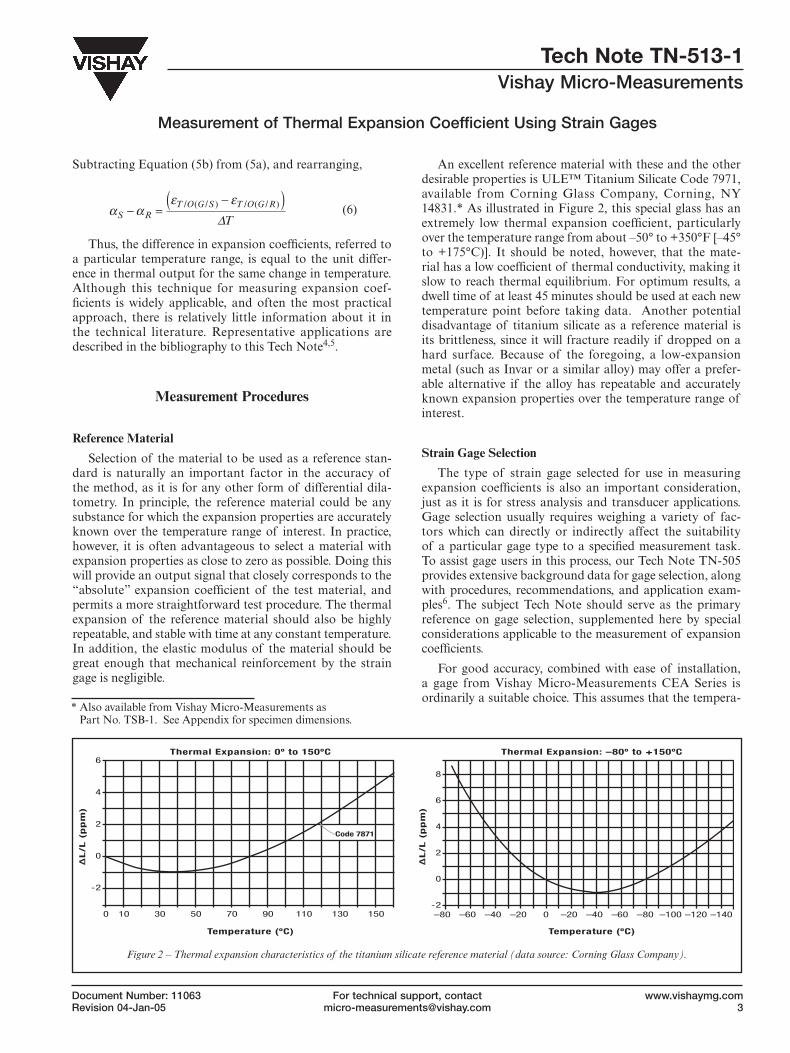
Almost any single-element “linear” grid pattern can be employed for measuring expansion coefficients. As indi-cated earlier, however, the two gages — one on the reference specimen, and one on the test material — must always be well-matched. That is, the gages must be identically the same type, and must be from the same manufacturing lot to assure closely related thermal output characteristic. Both require-ments can be met by simply using a pair of gages taken from the same package. Gages of the identical type taken from different packages, but having the same lot number, will be equally close in their thermal outputs. When a still closer relationship is desired for greater measurement accuracy, a dual-grid gage pattern such as the 125MG (Figure 3) can be selected, and the grids cut apart to form two individual gages. The resulting gages are, in effect, identical twins, and will provide the closest possible match in thermal output characteristics (as in all other properties).
Gage Installation
As noted, one of the advantages of this method is that the specimens of the reference and test materials can be of any convenient size or configuration suitable to the avail-able heating or refrigeration equipment. In fact, the two specimens can even be different in size or shape if there is a reason to have them so. In general, however, specimens should be uniform in cross section to minimize temperature gradients induced during heating or cooling; and the use of flat specimens will make for easier and higher-quality gage and temperature sensor installations. The specimens should also be large enough in cross section so that the strain gage stiffness is negligible compared to the overall section stiff-ness. Beyond the foregoing, selection of the specimen dimen-sions for about the same thermal inertia will be helpful in most quickly achieving the same temperature when both specimens are heated or cooled together.
Specimen surfaces should be thoroughly cleaned and prepared for bonding as described in Vishay Micro-Measurements Instruction Bulletin B-129, which includes specific step-by-step procedures for a wide variety of materi-als7. For best accuracy, bonding should be done with a high performance adhesive such as M-Bond 600 or 610. Both adhesives are capable of forming thin, hard “gluelines” for maximum fidelity in transmitting strains from the specimen surface to the gage. These adhesives are intended for use on relatively smooth, nonporous surfaces, and should not be used where the adhesive is required to fill surface irregu-larities or to seal pores. For the latter conditions, the recom-
Figure 3 – Vishay Micro-Measurements type 125MG dual-grid strain gage pattern.
~3.5x actual size
For technical support, contact [email protected]
Measurement of Thermal Expansion Coefficient Using Strain Gages
Tech Note TN-513-1Vishay Micro-Measurements
Document Number: 11063Revision 04-Jan-05
www.vishaymg.com5
mended adhesive is M-Bond AE-10 or AE-15. In all cases, complete instructions for applying and curing the adhesive are included in the package with the material.
Extra care is required in the selection of leadwires and their attachment to the gages, in order to obtain the most accurate results. Thermally produced resistance changes in the leadwires will generate circuit outputs which are indistin-guishable from the thermal outputs being measured. If these differ in any way between the reference and test specimens, the indicated differential expansion data will be in error accordingly. To minimize such effects, leadwire resistance should be kept as low as possible by employing a generous wire size, and by keeping the leads short. The wiring should also be the same for both specimens — in size, length, and routing. If measurements are to be made on both specimens in the same chamber or liquid bath at the same time, the leadwire should be kept physically together throughout as much of their length as practical. Leadwire insulation must be selected, of course, for compatibility with the temperature range and environment encountered in the measurements.
In attaching leadwires to the gage solder tabs or to solder terminals, the solder joints should be smooth, bright, and free of spikes or excess solder. The joints should also be as uniform as possible; and the leadwires should be dressed the same on both specimens. After lead attachment, the gage installations must be thoroughly cleaned with rosin solvent to remove all traces of soldering flux and residues.
The final step in the installation is to apply a protective coat-ing system which is appropriate to the expected test environ-ment. Since these tests are normally conducted under short-term laboratory conditions, a coating is selected for basic protection against moisture, dew point condensation in cold tests and minimum/maximum operating temperature range. The coating recommendations in the following table also take into consideration low reinforcement of the specimen. Fur- ther details on these and other coatings can be found in Vishay Micro-Measurements Strain Gage Accessories Catalog A-110.
The process of gage installation has been summarized very briefly here, since detailed instructions are supplied elsewhere in our technical publications. It should be appre-ciated, however, that proper gage installation is a basic
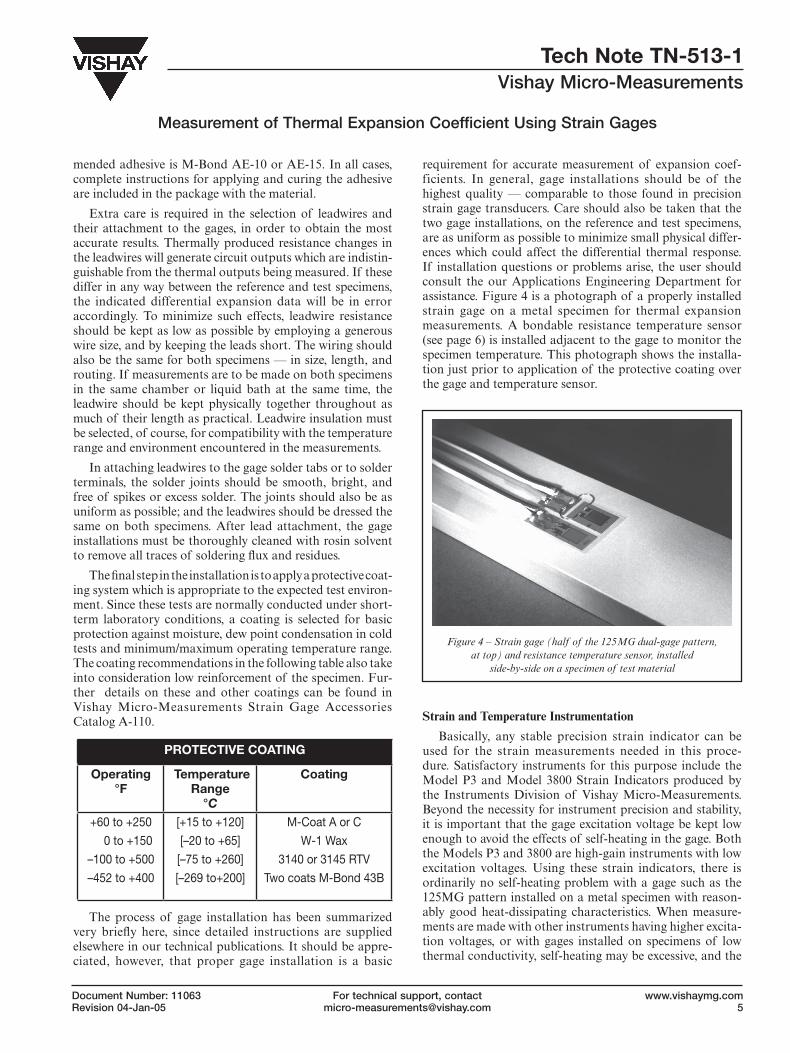
requirement for accurate measurement of expansion coef-ficients. In general, gage installations should be of the highest quality — comparable to those found in precision strain gage transducers. Care should also be taken that the two gage installations, on the reference and test specimens, are as uniform as possible to minimize small physical differ-ences which could affect the differential thermal response. If installation questions or problems arise, the user should consult the our Applications Engineering Department for assistance. Figure 4 is a photograph of a properly installed strain gage on a metal specimen for thermal expansion measurements. A bondable resistance temperature sensor (see page 6) is installed adjacent to the gage to monitor the specimen temperature. This photograph shows the installa-tion just prior to application of the protective coating over the gage and temperature sensor.
Strain and Temperature Instrumentation
Basically, any stable precision strain indicator can be used for the strain measurements needed in this proce-dure. Satisfactory instruments for this purpose include the Model P3 and Model 3800 Strain Indicators produced by the Instruments Division of Vishay Micro-Measurements. Beyond the necessity for instrument precision and stability, it is important that the gage excitation voltage be kept low enough to avoid the effects of self-heating in the gage. Both the Models P3 and 3800 are high-gain instruments with low excitation voltages. Using these strain indicators, there is ordinarily no self-heating problem with a gage such as the 125MG pattern installed on a metal specimen with reason-ably good heat-dissipating characteristics. When measure-ments are made with other instruments having higher excita-tion voltages, or with gages installed on specimens of low thermal conductivity, self-heating may be excessive, and the
PROTECTIVE COATING
Operating°F
Temperature Range
°C
Coating
+60 to +250
0 to +150
–100 to +500
–452 to +400
[+15 to +120]
[–20 to +65]
[–75 to +260]
[–269 to+200]
M-Coat A or C
W-1 Wax
3140 or 3145 RTV
Two coats M-Bond 43B
Figure 4 – Strain gage (half of the 125MG dual-gage pattern, at top) and resistance temperature sensor, installed
side-by-side on a specimen of test material
For technical support, contact [email protected]
Tech Note TN-513-1Vishay Micro-Measurements
Measurement of Thermal Expansion Coefficient Using Strain Gages
Document Number: 11063Revision 04-Jan-05
www.vishaymg.com6
voltage applied to the gage must be reduced. Comprehensive background information and guidelines for setting excita-tion voltages are provided in Tech Note TN-5028.
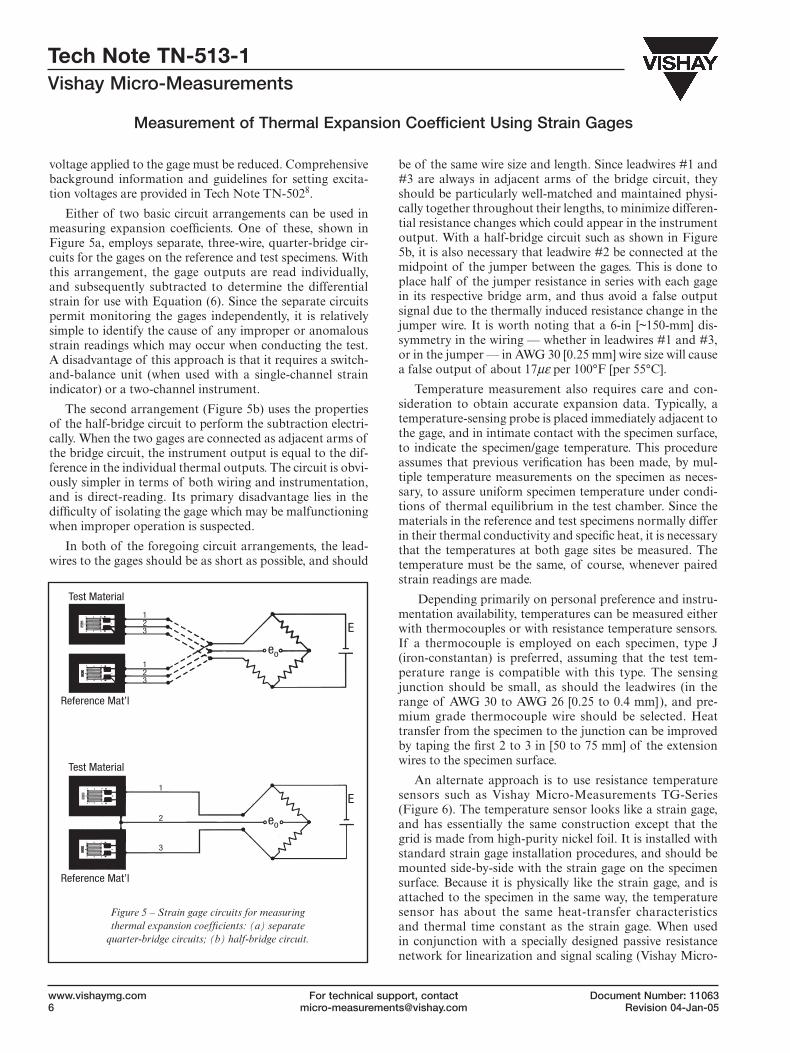
Either of two basic circuit arrangements can be used in measuring expansion coefficients. One of these, shown in Figure 5a, employs separate, three-wire, quarter-bridge cir-cuits for the gages on the reference and test specimens. With this arrangement, the gage outputs are read individually, and subsequently subtracted to determine the differential strain for use with Equation (6). Since the separate circuits permit monitoring the gages independently, it is relatively simple to identify the cause of any improper or anomalous strain readings which may occur when conducting the test. A disadvantage of this approach is that it requires a switch-and-balance unit (when used with a single-channel strain indicator) or a two-channel instrument.
The second arrangement (Figure 5b) uses the properties of the half-bridge circuit to perform the subtraction electri-cally. When the two gages are connected as adjacent arms of the bridge circuit, the instrument output is equal to the dif-ference in the individual thermal outputs. The circuit is obvi-ously simpler in terms of both wiring and instrumentation, and is direct-reading. Its primary disadvantage lies in the difficulty of isolating the gage which may be malfunctioning when improper operation is suspected.
In both of the foregoing circuit arrangements, the lead-wires to the gages should be as short as possible, and should
be of the same wire size and length. Since leadwires #1 and #3 are always in adjacent arms of the bridge circuit, they should be particularly well-matched and maintained physi-cally together throughout their lengths, to minimize differen-tial resistance changes which could appear in the instrument output. With a half-bridge circuit such as shown in Figure 5b, it is also necessary that leadwire #2 be connected at the midpoint of the jumper between the gages. This is done to place half of the jumper resistance in series with each gage in its respective bridge arm, and thus avoid a false output signal due to the thermally induced resistance change in the jumper wire. It is worth noting that a 6-in [~150-mm] dis-symmetry in the wiring — whether in leadwires #1 and #3, or in the jumper — in AWG 30 [0.25 mm] wire size will cause a false output of about 17με per 100°F [per 55°C].
Temperature measurement also requires care and con-sideration to obtain accurate expansion data. Typically, a temperature-sensing probe is placed immediately adjacent to the gage, and in intimate contact with the specimen surface, to indicate the specimen/gage temperature. This procedure assumes that previous verification has been made, by mul-tiple temperature measurements on the specimen as neces-sary, to assure uniform specimen temperature under condi-tions of thermal equilibrium in the test chamber. Since the materials in the reference and test specimens normally differ in their thermal conductivity and specific heat, it is necessary that the temperatures at both gage sites be measured. The temperature must be the same, of course, whenever paired strain readings are made.
Depending primarily on personal preference and instru-mentation availability, temperatures can be measured either with thermocouples or with resistance temperature sensors. If a thermocouple is employed on each specimen, type J (iron-constantan) is preferred, assuming that the test tem-perature range is compatible with this type. The sensing junction should be small, as should the leadwires (in the range of AWG 30 to AWG 26 [0.25 to 0.4 mm]), and pre-mium grade thermocouple wire should be selected. Heat transfer from the specimen to the junction can be improved by taping the first 2 to 3 in [50 to 75 mm] of the extension wires to the specimen surface.
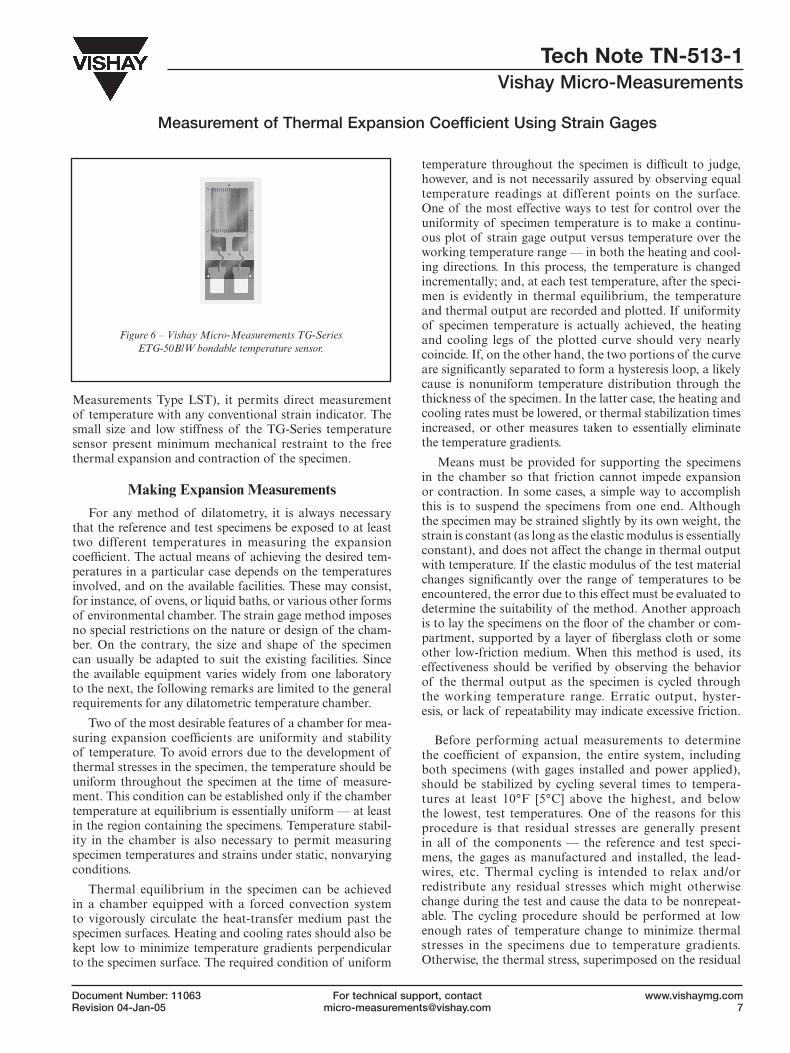
An alternate approach is to use resistance temperature sensors such as Vishay Micro-Measurements TG-Series (Figure 6). The temperature sensor looks like a strain gage, and has essentially the same construction except that the grid is made from high-purity nickel foil. It is installed with standard strain gage installation procedures, and should be mounted side-by-side with the strain gage on the specimen surface. Because it is physically like the strain gage, and is attached to the specimen in the same way, the temperature sensor has about the same heat-transfer characteristics and thermal time constant as the strain gage. When used in conjunction with a specially designed passive resistance network for linearization and signal scaling (Vishay Micro-
Figure 5 – Strain gage circuits for measuring thermal expansion coefficients: (a) separate
quarter-bridge circuits; (b) half-bridge circuit.
Test Material
Reference Mat’l
Test Material
Reference Mat’l
123
123
1
2
3
eo
eo
E
E
For technical support, contact [email protected]
Measurement of Thermal Expansion Coefficient Using Strain Gages
Tech Note TN-513-1Vishay Micro-Measurements
Document Number: 11063Revision 04-Jan-05
www.vishaymg.com7
Measurements Type LST), it permits direct measurement of temperature with any conventional strain indicator. The small size and low stiffness of the TG-Series temperature sensor present minimum mechanical restraint to the free thermal expansion and contraction of the specimen.
Making Expansion Measurements
For any method of dilatometry, it is always necessary that the reference and test specimens be exposed to at least two different temperatures in measuring the expansion coefficient. The actual means of achieving the desired tem-peratures in a particular case depends on the temperatures involved, and on the available facilities. These may consist, for instance, of ovens, or liquid baths, or various other forms of environmental chamber. The strain gage method imposes no special restrictions on the nature or design of the cham-ber. On the contrary, the size and shape of the specimen can usually be adapted to suit the existing facilities. Since the available equipment varies widely from one laboratory to the next, the following remarks are limited to the general requirements for any dilatometric temperature chamber.
Two of the most desirable features of a chamber for mea-suring expansion coefficients are uniformity and stability of temperature. To avoid errors due to the development of thermal stresses in the specimen, the temperature should be uniform throughout the specimen at the time of measure-ment. This condition can be established only if the chamber temperature at equilibrium is essentially uniform — at least in the region containing the specimens. Temperature stabil-ity in the chamber is also necessary to permit measuring specimen temperatures and strains under static, nonvarying conditions.
Thermal equilibrium in the specimen can be achieved in a chamber equipped with a forced convection system to vigorously circulate the heat-transfer medium past the specimen surfaces. Heating and cooling rates should also be kept low to minimize temperature gradients perpendicular to the specimen surface. The required condition of uniform
temperature throughout the specimen is difficult to judge, however, and is not necessarily assured by observing equal temperature readings at different points on the surface. One of the most effective ways to test for control over the uniformity of specimen temperature is to make a continu-ous plot of strain gage output versus temperature over the working temperature range — in both the heating and cool-ing directions. In this process, the temperature is changed incrementally; and, at each test temperature, after the speci-men is evidently in thermal equilibrium, the temperature and thermal output are recorded and plotted. If uniformity of specimen temperature is actually achieved, the heating and cooling legs of the plotted curve should very nearly coincide. If, on the other hand, the two portions of the curve are significantly separated to form a hysteresis loop, a likely cause is nonuniform temperature distribution through the thickness of the specimen. In the latter case, the heating and cooling rates must be lowered, or thermal stabilization times increased, or other measures taken to essentially eliminate the temperature gradients.
Means must be provided for supporting the specimens in the chamber so that friction cannot impede expansion or contraction. In some cases, a simple way to accomplish this is to suspend the specimens from one end. Although the specimen may be strained slightly by its own weight, the strain is constant (as long as the elastic modulus is essentially constant), and does not affect the change in thermal output with temperature. If the elastic modulus of the test material changes significantly over the range of temperatures to be encountered, the error due to this effect must be evaluated to determine the suitability of the method. Another approach is to lay the specimens on the floor of the chamber or com-partment, supported by a layer of fiberglass cloth or some other low-friction medium. When this method is used, its effectiveness should be verified by observing the behavior of the thermal output as the specimen is cycled through the working temperature range. Erratic output, hyster-esis, or lack of repeatability may indicate excessive friction. Before performing actual measurements to determine the coefficient of expansion, the entire system, including both specimens (with gages installed and power applied), should be stabilized by cycling several times to tempera-tures at least 10°F [5°C] above the highest, and below the lowest, test temperatures. One of the reasons for this procedure is that residual stresses are generally present in all of the components — the reference and test speci-mens, the gages as manufactured and installed, the lead-wires, etc. Thermal cycling is intended to relax and/or redistribute any residual stresses which might otherwise change during the test and cause the data to be nonrepeat-able. The cycling procedure should be performed at low enough rates of temperature change to minimize thermal stresses in the specimens due to temperature gradients. Otherwise, the thermal stress, superimposed on the residual
Figure 6 – Vishay Micro-Measurements TG-Series ETG-50B/W bondable temperature sensor.
For technical support, contact [email protected]
Tech Note TN-513-1Vishay Micro-Measurements
Measurement of Thermal Expansion Coefficient Using Strain Gages
Document Number: 11063Revision 04-Jan-05
www.vishaymg.com8
stress, may cause yielding, and thus defeat the purpose of the cycling.
Normally, after the second or third stabilizing cycle, the thermal output at any given temperature should be highly repeatable. If not, and if the lack of repeatability is significant compared to the accuracy required from the test, the sources of the variability must be found. In such cases, the problem may be associated with the temperature, or the strain, or both. Careful re-reading of this Tech Note may provide the clue for finding and correcting the trouble. Further assistance, if needed, can be obtained from our Applications Engineering Department.
Following stabilization, verified by reproducible strain indications throughout the temperature range, the user is ready to perform the final measurements for determining the thermal expansion properties of the test material. When the oven or other chamber is such that only a single speci-men can be accommodated, the two specimens are tested one-at-a-time, using the circuit of Figure 5a. The resulting two sets of thermal output data are subtracted (and the difference divided by the temperature change) as indicated by Equation (6) to give the differential thermal expansion coefficient. With the preferable arrangement, having both specimens together in the chamber, the measurements can be made separately as in Figure. 5a, or the differential ther-mal output can be read directly as shown in Figure 5b.
Special Precautions and Refinements for Improving Accuracy
When attempting to achieve greater and greater accuracy with the strain gage method (or with any method), it is nec-essary to examine ever smaller effects which may introduce errors. In some instances, these second-order errors are well-defined, systematic in nature, and responsive to rou-tine procedures for correction or elimination. In others, the cause-and-effect relationship is more nebulous, and error reduction is accomplished primarily by technique refine-ment — i.e., by removing or minimizing all of the known possible sources of error.
An example of a readily correctable inaccuracy (in cer-tain cases) is the error due to transverse sensitivity. This error arises because the strain field induced in the gage grid by the difference in thermal expansion between the specimen and grid [Equation (1)] is generally different from that employed in gage factor calibration9. When both the reference and test materials are isotropic in their thermal expansion properties, the transverse-sensitivity error, which is ordinarily quite small, can be corrected for rather easily. Although not derived here, correction can be made by mul-tiplying the difference in thermal outputs [Equation (6)] by the factor (1 – 0.285 Kt)/(1 + Kt), where Kt is the decimalized transverse sensitivity of the gage in use. This correction fac-tor is not applicable to orthotropic materials, for which case
differential thermal outputs between a reference gage and two perpendicularly oriented specimen gages are required to correct for transverse sensitivity.
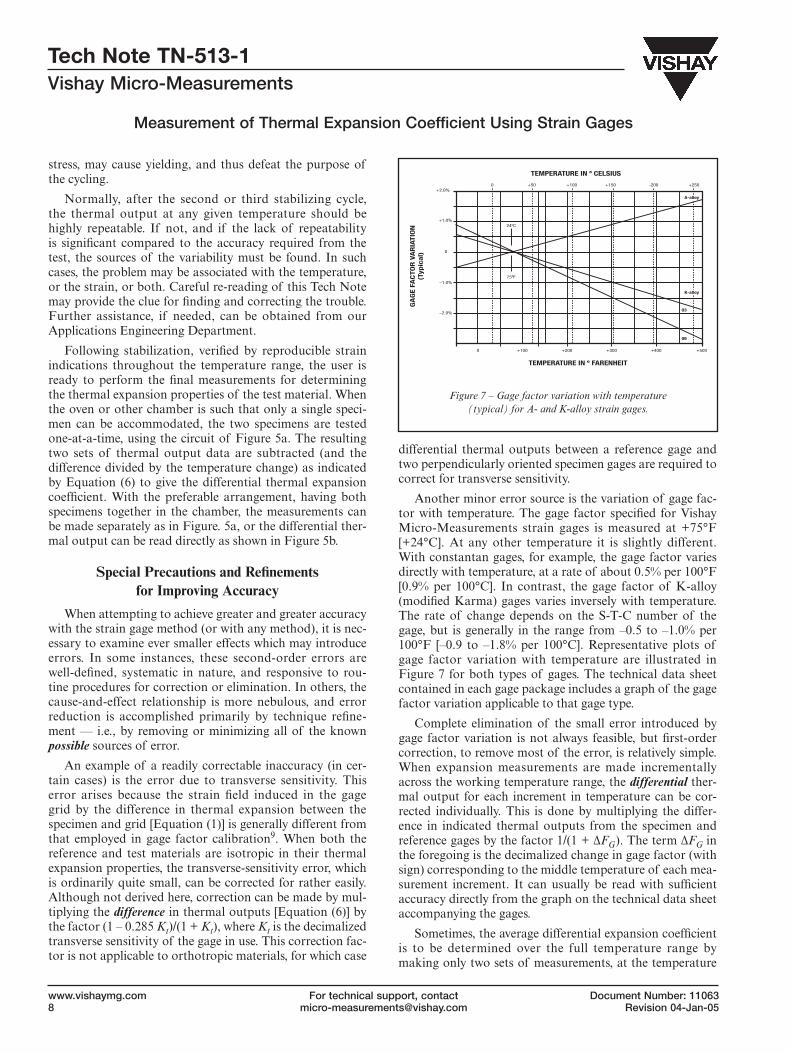
Another minor error source is the variation of gage fac-tor with temperature. The gage factor specified for Vishay Micro-Measurements strain gages is measured at +75°F [+24°C]. At any other temperature it is slightly different. With constantan gages, for example, the gage factor varies directly with temperature, at a rate of about 0.5% per 100°F [0.9% per 100°C]. In contrast, the gage factor of K-alloy (modified Karma) gages varies inversely with temperature. The rate of change depends on the S-T-C number of the gage, but is generally in the range from –0.5 to –1.0% per 100°F [–0.9 to –1.8% per 100°C]. Representative plots of gage factor variation with temperature are illustrated in Figure 7 for both types of gages. The technical data sheet contained in each gage package includes a graph of the gage factor variation applicable to that gage type.
Complete elimination of the small error introduced by gage factor variation is not always feasible, but first-order correction, to remove most of the error, is relatively simple. When expansion measurements are made incrementally across the working temperature range, the differential ther-mal output for each increment in temperature can be cor-rected individually. This is done by multiplying the differ-ence in indicated thermal outputs from the specimen and reference gages by the factor 1/(1 + ∆FG). The term ∆FG in the foregoing is the decimalized change in gage factor (with sign) corresponding to the middle temperature of each mea-surement increment. It can usually be read with sufficient accuracy directly from the graph on the technical data sheet accompanying the gages.
Sometimes, the average differential expansion coefficient is to be determined over the full temperature range by making only two sets of measurements, at the temperature
Figure 7 – Gage factor variation with temperature (typical) for A- and K-alloy strain gages.
TEMPERATURE IN º CELSIUS
TEMPERATURE IN º FARENHEIT
+2.0% 0 +50
24ºC
03
09
A-alloy
K-alloy
75ºF
+100 +150 -200 +250
+1.0%
0
0 +100 +200 +300 +400 +500
–1.0%
–2.0%
GA
GE
FAC
TOR
VA
RIA
TIO
N(T
ypic
al)
For technical support, contact [email protected]
Measurement of Thermal Expansion Coefficient Using Strain Gages
Tech Note TN-513-1Vishay Micro-Measurements
Document Number: 11063Revision 04-Jan-05
www.vishaymg.com9
extremes. The same correction procedure can be applied, using the ∆FG for the mid-range temperature, but it will be much less effective because the thermal output is a nonlinear function of temperature.
When the leadwire resistance can be kept very low, as rec-ommended in the preceding section, the signal attenuation (“desensitization”) caused by the inert resistance in series with the gage should be negligible. If, on the other hand, the series resistance is greater than about 1 percent of the gage resistance, the user who is striving for maximum accu-racy may wish to perform a correction. For this purpose, the indicated thermal outputs are multiplied by the factor (RG + RL)/RG, where RG is the gage resistance, and RL is the leadwire resistance in series with the gage in the same arm of the bridge circuit. An alternative, for direct reading of corrected strains, is to set the gage factor control of the instrument at FG x RG/(RG + RL), where FG is the specified gage factor of the gages in use.
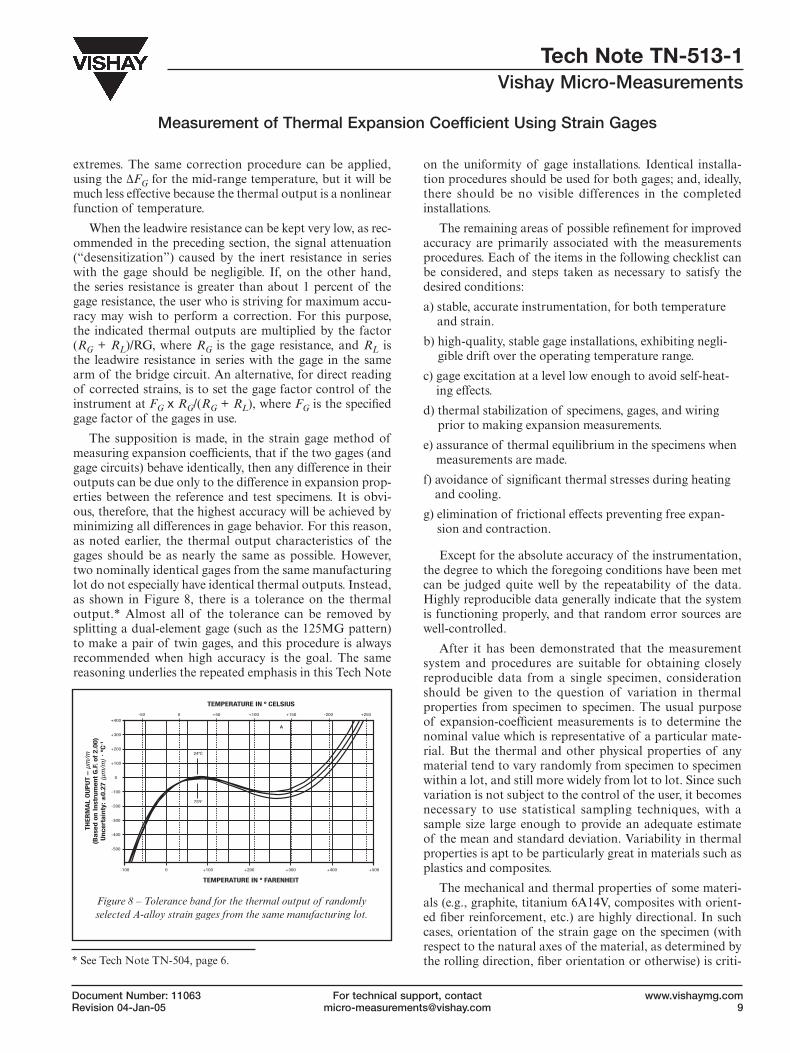
The supposition is made, in the strain gage method of measuring expansion coefficients, that if the two gages (and gage circuits) behave identically, then any difference in their outputs can be due only to the difference in expansion prop-erties between the reference and test specimens. It is obvi-ous, therefore, that the highest accuracy will be achieved by minimizing all differences in gage behavior. For this reason, as noted earlier, the thermal output characteristics of the gages should be as nearly the same as possible. However, two nominally identical gages from the same manufacturing lot do not especially have identical thermal outputs. Instead, as shown in Figure 8, there is a tolerance on the thermal output.* Almost all of the tolerance can be removed by splitting a dual-element gage (such as the 125MG pattern) to make a pair of twin gages, and this procedure is always recommended when high accuracy is the goal. The same reasoning underlies the repeated emphasis in this Tech Note
on the uniformity of gage installations. Identical installa-tion procedures should be used for both gages; and, ideally, there should be no visible differences in the completed installations.
The remaining areas of possible refinement for improved accuracy are primarily associated with the measurements procedures. Each of the items in the following checklist can be considered, and steps taken as necessary to satisfy the desired conditions:
a) stable, accurate instrumentation, for both temperature and strain.
b) high-quality, stable gage installations, exhibiting negli-gible drift over the operating temperature range.
c) gage excitation at a level low enough to avoid self-heat-ing effects.
d) thermal stabilization of specimens, gages, and wiring prior to making expansion measurements.
e) assurance of thermal equilibrium in the specimens when measurements are made.
f) avoidance of significant thermal stresses during heating and cooling.
g) elimination of frictional effects preventing free expan-sion and contraction.
Except for the absolute accuracy of the instrumentation, the degree to which the foregoing conditions have been met can be judged quite well by the repeatability of the data. Highly reproducible data generally indicate that the system is functioning properly, and that random error sources are well-controlled.
After it has been demonstrated that the measurement system and procedures are suitable for obtaining closely reproducible data from a single specimen, consideration should be given to the question of variation in thermal properties from specimen to specimen. The usual purpose of expansion-coefficient measurements is to determine the nominal value which is representative of a particular mate-rial. But the thermal and other physical properties of any material tend to vary randomly from specimen to specimen within a lot, and still more widely from lot to lot. Since such variation is not subject to the control of the user, it becomes necessary to use statistical sampling techniques, with a sample size large enough to provide an adequate estimate of the mean and standard deviation. Variability in thermal properties is apt to be particularly great in materials such as plastics and composites.
The mechanical and thermal properties of some materi-als (e.g., graphite, titanium 6A14V, composites with orient-ed fiber reinforcement, etc.) are highly directional. In such cases, orientation of the strain gage on the specimen (with respect to the natural axes of the material, as determined by the rolling direction, fiber orientation or otherwise) is criti-
TEMPERATURE IN º CELSIUS
TEMPERATURE IN º FARENHEIT
+400
-50 0 +50
24ºC
A
75ºF
+100 +150 -200 +250
+300
+200
+100
0
-100
-100 0 +100 +200 +300 +400 +500
-200
-300
-400
-500
THER
MA
L O
UP
UT
– µ
m/m
(Bas
ed o
n I
nst
rum
ent
G.F
. of
2.00
)U
nce
rtai
nty
: ±0.
27 (µ
m/m
) · º
C-1
* See Tech Note TN-504, page 6.
Figure 8 – Tolerance band for the thermal output of randomly selected A-alloy strain gages from the same manufacturing lot.
For technical support, contact [email protected]
Tech Note TN-513-1Vishay Micro-Measurements
Measurement of Thermal Expansion Coefficient Using Strain Gages
Document Number: 11063Revision 04-Jan-05
www.vishaymg.com10
cal if the directional expansion coefficient is to be measured. When it is impossible to determine the directions of the natural material axes, it may be necessary to make measure-ments over a wide range of angles to define the distribution of the expansion coefficient, or to obtain a rough, integrated average value.
Limitations
The strain gage method of differential dilatometry has very few special limitations. Of these, the principal one for some types of studies may be the allowable temperature range. Constantan gages, for instance, should be used for high-accuracy measurements only within a temperature range from about –50° to +150°F (–45° to +65°C). Higher temperatures normally require the use of K-alloy gages, which can provide accurate strain measurements from approximately –50° to +400°F (–45° to +205°C). With special techniques, these temperature ranges can sometimes be extended, depending on the circumstances. Users should consult with the Vishay Micro-Measurements Applications Engineering Department for recommendations.
Mechanical reinforcement of the specimen by the strain gage can also be a limitation in some instances. When the test specimen is made from a material such as plastic, with a very low modulus of elasticity, the stiffness of the gage may perturb the local strain field and introduce a sizeable error. With metal specimens, the reinforcement effect is ordinarily negligible unless the specimen is so thin and narrow that the
gage stiffness represents a significant fraction of the overall section stiffness.
Other limitations are generally those common to all methods of differential dilatometry. For example, the expan-sion coefficient of the test material can never be determined to greater accuracy than that of the reference material. Similarly, the measurements can be no more accurate than the instrumentation used to indicate the temperatures and strains.
Summary
This Tech Note has described a simple, straightforward means of measuring the expansion coefficient of a test mate-rial relative to that of any reference material having known expansion properties. The method is particularly well-suited to the stress analysis laboratory, since it usually requires no special instrumentation, techniques, or materials not already available in such a facility. Considerable attention has been given here to procedural details aimed at extracting the utmost accuracy from the method. Most of the recom-mended procedures, however, should represent standard practices for a stress laboratory which is accustomed to making precision strain measurements in a variable thermal environment. Even when expedience dictates somewhat less rigorous procedures, the method can be used to quickly and easily measure thermal expansion coefficients with sufficient accuracy for many engineering purposes.
1. American Society for Testing and Materials, “Standard Test Method for Linear Expansion of Metals”, ASTM Standard No. B95-39.
2. American Society for Testing and Materials, “Linear Thermal Expansion of Rigid Solids with a Vitreous Silica Dilatometer”, ASTM Standard No. E228-71.
3. Vishay Micro-Measurements, Tech Note TN-504, “Strain Gage Thermal Output and Gage Factor Variation with Temperature”, 1989.
4. Finke, T. E., and T. G. Heberling, “Determination of Thermal Expansion Characteristics of Metals Using Strain Gages”, Proceedings, SESA (now, SEM), Vol. XXV, No. 1, 1978, pp. 155-158.
5. Poore, M. W., and K. F. Kesterson, “Measuring the Thermal Expansion of Solids with Strain Gages”, Journal of Testing and Evaluation, ASTM, Vol. 6, No. 2 (March 1978), pp. 98-102.
6. Vishay Micro-Measurements, Tech Note TN-505, “Strain Gage Selection Criteria, Procedures, Recommendations”, 1989.
7. Vishay Micro-Measurements, Bulletin B-129, “Surface Preparation for Strain Gage Bonding”, 1976.
8. Vishay Micro-Measurements, Tech Note TN-502, “Optimizing Strain Gage Excitation Levels”, 1979.
9. Vishay Micro-Measurements, Tech Note TN-509, “Errors Due to Transverse Sensitivity in Strain Gages”, 1982.
References
For technical support, contact [email protected]
Measurement of Thermal Expansion Coefficient Using Strain Gages
Tech Note TN-513-1Vishay Micro-Measurements
Document Number: 11063Revision 04-Jan-05
www.vishaymg.com11
APPENDIX REFERENCE INFORMATION
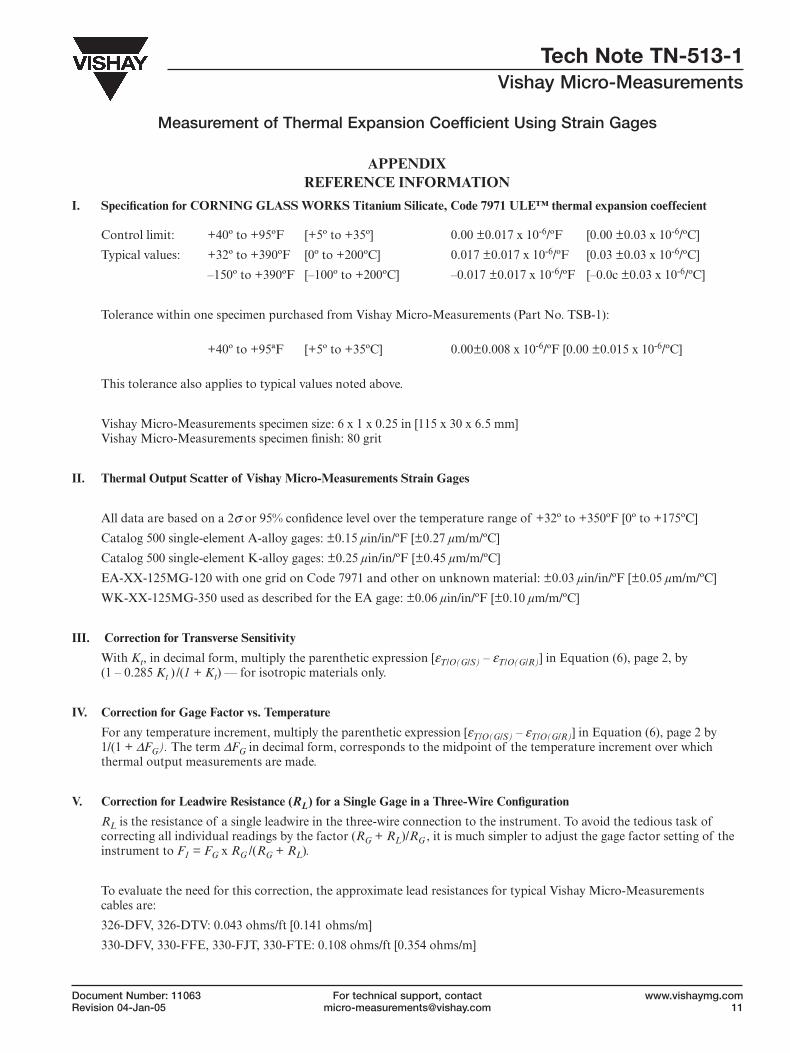
I. Specification for CORNING GLASS WORKS Titanium Silicate, Code 7971 ULE™ thermal expansion coeffecient Control limit: +40º to +95ºF [+5º to +35º] 0.00 ±0.017 x 10⁻⁶/ºF [0.00 ±0.03 x 10⁻⁶/ºC]
Typical values: +32º to +390ºF [0º to +200ºC] 0.017 ±0.017 x 10⁻⁶/ºF [0.03 ±0.03 x 10⁻⁶/ºC]
–150º to +390ºF [–100º to +200ºC] –0.017 ±0.017 x 10⁻⁶/ºF [–0.0c ±0.03 x 10⁻⁶/ºC]
Tolerance within one specimen purchased from Vishay Micro-Measurements (Part No. TSB-1):
+40º to +95ªF [+5º to +35ºC] 0.00±0.008 x 10⁻⁶/ºF [0.00 ±0.015 x 10⁻⁶/ºC]
This tolerance also applies to typical values noted above.
Vishay Micro-Measurements specimen size: 6 x 1 x 0.25 in [115 x 30 x 6.5 mm] Vishay Micro-Measurements specimen finish: 80 grit
II. Thermal Output Scatter of Vishay Micro-Measurements Strain Gages
All data are based on a 2σ or 95% confidence level over the temperature range of +32º to +350ºF [0º to +175ºC]
Catalog 500 single-element A-alloy gages: ±0.15 µin/in/ºF [±0.27 µm/m/ºC]
Catalog 500 single-element K-alloy gages: ±0.25 µin/in/ºF [±0.45 µm/m/ºC]
EA-XX-125MG-120 with one grid on Code 7971 and other on unknown material: ±0.03 µin/in/ºF [±0.05 µm/m/ºC]
WK-XX-125MG-350 used as described for the EA gage: ±0.06 µin/in/ºF [±0.10 µm/m/ºC]
III. Correction for Transverse Sensitivity
With Kt, in decimal form, multiply the parenthetic expression [εT/O(G/S) – εT/O(G/R)] in Equation (6), page 2, by (1 – 0.285 Kt ) /(1 + Kt) — for isotropic materials only.
IV. Correction for Gage Factor vs. Temperature
For any temperature increment, multiply the parenthetic expression [εT/O(G/S) – εT/O(G/R)] in Equation (6), page 2 by 1/(1 + ΔFG). The term ΔFG in decimal form, corresponds to the midpoint of the temperature increment over which thermal output measurements are made.
V. Correction for Leadwire Resistance (RL) for a Single Gage in a Three-Wire Configuration
RL is the resistance of a single leadwire in the three-wire connection to the instrument. To avoid the tedious task of correcting all individual readings by the factor (RG + RL)/RG , it is much simpler to adjust the gage factor setting of the instrument to F1 = FG x RG /(RG + RL).
To evaluate the need for this correction, the approximate lead resistances for typical Vishay Micro-Measurements cables are:
326-DFV, 326-DTV: 0.043 ohms/ft [0.141 ohms/m]
330-DFV, 330-FFE, 330-FJT, 330-FTE: 0.108 ohms/ft [0.354 ohms/m]
For technical support, contact [email protected]
Tech Note TN-513-1Vishay Micro-Measurements
Measurement of Thermal Expansion Coefficient Using Strain Gages
Document Number: 11063Revision 04-Jan-05
www.vishaymg.com12
V I S H AY I S O N E O F T H E W O R L D ’ S L A R G E S T M A N U FA C T U R E R S O F D I S C R E T E S E M I C O N D U C T O R S A N D PA S S I V E C O M P O N E N T S
W O R L D W I D E S A L E S A N D T E C H N I C A L S U P P O R T
EUROPE VISHAY MEASUREMENTS GROUP IBERICA, S.L.SPAINPH: +34-91-7218890FAX: +34-91-7219056EMAIL: [email protected]
VISHAY MEASUREMENTS GROUP FRANCEFRANCEPH: +33-2-37-33-31-20FAX: +33-2-37-33-31-29EMAIL: [email protected]
VISHAY MEASUREMENTS GROUP GMBHGERMANYPH: +49-7131-39099-0 FAX: +49-7131-39099-29EMAIL: [email protected]
VISHAY MEASUREMENTS GROUP NORDICSWEDENPH: +46-8-741-3310FAX: +46-8-741-2535EMAIL: [email protected]
VISHAY MEASUREMENTS GROUP UKUNITED KINGDOMPH: +44-125-646-2131FAX: +44-125-647-1441EMAIL: [email protected]
VISHAY MEASUREMENTS GROUP ISRAELISRAELPH: +972-9-863-8888FAX: +972-9-863-8800EMAIL: [email protected]
THE AMERICAS AND ASIA
VISHAY MICRO-MEASUREMENTSUNITED STATESPH: +1-919-365-3800FAX: +1-919-365-3945EMAIL: [email protected]