measurement of visual attention and useful field of...
TRANSCRIPT
Proceedings of the 2007 Mid-Continent Transportation Research Symposium, Ames, Iowa, August 2007. © 2007 by Iowa State University. The contents of this paper reflect the views of the author(s), who are responsible for the facts and accuracy of the information presented herein.
Measurement of Visual Attention and Useful Field of View during Driving Tasks Using a Driving Simulator Hidetoshi Nakayasu Institute of Intelligent Information and Communications Technology (IICT) Konan University 8-9-1 Okamoto Higashinada Kobe Hyogo 658-8501 Japan [email protected] Yasuhiro Seya Institute of Intelligent Information and Communications Technology (IICT) Konan University, 8-9-1 Okamoto Higashinada Kobe Hyogo 658-8501 Japan [email protected] Tetsuya Miyoshi Department of Information and Management Toyohashi Sozo University 20-1 Matsushita Ushikawa-cho Toyohashi Aichi 440-8511 Japan [email protected]
Nir Keren Department of Agricultural and Biosystems Engineering Iowa State University Ames, IA 50011-3130 [email protected] Patrick Patterson Department of Industrial Engineering Texas Tech University 201 Industrial Engineering Building, P.O. Box 43061 Lubbock, TX 79409 [email protected]
ABSTRACT
The main aim of this work was to obtain a better understanding of drivers’ perceptions of hazard information in selected traffic situations. To contribute to this aim, the relationship between visual attention and the range of the useful field of view was considered by measuring eye movements during simulated driving. Histories (scan paths) of the eye movements were drawn from eye position data obtained by an eye tracking system, superimposed on driving road scenes viewed from the front side seat in an automobile. This procedure enabled one to evaluate the relationship between visual attention and eye movement, such as saccades and fixations, of the driver under various traffic events and road conditions. Results showed that visual stimuli in the peripheral vision affected eye movements during driving. In situations where there are few objects to be attended to (e.g., driving on a straight road), eye movement frequencies were smaller, and fixation durations were longer, than in situations where there are many objects (e.g., driving through an intersection). Based on these results, it is estimated in this paper, the range of the useful field of view during driving. The method proposed in this paper would be useful for simulating safe driving practices and analyzing human factors for drivers’ awareness. Key words: driving simulator—eye movements—fixation duration—useful field of view—visual attention

Nakayasu, Seya, Miyoshi, Keren, Patterson 2
INTRODUCTION
To drive an automobile safely, it is important for a driver to perceive a hazard quickly (Brown and Groger 1988; Lalley 1982). A hazardous situation includes several of the factors responsible for accidents in a traffic situation. Therefore, hazard perception is needed in the early stages of human information processing (Renge 1998; Soliday 1974 and 1975). Although most information needed for automobile driving is obtained through visual input (Hills 1980), early studies showed no correlation between driving performance and visual functions, such as a dynamic and a static visual acuity (Hills 1980). On the other hand, recent studies (Miura 1992; Owsley et al. 1998) suggest that driving performance depends on visual attention, which is also associated closely with the range of the useful field of view. Useful field of view is defined as the visual field in which an observer is able to perceive visual stimuli quickly and accurately during complicated perceptual-motor tasks, such as reading and driving. To our knowledge, however, there have been few studies examining visual attention during driving with conditions controlled experimentally (e.g., speeds of driving).
The main aim of this work was to examine visual attention during driving using a driving simulator. Since eye movements depend on visual attention, it is useful to analyze the relationship between eye movements and road scenes. Another aim of this work was to obtain a better understanding of hazard information for forecasting a particular human behavior, such as visual attention during driving. Further in this study, the range of the useful field of view was estimated, based on a new hypothesis suggested by present and preliminary experiments (Miyoshi, Nakayasu, and Suzuki 2007), that the range of the useful field of view may be inversely proportional to the fixation duration on the driving scene. Although it is difficult to measure the range of the useful field of view directly during automobile driving because of the difficulty of constraining eye movements, it is easy to record fixations and their durations. Therefore, it may be possible to formulate the range of the useful field of view during driving from eye movements, such as the distance between two successive fixation points (i.e., saccades) and those durations, by superimposing the history of the eye movements (scan paths) onto driving road scenes. Since the method proposed in this study can estimate the range of the useful field of view from eye movements, we would be able to investigate it under various traffic conditions, such as road geometry, weather, and driver experience.
EXPERIMENTAL SETUP
Participants
Participants included 14 males, consisting of 11 males from 20 to 31 years of age (mean age of 22.6 ± 3.0) and 3 males from 60 to 65 years of age (mean age of 62.7 ± 2.5). All participants had regular-class automobile licenses in Japan with normal or corrected-to-normal vision. All participants received an explanation of the experiment and gave informed consent before participation.
Driving Simulator
The automobile driving simulator (DA-DOO: HONDA Motor Co. Ltd.) was used to simulate driving scenarios. Figure 1 shows the driving simulator used in this study. This simulator is typically used for driver trainees or novices to learn safe driving techniques. Specifications are shown in Table 1. The simulator is implemented on an advanced six-axis motion base (sway-motion device) that can simulate closely automobile dynamics in real traffic situations. The visual scenes of driving on a road from the viewpoint of a driver are presented on a frontal screen and three mirror CRTs. The distance from the front screen to the driver’s seat is 1,511 mm. The simulator simulates driving courses with a variety of conditions, such as weather and car and human actions (e.g., dashing out in front of the automobile). In

Nakayasu, Seya, Miyoshi, Keren, Patterson 3
this study, both urban road and highway courses (Figures 2 and 3) were selected. These courses consisted of several parts of the road: a straight road, bending road, and cross section, into which dangerous situations could be inserted. The participants drove the simulator in automatic transmission (AT) mode.
Table 1. Specification of Honda DS-D00
Front view Wide field (138 deg.) screen projection type Rear view 3-mirror independent LCD display CG Redraw speed: 30 to 60 frame's Mechanism motion base
Six axis motion base system using G cylinders Control
Frame Light weight space frame structure with aluminum extended mechanism
Body Rear open structure fixed with FRP mold Operation system Steering device with reactive force control,
Accelerator, clutch, brake, simulation, mechanism Mission AT/MT switch mechanism CG computer Cuamum3D Alchemy(1.5 million polygons) Control system 6-axis servo amp Dimensions 2,440mm(D)×2,280mm(W)×1,855mm(H)
Figure 1. Driving simulator and eye tracking system

Nakayasu, Seya, Miyoshi, Keren, Patterson 4
Eye Tracking System
During simulated driving, eye movements in the driving road scene were recorded by a head-mounted eye tracking system (EyeLink II: SR Research Ltd.; see also Figure 1). Tables 2 and 3 show the specifications
120 m
A truck cuts in a driver’s lane. A straight road.
Figure 3. Highway course in simulator
120 m
A person walks across a road.
A straight road.
Figure 2. Urban road course in simulator

Nakayasu, Seya, Miyoshi, Keren, Patterson 5
and functions of the system. The system consists mainly of several components: EyeLink Host PC, EyeLink Control PC, scene camera, overlay box, and DV converter, whose relationships are shown in the block diagram in Figure 4. Two eye cameras track the right and left eyes separately. A scene camera on a head band records the visual scene that the participant views. In the scene camera, either a color or high-resolution (720 by 480 pixels) black and white scene camera is used to generate 30 frames of a scene image per second. The scene image is also streamed to the overlay box, in which the participants’ gaze position (indicated by a filled circle) is superimposed onto the visual scene. The host PC converts gaze position data, obtained by the eye cameras, into position data onto the visual scene image captured by the head-mounted scene camera. The host PC also analyzes eye movement events in real-time. These data are sent, through an Ethernet link, to the control PC, where they are stored. The control PC is also used for calibrating the eye tracking system.
Table 2. Specifications of EyeLink II
Sampling Rate 500Hz (Pupil One) 250Hz (Pupil and Corneal Reflection)
Error of Fixation less 0.5° Accuracy of Pupil Size for diameter 0.1% Range of Trace Horizontal ±30° Vertical ±20° Data File EDF Rate of data transfer Pupil: Filter Off: 3 ms Nomal:5 ms Filter High: 7 ms
Pupil+CR: FilterOff: 6 ms Normal: 10 ms Filter High: 14 ms Marker of infrared rays 900nm Eye Camera 925nm 1.2W/cm2 Weight 420g
Table 3. Functions of EyeLink II
Image Processing Fully Digital Pupil Tracking Hyper acuity Corneal Reflection Tracking Hyper acuity, ultra low noise Resolution(Gaze) <0.005°(pupil and CR) Velocity Noise <0.5°average Pupil Size Resolution 0.1% of diameter Eye Tracking Range ±30°horizontal, ±20°vertical in pupil only mode. Gaze Tracking Range ±20°horizontal, ±18°vertical Head Tracking Distance 40-140cm (standard), -300cm (Special markers)
EDF File and Link Data Types Eye position, HREF position, gaze position, Pupil size, buttons, messages, digital inputs
Online Eye Movement Analysis Saccades, fixations, blinks, fixation updates

Nakayasu, Seya, Miyoshi, Keren, Patterson 6
Procedure
Participants were seated on the seat of the driving simulator. After the participants practiced driving on the urban road and the highway courses (Figures 2 and 3), an experimental session was conducted. In the experiment, the participants were instructed to drive on the driving courses safely.
Eye Movement Recordings and Analyses
In this study, horizontal and vertical eye movements of the participants were recorded from both the right and left eyes. Before beginning the experiment, the participants were asked to fixate on nine points presented on the control PC display to calibrate the eye tracking system. All data were stored on the control PC and analyzed offline by a computer program that drew histories or scan paths of eye movements and then calculated the total distances of the eye movements and the fixation durations.
From the eye position data, histories of the eye movements for events involving the car or human actions were drawn. Eye position data 2 seconds before and after the participants made saccades toward a car or human event to be perceived were used. In addition, the histories of eye movements during driving on a straight road on which there were few objects to be viewed were calculated as a comparison condition (see Figures 2 and 3). The total distance of eye movements was calculated as the differences between the eye positions. A fixation was defined as eye movements of less than 30°/sec. velocity for more than 100 ms. A fixation duration was calculated by the difference in time between two successive saccades, before and after the fixation, defined as eye movement of more than 30°/sec. velocity.
EDFData
IEEE 1394
O verlay Box
DVConverter
IR Markers
Control PCHost PC
USB Button Box
Scene Video
Scene Camera
S-video or Composite Video
IR CableEthernet Cable
Head BandEDFData
IEEE 1394DV
Converter
USB Button BoxPCI Bus
P A RTICIPANT
S-video or Composite Video
Head BandEye Camera
Figure 4. Block diagram of eye tracking system

Nakayasu, Seya, Miyoshi, Keren, Patterson 7
EXPERIMENTAL RESULTS
Histories of Eye Movements
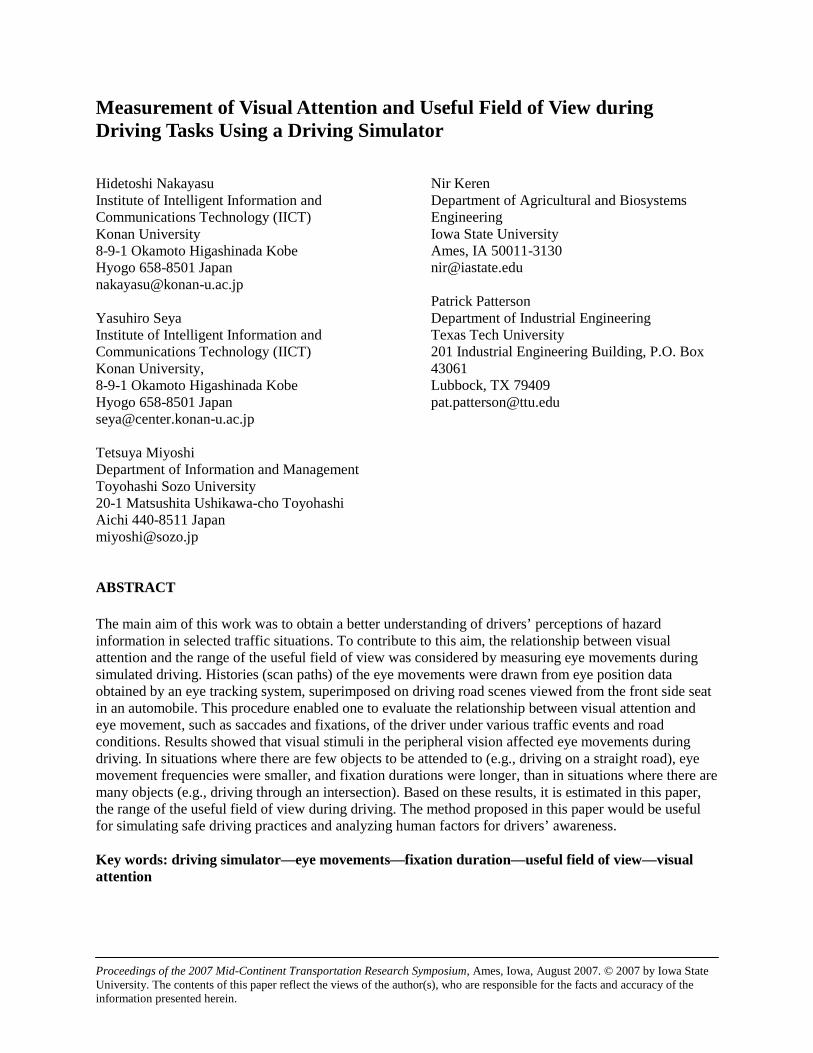
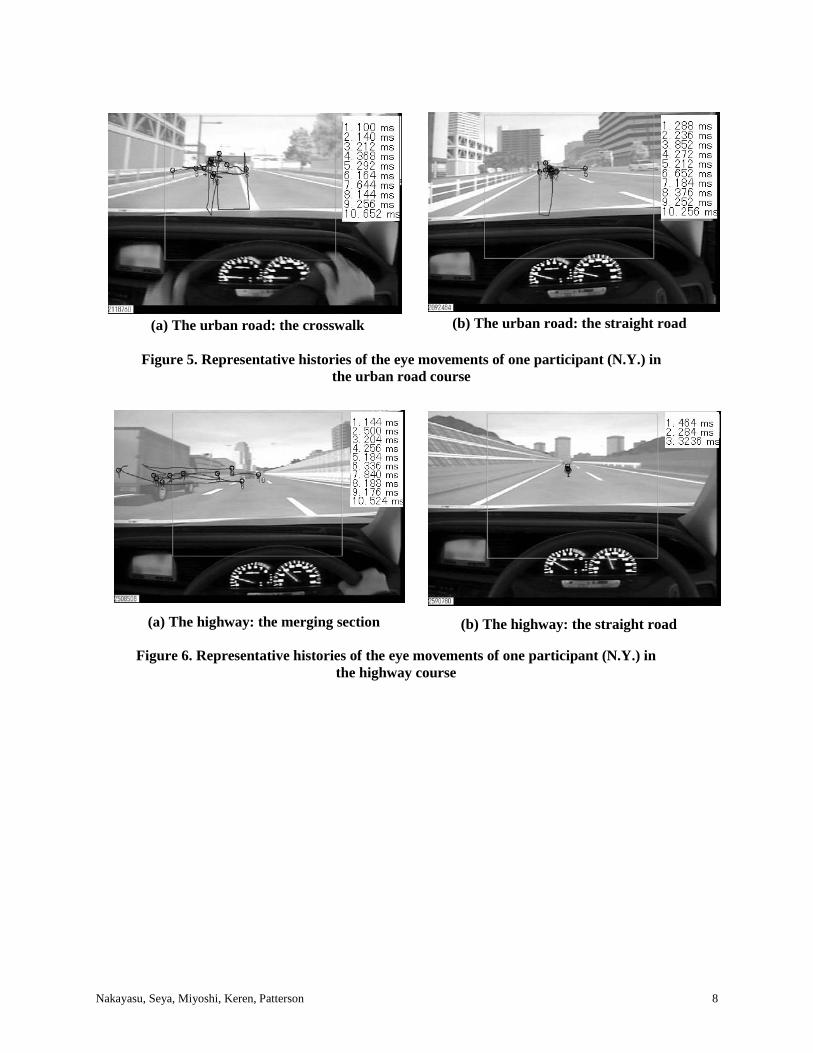
Figure 5 shows representative eye movement histories for one participant approaching a crosswalk in which there was a person on the left side of the crosswalk and driving on a straight road in the urban road course. For the crosswalk, Figure 5(a), the participant’s eye moved frequently in various directions, even when the person did not start walking. For the straight road, Figure 5(b), the participant’s eye positions were less variable than those at a crosswalk, shown in Figure 5(a), although the number of fixations was the same. Figure 6 shows representative histories of the eye movements of the same participant on the highway course. Similar tendencies to those in the urban road course were observed, although the number of the fixations was different between two scenes. At a merging section, Figure 6(a), in which a truck cut into the participant’s lane, the participant changed his fixation points frequently around the truck. On the other hand, at a straight road, Figure 6(b), the participant kept his fixation point forward on the road.
Total Distance of Eye Movements
Figure 7 shows mean total distance of eye movements (in degrees) during events such as the crosswalk and the merging section and the straight section of the urban road and highway courses. As shown in the figure, in both the urban road and highway courses the mean distances of the eye movements were longer for the event than for the straight section, although there were individual differences (indicated by error bars). It is seen from the experimental results that the total distance of the eye movements is not dependent on the differences of the driving course (i.e., the urban road and highway courses).
Fixation Duration
Figure 8 shows mean time of fixation durations for the event and the straight section in the urban road and highway courses. There were no differences between duration times for the event and the straight section on the urban road. On the other hand, in the highway course the mean time of fixation durations was longer for the straight section than for the event section, although it is noted that there were relatively large individual differences.
Nakayasu, Seya, Miyoshi, Keren, Patterson 8
Figure 5. Representative histories of the eye movements of one participant (N.Y.) in the urban road course
Figure 6. Representative histories of the eye movements of one participant (N.Y.) in the highway course
(a) The highway: the merging section (b) The highway: the straight road
(a) The urban road: the crosswalk (b) The urban road: the straight road

Nakayasu, Seya, Miyoshi, Keren, Patterson 9
DISCUSSION
Eye Movements and Visual Attention
In this study, eye movements during automobile driving were measured and analyzed in the context of selected driving road scenes in order to examine visual attention during driving. The present results of the eye movement histories showed that the changes of the fixation point were more frequent for the events section, where there were many objects to be attended to (e.g., at a crossroad section), than for a road where there were few objects (e.g., at a straight section). The total distances of the eye movements and the fixation durations at the event section were longer than those at the straight section in both road conditions. These results were consistent with preliminary experiments (Miyoshi et al. 2007) showing that the frequencies of saccades were higher, and the fixation durations longer, at a section where the amount of changes in visual stimuli of the peripheral vision was relatively larger (e.g., a winding section) than at another road section where the amount of the changes was small (e.g., a straight section). Since research suggests that visual attention moves along with the eye movements (Kowler 1990), it is possible that the drivers may have adopted different attentional strategies for visual search during driving, depending on the visual scenes encountered.
Formulation Estimating the Range of the Useful Field of View
As mentioned in the introduction of this paper, it is quite difficult in driving situations to measure the range of the useful field of view, since usual method measuring useful field of view requires an observer to keep his eye stationary on a fixed fixation point. In the present study, the range of the useful field of view was estimated from eye movements. The present results suggest that the attentional strategies for visual search may change, depending on the visual scene. The changes in the attentional strategies may be because of the changes in the range of the useful field of view, which became narrower with increasing numbers of objects (Miura 1992). Many resources for visual attention are required for visual information processing when the visual objects to be processed are presented in the visual field. Therefore, the range
Figure 8. Mean fixation durations (error bars indicate standard errors of the mean)
Figure 7. Mean length of the eye movements (error bars indicate standard errors of the mean)
Driving course condition Driving course condition
0
200
400
600
800
1000
1200
Urban road Highway
Event
Straight road
F
ixat
ion
du
rati
on (
ms)
0
20
40
60
80
100
120
140
160
Urban road Highway
Event
Straight road
Tot
al d
ista
nce
of e
ye m
ovem
ents
(de
g)

Nakayasu, Seya, Miyoshi, Keren, Patterson 10
of the useful field of view may be treated as a tradeoff with the depth of the information processing of the visual objects (Miura 1992). Based on the results of the present and the preliminary studies (Miyoshi et al. 2007), we hypothesize that the saccadic amplitude reflects the ranges of two useful fields of view, not a single one (Miura 1992) before and after the saccade. Furthermore, the range of the useful field of view would be inversely proportional to fixation durations; as the fixation duration increases, the information processing increases, but its range would decrease. Following these hypotheses, the range of the useful field can be defined as follows:
BA
BABA
tt
tr
+×= θ (1)
AABB rr −= θ (2)
In the equations, rA and rB indicates the radius of the range of the useful field of view for two successive fixation points, A and B, as shown in Figure 9, where θAB indicates saccadic amplitude, tA and tB indicate the duration times of the successive fixations at points A and B. According to this equation, the range of the useful field depends on the saccadic amplitude. However, since the size of the visual stimuli decreases with the spatial depth of objects, the saccadic amplitudes, particularly during driving, may be affected by the depth of the objects; the amplitude of saccades decreases with the increasing spatial depth of the objects. To correct the effects of the spatial depth of the objects, we calculated the distance from the driver’s eye to the objects to which the participants made saccades by calculating the difference in the vertical positions in pixels. Using approximate expression, estimated for a straight road course with distance measures (in meters), we converted the differences in the vertical positions into the depth distance. Based on the estimated distance of the objects, the ranges of the useful field of view were corrected in a way that the range of the field of view could be estimated on the same depth from the eye of the participants.
Following the procedures mentioned above, the range of the field of view was estimated. Figure 10 shows the results for two different participants at the crosswalk in the urban road and at the merging section in the highway course. As shown in the figure, the range of the useful field of view was narrower for the highway than for the urban road courses. Figure 11 shows the mean radius of the field of view at the event in the urban and in the highway courses. Similar tendencies to those in Figure 10 can be observed in Figure 11. Again, the radius of the field of view was narrower in the highway than in the urban road courses.
A Br
B A
Ar
ABθ
Figure 9. Relations of the parameters used in this study

Nakayasu, Seya, Miyoshi, Keren, Patterson 11
0
1
2
3
4
5
6
7
Urban road Highway
Rad
ius o
f use
ful f
ield
of v
iew
(deg
)
Driving road condition
Before saccade
After saccade
Figure 10. Range of useful field of view before and after the saccades at the crosswalk on the urban road and at the merging section on the highway course, for participants
T.Y (a) and (b) and S.M. (c) and (d)
(a) The urban road course: the crosswalk
(b) The highway course: the merging section
(c) The urban road course: the crosswalk (d) The highway course: the merging section
Figure 11. Mean radius of useful field of view before and after the saccade at the event on the urban road and highway courses (error
bars indicate standard errors of the mean)

Nakayasu, Seya, Miyoshi, Keren, Patterson 12
The results of the useful field of view were not consistent with those in Miura (1992), suggesting that the useful field of view is not affected by the speed of driving. The reason for the discrepancies between the present study and Miura’s (1992) study is not clear. One possibility may be due to differences in participants. Miura (1992) used highly trained drivers, while this study used experienced or inexperienced drivers. Therefore, it is possible that in Miura’s (1992) study the participants’ perceptual and cognitive skills, such as anticipation for a risk, may have cancelled out the negative effect of speed on the useful field of view. Indeed, research suggests that the visual search of drivers depends on expectancy or anticipation skills based on their experiences (Hills 1980). In further studies, examination of the possible effects of the participant’s skill and experience on the useful field of view will be important.
CONCLUSION
The present study examined the relationship between eye movements and driving road scenes. The results indicated that the eye movements depended on the stimuli in the peripheral vision. This finding suggests that visual attention during driving may scatter in a situation where there are many objects to be processed. In this study, we also attempted to formulate the range of the useful field of view from eye movements. The results showed that the useful field of view was narrower for the highway course than for the urban road course. The method of estimating the range of the useful field of view, proposed in this study is tentative, and further studies will be needed to explore its applicability and validity in various traffic conditions, such as road geometry, weather conditions, and driver experience or skills.

Nakayasu, Seya, Miyoshi, Keren, Patterson 13
ACKNOWLEDGMENTS
This research was supported as part of IICT, Konan University, by MEXT ORC (2004-2008).
REFERENCES
Brown, I.D. and J.A. Groger. 1988. Risk perception and decision taking during the transition between novice and experimence driver status. Ergonomics, 31, 585–597.
Hills, B.L. 1980. Vision, visibility, and perception in driving. Perception, 9, 183–216.
Kowler, E. 1990. The roles of visual and cognitive processes in the control of eye movement. In E. Kowler (Ed.), Eye movements and their role in visual and cognitive processes (pp. 1–70), Amsterdam: Elsevier.
Lalley, E.P. 1982. Corporate uncertainty and risk management. Risk Insurance Management. Miura, T. 1992. Visual search in intersections: An underlying mechanism. IATSS RESEARCH, 16, 42–49. Miyoshi, T., H. Nakayasu, and D. Suzuki. 2007. Effect of peripheral vision for the eye movements in
driving. Japanese Journal of Ergonomics, 43, 97–100. Owsley, C., K. Ball, G. McGwin, Jr., M.E. Sloane, D.L. Roenker, M.F. White, and E.T. Overley. 1998.
Visual processing impairment and risk of motor vehicle crash among older adults. JAMA, 279, 1083–1088.
Renge, K. 1998. Drivers’ hazard and risk perception, confidence in safe driving, and choice of speed. IATSS RESEARCH, 22, 103–110.
Soliday, S.M. 1974. Relationship between age and hazard perception in automobile drivers. Perceptual and Motor skills, 39, 335–338.
Soliday, S.M. 1975. Development and preliminary testing of a driving hazard questionnaire. Perceptual and Motor skills, 41, 763–770.