measurementof mean wear
TRANSCRIPT

Measurement of mean wear coefficient during gear tests under variousoperating conditions
José A. Brandão, Pedro Cerqueira , Jorge H.O. Seabra , Manuel J.D. Castro
a b s t r a c t
Seven wear tests were conducted on an FZG gear testing machine in order to ascertain the influence ofbasestock (PAO and mineral), specific film thickness and contact load on the wear of spur gears, parti-cularly on the wear coefficient κ that is used in Archard's law. The results showed that load may havesome influence on the wear coefficient. They also showed that the influence of specific film thickness on
wear is very non-linear. The influence of basestock, even with oils of similar viscosity, is very significant,as much as any other parameter in isolation.Keywords:
GearWear
Micropitting
1. Introduction
Wear, the process by which material is removed from a surfacethat rubs against another, has always been of interest for tribolo-gists. However, the focus in the study of wear has tended to be onoccurrences of excessive wear, not on mild wear. In particular, mildwear in lubricated gears has been largely neglected as an object ofstudy. This state of affairs changed in the 1990s, when authorsdirected their attention to this phenomenon.
Many of the new studies were concerned with the applicationof a model of mild wear in gears. Most models are based on var-iants of the Archard wear law [1]:
dh¼ kpjΔujdt ð1Þ
presented here in a localised form, where h is the wear depth, t isthe time, p is the normal pressure, Δu is the sliding velocity and kis the wear coefficient given typically in [Pa�1]. The wear coeffi-cient k is a property of the interface, depending on the contactingmaterials, operating conditions, tooth flank surface roughness, andon the lubricant, in case of lubricated contacts.
Flodin and Anderson created one such model that they thenapplied to the prediction of wear to spur and helical gears [2–4].
The research group gathered around Ahmet Kahraman at OhioState University developed a surface wear prediction methodologythat they applied to spur and helical gears [5], including effects of
profile deviations, manufacturing errors, profile modifications [6]and the interaction of wear with dynamic loads [7].
This last aspect, the interaction of wear and dynamic loads, hasbeen intensely studied [8–11] with the conclusion that wear canalter significantly the frequencies and peaks of dynamic loads.
Brauer and Andersson [12] conducted a theoretical study ofwear in spur gears with interference, using a mixed finite element(FE) and analytical approach. Their results showed that wear ofgear tooth flanks may eliminate interference.
Park et al. [13] proposed a method for the computation of thesurface wear of hypoid gear pairs, combining Archard's wearmodel with a semi-analytical hypoid gear contact model.
The brief enumeration of publications above shows the abun-dance of theoretical studies of mild wear in lubricated gears.Surprisingly, no such wealth of experimental work on gear mildwear is to be found. This is surprising because it is generallyacknowledged that the wear coefficient k can only be obtainedfrom direct measurement, that it is very dependent on the contactconditions and materials and that it is imprudent to extrapolateresults of one set of measurements to different operatingconditions.
Flodin [14] conducted a wear test on an FZG gear testingmachine. The tested gears were an FZG type C-PT gear pair, loadedto load stage 10 (corresponding to 1539 MPa Hertzian stress atpitch point), with a pinion rotational speed of 100 RPM, lubricatedwith an ISO VG 68 unadditised mineral oil at 90 °C of temperature.
To study wear on gears experimentally, Krantz and Kahraman[15] used results from prior tests on gears performed by Townsendand Shimski [16] for other purposes. These tests were conducted

Table 2Oil properties.
Property PAO MIN
Density at 15 °C ρ15 (kg/m3) 849 890Kinematic viscosity at 40 °C ν40 (cSt) 150 150Kinematic viscosity at 100 °C ν100 (cSt) 19.4 14.5Viscosity index VI 148 495Pour point (°C) o�57 �18Flash point (°C) 250 220Reference temperature Tref (°C) 40 40Reference viscosity ηref (mPa s) 127 130.8Thermal-viscous index S0 (–) 1.093 1.271Piezo-viscous index Z (–) 0.467 0.608Lubricant parameter αη at 80 °C (ns) 0.3231 0.3538Lubricant parameter αη at 90 °C (ns) 0.2290 0.2400Lubricant parameter αη at 100 °C (ns) 0.1670 0.1685
Thermal conductivity Kf (W m�1 K�1) 0.154 0.137
on a closed-power-loop gear testing machine in which the load isapplied by an hydraulic cylinder. The tests were 7 in number; andeach test consisted in applying the same operating conditions onidentical gears while varying only the lubricating oil: each oil wasformulated from the same mineral basestock, but had differentviscosities from each other (viscosities ranged from 12.2 to 52.4 cStat 40 °C). The analysis of wear on the gears showed that wearincreases as the specific film thickness Λ decreases (Λ¼ h0=Rq,where h0 is the central film thickness and Rq is the combined RMSroughness of the contacting surfaces). This is roughly in line withthe law proposed by Priest and Taylor [17], which relates the wearcoefficient in piston rings to the lubrication regime through adependence of k on the specific film thickness.
İmrek and Düzcükoğlu [18] sought to isolate the effect ofpressure on wear by comparing two experiments performed on anFZG machine: one with gears of uniform width and the other withgears of variable width, chosen to keep the Hertzian pressureapproximately constant along the line of action, which entails asudden change in width in the single tooth pair contact area. Inthis case also, one single set of operating conditions was used.
It can be seen that no attempt has so far been made to obtainwear coefficients when gears are operated under diverse sets ofoperating conditions. The present work attempts to “plug thishole”: gear tests on the FZG machine were performed under dif-ferent operating conditions. The parameters selected for studywere the specific film thickness Λ, which has elsewhere alreadybeen identified as a key influence on the wear coefficient k, thebasestock of the lubricant and the contact load between the gears.
The wear coefficient to be measured is the main parameter tobe used in a wear simulation model [19] so that it can be includedin another model of concurrent wear and contact fatigue model[20].
2. Experimental procedure
The tests were conducted on a back-to-back spur gear test rigwith power recirculation: the well known FZG gear test rig [21].The tested gears were FZG type C-CF spur gears [22], whose mainproperties can be found in Table 1.
The gears were dip lubricated with two fully additised ISO VG150 commercial gear oils, one highly refined mineral gear oil(MIN) and one poly-alphaolefin synthetic gear oil (PAO), depend-ing on the test. This is intended to ascertain the influence of thebasestock on wear, in particular on the wear coefficient.
Some properties of the oils are listed in Table 2. The propertiesin the first 6 rows (from density to flashpoint) were extracted from
Table 1Properties of the FZG C-CF gears.
Property Pinion(1) Wheel (2)
Material 16MnCr5Treatment case-carburisedSurface hardness 750 HV1DIN3962 grade 5Tip relief noRoot relief noCrowning noCentre distance a (mm) 91.5Module m (mm) 4.5Pressure angle α (deg) 20Number of teeth Z 16 24Tooth width b (mm) 14 14Profile shift x 0.1817 0.1715Addendum diameter da (mm) 82.46 118.36Roughness Ra (μm) 0.5 0.5Combined RMS roughness σ (μm) 0.79
the oil suppliers' information sheets. The remaining propertieswere obtained from other sources.
The variation of viscosity with pressure and temperature ispresumed to follow Roelands’ equation [23]:
lnηηref
¼ lnηref þ9:67� � � T�138
Tref �138
� �� S0� 1þ p
0:196
� �Z�1
( )ð2Þ
where Z and S0 are dimensionless parameters of the oil, T ref is areference temperature in K, ηref is the dynamic viscosity at thereference temperature and atmospheric pressure in Pa � s, T is thetemperature of the lubricant in K, p is the pressure in GPa and η isthe low shear dynamic viscosity in Pa � s. The parameters of the oilswere estimated following the method presented by Brandão et al.[24] and are included in Table 2.
There are a number of competing definitions of the piezo-viscosity coefficient to be used for film thickness calculation, this isin fact a subject of contention among researchers. The simplestdefinition is used here, in line with Gold et al. [25], the tangentpiezo-viscosity coefficient at 0.2 GPa: α0:2 ¼ lnðη=η0Þ=ð0:2 GPaÞ.The lubricant parameter αη, which figures in film thickness cal-culation formulas, is also given in Table 2 at relevant temperatures.
Larsson and Andersson [26] measured the thermal conductivityof mineral and PAO oils. Their results were used here and are listedin Table 2.
Inductively Coupled Plasma (ICP) mass spectrometry was per-formed on the oils, and the results are shown in Table 3. Althoughthe precise formulation of the commercial oils is not available, thepresence of chemical elements is a clue as to the type of additivesin each oil. In the case of PAO, detection of phosphorus, sulphurand boron indicates the possible presence of anti-wear andextreme pressure additives; and detection of calcium indicates thepresence of detergent additives. In the case of MIN, detection ofphosphorus and zinc indicates the presence anti-wear andextreme pressure additives; and detection of calcium, barium andmagnesium indicates the presence of detergent additives.
Table 3ICP oil analysis result.
Element PAO MIN
P (ppm) 210 280–380S (ppm) 4630 N/AB (ppm) o30 N/ACa (ppm) 13 4Ba (ppm) 0 4Mg (ppm) 0 4Zn (ppm) 0 4Si, Pb, Li, Al, Cd, Cr, Cu, Fe, K , Mn, Mo, Na, Ni, Sn, Ti, V (ppm) 0 N/A

Table 4Operating conditions of each test.
ID T01 T11 T12 T02 T03 T03b T04
Oil PAO PAO PAO PAO PAO PAO MINOil temperature T0 (°C) 100 100 100 80 90 90 100Pinion velocity n1 (rpm) 750 750 750 4500 2550 2550 750Load stage K9 K7 K5 K9 K9 K9 K9Contact load FN (N) 6373 3917 2069 6373 6373 6373 6373Avg. spec. film thick. Λ 0.12 0.12 0.12 0.46 0.30 0.30 0.12Pitch spec. film thick. ΛC 0.12 0.12 0.13 0.65 0.36 0.36 0.12Pitch p0;C ðMPaÞ 1408 1104 802.3 1408 1408 1408 1408Pitch half-width aC (μm) 205.2 160.9 116.9 205.2 205.2 205.2 205.2
Seven tests were performed in total. The duration of each testwas selected to ensure that the pinion completed 5.4 millionrevolutions. The operating conditions of each test are listed inTable 4, in which each columns from 2 to 8 shows the operatingconditions of a particular test. As an example, column 2 shows theoperating conditions under which test T01 was run: lubrication bythe PAO oil, oil sump temperature of 100 °C, 750 RPM pinionrotational speed, load stage K9. This leads to a contact loadFN¼6373 N, a mean specific central film thickness of Λ ¼ 0:12, aspecific central film thickness at pitch point ΛC ¼ 0:12, a maximumHertzian pressure at pitch point p0;C ¼ 1408 MPa, a contact half-width at pitch point aC¼205.2 μm.
Test T01 is used as the reference test, from which all otherdiverge in a single parameter. Tests T11 and T12 are performed toshow the influence of load on wear. Tests T02 and T03 are inten-ded to show the influence of specific film thickness on wear, noticethat the variation in film thickness is obtained through a change inboth angular velocity of the gears and temperature of the oil. Thiswas done to get a wider variation of specific film thickness thanwould have been possible by changing only the angular velocity ofthe gears, because the FZG machine on site only allows pinionrotational speeds up to 4500 rpm. Test T03b is a repetition of testT03 to evaluate the repeatability of the tests. Test T04 is intendedto show the influence of the oil basestock on wear.
The specific central film thickness was computed, not mea-sured. The Grubin formula, given by Dowson and Higginson [27],was used to compute the uncorrected central film thickness:
h0 ¼ 1:95R0:364 αη0 U1þU2ð Þ� 0:727 E0b=FN� �0:091 ð3Þ
where R is the effective radius of curvature, given by
R¼ R�11 þR�1
2
� ��1; E0 is the effective Young modulus, given by
E0 ¼ 2 ð1�ν21Þ=E1þð1�ν22Þ=E2� �1; R1 and R2 are the radii of cur-
vature of the pinion and wheel surface, ν1 and E1 are the poissonratio and the Young modulus of the pinion, respectively; ν2 and E2are the poisson ratio and the Young modulus of the wheel,respectively; η0 is the viscosity of the lubricant in the inlet; α is thepressure-viscosity coefficient.
Several formulas exist for the calculation of the correction tofilm thickness due to shear heating: for example, Gupta et al. [28]presented such a formula. Here, however, this was computed fromGohar [29]:
ϕT ¼ 1þ0:1 1þ14:8jU1�U2 jU1þU2
� �0:83" #
βðU1þU2Þη0Kf
� �0:64( )�1
ð4Þ
where ϕT is the inlet shear heating correction factor, β is thethermoviscosity coefficient and Kf is the thermal conductivity ofthe lubricant.
The correction for inlet shear-thinning was also applied, asrecommended by Bair and Winer [30]:
ϕNN ¼ 1þ4:44η0ðU1þU2Þ=2
h0G
� �1:69" #1:26ð1�nÞ1:79
ð5Þ
where G (Pa) and n are the parameters of the Carreau equation forshear thinning. Bair [31] lists these parameters for a different set oflubricating liquids. The values for G and n used here were those ofthe liquids in [31] most similar to PAO and MIN: for PAO,G¼1.4 GPa and n¼0.625 and for MIN, G¼3.4 GPa and n¼0.65.
The specific central film thickness corrected for inlet shearheating is then:
Λ¼ ðϕT=ϕNNÞh0σ
ð6Þ
The sequence of operations to perform each test was as follows:
1. Choose a pair of untested gears.2. Clean the gears in ultrasonic bath of petroleum ether.3. Weigh the pinion. The weighting precision is approximately
71 mg.4. Take roughness measurements (topographies) on the flank
surfaces of teeth 1 and 9 of the pinion and of teeth 1, 9 and 17of the wheel.
5. Clean the FZG test gearbox with petroleum ether and mountthe gears in the gearbox, adding 1 l of lubricating oil for diplubrication.
6. Set the operating conditions in the FZG controlling unit andrun the test for 5.4 million revolutions of the pinion(3.6 million revolutions of the wheel).
7. Immediately upon completion of the test, take an oil sample tobe analysed.
8. Clean the gears as before.9. Weigh the pinion.
10. Repeat the roughness measurements on the same tooth flanks.
Notice that there was no running-in stage: each test was per-formed under the same operating conditions from beginningto end.
3. Evaluation of the mean wear coefficient from the measuredmass loss
Archard [1] published in 1953 his famous wear law, whichdescribes the wear volume loss due to the sliding contact betweenflat surfaces:
ΔVS
¼ KHFN ð7Þ
where ΔV is the volume loss, S the sliding distance, K thedimensionless wear coefficient, H the softer surface's hardness andFN the normal contact load.
To use Archard's wear law in the more complex case of contactbetween gear teeth, it must be written in a differential form:
dhðx; tÞdt
¼ κpðx; tÞjU2ðtÞ�U1ðtÞj ð8Þ
where h is the wear depth, p the contact pressure and κ the wearcoefficient (with units of Pa�1). The coordinate x is the position onthe surface of the tooth shown in Fig. 1 and t is the time coordi-nate. U2 and U1 are the tangential velocities of the contactingsurfaces.
Generally, one can suppose that the wear coefficient willchange as the conditions of lubrication change. However, one canobtain the mean wear coefficient κ by remembering that the mean

pitc
h cy
linde
r
x
z
0
Fig. 1. Coordinates on the surface of the pinion tooth flank.
Fig. 2. Notable moments of the meshing of a pair of teeth: the consecutive posi-tions of a pair of contacting teeth are shown superimposed, as well as the share ofthe normal load borne by this pair of teeth as a function of the contact positionalong the contact line.
wear coefficient is a hypothetical constant wear coefficient thatwould lead to the same volume loss found in reality. Hence, themean wear coefficient can be used in all calculations as a constant,even though the true, non-averaged wear coefficient may varyin time.
During one full revolution of the pinion, a point situated atcoordinate x on one of its teeth will then have its height dimin-ished by:
δhðxÞ ¼Z tE
tAκpðx; tÞjU2ðtÞ�U1ðtÞjdt ð9Þ
where tA is the instant when the tooth first comes in contact withits counterpart on the wheel and tE is the instant when the toothceases contact.
On the same tooth, the volume lost to wear during one singlerevolution will then be:
δV ¼Z xA
xEδhðxÞbdx¼
Z xA
xE
Z tE
tAbκpðx; tÞjU2ðtÞ�U1ðtÞjdtdx ð10Þ
Or:
δV ¼Z tE
tA
Z xA
xEpðx; tÞbdx
�κ jU2ðtÞ�U1ðtÞjdt ð11Þ
And finally:
δV ¼ κFNZ tE
tA
FN;1FN
jU2ðtÞ�U1ðtÞjdt ð12Þ
where FN;1 is the share of contact load FN on the specific tooth (FNcan be distributed among several pairs of contacting teeth). Inconsequence, the volume lost by all Z teeth during all Nturns
revolutions of the gear is given by:
ΔV ¼NturnsZδV ¼ κFN NturnsZZ tE
tA
FN;1FN
jU2ðtÞ�U1ðtÞjdt �
ð13Þ
If one has access to the measured mass loss ΔM on a gear, themean wear coefficient can be deduced. If one accepts that thedensity ρ¼ 7850 kg=m3 of the gear steel remains constant duringthe tests, the volume loss ΔV is easily computed:
ΔV ¼ΔM=ρ ð14ÞHence the mean wear coefficient can be estimated from the
expression:
κ ¼ ΔM
FNNturnsρZR tEtA
FN;1FN
jU2ðtÞ�U1ðtÞjdtð15Þ
The denominator on the right-hand side of the expression can becomputed analytically so long as the evolution of the contact loadon a specific tooth pair is known along the line of action.
For the present, specific case of an FZG-CF pinion gear, dynamiceffects on the contact load between gears were disregarded and inevaluating the share of the contact load on a particular pair ofgears at any particular instant during gear meshing, AGMA'srecommendation [32] for gears with no root and tip relief wasfollowed. This is illustrated in Fig. 2, where the following eventsare depicted:
� At instant tA, the pair of teeth first comes into contact at point Aand the normal contact load is FN;1 ¼ FN=3.
� Between instants tA and tB, the contact load increases linearly.� At instant tB, a previous tooth pair disengages and the contact
load jumps from FN;1 ¼ 2FN=3 to FN;1 ¼ FN .� At instant tC, the theoretical tooth pair contact is on the pitch
point at C.� At instant tD, another tooth pair comes into contact at D and the
contact load drops from FN;1 ¼ FN to FN;1 ¼ 2FN=3.� Between instants tA and tB, the contact load decreases linearly.� At instant tE, the tooth pair disengages at E, and the normal
contact load is FN;1 ¼ FN=3.
In this case, where the aim is to determine the mean wearcoefficient from the mass loss on the pinion, the following integralcan be calculated and will be the same under any set of operatingconditions (for the pinion):Z tE
tA
FN;1FN
jU2ðtÞ�U1ðtÞjdt ¼ 2:535 mm ð16Þ
Consequently, considering the properties of the pinion:
κ ¼ 3:140� 10�3 ΔMNturnsFN
ð17Þ
where ΔM must be in (kg), FN in (N) and the result comes out in(Pa�1).
4. Experimental results and discussion
4.1. Mass loss and wear coefficient
Fig. 3 gives the mass loss results – ΔM (mg) – obtained bycomputing the difference between weighings of the pinion beforeand after a test. The graph is organised into four subfigures, allwith the same scale: Fig. 3a deals with the variation of mass losswith load; Fig. 3b, with mean specific thickness; Fig. 3c, with

Fig. 3. Measurements of mass loss ΔM (mg) on the pinion. Fig. 4. Mean wear coefficient κ (10�18 Pa�1).
Fig. 5. Direct reading ferrography: large particles (DL) and small particles (DS).
basestock; and Fig. 3d shows two tests run with the sameparameters.
The way in which Fig. 3a shows the variation of mass loss withload is by displaying one above the other horizontal bars that givethe measurement for each of tests T01, T11 and T12, shown inorder of decreasing contact load. To the left of the bars are printedthe conditions of operation that were kept the same in all threetests. To the right of the bars are shown the test code and value ofthe operating condition that is changed. Fig. 3a gives the com-pletely unsurprising result that mass loss increases with load.
Fig. 3b is organised similarly to Fig. 3a. Notice how test T01, thebase case, is shown again, for comparison. It would be expectedthat mass loss would decrease with increasing specific filmthickness, but that is not the story told by the figure: it is true thatthere is a decrease in mass loss when going from Λ ¼ 0:30 toΛ ¼ 0:46, but the opposite is true when going from Λ ¼ 0:12 toΛ ¼ 0:30. The answer to this puzzle must be found in the fact thatthe tests were performed with oils at different temperatures:100 °C for test T01, 90 °C for T03 and 80 °C for T02. This was doneto get a wider variation of specific film thickness than would havebeen possible by changing only the angular velocity of the gears.Since the (at first glance) incongruously low mass loss occurs withthe test with very low Λ and high temperature, this may be a caseof thermal activation of additives. The assumption that filmthickness is the only lubrication parameter to consider for wear isthus shown to be false: temperature should be considered as well.
Fig. 3c, organised similarly to Fig. 3a, shows that changing froma synthetic PAO to a mineral oil of similar viscosity gives rise to agreater increase in mass loss than can be obtained with a changein load or a change in specific film thickness alone. Once more, thisis not a surprising or new result. However, the magnitude of var-iation can be compared here with the influence of load and filmthickness for gears.
Finally, Fig. 3c gives the mass loss for two tests (T03 and T03b)that were run with the same parameters. It can be seen that,between tests that in theory should give the same result, the massloss can differ by 5 mg. This gives an estimate of what constitutes anon-significant difference. This is still lower than the variationsobserved in Fig. 3a–c, so they must be significant.
Using the method detailed in Section 3, the mean wear coef-ficient κ was estimated from each measurement of mass loss andFig. 4 was constructed. It is organised similarly to Fig. 3.
Fig. 4 d shows that repetition of a test can give differences of0:4� 10�18 Pa�1 in wear coefficient. This is therefore an estimateof the precision in measurement that can be achieved with thecurrent experimental setup.
It is generally assumed that the wear coefficient is independentof the contact load. However, Fig. 4a, which shows the variation of κwith load, is inconclusive in that respect. While tests T01 and T12give essentially the same wear coefficient 2:8�3:1� 10�18 Pa�1,test T11 gives a lower wear coefficient (2:2� 10�18 Pa�1). The
difference is slightly larger than the difference in Fig. 4d, whichmight or might not mean that it is significant.
Figs. 4b and c give rise to the same comments that were madeabout Figs. 3b and c, respectively.
Observing the subfigures together, it is clearly the case that thevariation of the wear coefficient with load is much smaller thanthat with specific film thickness or with basestock (which areroughly the same).
4.2. Direct reading ferrography
A small volume (1 ml) of each lubricant sample taken after thetests, diluted with a dilution factor d¼0.1, was submitted to DirectReading Ferrography examination. The results in terms of largeparticle count (DL) and small particle count (DS) is shown in Fig. 5.The figure is organised similar to Fig. 3: it constituted of foursubfigures, each dealing with the variation with regard to onesingle parameter, which are plotted as grey horizontal bars. On theleft side of the bars are found the parameters that share the samevalue among tests, on the right side is found the parameter thatchanges from test to test.
Study of Fig. 5 shows the same tendencies as Fig. 3, both for DL
and for DS. There is, however, a big difference found in Fig. 5b: thelarge increase in wear particle count when increasing the specificfilm thickness from 0.12 to 0.3 and 0.46. This is especially oddbecause the mass loss in tests T01 and T02 is roughly the same,while particle counts are very different. This seems to give cre-dence to the idea that a different wear regime is in action underthe lowest Λ (which corresponds to the hottest temperature). Adifference in behaviour between the PAO and MIN oils can also beobserved in Fig. 5c: the large increase in wear, upon switchingfrom PAO to MIN, is mirrored by an increase in the large particlecount DL; however, the small particle count DS decreases instead.Hence, larger particles are produced with MIN than with PAO. Thisis confirmed in Figs. 8a and d, showing micrographs of particlesproduced in each case.
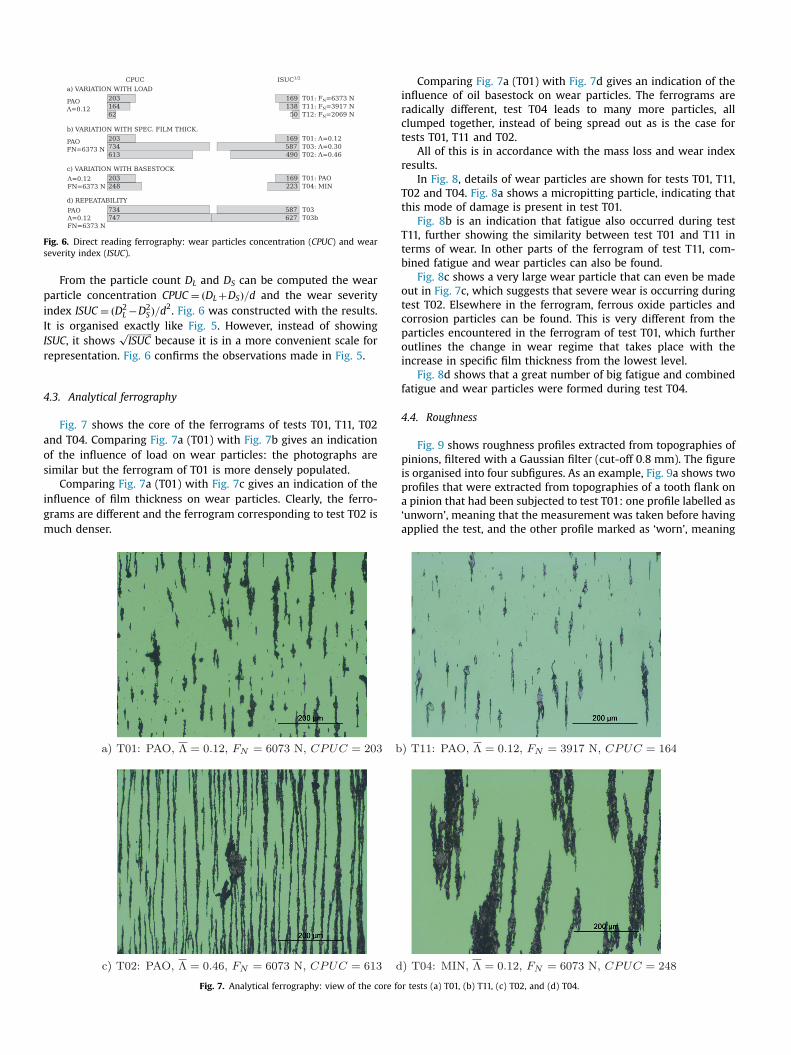
Fig. 6. Direct reading ferrography: wear particles concentration (CPUC) and wearseverity index (ISUC).
From the particle count DL and DS can be computed the wearparticle concentration CPUC ¼ ðDLþDSÞ=d and the wear severityindex ISUC ¼ ðD2
L �D2S Þ=d2. Fig. 6 was constructed with the results.
It is organised exactly like Fig. 5. However, instead of showingISUC, it shows
ffiffiffiffiffiffiffiffiffiffiffiISUC
pbecause it is in a more convenient scale for
representation. Fig. 6 confirms the observations made in Fig. 5.
4.3. Analytical ferrography
Fig. 7 shows the core of the ferrograms of tests T01, T11, T02and T04. Comparing Fig. 7a (T01) with Fig. 7b gives an indicationof the influence of load on wear particles: the photographs aresimilar but the ferrogram of T01 is more densely populated.
Comparing Fig. 7a (T01) with Fig. 7c gives an indication of theinfluence of film thickness on wear particles. Clearly, the ferro-grams are different and the ferrogram corresponding to test T02 ismuch denser.
Fig. 7. Analytical ferrography: view of the core fo
Comparing Fig. 7a (T01) with Fig. 7d gives an indication of theinfluence of oil basestock on wear particles. The ferrograms areradically different, test T04 leads to many more particles, allclumped together, instead of being spread out as is the case fortests T01, T11 and T02.
All of this is in accordance with the mass loss and wear indexresults.
In Fig. 8, details of wear particles are shown for tests T01, T11,T02 and T04. Fig. 8a shows a micropitting particle, indicating thatthis mode of damage is present in test T01.
Fig. 8b is an indication that fatigue also occurred during testT11, further showing the similarity between test T01 and T11 interms of wear. In other parts of the ferrogram of test T11, com-bined fatigue and wear particles can also be found.
Fig. 8c shows a very large wear particle that can even be madeout in Fig. 7c, which suggests that severe wear is occurring duringtest T02. Elsewhere in the ferrogram, ferrous oxide particles andcorrosion particles can be found. This is very different from theparticles encountered in the ferrogram of test T01, which furtheroutlines the change in wear regime that takes place with theincrease in specific film thickness from the lowest level.
Fig. 8d shows that a great number of big fatigue and combinedfatigue and wear particles were formed during test T04.
4.4. Roughness
Fig. 9 shows roughness profiles extracted from topographies ofpinions, filtered with a Gaussian filter (cut-off 0:8 mm). The figureis organised into four subfigures. As an example, Fig. 9a shows twoprofiles that were extracted from topographies of a tooth flank ona pinion that had been subjected to test T01: one profile labelled as‘unworn’, meaning that the measurement was taken before havingapplied the test, and the other profile marked as ‘worn’, meaning
r tests (a) T01, (b) T11, (c) T02, and (d) T04.

Fig. 8. Analytical ferrography: view of details of wear particles for tests (a) T01, (b) T11, (c) T02, and (d) T04.
that the measurement was taken after having applied the test.Extreme care was taken to extract, as much as possible, profileslocated at the same position on the tooth flank. Notice a deepindentation near the tip of the tooth: this is an artificial markadded before the ‘unworn’ measurement to help in the correctlocalisation of the subsequent profile. The abscissa corresponds tothe arc length on the surface of the tooth. Important points aremarked as letters: point C is the pitch point; between point B andpoint D, the contact is between a single pair of teeth; outside thissegment, contact is shared between two pairs of teeth.
The remaining subfigures, Figs. 9b,c and d, show the sameinformation for tests T12, T03 and T04, respectively.
Comparison of the two profiles in Fig. 9a (test T01) shows thatthe variation of the roughness profile during test T01 is fairlymodest, although micropits are noticeable below the pitch point.In general, the roughness is attenuated after the test.
In Fig. 9b (test T12, lower load), the evolution of roughnessfollows a similar pattern as in Fig. 9a, although only few micropitsare visible below the pitch point.
Fig. 9c (test T03) shows a very different evolution from that inFig. 9a. The roughness profile is very altered and large micropitshave appeared above the pitch point. This is in keeping with theresults previously presented, particularly the mass loss results.
Fig. 9 d (test T04) shows that a very deep alteration of the profilehas taken place. In particular, the artificial groove at the tip seems tohave been almost worn away and many crags and valleys haveappeared below the pitch point. Once more, this is in keeping withthe mass loss results, or indeed all other results previously shown.
It would be interesting at this point to list some roughnessparameters of the profiles shown in Fig. 9. However, it would bemisleading to show the roughness parameter for the full length ofa profile because the artificial marks are so large that they alter theroughness parameters. That is why only the length of profilescorresponding to xo5 mm are used to compute the roughness Raand RMS roughness Rq shown in Table 5.
Table 5 is instructive because it shows that the only test duringwhich roughness increases is test T04, the one where the mostwear occurred. Even during test T03, which saw significant wearand alteration of the profile, roughness decreased. This shows thatroughness parameters are poor indicators of wear damage. This isin large part because no running-in stage was applied before thetests. The running-in effect of smoothing roughness still dom-inates the roughness parameters in all but one test.
5. Conclusion
Seven wear tests were conducted on an FZG gear testingmachine in order to ascertain the influence of basestock, specificfilm thickness and contact load on wear of spur gears, particularlyon the wear coefficient κ that is used in Archard's law. It wasshown that:
� The choice of basestock is particularly significant: lubricationwith a mineral oil leads to much higher wear than lubrication

Fig. 9. Roughness profiles (both before and after gear testing) extracted from thetopographies of pinion gear teeth that were submitted to test (a) T01, (b) T11,(c) T02, and (d) T04.
Table 5Roughness parameters.
Test T01 T12 T03 T04
Ra unworn (μm) 0.33 0.50 0.54 0.39Ra worn (μm) 0.33 0.32 0.37 0.47Rq unworn (μm) 0.42 0.63 0.69 0.49Rq worn (μm) 0.45 0.41 0.49 0.64
with a PAO of similar viscosity. This was true for all wearparameters measured, including the wear coefficient.
� The influence of specific film thickness is unclear. At very lowfilm thickness (Λ ¼ 0:12, boundary lubrication conditions) thewear behaviour was non-linear: wear was much lower thanwith much higher film thickness (Λ40:3). This is very counter-intuitive, since one would expect that a higher frequency ofdirect collisions between asperities would lead to much higherwear. This may be because the lower film thickness wasobtained in part by increasing temperature, thus potentiallythermally activating the additives. If this is the case, one needsto revise the idea that the film thickness is the only lubricationparameter that influences wear coefficient (as implied by thelaw proposed by [17]): temperature might be an importantfactor.
� The influence of load is also unclear. It is certain that an increasein load also increases wear: this was amply shown in all mea-surements. However, Archard's law presupposes that the wearcoefficient is largely independent of contact force. This was notentirely borne out by the experimental results, which show adip in wear coefficient at an intermediate contact load. This dipseems to be deep enough to be significant.
From the above, it is clear that further testing is needed, inparticular to separate the influence of specific film thickness fromthat of temperature.
Acknowledgements
The present work is funded by the European Regional Devel-opment Fund (ERDF) through the ‘COMPETE – Competitive FactorsOperational Program’ and by Portuguese Government Fundsthrough ‘FCT – Fundação para a Ciência e Tecnologia’ as part of:
� project ‘High efficiency gears and lubricants for wind mill pla-netary gearboxes’, reference number ‘PTDC/EME-PME/100808/2008’, for the experimental work;
� project ‘Projecto Estratégico – LA 22 – 2011–2012’, referencenumber ‘Pest-OE/EME/LA0022/2011’, for the rolling contactfatigue simulation;
� project ‘Gear transmissions of high tribological efficiency andreliability’, reference number ‘EXCL/EMS-PRO/0103/2012’, forthe wear simulation.
References
[1] Archard J. Contact and rubbing of flat surfaces. J Appl Phys 1953;24(8):981–8.[2] Flodin A, Andersson S. Simulation of mild wear in spur gears. Wear 1997;207
(1):16–23.[3] Flodin A, Andersson S. Simulation of mild wear in helical gears. Wear
2000;241(2):123–8. http://dx.doi.org/10.1016/S0043-1648(00)00384-7.[4] Flodin A, Anderson S. A simplified model for wear prediction in helical gears,
Wear 249 (3–4) (2001) 285–92. In: Proceedings of the ninth Nordic sympo-sium on tribology. ⟨http://www.sciencedirect.com/science/article/pii/S0043164801005567⟩ http://dx.doi.org/http://dx.doi.org/10.1016/S0043-1648(01)00556-7.
[5] Bajpai P, Kahraman A, Anderson NE. A surface wear prediction methodologyfor parallel-axis gear pairs. J Tribol 2004;126(3):597–605. http://dx.doi.org/10.1115/1.1691433.
[6] Kahraman A, Bajpai P, Anderson NE. Influence of tooth profile deviations onhelical gear wear. J Mech Des 2005;127(4):656–63. http://dx.doi.org/10.1115/1.1899688.
[7] Ding H, Kahraman A. Interactions between nonlinear spur gear dynamics andsurface wear. J Sound Vib 2007;307(3–5):662–79. http://dx.doi.org/10.1016/j.jsv.2007.06.030.
[8] Kuang JH, Lin AD. The effect of tooth wear on the vibration spectrum of a spurgear pair. J Vib Acoust 2001;123(3):311–7. http://dx.doi.org/10.1115/1.1379371.
[9] Wojnarowski J, Onishchenko V. Tooth wear effects on spur gear dynamics.Mech Mach Theory 2003;38(2):161–78. http://dx.doi.org/10.1016/S0094-114X(02)00091-5.
[10] Onishchenko V. Tooth wear modeling and prognostication parameters ofengagement of spur gear power transmissions. Mech Mach Theory 2008;43(12):1639–64. http://dx.doi.org/10.1016/j.mechmachtheory.2007.12.005.
[11] Osman T, Velex P. Static and dynamic simulations of mild abrasive wear inwide-faced solid spur and helical gears. Mech Mach Theory 2010;45(6):911–24. http://dx.doi.org/10.1016/j.mechmachtheory.2010.01.003.
[12] Brauer J, Andersson S. Simulation of wear in gears with flank interference–amixed fe and analytical approach. Wear 2003;254(11):1216–32.
[13] Park D, Kolivand M, Kahraman A. Prediction of surface wear of hypoid gearsusing a semi-analytical contact model. Mech Mach Theory 2012;52:180–94.http://dx.doi.org/10.1016/j.mechmachtheory.2012.01.019.
[14] Flodin A. Wear investigation of spur gear teeth. Tribotest 2000;7(1):45–60.http://dx.doi.org/10.1002/tt.3020070106.
[15] Krantz T, Kahraman A. An experimental investigation of the influence of thelubricant viscosity and additives on gear wear. Tribol Trans 2004;47(1):138–48. http://dx.doi.org/10.1080/05698190490278949.
[16] Townsend DP, Shimski J. Evaluation of the EHL film thickness and extremepressure additives on gear surface fatigue life. Technical report NASA-TM-106663. NASA Lewis Research Center, Cleveland, OH, United States; 1994.⟨http://ntrs.nasa.gov/search.jsp?R¼19940032811⟩.
[17] Priest M, Taylor C. Automobile engine tribology—approaching the surface.Wear 2000;241(2):193–203. http://dx.doi.org/10.1016/S0043-1648(00)00375-6 http://www.sciencedirect.com/science/article/pii/S0043164800003756.
[18] İmrek H, Düzcükoğlu H. Relation between wear and tooth width modificationin spur gears. Wear 2007;262(3–4):390–4. http://dx.doi.org/10.1016/j.wear.2006.06.004.

[19] Brandão JA, Martins R, Seabra JHO, Castro MJ. Calculation of gear tooth flanksurface wear during an FZG micropitting test. Wear 2014;311(1–2):31–9. http://dx.doi.org/10.1016/j.wear.2013.12.025.
[20] Brandão JA, Martins R, Seabra JH, Castro MJ. An approach to the simulation ofconcurrent gear micropitting and mild wear. Wear 2015;324–325:64–73.http://dx.doi.org/10.1016/j.wear.2014.12.001 http://www.sciencedirect.com/science/article/pii/S0043164814003706.
[21] Winter H, Michaelis K, FZG gear test rig – desciption and possibilities. In:Coordinate European council second international symposium on the perfor-mance evaluation of automotive fuels and lubricants; 1985.
[22] FVA. Test procedure for the investigation of the micro-pitting capacity of gearlubricants, FVA–information sheet 54/I-IV; 1993.
[23] Roelands CJA. Correlation aspect of viscosity–temperature–pressure relation-ships of lubricating oils [Ph.D. thesis]. Delft University of Technology; 1967.
[24] Brandão JA, Meheux M, Ville F, Seabra JH, Castro J. Comparative overview offive gear oils in mixed and boundary film lubrication. Tribol Int 2012;47:50–61. http://dx.doi.org/10.1016/j.triboint.2011.10.007.
[25] Gold PW, Schmidt A, Dicke H, Loos J, Assmann C. Viscosity–pressure–tem-perature behaviour of mineral and synthetic oils. J Synth Lubr 2001;18(1):51–79. http://dx.doi.org/10.1002/jsl.3000180105.
[26] Larsson R, Andersson O. Lubricant thermal conductivity and heat capacityunder high pressure. Proc Inst Mech Eng Part J: J Eng Tribol 2000;214(4):337–
42. http://dx.doi.org/10.1243/1350650001543223, URL ⟨http://pij.sagepub.com/content/214/4/337.abstract⟩.
[27] Dowson D, Higginson GR. Elasto-hydrodynamic lubrication, S.I. Edition.Oxford: Pergamon Press Ltd.; 1977.
[28] Gupta PK, Cheng HS, Zhu D, Forster NH, Schrand JB. Viscoelastic effects in MIL-L -7808-type lubricant, Part I: analytical formulation. Tribol Trans 1992;35(2):269–74. http://dx.doi.org/10.1080/10402009208982117.
[29] Gohar R. Elastohydrodynamics. Chichester: Ellis Horwood; 1988.[30] Bair S, Winer WO. A simple formula for EHD film thickness of non-Newtonian
liquids. In: Dowson D, Taylor CM, Childs THC, Dalmaz G, Berthier Y, Flamand L,Georges J-M, Lubrecht AA, editors. Elastohydrodynamics – 96, Fundamentalsand applications in lubrication and traction. Proceedings of the 23rd Leeds-Lyon symposium on tribology held in the institute of tribology, Departmentof Mechanical Engineering, Tribology series, vol. 32. Elsevier; 1997.p. 235–41 ⟨http://www.sciencedirect.com/science/article/pii/S0167892208704528⟩ 10.1016/S0167-8922(08)70452-8.
[31] Bair S. The shear rheology of thin compressed liquid films. Proc Inst Mech EngPart J: J Eng Tribol 2002;216(1):1–17 ⟨http://pij.sagepub.com/content/216/1/1.abstract⟩ 10.1243/1350650021543834.
[32] AGMA. Effect of lubrication on gear surface distress, AGMA information sheet,American Gear Manufacturers Association, 2003, 925-A03.