measurements in liquid fuel sprays fuel spr&ys final … · 2013-08-30 · measurements in...
TRANSCRIPT
MEASUREMENTS IN LIQUID FUEL SPRAYS
NASA Cooperative Agreement NCC 3-37
f (NASft-CE-177088) MEASUEEMEN1S IN LIQUID N86-/3Q960.--FUEL SPR&YS Final fieport, 15 Dec. ,1983 - 14 .Dec.,,1985 JCarnegie-Mellon Ociv.), 51 p .. .
CSCL 20D OnclasG3/34 43377
FINAL REPORT
12/15/83 - 12/14/85
Norman ChigierChien-Pei Mao
Department of Mechanical EngineeringCarnegie-Mellon University
Pittsburgh, PA I52I3
https://ntrs.nasa.gov/search.jsp?R=19860021488 2020-04-28T23:47:21+00:00Z
1. INTRODUCTION
To successfully achieve all weather operation of military aircraft and rotorcraft,
a thorough understanding of the adverse weather effects on the aircraft performance
is required. It is for this reason that research on the effects of icing, snow and
heavy rain has been carried out at NASA for several years. So far, most of the tests
have been performed using expensive, time consuming and dangerous flight testing. A
unique ground test facility is being established at NASA Lewis Research Center to
simulate the environmental and flight conditions needed to study adverse weather
effects. One of the most important components in this ground test facility is the
water spray system which consists of many nozzles fitted on spray bars. Water is
injected through air-assisted atomizers to generate uniform size drops to simulate
natural icing in clouds.
The air-assist atomizer uses pressurized air to enhance the atomization produced
by pressurized liquid. The atomization of liquid is primarily achieved by the shear
forces due to high speed air flows. The major requirement is to generate uniform
size water drops with control at the test section of the wind tunnel so that realistic
environments can be achieved. Typical water drop sizes in icing clouds range from 5
to 60 //m, mass median diameter. The performance and characteristics of the air-
assisted atomizer designed by NASA Lewis are being studied at CMU in order to
determine the requirements for simulating icing clouds. Therefore, the primary
objective of the present investigation is to provide experimental data on drop size
distribution over a wide range of operating conditions. Correlation equations for mean
drop size and initial injection parameters are being determined to assist in the design
and modification of the Altitude Wind Tunnel. Special emphasis is being placed on
the study of the aerodynamic structure of the air-assisted atomizer sprays. Detailed
measurements of the variation of drop size distribution and velocity as a function of
time and space are being made. A second objective is to provide accurate initial
and boundary conditions for computer model evaluation.
A number of instruments including high magnification photography, laser
diffraction, and the phase doppler analyzer are being used to make the measurements
of spray angle, line-of-sight drop size distribution, and local point information such
as drop size, velocity, liquid flux, and number density. The current drop velocity
measurements using the phase doppler analyzer are limited to low liquid injection
conditions due to the restricted instrument response. The higher frequency signal
measurements will be pursued by adding optical frequency shifting such that the

Doppler frequency of the scattered light signal is optically downshifted into the
operating range of the processor.
A comparative study of the data being obtained by photography, laser
diffraction, and phase doppler on mean drop size distribution has shown inconsistent
results at the same operating flow conditions. The differences in SMD are related to
the limitations in dynamic range, detector response, sampling techniques, and
sampling time of each instrument. An "ultimate" SMD could be measured provided
that these limitations are suppressed and all drops are measured over a "long
enough" time to cover all the possible low and high frequencies in the systems.
None of the instruments are currently capable of measuring this "ultimate" SMD.
Therefore, comparative measurements using different instruments are always subject
to a certain degree of disagreement. Photography has the problems of obtaining
statistically representative results and of not counting extremely large numbers of
unfocused small drops. The laser diffraction particle sizer is limited by the threshold
sensitivity of the diodes and the small detecting area of the inner diode rings. The
relatively small number of large drops are overshadowed by a huge amount of small
drops which reduce the sensitivity of the inner diodes which have relatively small
area. In principle, the phase doppler particle analyzer has the potential of detecting
the "ultimate" SMD of the sprays. It also provides the capability of examining
particular sections of the size distribution spectrum that are of particular interest, by
varying the threshold level of the processor and the high voltage of the detector.
However, this capability is restricted by the instrument dynamic range and detector
response.
2. EXPERIMENTS
The aim of the present investigation is to find correlation equations for
predicting SMD (Sauter Mean Diameter) over a wide range of injection conditions to
assist icing tunnel design and to establish a data base for computer model
evaluation. The water mass flow rates that are being studied range from 10 Ibm/hr to
100 Ibm/hr. This corresponds to injection pressures ranging from 10 psi to 205 psi.
The mass flow rate of air ranges from 20 Ibm/hr to 150 Ibm/hr which corresponds to
a pressure injection range from 10 to 155 psi. Experiments are carried out in two
different sizes of spray chambers under well-controlled flow conditions to
accommodate both high and low water/air mass flow rate ratios.

Spray Chambers
Two spray chambers are being used for testing. Fig. 1 shows the configuration
of the small scale spray chamber. This chamber was designed to accommodate
maximum water flow rates of 40 Ibm/hr. The cross-sectional area of the chamber is
12x12 inches and the window viewing area is 12x14 inches. A traversing system
installed in the chamber provides 2-D freedom of motion of the atomizer without
requiring the diagnostic instruments to be moved. For injection conditions of water/air
mass flow rate ratio less than 1, strong recirculating flows are created in the
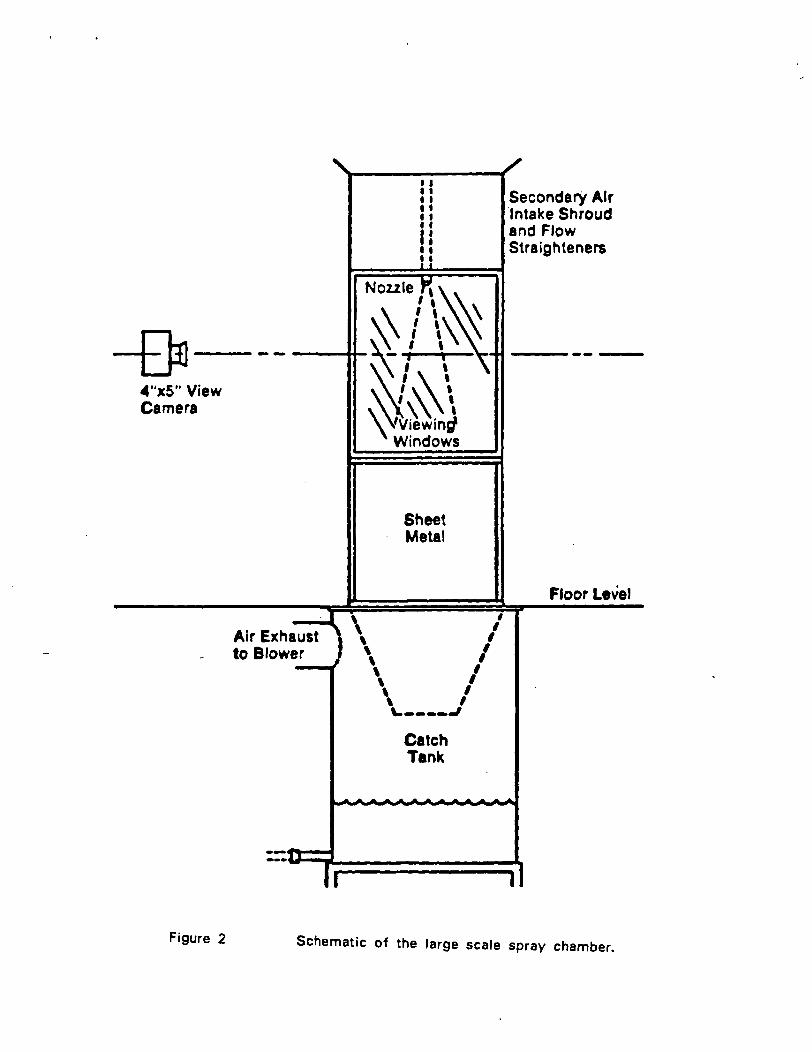
chamber which significantly perturb the sprays. The large scale spray chamber is,
therefore, used for examining the high speed liquid flows. Fig. 2 shows a schematic
of the large scale spray chamber. This system is capable of providing maximum flow
rates of 1200 Ibm/hr for water and 190 Ibm/hr for air. The four-sided, glass walled
spray chamber has a cross sectional area of 20x25 inches. The window height is 29
inches. «A secondary air flow, produced by the suction of a high power blower,
eliminates the flow recirculation and fogging of the window. The advantages of the
large scale chamber are: wider range of test conditions, no recirculation,
measurements can be made farther downstream (up to 30 inches downstream from
the atomizer orifice), and a larger working distance. The disadvantage is that the
larger cross sectional distance is approaching the critical value of vignetting so that
receiving lenses less than 300 mm cannot be used for data acquisition. The small
spray chamber, on the contrary, is much easier to operate and allows more accurate
control of the flow rates.
Atomizers
Two atomizers have been received from NASA for testing. They are numbered
as nozzle 100 and 2, respectively. These two atomizers have the same nozzle design
(see Fig. 3), but with different flow rates at the same injection conditions. A careful
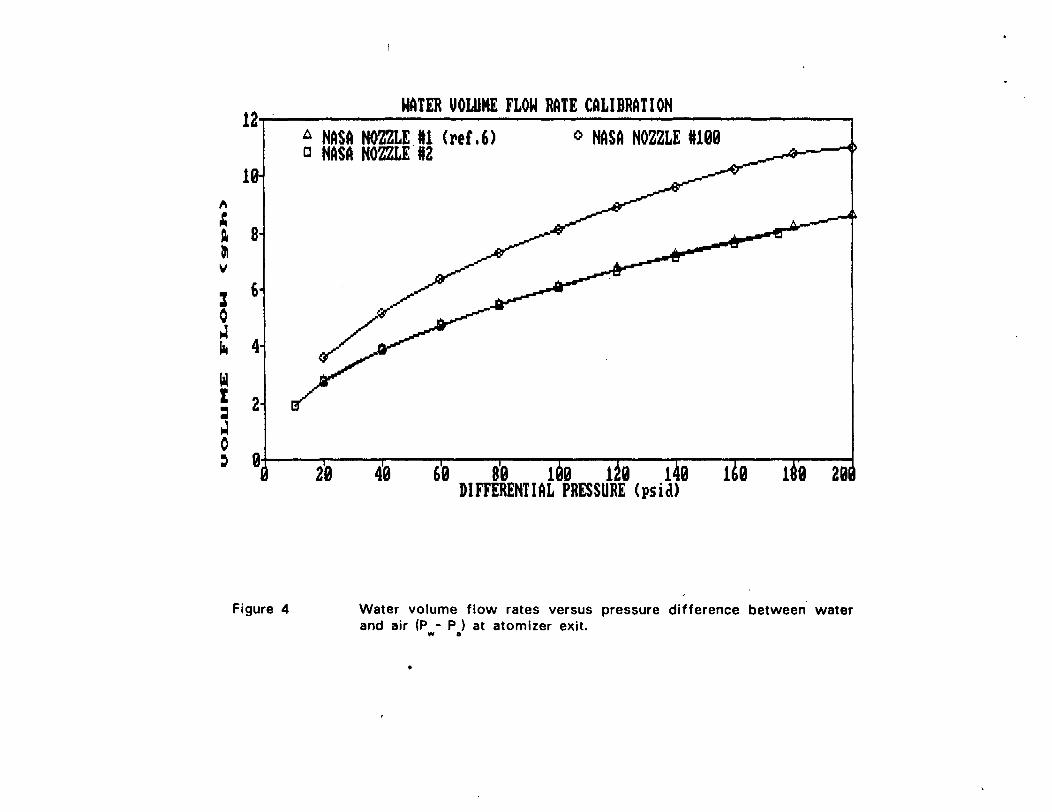
calibration of the water volume flow rates of these two atomizers was made. Fig. 4
shows the water volume flow rates versus differential pressures for both the number
100 and 2 atomizers. The "differential pressure" refers to the pressure difference
between water injection and air injection at the atomizer exit in units of psi. Both the
number 100 and number 2 atomizers have been tested in the present investigation.
Qualitatively, these two atomizers have similar characteristics. As indicated in Fig. 4,
#100 nozzle has a higher volume flow rate than that of #2 nozzle at the same
differential pressures. For nozzle #100, all data of volume flow rates fit well with
the following equation,
v = 0.81

where v is the water volume flow rate in gallons per hour, and 5P is the differential
pressure in psi. As for nozzle #2, it was also found that water volume flow rate is
proportional to the square root of differential pressure,
v = 0.609
Although these two nozzles have the same design, the water mass flow rates are
different. The differences are found due to the surface roughness at the nozzle exit.
Nozzle #100 has much rougher lips at the exit. The nominal diameter of the orifice
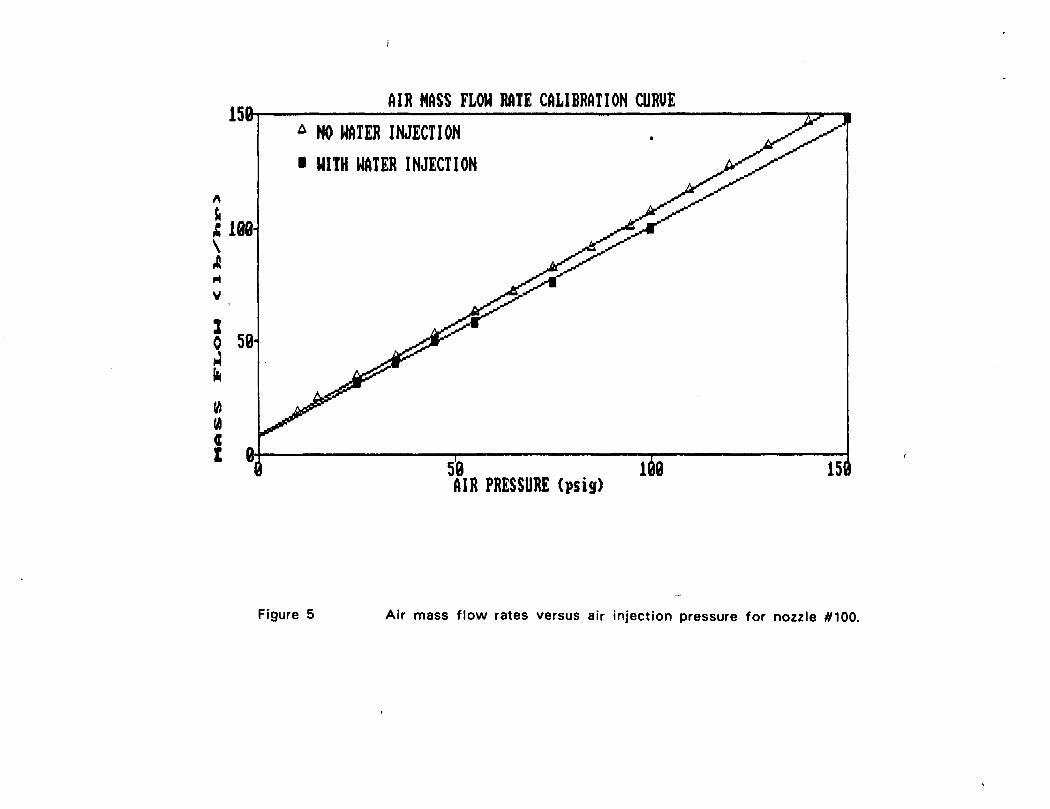
is essentially bigger for nozzle 100. In the #100 air-assisted atomizer, the pressure
of air flow affects the pressure of liquid injection. Fig. 5 shows the mass flow rate
of air versus gauge pressure with and without water injection for nozzle #100. The
mass flow rates of air are linearly proportional to the gauge pressure in the nozzle.
Under the water injection condition, the mass flow rates of air are slightly decreased
due to the decrease of the cross-sectional area at the nozzle exit. Fig. 6 shows the
air mass flow rates versus the gauge pressure for nozzle #2.
Photography
Still photography is used as the standard means for visualization and
preassessment of global spray structure. It also provides a calibration intermediate
between the standard calibrating devices (reticule and impulsed drop generator) and
other instruments with high data acquisition rate. A low magnification 35 mm Canon
F-1 camera with near forward lighting technique is used to determine the spray angle.
The light source is a Koolbeam light bulb array which consists of 300 W tungsten
halogen lamps. Measurements of the spray angle are made by setting the camera at
f/11 and 1/125 second time exposure. These settings are selected to provide high
contrast and consistent spray angles since spray angle can be changed by varying the
light exposure. A high magnification 4x5 inches format camera with a 5 feet and a 10
feet long bellows is also used to examine local spray structure. The high speed, high
intensity EG&G 549 microflash light source is utilized to freeze the high speed drop
motion and to provide enough light scattering intensity from the smaller drops.
Laser Diffraction Particle Sizer
For a rapid analysis of the spray characteristics, the laser diffraction particle
sizer is currently the most effective instrument at CMU. Line-of-sight mean drop size,
size distribution and liquid volume concentration information are provided by this
instrument. The instrument is based on the detection of near-forward Fraunhofer
diffraction. It is rather simple in operation and is efficient in data acquisition.

However, there are many limitations associated with the detection technique.
Extensive studies of the accuracy and limitations of the laser diffraction particle
sizer have been made at CMU. The major problem with this instrument is obtaining
accurate drop size spectra in sprays due to the lack of the capability of "seeing" the
small fraction of large drops which are clearly seen in photographic pictures. Results
have shown that this problem is more severe at extremely high and low obscuration
conditions. Nevertheless, the laser diffraction particle sizer is used as the principal
instrument for determining representative drop sizes in sprays. Measurements are
made at several selected downstream axial and radial stations. At each axial location,
the atomizer is traversed radially across the laser beam to obtain radial size
distributions. A horizontal plane averaged SMD is obtained by taking into account the
non-uniform liquid volume concentration distribution for drop size correlation.
Phase Doppler Spray Analyzer
This instrument is used for detailed local drop size and velocity measurements
in the sprays. It was developed by Bachalo and Houser1. The technique is based upon
the measurement of the interference fringe pattern produced by spherical drops
passing through the intersection of two laser beams. Three detectors, separated at
fixed spacing, are used to receive doppler signals and to determine the phase shift
due to different path lengths of the laser beam. The spatial frequency of the
interference fringe pattern is linearly proportional to the measured drop size. The
most important capability of this instrument is that it provides simultaneous drop
size and velocity measurements. Other local point information provided by this
instrument include: liquid flux, number density, size-velocity correlation, spatial and
temporal mean drop sizes. A detailed validation study has been performed to
determine the limitations and accuracy of this instrument. A rotating disk and an
impulsed piezoelectric drop generator are used as calibration devices. A number of
problems with this instrument have been found during the validation study. They
include: an inconsistency in measured velocities which differed at times by a factor
of 2, a complete lock-up at certain filter selections, and general failure of certain
configurations to provide reliable data. These problems have been corrected by the
manufacturer and they were recognized to be caused by a digital board trace short,
incomplete trace cuts on the processor motherboard, and improper plastic connector
shells on cables. From our experience, all optical configurations (which determine
different measurement ranges) require to be examined before use. Otherwise, any of
the problems mentioned above may arise with certain optical configurations and may
not be easily detected. Our instrument has an upper doppler frequency limit of 3.2
MHz due to the limitation of the detector/preamplifier response. It is for this reason
that the phase doppler spray analyzer is currently being used only for measuring very
low water injection conditions which have lower drop velocities. The system will be
upgraded by purchasing a rotating grating frequency shifter to enable higher speed
flows to be measured so that the whole range of injection conditions can be
examined.
3. RESULTS AND DISCUSSION
Breakup Mechanism and Atomization
Fig. 7 to Fig. 14 are shown to demonstrate the typical air-assist spray structure
and the process of atomization. Air-assist atomizers employ the kinetic energy of
air flow to tear the water jet into ligaments and subsequently into various sizes of
drops. Fig. 7 shows that water emerges from the orifice as a circular jet with very
high speed. The water circular jet is very unstable, even under the condition of no
air injection. The oscillation of the jet causes the formation of necking and the
amplitude of the oscillation grows with downstream distance. Any distortion of the
water jet surface due to oscillation is opposed by surface tension forces. Through
several stages of force balance, ligaments and satellite drops are formed between
the necks. The atomization can be highly improved by injecting the water into a
high-velocity airstream. Fig. 8 to Fig. 14 show the effect of increasing air velocity
on atomization. Apparently, Fig. 14 shows the best atomization due to higher air
velocity. In fact, the NASA air-assist atomizer is very similar to the
Nukiyama-Tanasawa2 atomizer. At a fixed water injection pressure, the mean drop
size decreases with the increase of air flow rates or decreases with the increase of
relative velocity. In the flow field near to the atomizer, the velocity of air is much
higher than that of the water. The velocity of air was estimated to be close to
sonic velocity at all test conditions. The inverted "V" shape of the spray near the"
orifice indicates that the water jet is surrounded by high speed air flow and is
dragged by the air in the direction of the air flow. The velocity of air relaxes much
faster than the liquid flow velocity as downstream distance increases. The global
shape of the spray is seen to be converted into a "V" shape far downstream where
the velocity of liquid is faster than the velocity of air. It is also noted that the
angle of the inverted "V" shape in the near flow field increases with the increase of
air mass flow rates. Thus, the increase of air velocity increases the surface of
interaction between the liquid and air which enhances the atomization. In the very
inner section of the water jet, a group of ligaments and large drops retain their
initial high velocity without too much interaction with the surrounding air. The
penetration distance of ligaments and large drops, in the cases of fixed liquid
injection pressure, depends on the initial air mass flow rates. Since the relative
velocity between water and air is kept the same for Figs. 8 to 14, the mass flow
rate of air is the only dominant factor that influences the quality of atomization.
More than 200 photographic observations show that the NASA air-assist atomizer
spray structure is very similar to that of diesel jet sprays which are being studied
separately at Carnegie Mellon University. The breakup processes occur periodically
and consist of a series of inverted "V" shape sprays. The liquid water is mostly
concentrated in the center of each inverted "V" group and becomes more dilute as
the "V" shape spreads out radially. Scattered satellite drops were found between
each inverted "V" group. This observation shows that the spray breakup is not a
continuous process but very oscillating. Measurements should be made with "long
enough" time so that a statistically representative result can be assured.
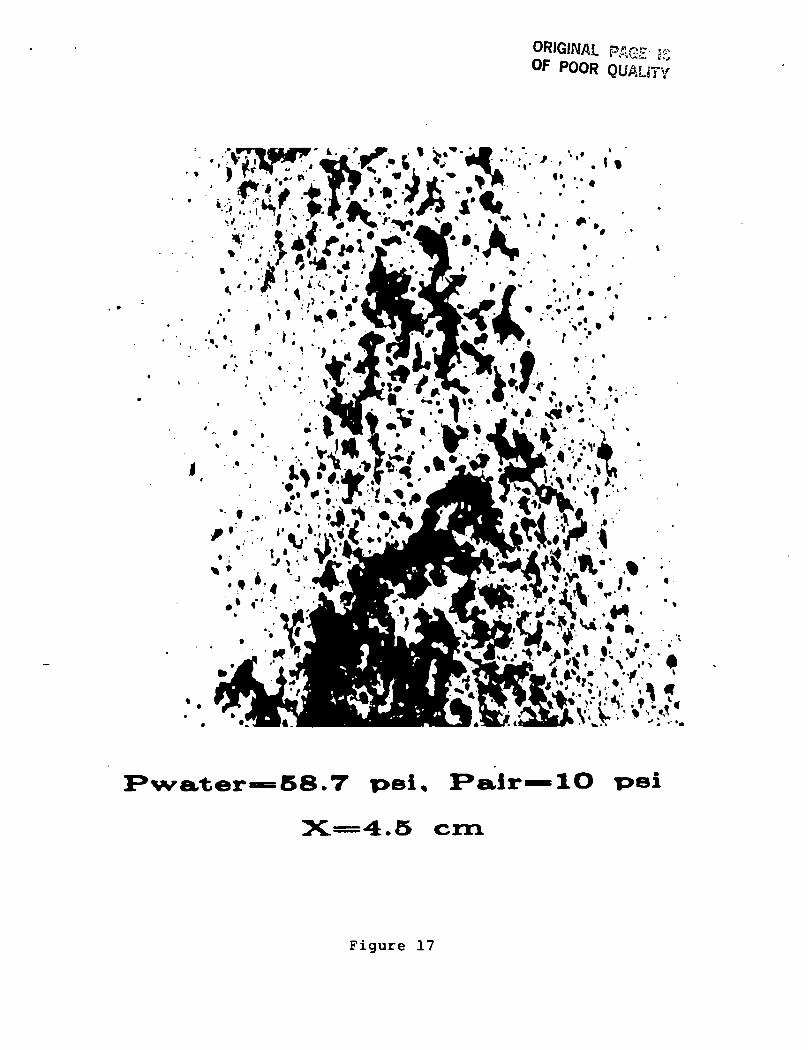
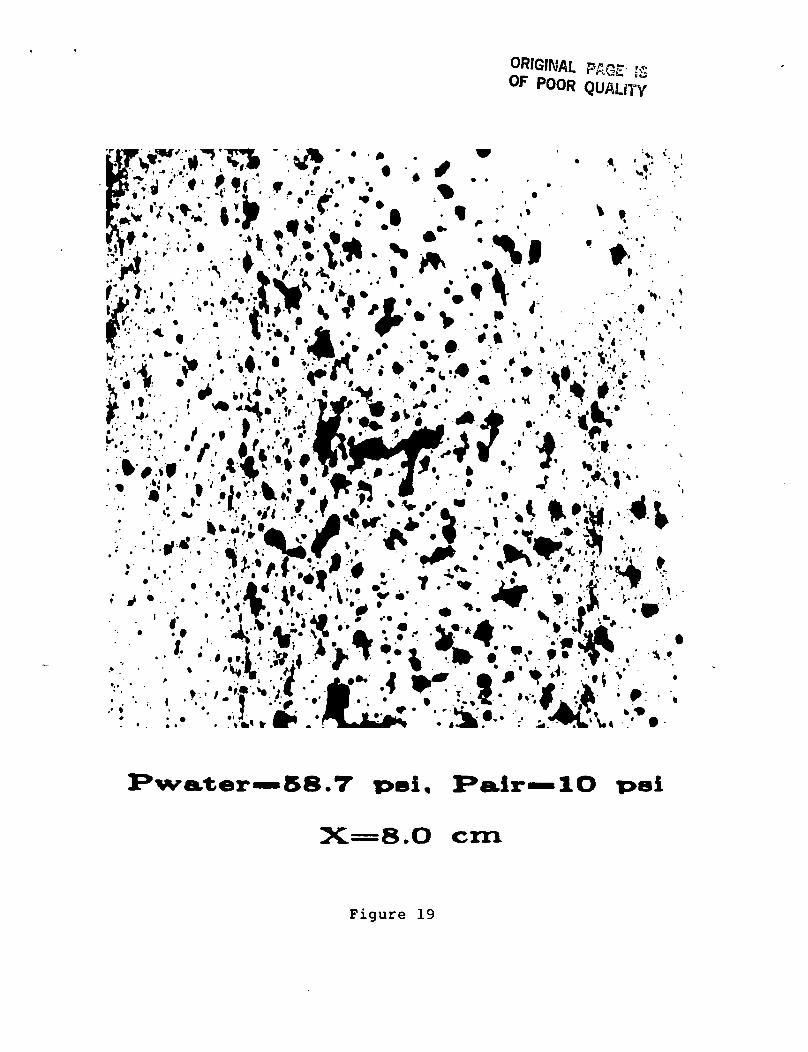
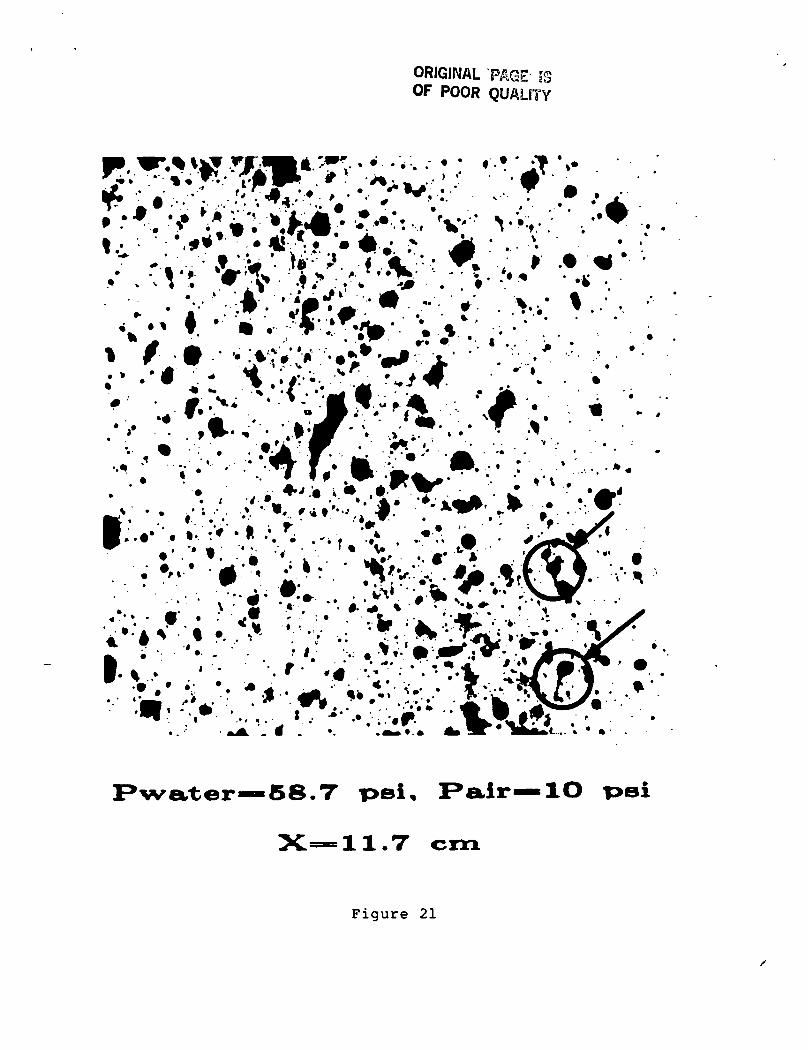
Figs. 15 to 20 show the close-up look of NASA air-assist atomizer sprays at
several centerline downstream locations at the condition of water injection 58.7 psi
and air injection 10 psi. The use of the 4x5 inch format camera with a 10 ft.
bellows allows us to visualize an area of 9x9 mm2 inside the sprays. These pictures
show much more detail about the breakup process and drop size distribution. Fig. 15
shows that the initial atomization starts at the periphery of the water jet. The shear
forces tear and shatter the water jet surface apart. The center core is so dense that
almost no light can penetrate. Fig. 17 shows that long ligaments are formed at x=4.5
cm downstream. The surface tension is struggling to rearrange the shape of the
ligaments. However, adverse pressure of air tends to further break down. The
process of atomization is actually slowed down with downstream distance because
of the quick deceleration of the air flows. The redistribution of drop size and drop
velocity at downstream stations causes collision between drops. In Fig. 21, a few
large drops are about to separate from the small drops after collision. The bridge
between them is the source of satellite drops after the breakup. The phenomenon of
drop collision has been studied by several researchers3'4 in the past. The effect of
collision on drop size distribution can be categorized into two groups: (1) drops
coalesce after collision , and (2) satellite drops are created after collision. The
former effect leads to an increase in the mean drop size and the latter effect leads
to a decrease in the mean drop size. The efficiency of collision depends on the
Weber number at the moment of collision. A two color phase doppler system
designed for measuring two components of drop velocity can be used to evaluate
the efficiency of collision at a local point by calculating the Weber number of size
bins. By observing these magnified pictures, a small number of large drops in the

size range from 300 //m to 500 pm diameter can be easily seen even at downstream
distance 13.5 cm where atomization is already completed. Comparisons between
photographs and data obtained from the laser diffraction particle sizer have shown
inconsistencies in drop size distribution, especially regarding the large drops in the
sprays. Further analysis of the photographic results using an automated digital
imaging system5 is necessary to provide long time statistical averaging drop size
information.
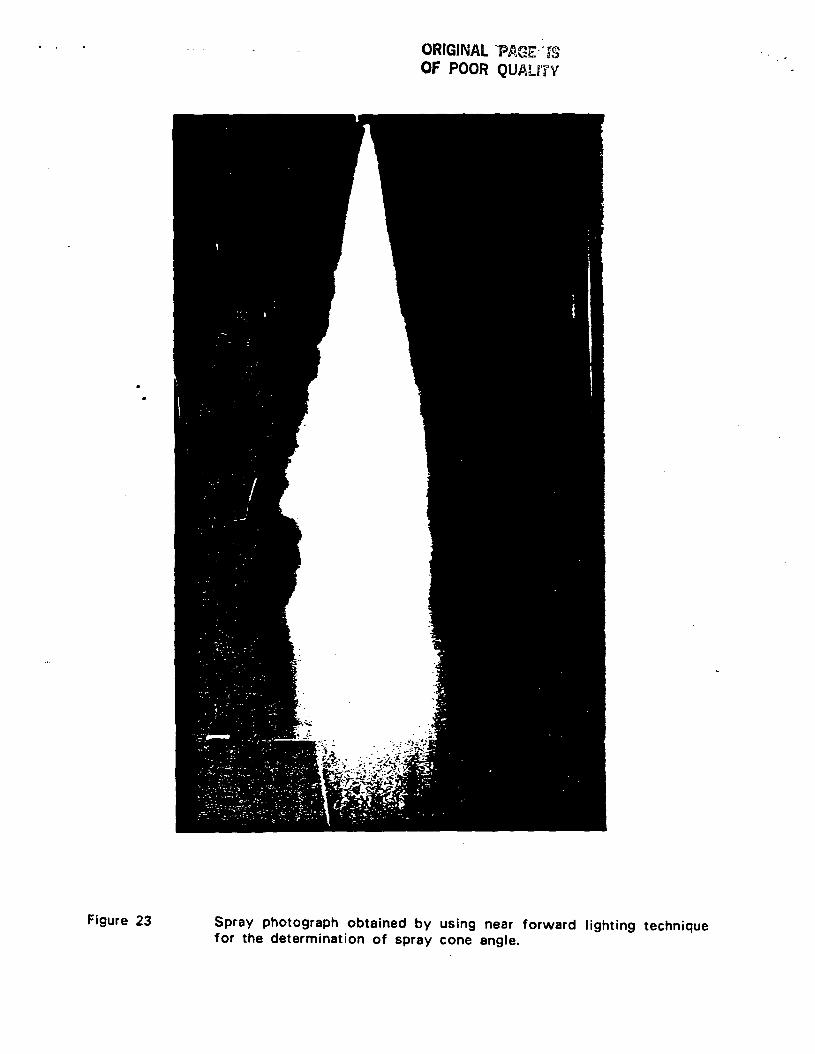
The spray cone angle is also measured using a near forward lighting technique.
All pictures were taken under the same optical setting and with the same films. The
camera was set at the f/11 aperture with a 1/125 second time exposure. A Kodak
Tri-X film was used to obtain high contrast pictures. The spray angle was measured
over a wide range of operating conditions. The water injection pressure was tested
from 35 psi to 325 psi and the air injection pressure was varied from 25 psi to 155
psi. There was no special trend found for the spray angle with respect to the
pressure variation. It actually oscillates with pressure. In general, the global spray
angle varies between 19° and 25°. The fine drops that surround the main water jet
affect the accurate determination of the spray boundary due to longer exposure time.
However, the angle of the inverted "V" shape in the flow field near the atomizer
varies with the mass flow rates of air (see Fig. 8 to 14). The higher the mass flow
rate of air, the wider the angle of the inverted "V" shape. Fig. 23 gives an example
of the picture obtained using the near forward lighting technique for the
determination of spray cone angle.
Downstream Drop Size Variation
Line-of-sight mean drop size measurements were first made using nozzle #100
at various downstream locations over a wide range of injection conditions. Since
the distance for complete breakup was quite long, the 4x5 format camera was used
to examine the first downstream measurement station. Fig. 24 shows the radial SMD
distribution at several downstream stations at P = 35 psi and P . = 25 psi for nozzlew air r
#100. The size distribution is found to be quite uniform across the sprays at all
locations. But, the mean drop sizes increase with the increase of downstream
distance. Fig. 25 shows the radial SMD distribution at several downstream stations
for P = 65 psi and P . = 25 psi. By comparing Fig. 25 with Fig. 24, the radial size
distribution is no longer uniform across the spray due to the increase of water
injection pressure. The maximum SMD peaks at a position slightly off the center
axis. A common feature for both cases is that the SMD increases gradually with the
downstream distance. Further increase of the water injection pressure increases the

non-uniformity of the radial size distribution. The symmetry of the size distribution
is also grsatly distorted at higher water injection conditions. Fig. 26 indicates the
shifting of the peak SMD position as a function of distance at P = 200 psi and P . =
25 psi. As can be seen, the mean drop size varies considerably across the sprays.
There is no single SMD that can be used to represent the entire spray. A judicious
decision has to be made for selecting appropriate values of SMD to fit existing
empirical correlation equations. Further details of drop size correlation will be given
in the next section.
In order to simulate the icing clouds in the wind tunnel, it is required that a
uniform drop size distribution be produced by the nozzle. Based on the
measurements made at many axial and radial stations over a wide range of injection
conditions on nozzle #100, it was found that the structure of NASA air-assist
atomizer sprays can be separated into two categories depending on the water/air
mass flow rate ratios. For a water/air mass flow rate ratio of less than 1, no
matter how high the injection pressures were, the radial mean drop size distribution
is rather uniform as seen in Fig. 24 and gradually increases with axial downstream
distance. For water/air mass flow rate ratio greater than 1, the radial mean drop size
distribution is nonuniform. It peaks at a position somewhere off the center axis.
The deviation of the peak SMD position from the center line increases with the
downstream distance. The characteristic of the NASA air-assist atomizer sprays of
not being symmetric as water/air mass flow rate ratios increases is not completely
due to the aerodynamic instability effect. It is partially due to the original tilting of
the water jet tube inside the nozzle. Nevertheless, the nonsymmetry of the spray is
not going to affect the evaluation and correlation of size distribution based upon
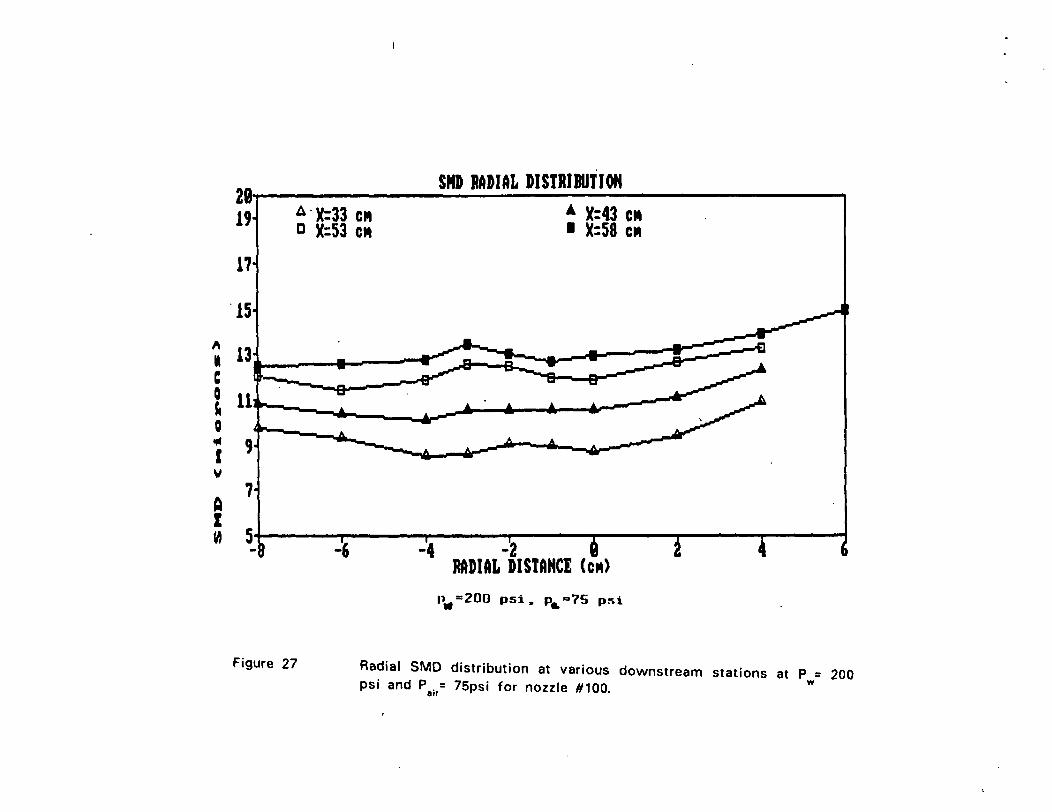
planar averaged drop size distribution at each axial station. Fig. 27 shows another
example of a uniform radial SMD distribution at high water injection pressure
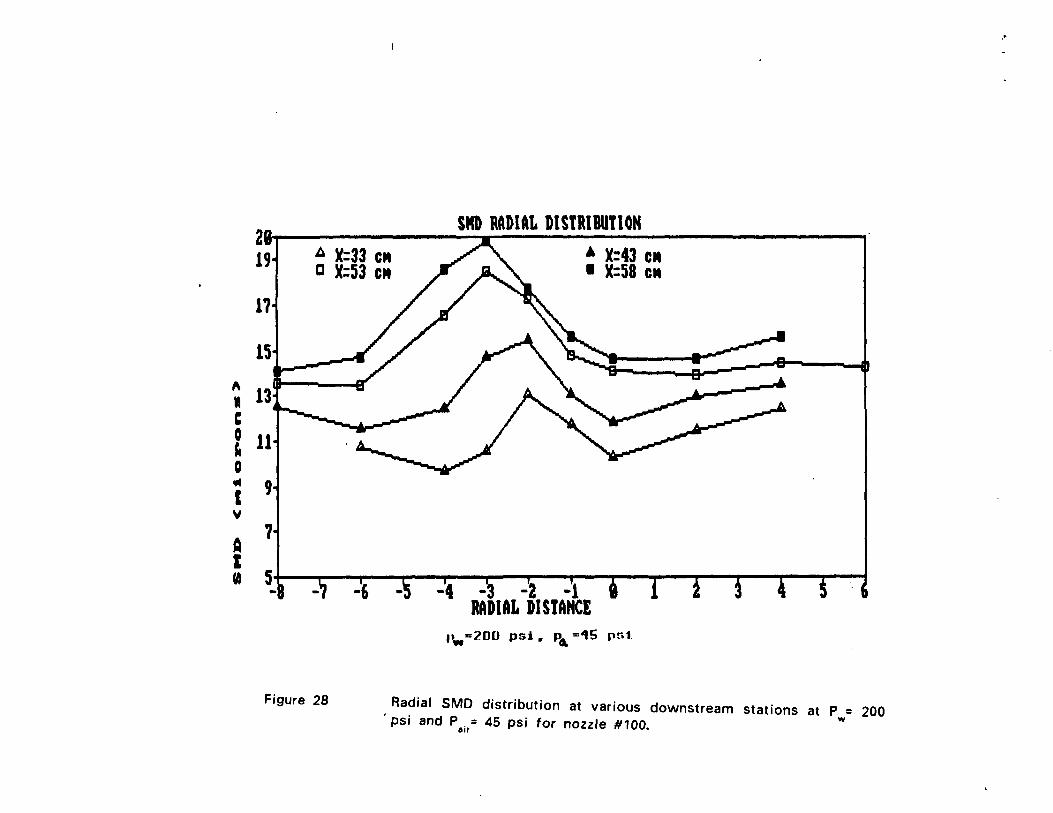
conditions for nozzle #100. The water/air mass flow rate ratio is close to 1. Fig. 28
indicates that the mean drop size is increasing along the downstream distance and
the size distribution is not very uniform across the sprays for water/air mass flow
rate ratios much greater than 1. For the purpose of simulating icing clouds, it is
therefore suggested that the operation of nozzle injection pressures be maintained at
the conditions of water/air mass flow rate ratios less than 1 so that uniform drop
size can be produced. Up to this point, all discussions have been based upon the
results obtained for NASA nozzle #100. From this point on, all of the tests were
conducted using NASA nozzle #2, and measurements were made for the injection
conditions that provide a water/air mass flow rate ratio less than 1. Nozzle #2 was
10
manufactured to high precision, and it is identical to other nozzles (Ref. 6) also being
tested by NASA Lewis Research Center.
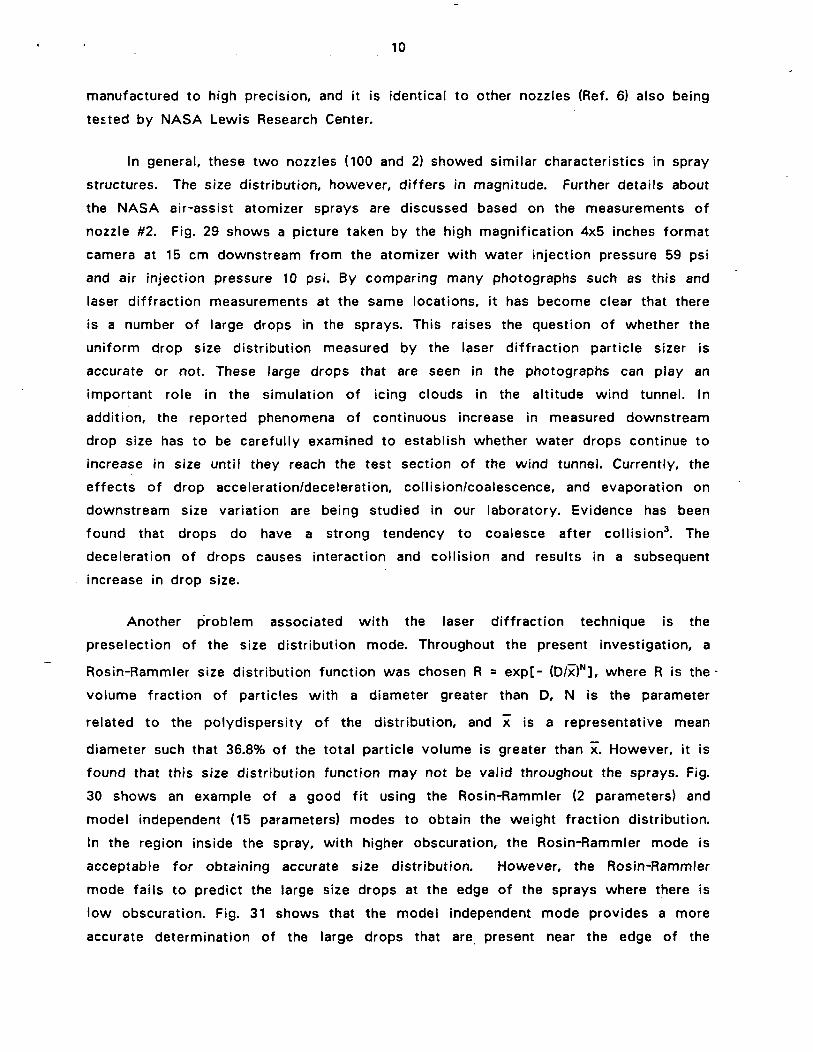
In general, these two nozzles (100 and 2) showed similar characteristics in spray
structures. The size distribution, however, differs in magnitude. Further details about
the NASA air-assist atomizer sprays are discussed based on the measurements of
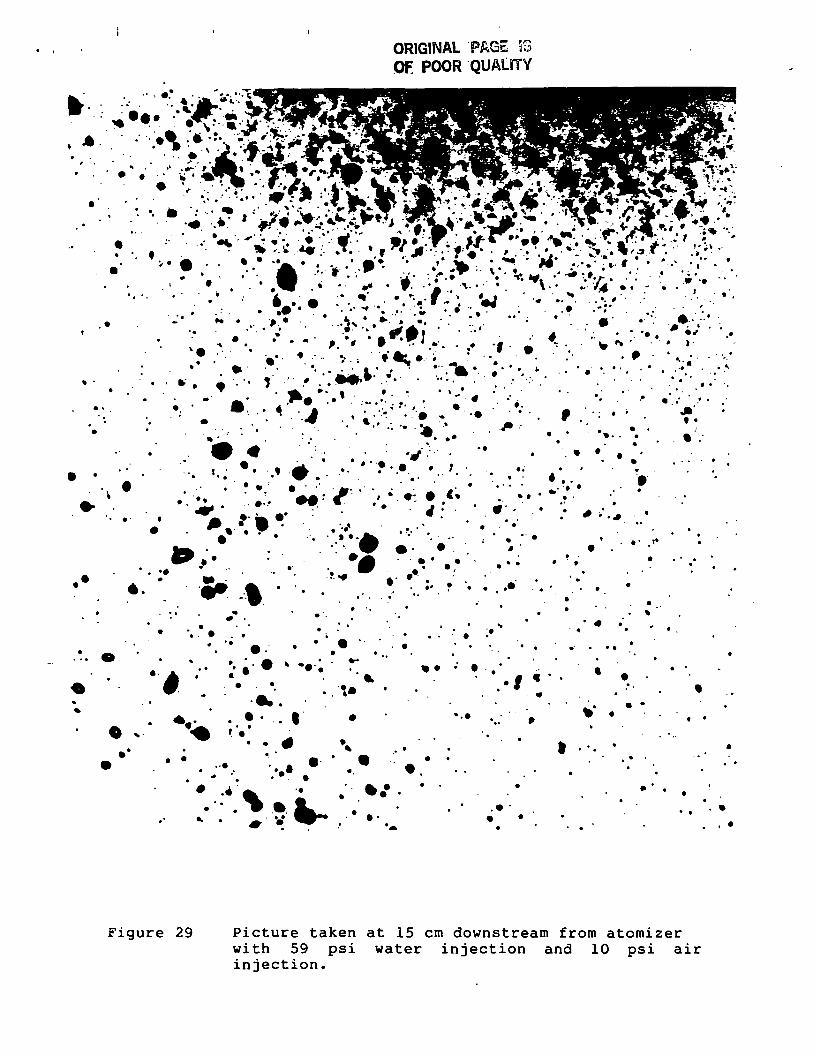
nozzle #2. Fig. 29 shows a picture taken by the high magnification 4x5 inches format
camera at 15 cm downstream from the atomizer with water injection pressure 59 psi
and air injection pressure 10 psi. By comparing many photographs such as this and
laser diffraction measurements at the same locations, it has become clear that there
is a number of large drops in the sprays. This raises the question of whether the
uniform drop size distribution measured by the laser diffraction particle sizer is
accurate or not. These large drops that are seen in the photographs can play an
important role in the simulation of icing clouds in the altitude wind tunnel. In
addition, the reported phenomena of continuous increase in measured downstream
drop size has to be carefully examined to establish whether water drops continue to
increase in size until they reach the test section of the wind tunnel. Currently, the
effects of drop acceleration/deceleration, collision/coalescence, and evaporation on
downstream size variation are being studied in our laboratory. Evidence has been
found that drops do have a strong tendency to coalesce after collision3. The
deceleration of drops causes interaction and collision and results in a subsequent
increase in drop size.
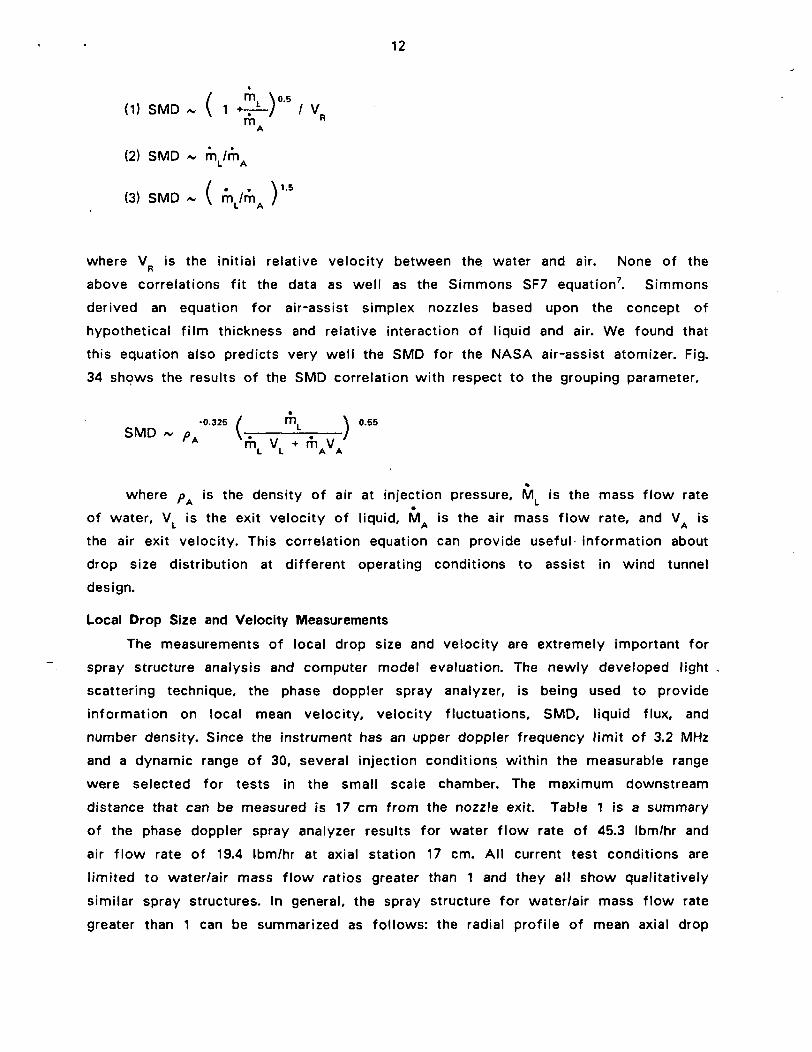
Another problem associated with the laser diffraction technique is the
preselection of the size distribution mode. Throughout the present investigation, a
Rosin-Rammler size distribution function was chosen R = exp[- {D/x)N], where R is the
volume fraction of particles with a diameter greater than D, N is the parameter
related to the polydispersity of the distribution, and x is a representative mean
diameter such that 36.8% of the total particle volume is greater than x. However, it is
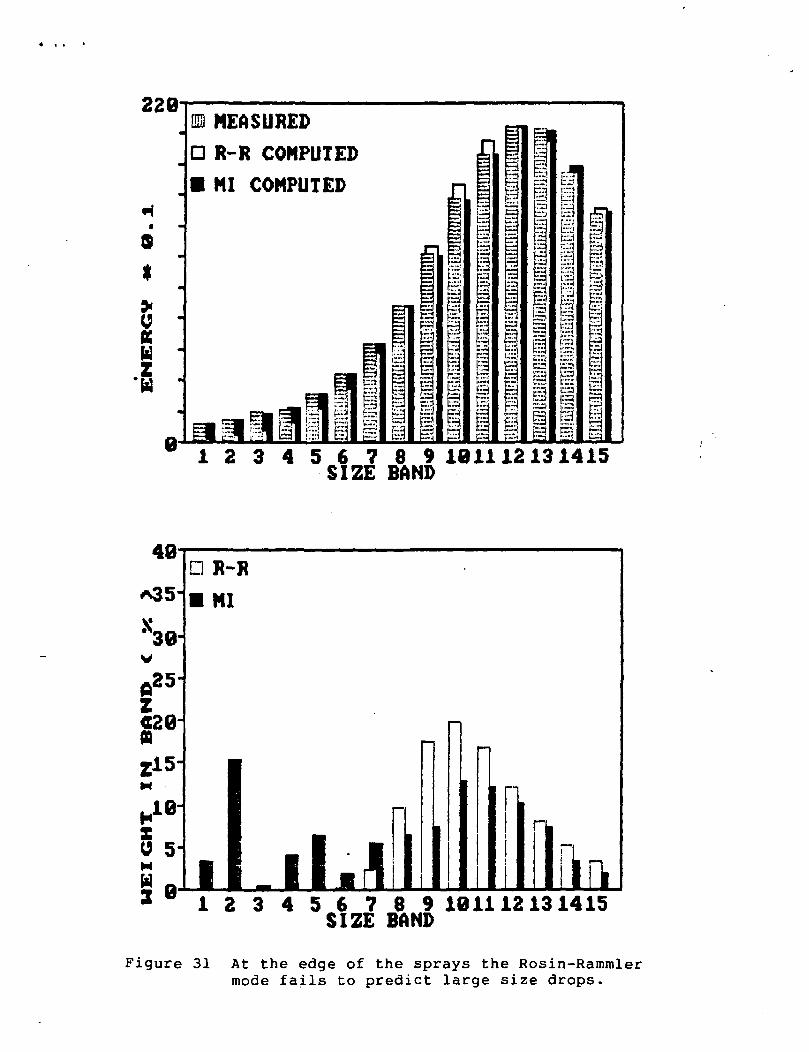
found that this size distribution function may not be valid throughout the sprays. Fig.
30 shows an example of a good fit using the Rosin-Rammler (2 parameters) and
model independent (15 parameters) modes to obtain the weight fraction distribution.
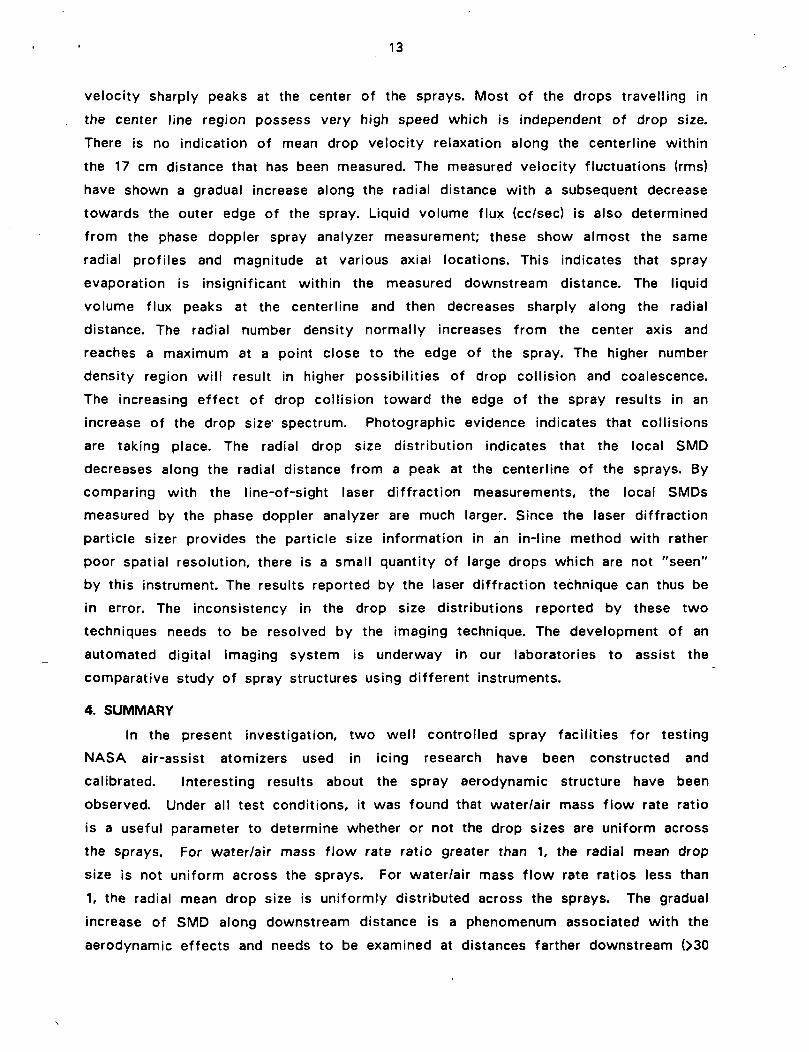
In the region inside the spray, with higher obscuration, the Rosin-Rammler mode is
acceptable for obtaining accurate size distribution. However, the Rosin-Rammler
mode fails to predict the large size drops at the edge of the sprays where there is
low obscuration. Fig. 31 shows that the model independent mode provides a more
accurate determination of the large drops that are present near the edge of the

11
sprays. In general, the Rosin-Rammler mode can be applied to most areas of the
NASA atomizer sprays except the region near the spray boundaries where the model
independent mode has to be used in order to get more accurate SMDs. However, it
was also noted that the Rosin-Rammler size distribution mode is not appropriate for
drop size calculations even at the center positions under extremely high water/air
mass flow rate ratios (>1).
Mean Drop Size Correlation
Empirical mean drop size correlation equations have been widely used for
describing the characteristics and structure of various types of atomizer sprays.
There is no universal equation that is suitable for all sprays. In the present study
for NASA air-assist atomizer sprays, drop size correlations as a function of initial
input parameters were determined based upon the line-of-sight laser diffraction
particle sizer measurements for nozzle #2. Since the drop size varies all over the
spray, it has been arbitrarily selected that all measurements be made at a fixed axial
location 25 inches downstream from the atomizer where complete atomization is
definitely achieved for all conditions. Fig. 32 shows the radial SMD distributions for
several different water injection pressures. The air injection pressure was kept the
same at 65 psi. All five test conditions were measured at the axial station 25
inches from the nozzle, and all water/air mass flow rates are less than 1. Although
all test conditions have uniform drop size distribution, a planar averaged SMD is
calculated from each local radial SMD across the spray by taking into account the
radial liquid volume concentration distribution. A plane averaged SMD is more
appropriate to represent the entire spray and to derive empirical correlation
equations. Fig. 33 is a summary of the variation of SMD with respect to differential
pressures (PW~P ir) for the NASA #2 nozzle. At fixed air injection pressures, the SMD
increases with the increase in water injection pressure. At fixed water injection
pressure the SMD decreases with the increase of air pressures. There is a more
significant increase in SMD by increasing water injection pressures at lower air
pressures. At the high air injection pressures, the increase of water pressure or flow
rates has no effect on mean drop size variation.
There are many published equations for the prediction of SMD of various types
of atomizers. Several data fit equations are considered based upon the
characteristics of the nozzle, physical process of atomization, and possible dominant
parameters of the injection fluid flows.
12
/ rn \o.s(1) SMD ~ V 1 *vt-/ /
m
(2) SMD ~ mL/mA
(3) SMD/ . . \I.B
~ \ mL/mA /
where VR is the initial relative velocity between the water and air. None of the
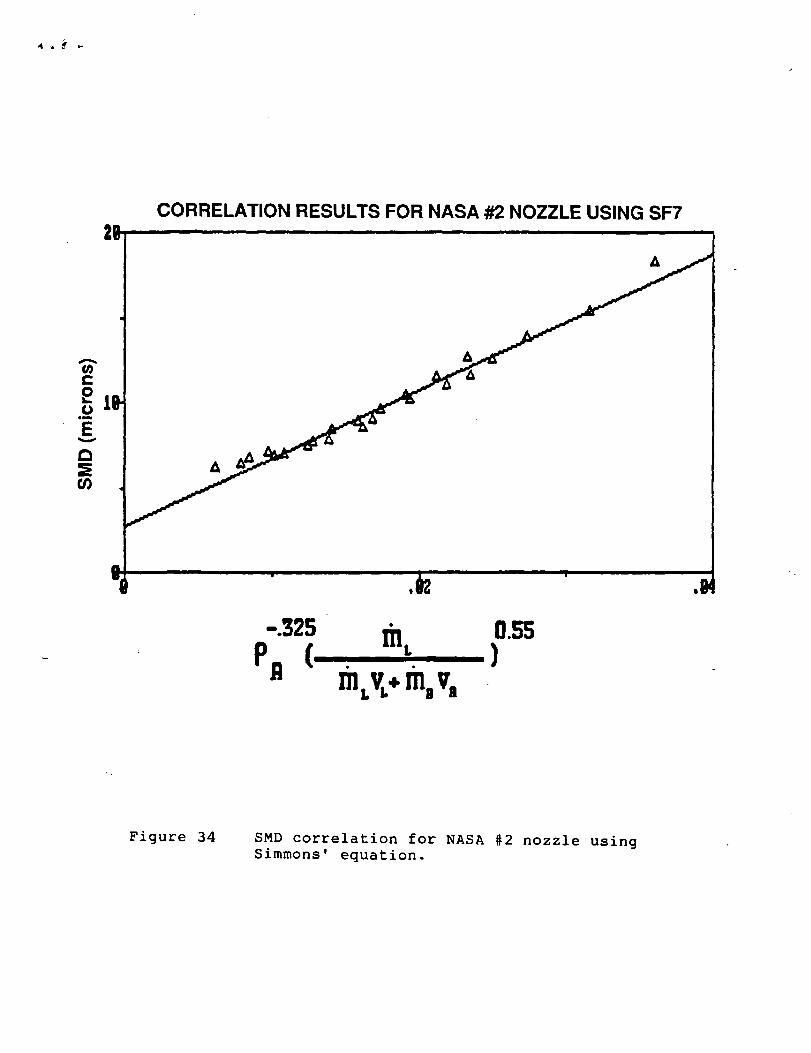
above correlations fit the data as well as the Simmons SF7 equation7. Simmons
derived an equation for air-assist simplex nozzles based upon the concept of
hypothetical film thickness and relative interaction of liquid and air. We found that
this equation also predicts very well the SMD for the NASA air-assist atomizer. Fig.
34 shows the results of the SMD correlation with respect to the grouping parameter,
-0.325 / m \ 0.55SMD ~ P \. L. ;mL VL + mAVA
*where />A is the density of air at injection pressure, ML is the mass flow rate•
of water, VL is the exit velocity of liquid, MA is the air mass flow rate, and VA is
the air exit velocity. This correlation equation can provide useful information about
drop size distribution at different operating conditions to assist in wind tunnel
design.
Local Drop Size and Velocity Measurements
The measurements of local drop size and velocity are extremely important for
spray structure analysis and computer model evaluation. The newly developed light
scattering technique, the phase doppler spray analyzer, is being used to provide
information on local mean velocity, velocity fluctuations, SMD, liquid flux, and
number density. Since the instrument has an upper doppler frequency limit of 3.2 MHz
and a dynamic range of 30, several injection conditions within the measurable range
were selected for tests in the small scale chamber. The maximum downstream
distance that can be measured is 17 cm from the nozzle exit. Table 1 is a summary
of the phase doppler spray analyzer results for water flow rate of 45.3 Ibm/hr and
air flow rate of 19.4 Ibm/hr at axial station 17 cm. All current test conditions are
limited to water/air mass flow ratios greater than 1 and they all show qualitatively
similar spray structures. In general, the spray structure for water/air mass flow rate
greater than 1 can be summarized as follows: the radial profile of mean axial drop
13
velocity sharply peaks at the center of the sprays. Most of the drops travelling in
the center line region possess very high speed which is independent of drop size.
There is no indication of mean drop velocity relaxation along the centerline within
the 17 cm distance that has been measured. The measured velocity fluctuations (rms)
have shown a gradual increase along the radial distance with a subsequent decrease
towards the outer edge of the spray. Liquid volume flux (cc/sec) is also determined
from the phase doppler spray analyzer measurement; these show almost the same
radial profiles and magnitude at various axial locations. This indicates that spray
evaporation is insignificant within the measured downstream distance. The liquid
volume flux peaks at the centerline and then decreases sharply along the radial
distance. The radial number density normally increases from the center axis and
reaches a maximum at a point close to the edge of the spray. The higher number
density region will result in higher possibilities of drop collision and coalescence.
The increasing effect of drop collision toward the edge of the spray results in an
increase of the drop size' spectrum. Photographic evidence indicates that collisions
are taking place. The radial drop size distribution indicates that the local SMD
decreases along the radial distance from a peak at the centerline of the sprays. By
comparing with the line-of-sight laser diffraction measurements, the local SMDs
measured by the phase doppler analyzer are much larger. Since the laser diffraction
particle sizer provides the particle size information in an in-line method with rather
poor spatial resolution, there is a small quantity of large drops which are not "seen"
by this instrument. The results reported by the laser diffraction technique can thus be
in error. The inconsistency in the drop size distributions reported by these two
techniques needs to be resolved by the imaging technique. The development of an
automated digital imaging system is underway in our laboratories to assist the
comparative study of spray structures using different instruments.
4. SUMMARY
In the present investigation, two well controlled spray facilities for testing
NASA air-assist atomizers used in icing research have been constructed and
calibrated. Interesting results about the spray aerodynamic structure have been
observed. Under all test conditions, it was found that water/air mass flow rate ratio
is a useful parameter to determine whether or not the drop sizes are uniform across
the sprays. For water/air mass flow rate ratio greater than 1, the radial mean drop
size is not uniform across the sprays. For water/air mass flow rate ratios less than
1, the radial mean drop size is uniformly distributed across the sprays. The gradual
increase of SMD along downstream distance is a phenomenum associated with the
aerodynamic effects and needs to be examined at distances farther downstream (>30

14
inches from atomizer). Drop deceleration and collision are the main factors causing
SMD to increase along downstream distance. Simmons7 drop size correlation
equation was found to be suitable for predicting the SMD's for NASA air-assist
atomizers over a wide range of injection conditions.
Comparisons between laser diffraction and photographic measurements are
leading us to believe that the small area of the inner diodes, the threshold sensitivity
of the diodes, and the relatively small number of large drops are resulting in
insensitivity of the laser diffraction technique to the presence of the larger drops.
For this reason, the laser diffraction instrument reports much smaller mean drop
sizes at various locations than those measured by photography. However, it also
needs to be pointed out that the photographic results are also neglecting a very large
quantity of small drops. True "ultimate" SMD is unable to be measured by any of
these two techniques.
A newly developed drop sizing instrument, phase doppler spray analyzer, was
successfully applied to measure high speed flows in NASA atomizer sprays. Useful
information such as drop velocities, liquid fluxes, drop number density, and SMD for
spray analysis was obtained for several low injection pressure conditions. Our
present processor for the phase doppler analyzer has an upper doppler frequency
limit which restricts the measurements to sprays with lower speed flows. For future
work, the phase doppler will be modified to use optical frequency shifting such that
the doppler frequency of the scattered light signals are optically downshifted within
the operating range of the processor. By applying frequency shifting to our present
processor, drop velocity up to 300 m/sec can be measured. A two color phase
doppler system is also under consideration for making two-component velocity
measurements simultaneously. With two-component velocity information, it is
possible to determine drop trajectories and to evaluate the effect of drop collision in
the sprays. We also intend to use the control of detector voltage, threshold, and
high and low pass filtering of the processor for closer examination of the larger
drops. Using the concept of a spectrometer with a narrow band width, we can
progressively tune in to sections of the size distribution spectrum and obtain more
information about certain size ranges with less interference by not processing
particles outside the size range of interest. In this way, we can make a more
meaningful comparative study between the photographic and phase doppler results.
15
REFERENCES
1. Bachalo, W.D. and Houser, M.J., "Phase Doppler Spray Analyzer forSimultaneous Measurements of Drop Size and Velocity Distributions,"Optical Engineering, Vol. 23, No. 5, pp. 583-590. 1984.
2. Nukiyama, S. and Tanasawa, Y., "Experiments on the Atomization ofLiquids in an Airstream", Trans. Soc. Mech. Eng. Japan, Vol. 5, pp. 68-75,I939.
3. Brazier,P.R. et. al, "The Interaction of Falling Water Drops: Coalescence,"Proc. R. Soc. Lond., A. 326. pp. 393-408, 1972.
4. Podvysotsky, A.M. and Shraiber, A.A., "Coalescence and Break-Up of Dropsin Two-Phase Flows", Int. J. Multiphase Flow, Vol. 10, No. 2, pp. 195-209.1984.
5. Ahlers, K.D. and Alexander, D.R.. "A Microcomputer-Based Digital ImageProcessing System Developed to Count and Size Laser-Generated SmallParticle Images," Optical Engineering, In Press, 1985.
6. Tacina, B., NASA Lewis Research Center, Private Communication, 1985.
7. Simmons, H.C., "The Prediction of Sauter Mean Diameter for Gas TurbineFuel Nozzles of Different Types," ASME Paper no. 79-WA/GT-5, 1979.

TABLE 1
A Summary of Phase/Doppler Results for Water injection 45.3 Ibm/hr and Air Injection 19.4 Ibm/hr
Left Hand Side Right Hand SideRadialPosition 2.5 2 1.5 1 0.5 0 0.5 1 1.5 2 2.5r(cm)
MeanVelocity 1.36 4.4 8.9 15.4 28.7 41.2 39.8 20.9 10.9 6.8 3.9(m/sec)
VelocityFluctuation 0.85 2.5 4.6 5.9 7.5 4.6 6.4 7.4 5.3 3.2 2.1(m/sec)
| • VOX * _Q fj _g g f _ ̂| f _ g g _^ M
Flux 7.6x10"° 5.9x10"' 3.3x10"° 9.0xlO~° 1.8xlO~D 1.8xlO~* 8.2xlO~3 7.9xlO~° 2.6xlO~° 1.3x10"° 3.0x10"'
(cc/sec)
NumberDensity 79 117 120 164 77 58 67 128 216 232 112(l/cc)
TemporalSMD 28 34 46 49 62 131 92 50 34 30 28(um)
Hater/Air Mass Flovrate Ratio: 2.34/ x = 17 cm

FLOWSTRAIGHTENE
ENTRY PORT
NOZZLE
WINDOW
EXIT PORT
SPRAY CHAMBER
Figure 1 Schematic of the small scale spray chamber.
4"x5" ViewCamera \ ' «
ViewingfWindows
SheetMetal
Secondary AirIntake Shroudand FlowStraighteners
Floor Level
—v\Air Exhaust \ \to Blowerer }
CatchTank
fr
Figure 2 Schematic of the large scale spray chamber.

\Y\i i.\\\\\
Air
Figure 3 Cross-sectional view of NASA air-assist atomizer.
WATER VOLUME FLOW RATE CALIBRATION
- NASA NOZZLE ftl (ref,6)
60 80 100 li0 S0DIFFERENTIAL PRESSURE (psid)
200
Figure 4 Water volume flow rates versus pressure difference between waterand air (P - P ) at atomizer exit.
w a
150AIR MASS FLOW RATE CALIBRATION CURVE
- NO WATER INJECTION
• WITH WATER INJECTION
AIR PRESSURE (psig)
Figure 5 Air mass flow rates versus air injection pressure for nozzle #100.

AIR MASS FLOW RATE CALIBRATION CURVE
- NO WATER INJECTION
AIR PRESSURE (psig)
Figure 6 Air mass flow rate versus air injection pressure for nozzle #2.

126
Figure 7
A.ir

T>S1,
Figure 8
T>e
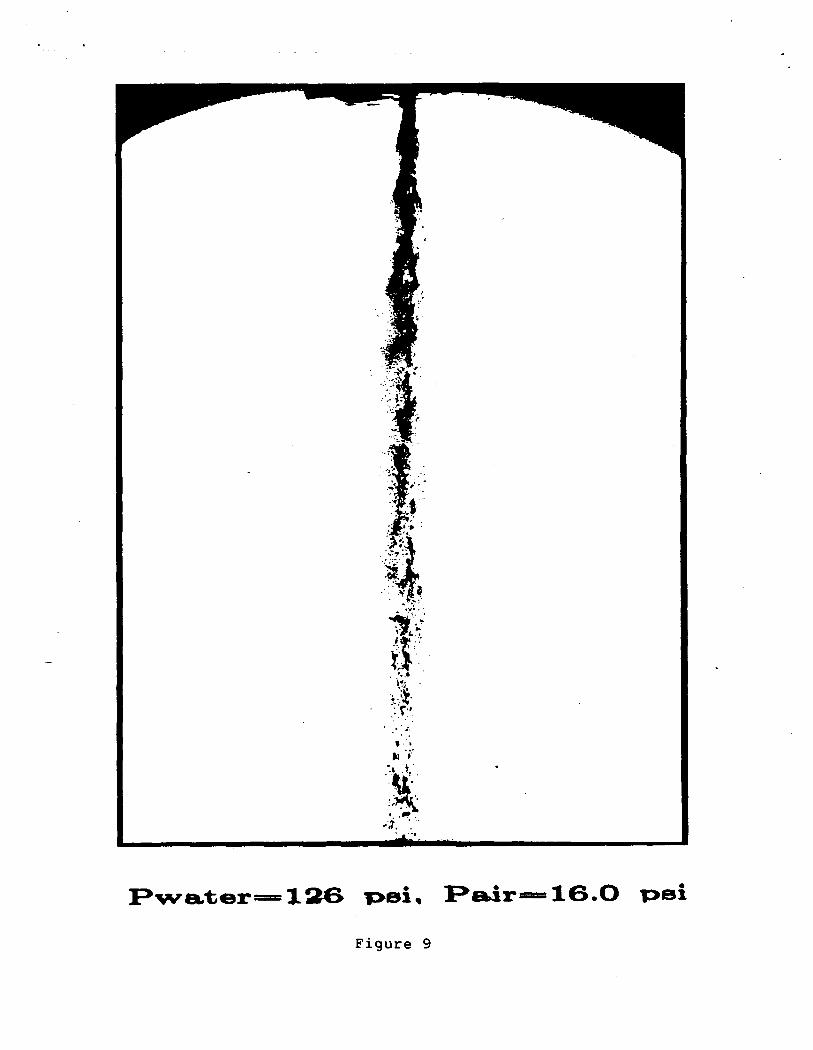
F>air=16.O
Figure 9

26.6 T>©i
Figure 10
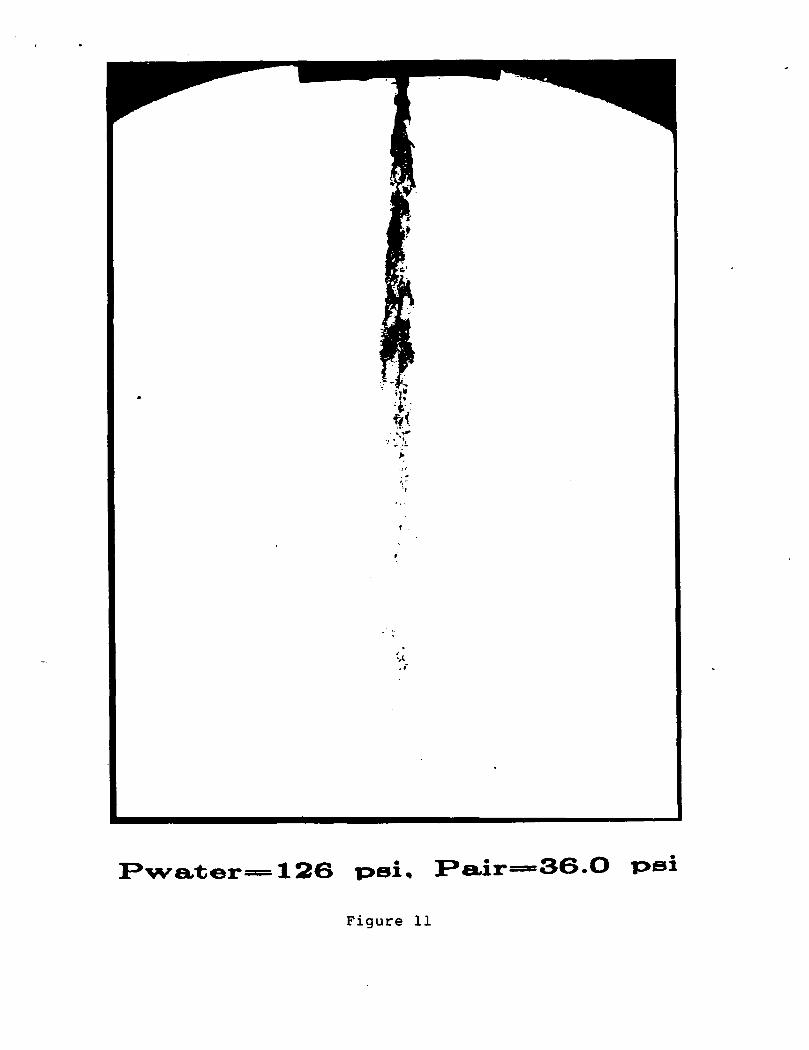
F>wetter—126 p>ei, Pair=36.O T>ei
Figure 11

126 T>e
Figure 12
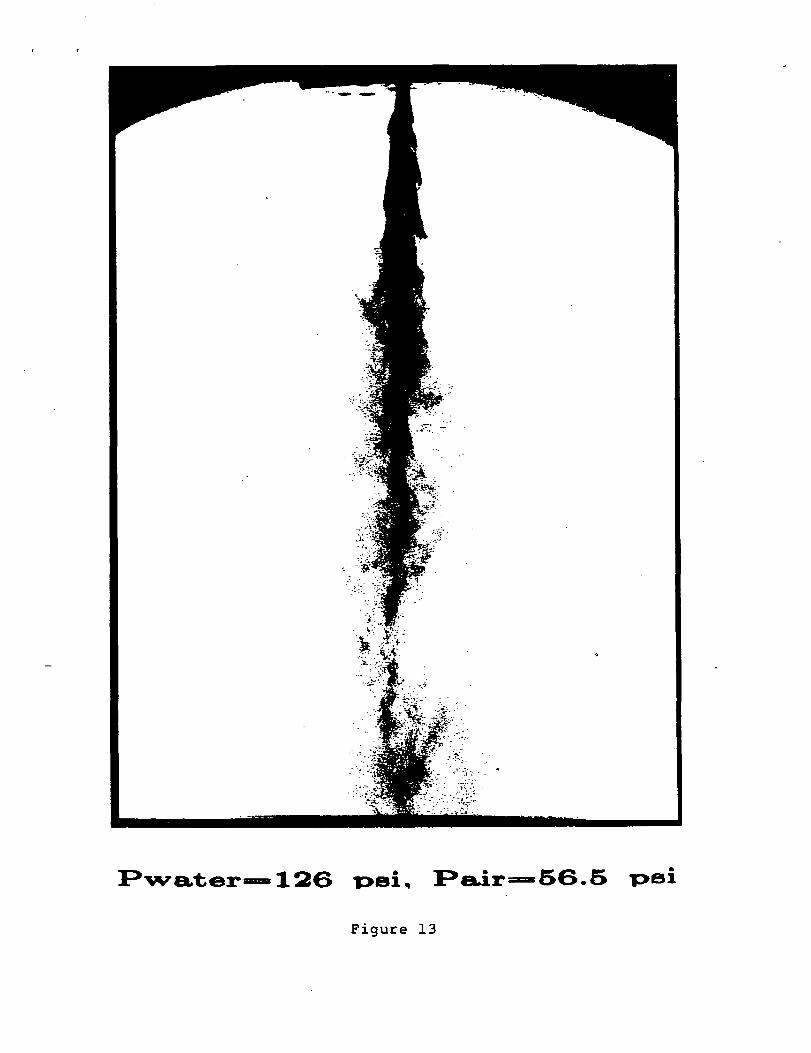
F* wetter ==126 T>ei, F>etir=56.5 T>ei
Figure 13

F> wetter =126 T>ei, :Pctir=6T.8
Figure 14

.T T>ei, — 1O T>ei
cm
Figure 15

1O T>ei
cm
Figure 16
ORIGINAL PAGF pOF POOR QUALITY
£HNVV . .i?wv>;
13 wetter—=58. T ^ T>s
cm
Figure 17

I % . f-.. .*. ; -
,r—58.7 T>ei, I>»ir—1O T>ei
>L=6.3 cm
Figure 18
ORIGINAL PAG" rS
OF POOR QUALITY
«&•*; *• .• • •
£•-•'• +':*X-f**\ i{ • ' ; • • • • 1» •• f ^
v> t • • ' . - •*•*•.-*.•
T ¥>Bi,
X=8.O cm
Figure 19

—58.7 T>si, Pair—1O T>si
1O.O cm
Figure 20
ORIGINAL PAGE ISOF POOR QUALITY
•
T T>ei, — 1O T>ei
11.T cm
Figure 21

:Pwetter—58.T T>ei, Fair—1O T>si
X=13.5 cm
Figure 22
ORIGINAL TAGS BOF POOR QUAU7Y
Figure 23 Spray photograph obtained by using near forward lighting techniquefor the determination of spray cone angle.

SHD RADIAL DISTRIBUTION
X=43 CM• X-58 CN
•4 -3 -2 -1RADIAL DISTANCE (en)
pi-35 psi. R.-25 psi
Figure 24 Radial SMD distribution at various downstream stations at P = 35psi and Psjr= 25 psi for nozzle #100.

SMD RADIAL DISTRIBUTION
19-18171615:1
* X=28 CND X=38 CNo X:48 CN
X=33 CNX=43 CN
•3 -2 -i 4 rRADIAL DISTANCE (CN)
l» =*6S psi, p.-25 p:>i
4
Figure 25 Radial SMD distribution at various downstream stations at PW= 65psi and P jf= 25 psi for nozzle #100.

SMD RADIAL DISTRIBUTION
X:33 CNo X--53 CN
•4 -2 6RADIAL DISTANCE (CN)
psi
Figure 26 Radial SMD distribution at various downstream stations at P = 200psi and Pajr= 25 psi for nozzle #100.
-8
SHD RADIAL DISTRIBUTION
-4 -2RADIAL DISTANCE (CN)
4
psi, psi
Figure 27 Radial SMD distribution at various downstream stations at P = 200psi and P^.* 75psi for nozzle #100. w
SMD RADIAL DISTRIBUTION
4 <- - -1 *RADIAL DISTANCE
1 4 J 4 J
psi, pr.i
Figure 28 Radial SMD distribution at various downstream stations at Ppsi and P^ 45 psi for nozzle #100.
200
ORIGINAL PAGE S3OF POOR QUALITY
•«. '-.r''
•«̂ • • . i • *•.* •
• .4y?k~;-v. , •
Figure 29 Picture taken at 15 cm downstream from atomizerwith 59 psi water injection and 10 psi airinjection.

220
H•
0
*
BW
W
8
m NEASURED
D R-R CONFUTED
• NI CONFUTED
Iri1
a
S-
ea
1i
c."
El
S3
3
3̂
sI
m@
EJ
ea:'}
1 2 3 4 5 6 7 8 9 101112131415SIZE BAND
40
A30-
P
C28-W
D R-R
• NI
1 2 3 4 5 6 7 8 9 101112131415SIZE BAND
Figure 30 An example of a "good Fit" in predicting sizedistribution using the Rosin-Rammler mode.
229019 MEASURED
D R-R COMPUTED
• MI COMPUTED
1 2 3 4 5 6 7 8 9 101112131415SIZE BAND
48
a
0 5-
D R-R
• HI
I1 2 3 4 5 6 7 8 9 101112131415
SIZE BAND
Figure 31 At the edge of the sprays the Rosin-Rammlermode fails to predict large size drops.

20SND RADIAL DISTRIBUTION
18-
16-
o Pn=115psi
o Pn=U5psi
- 4 - 2 0 2 4RADIAL DISTANCE (CM)
Figure 32at d'StribUti°" H
3t Various differential pressures for nozzleat Pa.r- 65 psi and downstream location x=25 inches.
•

24
22
18
16
14
12
8
Pair=25psiPair=ll5psi
Pair=45psiPair=85psiPair=155psi
IB 28 38 40 SB 6 0 7 0DIFFERENTIAL PRESSURE (psU)
Figure 33 The variation of plane averaged SMD versusdifferential pressures (P - P . ) for NASA #2air-assist nozzle. w air
f -
CORRELATION RESULTS FOR NASA #2 NOZZLE USING SF7
(0c
D
CO
-.325p.<- m..94
0.55)
Figure 34 SMD correlation for NASA #2 nozzle usingSimmons' equation.