measurements in the sky jørn t. brunsell, ph.d. head of department norwegian building research...
TRANSCRIPT

Measurements in the sky
Jørn T. Brunsell, Ph.D.Head of Department
Norwegian Building Research Institute

BackgroundPerceived concern about health and safety of passengers
and crew:•High levels of CO2 and other pollutants•Low relative humidity•Transmission of infectious disease
EU’s 5th Framework, Key Action 4 ” New perspectives in aeronautics”:
•Develop solutions for an improved cabin environment• Improve aircraft fuel efficiency
CabinAir Project

Measurements in the sky - objectives
Develop an innovative methodology for monitoring cabin air quality
Comprehensive investigation of indoor air quality in aircraft cabins
Input to technology development activities in the CabinAir project
Identify parameters appropriate to the development of standards

Results of ”Measurements in the
sky” Monitoring results
• Cabin thermal comfort• Contaminants
Crew questionnaire results• Changes in symptom intensity during
flight • Assessment of cabin environment

Measurement program 50 flights Three airlines: BA, KLM, SAS Three monitoring teams: BRE, TNO,
NBI Four generic aircraft types
• Short narrow body• Long narrow body• Twin aisle• Double deck

Stationary ’Mannequin’ measurements
Air and globe temperature
Air velocity CO2
Relative Humidity, RH
Ozone CO

Mobile measurements
Air velocity Temperatur
e VOCs Micro-
biologicals Particles CO2

Cabin comfort - temperatures
Aircraft Group
Place Phase Temperaturesn Mean Min Max
1 Economy Ground 4 24.8 23.6 25.7
Cruise 4 24.0 23.1 24.8
Business Ground 4 23.7 22.0 24.8
Cruise 4 24.3 23.9 24.7
2 Economy Ground 6 23.5 17.8 27.4
Cruise 6 23.8 20.9 25.8
Business Ground 6 23.1 17.7 26.0
Cruise 6 23.7 22.4 25.4
3 Economy Ground 18 22.5 17.9 26.5
Cruise 18 22.5 19.3 23.5
Business Ground 18 22.4 20.4 25.4
Cruise 18 22.3 20.2 23.4
4 Economy Ground 7 25.6 22.5 29.9
Cruise 7 24.2 22.3 27.5
Business Ground 7 23.4 22.3 25.7
Cruise 7 24.0 22.5 24.8

Horizontal temperature differences
5 flights with horizontal temp. difference > 3°C for more than 100 minutes (between different cabin climate zones).
1 flight: Average temp. at economy class 5.5°C above zone set-point for 11.5 hours.
Temperature anomalies can be quite localised
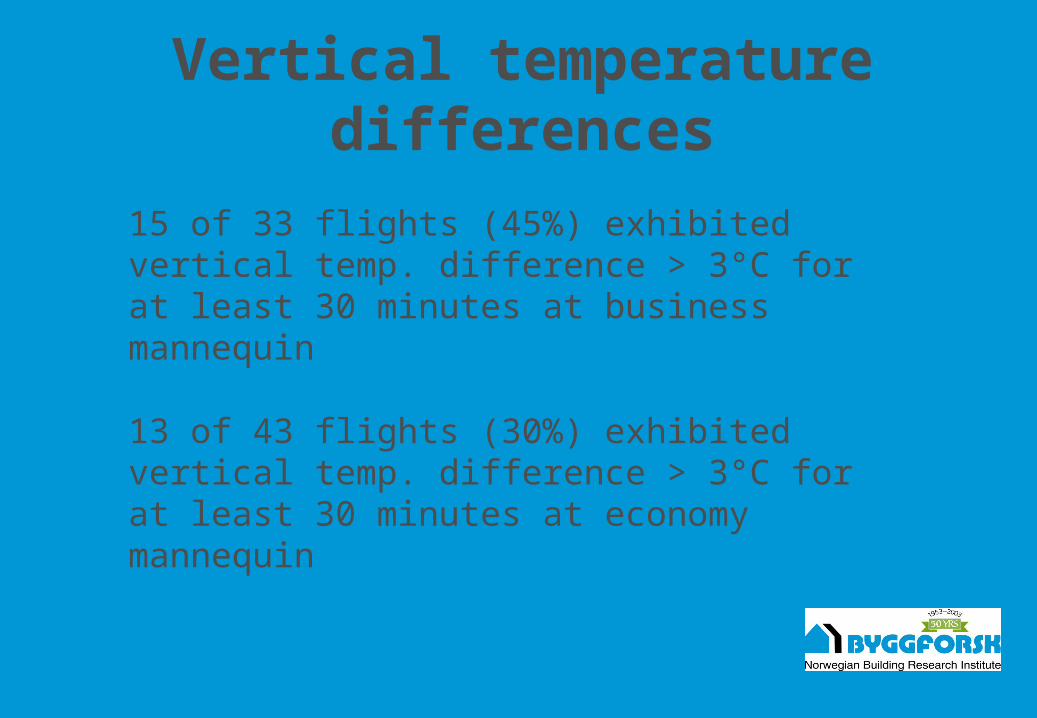
Vertical temperature differences
15 of 33 flights (45%) exhibited vertical temp. difference > 3°C for at least 30 minutes at business mannequin
13 of 43 flights (30%) exhibited vertical temp. difference > 3°C for at least 30 minutes at economy mannequin

Cabin comfort – air velocity
Aircraft Group
Place Phase Air velocityn Mean Min Max
1 Economy Ground 4 0.1 0.1 0.2
Cruise 4 0.1 0.1 0.1
Business Ground 4 0.1 0.1 0.2
Cruise 4 0.1 0.1 0.2
2 Economy Ground 4 0.1 0.1 0.1
Cruise 4 0.2 0.1 0.2
Business Ground 2 0.1 0.1 0.1
Cruise 2 0.1 0.1 0.1
3 Economy Ground 16 0.2 0.1 1.1
Cruise 16 0.2 0.1 0.5
Business Ground 15 0.2 0.1 0.4
Cruise 15 0.2 0.1 0.3
4 Economy Ground 7 0.3 0.1 1.0
Cruise 7 0.2 0.1 0.4
Business Ground 7 0.2 0.1 0.9
Cruise 7 0.1 0.0 0.3

Air velocity
Same areas on same aircraft exhibited high air velocities
Worst cases: air velocity > 1 m/s for more than an hour at two seats on one aircraft type.
Draught conditions can be quite localised

Cabin thermal comfort – relative humidity
RH < 30% for 97% of time after take-off
On all long haul flights RH dropped below 10% except for one flight (In highest passenger density area of economy class)

Cabin air quality – CO2
Aircraft Group
Place Phase Carbon dioxide concentrationn Mean Min Max
1 Economy Ground 4 1575 1068 2035
Cruise 4 1194 765 1788
Business Ground 4 920 526 1190
Cruise 2 849 836 861
2 Economy Ground 13 1481 829 2565
Cruise 11 1193 704 1467
Business Ground 7 1624 1233 2626
Cruise 7 1342 912 1756
3 Economy Ground 17 1061 674 1654
Cruise 17 1123 679 1554
Business Ground 18 978 608 1454
Cruise 18 965 598 1357
4 Economy Ground 6 1264 1077 1458
Cruise 6 1035 685 1377
Business Ground 7 994 752 1359
Cruise 7 779 583 926

Cabin air quality – carbon dioxide
CO2 concentration > 2000 ppm gate-to-gate and cruise:• Economy class: Gate to gate: 1.5%, Cruise: 0.1%• Business class: Gate to gate: 0.5%, Cruise: 0%
300-400 ppm difference between highest density area of economy class and business class on some flights
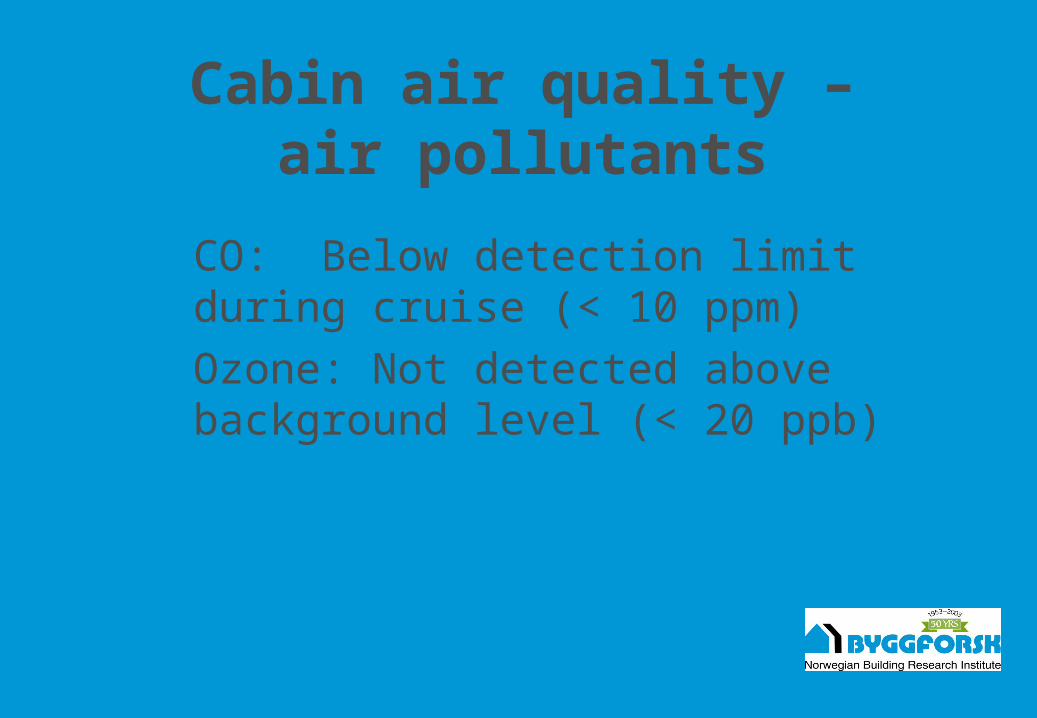
Cabin air quality – air pollutants
CO: Below detection limit during cruise (< 10 ppm)
Ozone: Not detected above background level (< 20 ppb)

Cabin air quality – Volatile Organic
Compounds (VOC) VOC concentrations comparable to
other indoor environments on ground Benzene < 0.5 µg/m3
Limonene : 10 - 50 µg/m3
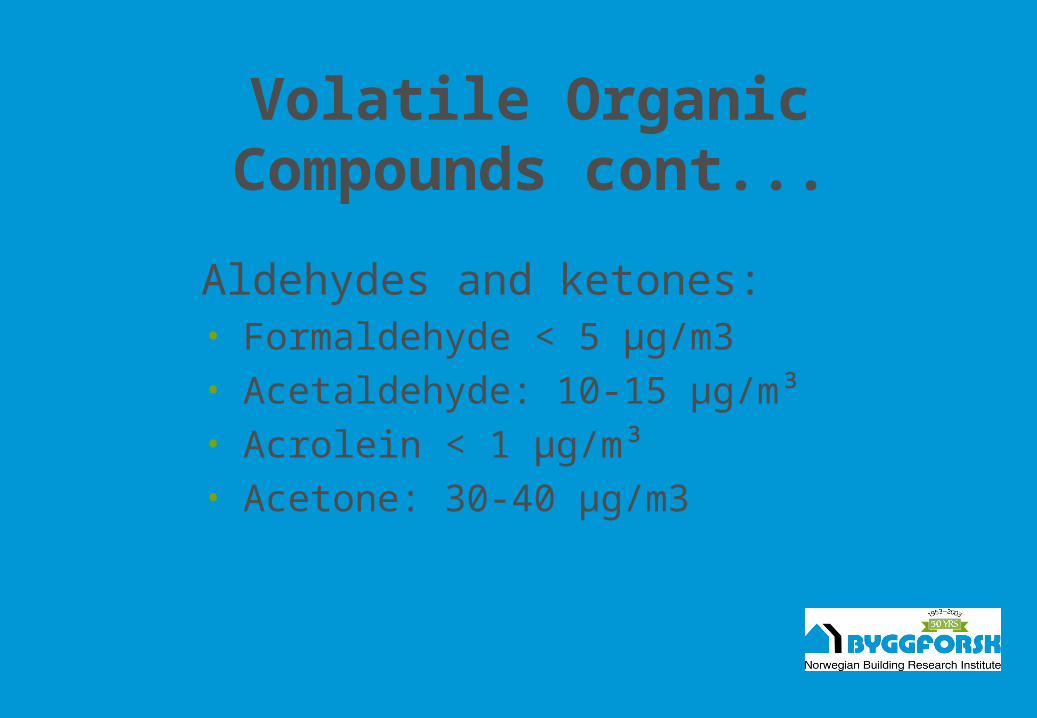
Volatile Organic Compounds cont...
Aldehydes and ketones: • Formaldehyde < 5 µg/m3 • Acetaldehyde: 10-15 µg/m³• Acrolein < 1 µg/m³• Acetone: 30-40 µg/m3

Cabin air quality - SVOC
SVOC: measured only in cabin, not bleed air • Naphthalene < 10 µg/m3
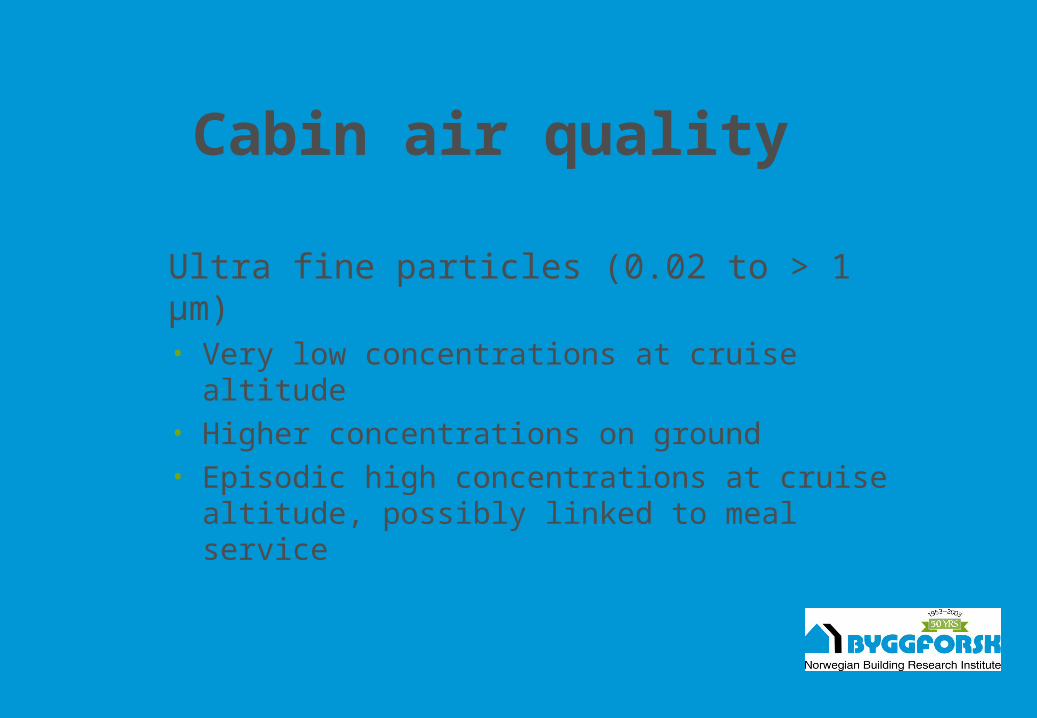
Cabin air quality
Ultra fine particles (0.02 to > 1 µm) • Very low concentrations at cruise
altitude• Higher concentrations on ground • Episodic high concentrations at cruise
altitude, possibly linked to meal service

Cabin air quality
Endotoxins: 0.02-0.11 units/m3 during boarding, not detectable during cruise
Microbiologicals • Bacteria: 200-400 cfu/m3 • Fungi: 10-100 cfu/m3
Questionnaire study
309 questionnaire responses 46 flights Cabin crew and flight crew Changes in symptom intensity
during flight and assessment of cabin environment

1
2
3
4
5
6
7
Tem
pe
ratu
re in
ca
bin
: To
o h
ot -
Too
co
ld
Tem
pe
ratu
re in
ca
bin
: Sta
ble
-V
ari
es
du
rin
g th
e fl
igh
t
Tem
pe
ratu
re in
ca
bin
: Sa
tisfa
cto
ry
- U
nsa
tisfa
cto
ry o
vera
ll
Air
mo
vem
en
t in
the
ca
bin
:To
o s
till
- To
o d
rau
gh
ty a
t he
ad
hig
ht
Air
mo
vem
en
t in
the
ca
bin
: To
o s
till
- To
o d
rau
gh
ty a
t fo
ot l
eve
l
Air
qu
alit
y in
the
ca
bin
: Dry
-H
um
id
Air
qu
alit
y in
the
ca
bin
: F
resh
-S
tuffy
Air
qu
alit
y in
the
ca
bin
: Od
ou
rle
ss -
Sm
elly
Air
qu
alit
y in
the
ca
bin
: Sa
tisfa
cto
ry-
Un
satis
fact
ory
ove
rall
Lig
htin
g in
the
ca
bin
: S
atis
fact
ory
-U
nsa
tisfa
cto
ry o
vera
ll
No
ise
in th
e c
ab
in:
Sa
tisfa
cto
ry -
Un
satis
fact
ory
ove
rall
Ove
rall
com
fort
in th
e c
ab
in:
Sa
tisfa
cto
ry -
Un
satis
fact
ory
Questions
Sc
ore
Cabin environment - all flights

1
2
3
4
5
6
7(L
)Te
mp
era
ture
in c
ab
in:
(M
)To
o h
ot
- To
o c
old
(S
)
(L)
Tem
pe
ratu
re in
ca
bin
: (M
)S
tab
le -
Va
rie
s d
uri
ng
th
e f
ligh
t (
S)
(L)
Tem
pe
ratu
re in
ca
bin
: (M
)S
atis
fact
ory
-
Un
satis
fact
ory
ove
rall
(L)
Air
mo
vem
en
t in
th
e c
ab
in:
(M)
Too
stil
l - T
oo
dra
ug
hty
at
he
ad
hig
ht
(L)
Air
mo
vem
en
t in
th
e c
ab
in:
(M)
Too
stil
l - T
oo
dra
ug
hty
at
foo
t le
vel
(L)
Air
qu
alit
y in
th
e c
ab
in:
(M)
Dry
- H
um
id
(S)
(L)
Air
qu
alit
y in
th
e c
ab
in:
(M
)F
resh
- S
tuff
y (
S)
(L)
Air
qu
alit
y in
th
e c
ab
in:
(M
)O
do
url
ess
- S
me
lly
(S)
(L)
Air
qu
alit
y in
th
e c
ab
in:
(M
)S
atis
fact
ory
- U
nsa
tisfa
cto
ry o
vera
ll
(L)
Lig
htin
g in
th
e c
ab
in:
(M
)S
atis
fact
ory
-U
nsa
tisfa
cto
ry o
vera
ll (
S)
(L)
No
ise
in t
he
ca
bin
: (
M)
Sa
tisfa
cto
ry -
Un
satis
fact
ory
ove
rall
(L
)O
vera
ll co
mfo
rt in
th
e c
ab
in:
(M
)S
atis
fact
ory
- U
nsa
tisfa
cto
ry o
vera
ll
Sc
ore
Q3(75%) Q1(25%) MedianCabin environment - by flight length

0 0.2 0.4 0.6 0.8 1 1.2 1.4 1.6 1.8
Dry eyes
Itching or irritated eyes
Watering eyes
Blocked or stuffy nose
Dry nose
Runny nose
Dry/irritated throat
Cough
Sneezing
Dry skin/lips
Rash or irritated skin
Pressure or pain in ears/sinuses
Feeling dizzy or faint
Feeling tired
Headache
Difficulty in concentrating or remembering
Feeling anxious/stressed/irritable
Nausea/feeling sick
Chest tightness or difficulty with breathing
Flu-like symptoms
Discomfort/pain in muscles/jointsQ
ues
tio
ns
Score - In flight minus pre flight
Change in score –
feeling tired
Symptom change - all flights
Change in score – dry
skin/lips
Change in score – dry
nose
Change in score – dry
eyes

Symptom change
Aircraft type
Dry skin/lipsDouble deck
Dry skin/lipsTwin aisle
Dry skin/lipsSingle aisle
Feeling tiredDouble deck

Statistical Regression approach to analysis
Investigate the dependence of symptom change on the concurrent influence of all explanatory variables measured.
Statistical Regression Common finding
Symptom change was related to duration of flight and individual cabin / galley comfort assessment:
– A longer flight – more change– Less comfortable – more change

Statistical Regression
Increase in RH is weakly associated with smaller changes in symptoms related to dryness
Statistical Regression
Results not consistent enough across the data sets analyzed to make any firm conclusions about possible associations between carbon dioxide concentrations, air velocities or temperatures and symptom changes on monitored flights.

Statistical Regression Summary
The models were highly sensitive to change in the dataset analysed.
General conclusions
None of the measured values of indoor air quality are at levels of concern for health and safety of passengers or crew.
Some measured values of thermal parameters are outside comfort range.
Symptom change is related to duration of flight and overall individual comfort assessment

Conclusions: Technology development
ECS and Air distribution: Better local control of the cabin environment is desirable
Filtration: Filtering of outside air may be desirable while aircraft is on ground