measurements of wind, wave and currents - · pdf filemeasurements of wind, wave and currents...
TRANSCRIPT

ECN-E--09-015
Measurements of Wind, Wave and Currents
at the Offshore Wind Farm Egmond aan Zee
J.W. WagenaarP.J. Eecen
DECEMBER 2009
OWEZ_R_122_Wave_20050701_20081231

2 ECN-E--09-015
Abstract NoordzeeWind carries out an extensive measurement and evaluation program as part of the Off-shore Wind farm Egmond aan Zee (OWEZ) project. The technical part of the measurement and evaluation program considers topics as climate sta-tistics, wind and wave loading, detailed performance monitoring of the wind turbines, etc. The datasets are available in the public domain. The data that are analyzed in this report to characterize wind, wave and currents, are taken from a 116m height meteorological mast, in-cluding the ADCP, located 18km offshore for the coast of Egmond aan Zee, the Netherlands. This report contains cumulative results from the period from 01-07-2005 until 31-12-2008. Acknowledgement The Offshore Wind farm Egmond aan Zee has a subsidy of the Ministry of Economic Affairs under the CO2 Reduction Scheme of the Netherlands. Principal NoordzeeWind 2e Havenstraat 5b 1976 CE IJmuiden Project information Contract number NZW-16-C-C-R01 ECN project number: 7.9433

ECN-E--09-015 3
Contents
List of tables 4 List of figures 4 List of symbols 5 1. Introduction 7 2. Definitions 9
2.1 Weibull distribution 9 2.2 Significant wave height 9 2.3 Zero upcrossing wave period 9 2.4 Stability 10
3. Measured data 11 3.1 Measured signals 11 3.2 Meteorological mast 12 3.3 Derived wind data 12
4. Wind speed and direction distribution 15 5. Wind, water, waves and their correlations 21
5.1 Wave height, water level and water temperature: Available data 21 5.2 Wave height and direction distribution 23 5.3 Misalignment 25 5.4 Currents 27 5.5 Wind speed – wave height (- wave period) 29
6. Conclusions 35 References 37

4 ECN-E--09-015
List of tables
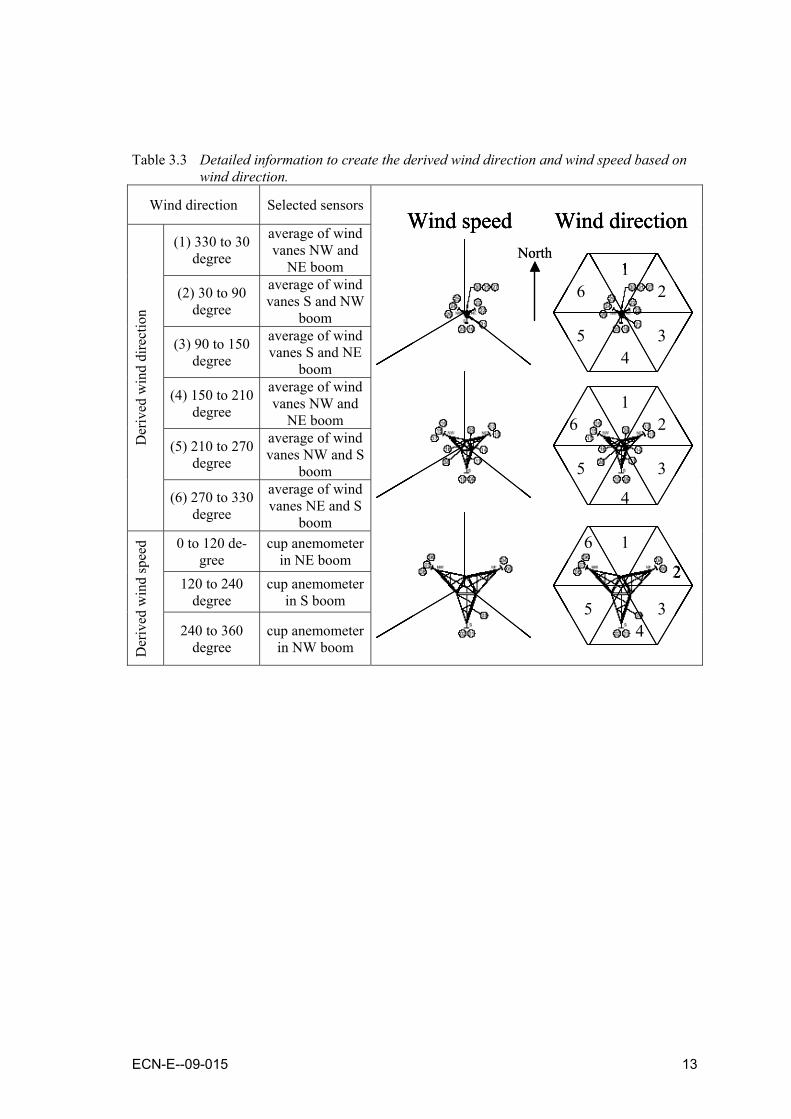
Table 3.1 Measured parameters, their units and instrumentation codes 11 Table 3.2 Coordinates of the meteorological mast at OWEZ 12 Table 3.3 Detailed information to create the derived wind direction and wind speed based
on wind direction. 13 Table 5.1 Normalised number of wind speed - wave height scatter points in bins of 0.2 m
and 1.5 m/s wide, respectively. 31 Table 5.2 Normalised number of wave period – wave height scatter points in bins of 0.2 m
and 0.5 s wide, respectively. 33
List of figures
Figure 4.1 Mean wind speed profile for various atmospheric conditions. 15 Figure 4.2 Normalised wind speed distribution measured at 21m above (histogram) and
the fitted Weibull distribution. Wind rose for the frequency of wind direction occurrence (lower left plot) and wind rose for the mean wind speed per direction (lower right plot) measured at 21m above MSL. 17
Figure 4.3 Normalised wind speed distribution measured at 70 m above (histogram) and the fitted Weibull distribution. Wind rose for the frequency of wind direction occurrence (lower left plot) and wind rose for the mean wind speed per direction (lower right plot) measured at 70m above. 18
Figure 4.4 Normalised wind speed distribution measured at 116 m above MSL (histogram) and the fitted Weibull distribution. Wind rose for the frequency of wind direction occurrence (lower left plot) and wind rose for the mean wind speed per direction (lower right plot) measured at 116m above MSL. 19
Figure 4.5 Fitted Weibull parameters (stars for Weibull parameter A and circles forWeibull parameter k) for the various heights. 20
Figure 5.1 Accumulated amount of wave height data points per month. 21 Figure 5.2 Measured water level, water temperature and wave heights (top to bottom) for
the mentioned period. 22 Figure 5.3 Normalised wave height distribution (histogram). Wave rose for the frequency
of wave direction occurrence (lower left plot) and wave rose for the mean wave height per direction (lower right plot). 24
Figure 5.4 Normalised number of misalignments for (top to bottom) stable, conditionally unstable and unstable atmospheric conditions. 26
Figure 5.5 Current rose for the frequency of current direction occurrence measured at 7 m and 11 m below MSL during the reporting period. 28
Figure 5.6 Scatter plot of wind speed - wave height for stable (top), conditionally unstable and unstable (bottom) atmospheric conditions, respectively. 29
Figure 5.7 Scatter plot for wind speed – wave height. Distinction has been made for undisturbed wind (right) and disturbed wind (left) and for stable (top), conditionally unstable and unstable (bottom) atmospheric conditions. 30
Figure 5.8 Scatter plot of wave period – wave height for stable (top), conditionally unstable and unstable (bottom) atmospheric conditions, respectively. The green lines are the third degree polynomial fit of the scatter data. 32
Figure 5.9 Wave height – wind speed – wave period scatter plot for three different views (rotated axis). 34
ECN-E--09-015 5
List of symbols
A Weibull scale parameter m/s E East E(f) spectral density m2s Hz significant wave height m N North S South T absolute temperature K Tz wave period s W West f frequency s-1 h height m k Weibull shape parameter mn nth moment m2/sn v wind speed m/s ρ probability density

6 ECN-E--09-015

ECN-E--09-015 7
1. Introduction
NoordzeeWind (NZW) carries out an extensive measurement and evaluation program (NSW-MEP) as part of the OWEZ project. NoordzeeWind contracted Bouwcombinatie Egmond (BCE) to build and operate an offshore meteorological mast at the location of the OWEZ wind farm. BCE contracted Mierij Meteo to deliver and install the instrumentation in the meteorological mast. After the data have been validated, BCE delivers the measured 10-minute statistics data to NoordzeeWind. ECN created a database under assignment of NoordzeeWind and fills the data-base with the delivered data. NoordzeeWind contracted ECN to report the data. The technical part of the measurement and evaluation program considers topics as climate sta-tistics, wind and wave loading, detailed performance monitoring of the wind turbines, etc. A 116m high meteorological mast has been installed to measure the wind, water and wave condi-tions. This mast is in operation since the summer of 2005 and the measurements have been made available by NoordzeeWind. This report intends to fulfill requirements which are speci-fied in the measurement and evaluation program [1]. One of the requirements is to report meas-ured water conditions (such as waves, currents, etc.), measured wind conditions and their corre-lation. In an earlier report [2] the measured data are graphically and tabularly described for the period summer 2005 until December 2006. This report contains a comparable description, but now of cumulative measured data, i.e. for the period 01-07-2005 until 31-12-2008. In Chapter 2 definitions used in this report are given. In Chapter 3 the measured signals are described and the instrument codes are given. From the measurements with several anemometers and vanes at each measurement level, a wind speed and wind direction is constructed that reduces the effect of flow distortion due to the mast and neighbouring sensors. The definitions of derived wind speed and derived wind direction are de-scribed. In Chapter 4 wind speed distributions, wind direction and mean wind speeds per direction are reported and analysed. A Weibull distribution is fitted to the wind speed data. In Chapter 5 several aspects of the seawater are reported, whether or not in correlations with the wind. For instance, the availability of wave and water data is discussed. Furthermore, the wave height and direction distribution, the alignment of the wave load with the wind load at 21 m and the current load at 7 m and 11 m below mean see level (MSL) are discussed. Also presented are wave height - wind speed ( - wave period) 2d/3d scatter plots.

8 ECN-E--09-015

ECN-E--09-015 9
2. Definitions
Unless mentioned differently the following definitions have been used in this report.
2.1 Weibull distribution We use the Weibull distribution to fit the data for wind speed distributions
⎟⎟⎠
⎞⎜⎜⎝
⎛⎟⎠⎞
⎜⎝⎛−⎟
⎠⎞
⎜⎝⎛=
− kk
Ax
Ax
Akx exp)(
1
ρ , ( 1 )
where k is the shape and A the scale parameter. The data are normalised such, that the histograms resemble probability densities, i.e. the total area is 1.
2.2 Significant wave height Significant wave heights are defined by the energy spectrum [3]
∫= dffEH S )(4 . ( 2 )
As not mentioned differently within this report, wave height always means significant wave height.
2.3 Zero upcrossing wave period Wave periods are given as zero upcrossing periods, which are defined by [3]
.2,0,)(
,22
0
==
=
∫ ndffEfm
mm
T
nn
z π ( 3 )
As not mentioned differently within this report, wave period always means zero upcrossing wave period.

10 ECN-E--09-015
2.4 Stability The stability or instability of a layer of the atmosphere or of the atmosphere as a whole is a state with respect to the reaction of a volume of air to a vertical displacement. The atmospheric stability determines the probability of convection, atmospheric turbulence and mixing. During highly unstable conditions a lifted parcel of air will be warmer than the surrounding air. It will continue to rise upward, away from its original position. Therefore a lot of atmospheric turbu-lence is likely to occur, which goes a along with strong mixing. For highly stable conditions a lifted volume of air will be cooler than the surrounding air. It will sink back to its original vertical position. Distortions to the vertical position of an air volume will therefore be damped, which can lead to decoupled layers within the atmosphere. During conditionally unstable conditions saturated air volumes can still rise due to moisture. Note that there exists a large variety of methods to estimate atmospheric stability from mea-surements and that this topic is still ongoing research. In an earlier report [2] it turned out that the environmental lapse rate method coincides best with the analyses. Therefore stability within this report is based on this method: -dT/dh < 6K/km = stable atmospheric conditions 6K/km < -dT/dh < 10K/km = conditionally unstable atmospheric conditions -dT/dh > 10K/km = unstable atmospheric conditions.

ECN-E--09-015 11
3. Measured data
3.1 Measured signals The instrumentation codes of the sensors in the 116m high meteorological mast at the offshore wind farm location OWEZ are indicated in Table 3.1, together with the measured variables and instrument codes. The instrumentation is described in [4].
Table 3.1 Measured parameters, their units and instrumentation codes Instrument Code Measured parameter and Unit
3D WM4/NW/116 wind direction [°] 3D WM4/NW/116 horizontal wind speed [m/s] 3D WM4/NW/116 vertical wind speed [m/s] WS 018/NW/116 wind speed [m/s] WS 018/NE/116 wind speed [m/s] WS 018/S/116 wind speed [m/s] WS 018/NW/70 wind speed [m/s] WS 018/NE/70 wind speed [m/s]
RHTT 261/S/116 ambient temp. [°C] RHTT 261/S/70 ambient temp. [°C]
RHTT 261/S/116 relative humidity [%] DP910 ambient air pressure [mbar]
PD 205/NW/70 precipitation [yes/no] ST 808/NW/-3.8 sea water temperature [°C] AC SB2i/T/116 X ( north – south ) acceleration [m/s2] AC SB2i/T/116 Y ( west – east ) acceleration [m/s2]
WD 524/NW/116 wind direction [°] WD 524/NE/116 wind direction [°] WD 524/S/116 wind direction [°] WD 524/NW/70 wind direction [°] WD 524/NE/70 wind direction [°] 3D WM4/NW/21 wind direction [°] 3D WM4/NW/21 horizontal wind speed [m/s] 3D WM4/NW/21 vertical wind speed [m/s] 3D WM4/NW/70 wind direction [°] 3D WM4/NW/70 horizontal wind speed [m/s] 3D WM4/NW/70 vertical wind speed [m/s]
WS 018/S/70 wind speed [m/s] WS 018/NW/21 wind speed [m/s] WS 018/NE/21 wind speed [m/s] WS 018/S/21 wind speed [m/s]
RHTT 261/S/21 ambient temp. [°C] RHTT 261/S/70 relative humidity [%] RHTT 261/S/21 relative humidity [%] PD 205/NE/70 precipitation [yes/no] WD 524/S/70 wind direction [°]
WD 524/NW/21 wind direction [°] WD 524/NE/21 wind direction [°] WD 524/S/21 wind direction [°]

12 ECN-E--09-015
ADCP Water level [m] ADCP Water temperature [°C] ADCP Wave height [m] ADCP Wave period [s] ADCP Wave direction [°] ADCP Current velocity 7 m [m/s] ADCP Current velocity 11 m [m/s] ADCP Current direction 7 m [°] ADCP Current direction 11 m [°]
3.2 Meteorological mast The meteorological mast is a lattice tower with booms at three heights: 21m 70m and 116m above MSL. At each height, three booms are installed in the directions north-east (NE), south (S) and north-west (NW) [4]. Sensors attached to the meteorological mast are described in [5]. Important sensors for this report are the wind vanes and anemometers, attached to the booms, and the Acoustic Doppler Current Profiler (ADCP), attached to the J-tube of the mast –17m LAT. The location of the meteorological mast is given in Table 3.2.
Table 3.2 Coordinates of the meteorological mast at OWEZ UTM31 ED50 WGS 84
x 594195 4º23’22,7’’ EL y 5829600 52º36’22,9’’ NB
3.3 Derived wind data The wind speeds and wind directions at each height are measured with more than one sensor. For certain wind directions the wind vanes and cups are in the wake of the mast or neighbouring sensors or are otherwise significantly disturbed by the mast. It is necessary to select one of the cup anemometers depending on the actual wind direction in order to establish a wind speed that minimises the distortion of the meteorological mast. The constructed wind speed and wind di-rection are used in this report unless it is explicitly indicated. The selection of signals is indi-cated in Table 3.3. For the selection of the wind speed sensor it is important that at the direction where the wind speed sensor is changed from one sensor to the other, the ratio of the wind speeds is close to one. Furthermore, the wind speed may not be measured in the wake of the mast or a neighbour-ing sensor. Averaging over two vanes can reduce the effect of the distortion of the mast on the wind direction measurement. Also the standard deviation of the wind direction has been taken into account. The standard de-viation is significantly increased for wind directions directly along the booms. This is the reason that six sectors are defined instead of the three sectors in the case of wind speed. See subsequent half year reports, starting from [6], for more detail.
ECN-E--09-015 13
Table 3.3 Detailed information to create the derived wind direction and wind speed based on wind direction.
Wind direction Selected sensors
12
3
4
5
6
12
34
5
6
1
2
34
5
6
Wind speed Wind directionNorth
12
3
4
5
6
12
34
5
6
1
2
34
5
6
Wind speed Wind direction
12
3
4
5
6
12
34
5
6
1
2
34
5
6
12
3
4
5
6
12
34
5
6
1
2
34
5
6
Wind speed Wind directionNorth
Der
ived
win
d di
rect
ion
(1) 330 to 30 degree
average of wind vanes NW and
NE boom
(2) 30 to 90 degree
average of wind vanes S and NW
boom
(3) 90 to 150 degree
average of wind vanes S and NE
boom
(4) 150 to 210 degree
average of wind vanes NW and
NE boom
(5) 210 to 270 degree
average of wind vanes NW and S
boom
(6) 270 to 330 degree
average of wind vanes NE and S
boom
Der
ived
win
d sp
eed 0 to 120 de-
gree cup anemometer
in NE boom 120 to 240
degree cup anemometer
in S boom
240 to 360 degree
cup anemometer in NW boom

14 ECN-E--09-015
ECN-E--09-015 15
4. Wind speed and direction distribution
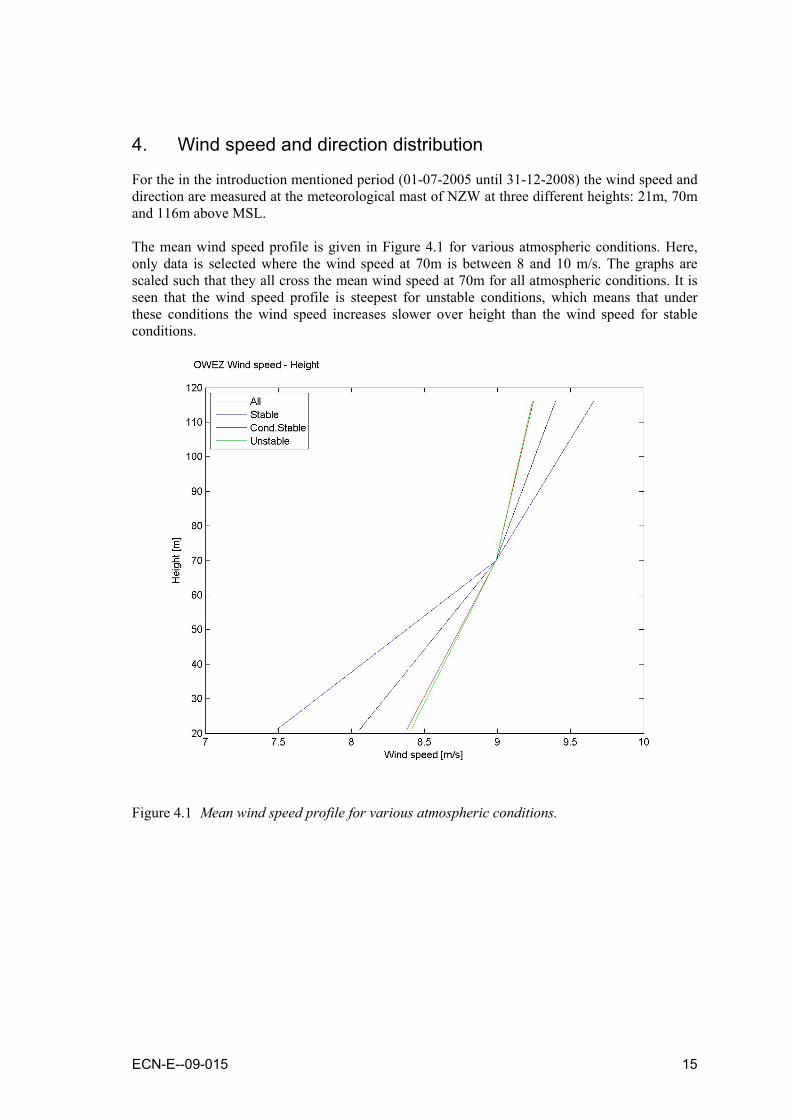
For the in the introduction mentioned period (01-07-2005 until 31-12-2008) the wind speed and direction are measured at the meteorological mast of NZW at three different heights: 21m, 70m and 116m above MSL. The mean wind speed profile is given in Figure 4.1 for various atmospheric conditions. Here, only data is selected where the wind speed at 70m is between 8 and 10 m/s. The graphs are scaled such that they all cross the mean wind speed at 70m for all atmospheric conditions. It is seen that the wind speed profile is steepest for unstable conditions, which means that under these conditions the wind speed increases slower over height than the wind speed for stable conditions.
Figure 4.1 Mean wind speed profile for various atmospheric conditions.

16 ECN-E--09-015
In Figure 4.2, Figure 4.3 and Figure 4.4 the normalised wind speed and wind direction distribu-tions are shown, measured at 21m, 70m and 116m, respectively. The wind speed distributions are fitted with a Weibull distribution for which the parameters are given in the figures. Also given is the measured mean wind speed. The wind direction is predominantly SW and also the highest mean wind speed is from this direction.

ECN-E--09-015 17
Figure 4.2 Normalised wind speed distribution measured at 21m above (histogram) and the
fitted Weibull distribution. Wind rose for the frequency of wind direction occurrence (lower left plot) and wind rose for the mean wind speed per direction (lower right plot) measured at 21m above MSL.

18 ECN-E--09-015
Figure 4.3 Normalised wind speed distribution measured at 70 m above (histogram) and the
fitted Weibull distribution. Wind rose for the frequency of wind direction occurrence (lower left plot) and wind rose for the mean wind speed per direction (lower right plot) measured at 70m above.

ECN-E--09-015 19
Figure 4.4 Normalised wind speed distribution measured at 116 m above MSL (histogram) and
the fitted Weibull distribution. Wind rose for the frequency of wind direction occurrence (lower left plot) and wind rose for the mean wind speed per direction (lower right plot) measured at 116m above MSL.

20 ECN-E--09-015
Figure 4.5 shows the behaviour of the Weibull parameters as function of the height. Clearly the Weibull parameter A (scale parameter) increases over height, whereas the Weibull parameter k (shape parameter) decreases over height.
Figure 4.5 Fitted Weibull parameters (stars for Weibull parameter A and circles forWeibull parameter k) for the various heights.
ECN-E--09-015 21
5. Wind, water, waves and their correlations
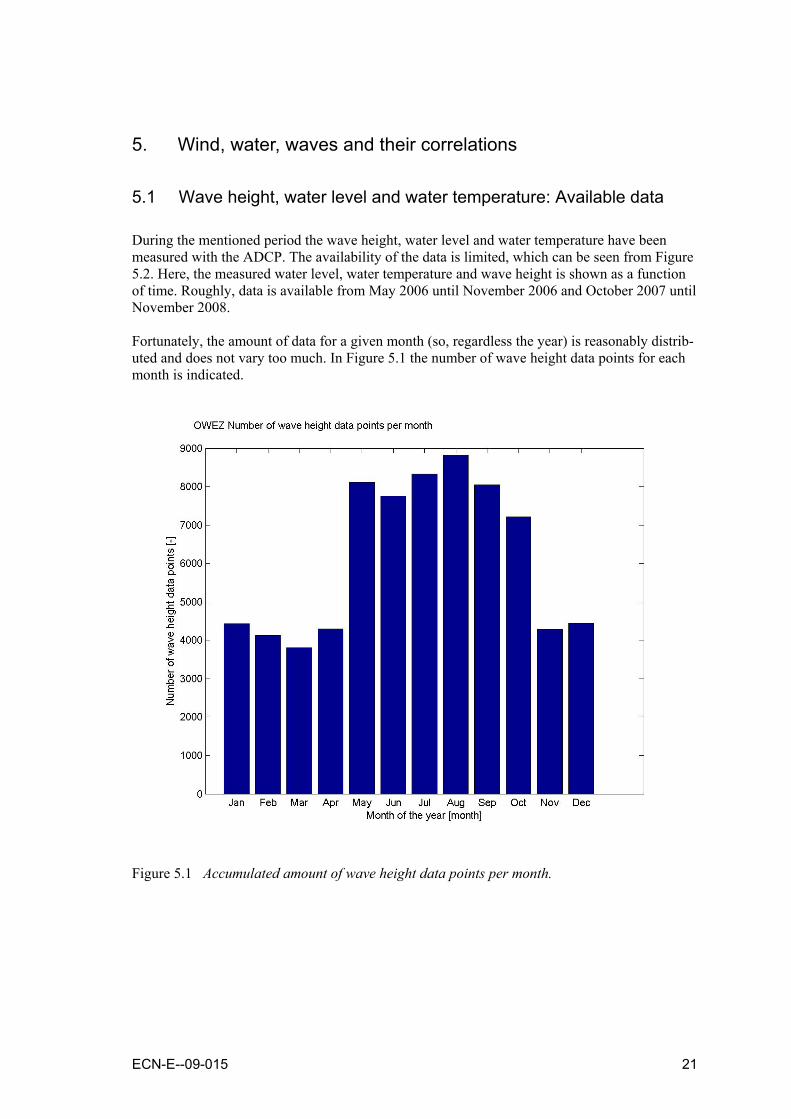
5.1 Wave height, water level and water temperature: Available data During the mentioned period the wave height, water level and water temperature have been measured with the ADCP. The availability of the data is limited, which can be seen from Figure 5.2. Here, the measured water level, water temperature and wave height is shown as a function of time. Roughly, data is available from May 2006 until November 2006 and October 2007 until November 2008. Fortunately, the amount of data for a given month (so, regardless the year) is reasonably distrib-uted and does not vary too much. In Figure 5.1 the number of wave height data points for each month is indicated.
Figure 5.1 Accumulated amount of wave height data points per month.

22 ECN-E--09-015
Figure 5.2 Measured water level, water temperature and wave heights (top to bottom) for the
mentioned period.

ECN-E--09-015 23
5.2 Wave height and direction distribution The wave height and direction have been measured. From all available data 11% of the meas-ured wave heights is equal or higher then 1.5 m. The distributions of the normalised values of the wave heights and directions are shown in Figure 5.3 together with the mean wave height per direction. Also indicated is the measured mean wave speed. From the distribution of the wave direction and the mean wave height per direction we conclude that the waves predominantly come form the west, due to the NS orientation of the Dutch coast. Also the mean wave heights per direction are highest from western directions.

24 ECN-E--09-015
Figure 5.3 Normalised wave height distribution (histogram). Wave rose for the frequency of
wave direction occurrence (lower left plot) and wave rose for the mean wave height per direction (lower right plot).

ECN-E--09-015 25
5.3 Misalignment Offshore wind turbines are exposed by wave loads acting on the tower and wind loads mainly acting on the rotor. Therefore it is important to gain knowledge on the relative alignment of these forces. Figure 5.4 shows histograms of normalised misalignments between measured wind direction at 21 m and the measured wave direction for the various atmospheric conditions (see section 2.4) misalignment = |winddirection21m – wavedirection| , ( 4 ) It can clearly be seen that the misalignment depends on stability of the atmospheric boundary layer, as it is predicted by theory. Under unstable atmospheric conditions the differences of the wind directions at 21 m with the directions of the waves are within 40 degrees, but for stable and conditionally unstable conditions those differences are larger, i.e. more misalignments for larger angles. This is due to the fact that layers in different heights can be decoupled under sta-ble (and conditionally unstable) conditions and therefore winds in higher altitudes have less di-rect impact on winds above sea level, which are driving the waves. We notice a difference with [2], especially for stable atmospheric conditions. In [2] the number of misalignments for stable conditions is higher for larger angles, whereas we see a higher num-ber of misalignments for smaller angles. Most probably this is due to the fact that for this report much more data was available.

26 ECN-E--09-015
Figure 5.4 Normalised number of misalignments for (top to bottom) stable, conditionally
unstable and unstable atmospheric conditions.
ECN-E--09-015 27
5.4 Currents An other load on the masts comes from the currents, although this load is of limited magnitude. In Figure 5.5 the distribution of the current directions at a depth of 7m and 11m (left roses) are shown, together with the mean current velocity per direction (right roses). It is clearly seen that the current directions are predominantly NS. This effect seems to be stronger at larger depths. Although the mean current velocities are of limited magnitude, the highest mean velocity comes from SE direction.

28 ECN-E--09-015
Figure 5.5 Current rose for the frequency of current direction occurrence measured at 7 m and
11 m below MSL during the reporting period.

ECN-E--09-015 29
5.5 Wind speed – wave height (- wave period) To study the relation between the wind speed and wave height a scatter plot of the two is given in Figure 5.6 for different atmospheric conditions. We note that when we speak of wind speed in this section we mean the wind speed at 21 m. There is a relation between the wind speed and wave height for all three atmospheric conditions. However, looking at the scatter plots, the stan-dard deviation of the scatter is smallest under unstable conditions, as is predicted by theory.
Figure 5.6 Scatter plot of wind speed - wave height for stable (top), conditionally unstable and unstable (bottom) atmospheric conditions, respectively.

30 ECN-E--09-015
It may be that the meteorological mast is in the wake of the wind farm and that the measured wind is disturbed. Therefore, Figure 5.7 shows the same plot as Figure 5.6, but now distinction has been made for undisturbed and disturbed wind. The wind is undisturbed for directions be-tween 143° and 315º and disturbed elsewhere. Clearly, in disturbed wind the wind speeds are smaller. Also the relation between wind speed and wave height is better seen for undisturbed wind, as may be expected, since the standard de-viation of the scatter is smaller. The undisturbed wind plots for the various atmospheric conditions do not differ too much from the plots in Figure 5.6.
Figure 5.7 Scatter plot for wind speed – wave height. Distinction has been made for undisturbed wind (right) and disturbed wind (left) and for stable (top), conditionally unstable and unstable (bottom) atmospheric conditions.

ECN-E--09-015 31
In Table 5.1 we present the normalised number of wind speed - wave height scatter points measured within a bin of 0.2 m and 1.5 m/s wide for all atmospheric conditions. The numbers are normalised such that the total number of points is 1000.
Table 5.1 Normalised number of wind speed - wave height scatter points in bins of 0.2 m and 1.5 m/s wide, respectively.
Waveheight [m]
0 0 0 0 0 0 0 0 1 1 1 00 0 0 0 0 0 0 0 1 1 1 1
3.0-3.2 0 0 0 0 0 0 0 1 2 2 2 10 0 0 0 0 0 0 1 2 3 3 10 0 0 0 0 0 1 2 3 4 3 10 0 0 0 0 1 2 3 5 5 3 10 0 0 0 0 1 3 5 8 7 3 0
2.0-2.2 0 0 0 0 1 3 5 7 9 6 2 00 0 0 1 2 5 8 11 12 5 1 00 0 1 2 4 8 12 14 11 3 0 00 1 2 4 7 12 14 14 6 1 0 01 2 4 9 12 15 19 11 4 1 0 0
1.0-1.2 1 4 7 14 20 25 20 8 3 1 0 01 7 12 20 28 29 16 6 2 0 0 02 7 17 23 31 22 12 2 0 0 0 03 13 27 38 39 17 5 0 0 0 0 08 26 45 40 19 6 1 0 0 0 0 0
0.0-0.2 0 1 1 2 1 0 0 0 0 0 0 00- 3- 6- 9- 12- 15-1.5 4.5 7.5 10.5 13.5 16.5
Wind speed [m/s]
32 ECN-E--09-015
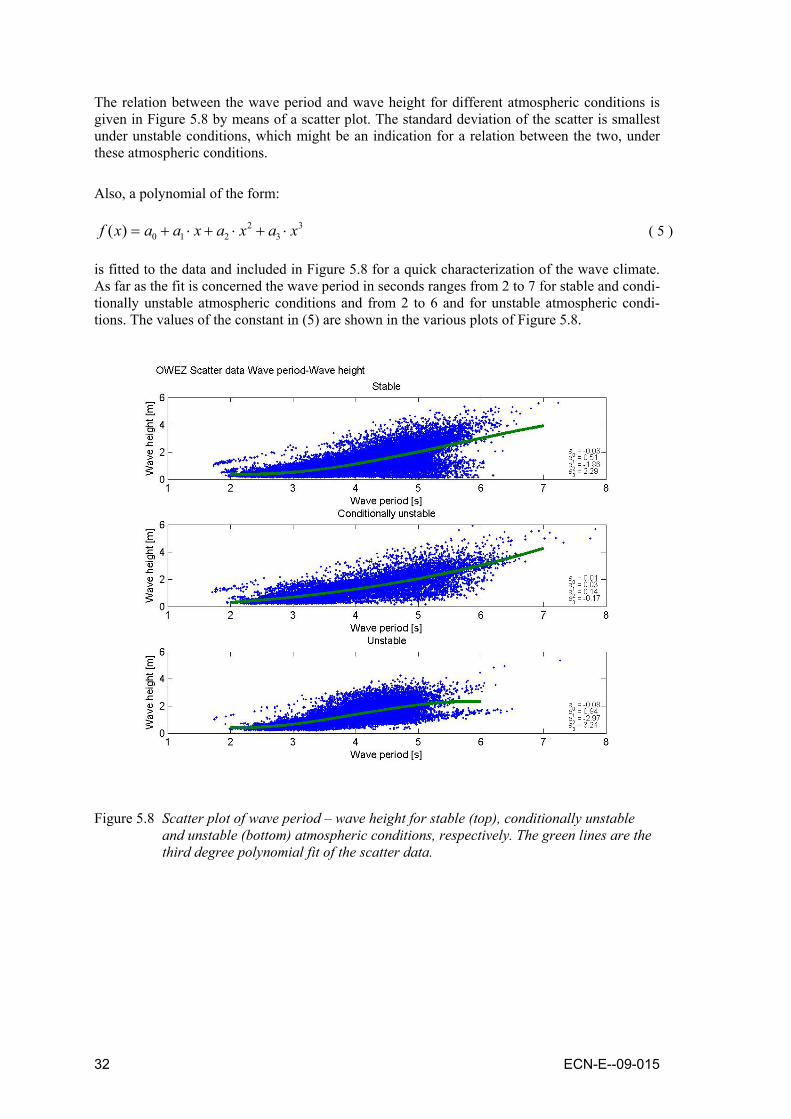
The relation between the wave period and wave height for different atmospheric conditions is given in Figure 5.8 by means of a scatter plot. The standard deviation of the scatter is smallest under unstable conditions, which might be an indication for a relation between the two, under these atmospheric conditions.
Also, a polynomial of the form:
33
2210)( xaxaxaaxf ⋅+⋅+⋅+= ( 5 )
is fitted to the data and included in Figure 5.8 for a quick characterization of the wave climate. As far as the fit is concerned the wave period in seconds ranges from 2 to 7 for stable and condi-tionally unstable atmospheric conditions and from 2 to 6 and for unstable atmospheric condi-tions. The values of the constant in (5) are shown in the various plots of Figure 5.8.
Figure 5.8 Scatter plot of wave period – wave height for stable (top), conditionally unstable and unstable (bottom) atmospheric conditions, respectively. The green lines are the third degree polynomial fit of the scatter data.
ECN-E--09-015 33
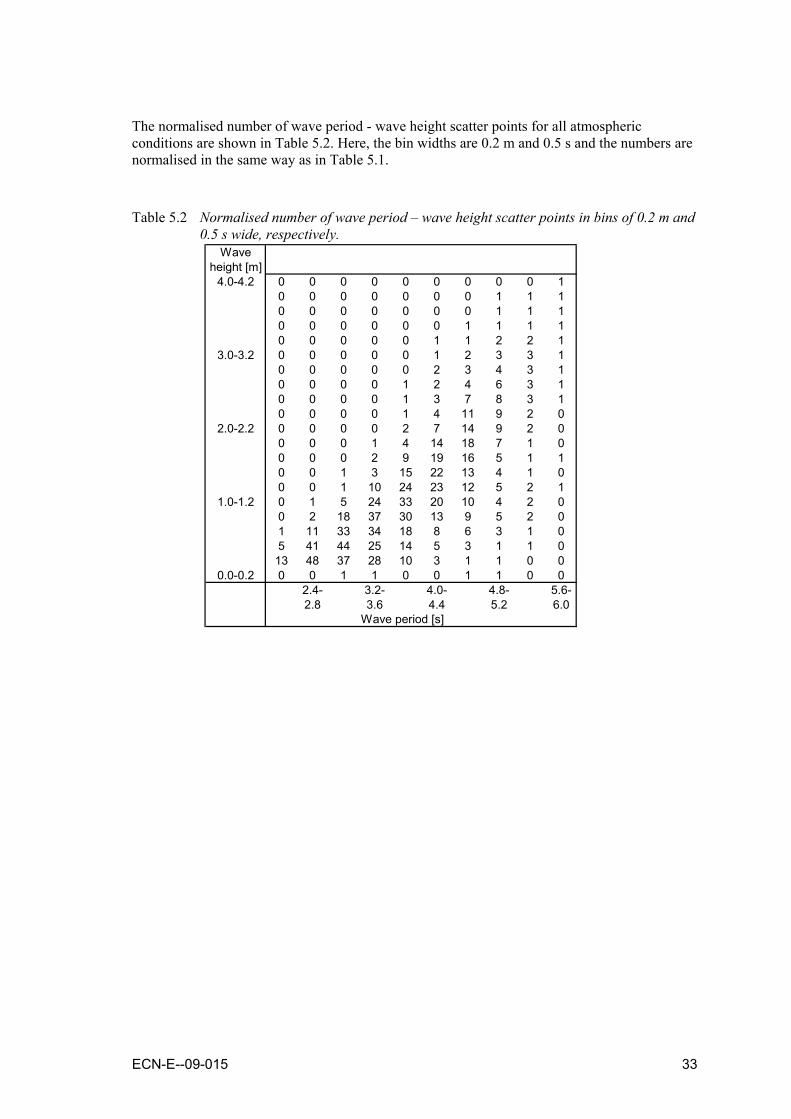
The normalised number of wave period - wave height scatter points for all atmospheric conditions are shown in Table 5.2. Here, the bin widths are 0.2 m and 0.5 s and the numbers are normalised in the same way as in Table 5.1.
Table 5.2 Normalised number of wave period – wave height scatter points in bins of 0.2 m and 0.5 s wide, respectively.
Waveheight [m]
4.0-4.2 0 0 0 0 0 0 0 0 0 10 0 0 0 0 0 0 1 1 10 0 0 0 0 0 0 1 1 10 0 0 0 0 0 1 1 1 10 0 0 0 0 1 1 2 2 1
3.0-3.2 0 0 0 0 0 1 2 3 3 10 0 0 0 0 2 3 4 3 10 0 0 0 1 2 4 6 3 10 0 0 0 1 3 7 8 3 10 0 0 0 1 4 11 9 2 0
2.0-2.2 0 0 0 0 2 7 14 9 2 00 0 0 1 4 14 18 7 1 00 0 0 2 9 19 16 5 1 10 0 1 3 15 22 13 4 1 00 0 1 10 24 23 12 5 2 1
1.0-1.2 0 1 5 24 33 20 10 4 2 00 2 18 37 30 13 9 5 2 01 11 33 34 18 8 6 3 1 05 41 44 25 14 5 3 1 1 0
13 48 37 28 10 3 1 1 0 00.0-0.2 0 0 1 1 0 0 1 1 0 0
2.4- 3.2- 4.0- 4.8- 5.6-2.8 3.6 4.4 5.2 6.0
Wave period [s]

34 ECN-E--09-015
In Figure 5.9 we present a 3d wave height – wind speed – wave period scatter plot for three dif-ferent views. This gives insight in the distribution of the data over these dimensions.
Figure 5.9 Wave height – wind speed – wave period scatter plot for three different views
(rotated axis).

ECN-E--09-015 35
6. Conclusions
All data from 01-07-2005 until 31-12-2008 have been considered and the following conclusions can be drawn from them:
• The Weibull parameters from the Weibull distribution fitted to the wind speed distribution data for various heights vary with respect to height. As expected, the scale parameter increases, whereas the shape parameter de-creases with height.
• The wind direction is predominantly SW and also the mean wind speed per
direction is largest from this direction.
• Although wave/water data is not always available, the cumulative data is reasonably distributed over the year.
• Due to the orientation of the Dutch coast, waves predominantly come from
the West. Also, the mean wave heights per direction are highest for western directions.
• Under unstable atmospheric conditions, the differences between the wind di-
rection at 21 m and the wave direction are mostly within 40 degrees. For stable and conditionally unstable conditions larger misalignments occur fre-quently. Both facts indicate the coupling of air layers during unstable at-mospheric conditions.
• Although of limited magnitude the currents are predominantly NS oriented;
an effect that is stronger for larger depths. The mean current velocity per di-rection is highest for the SE direction.

36 ECN-E--09-015

ECN-E--09-015 37
References
1. NoordzeeWind, The NSW-MEP Technology,
www.noordzeewind.nl/files/Common/Data/Overview_MEP_T_V2.pdf
2. S. Barth & P.J. Eecen, Description of the relation of Wind, Wave and Current Characteristics at the Offshore Wind Farm Egmond aan Zee (OWEZ) Location in 2006, ECN-E-07-104 (2008)
3. K. Argyiadis, Recommendations for design of offshore wind turbines, External Conditions state of the art, Germanischer Lloyd (2003)
4. H.J. Kouwenhoven, User manual data files meteorological mast Noordzee Wind,
Document code: NZW-16-S-4-R03, (October 2007)
5. BCE (Mierij Meteo), Sensor overview, OWEZ document 3672-OV
6. P.J. Eecen, L.A.H. Machielsen & A.P.W.M . Curvers, Meteorological Measurements OWEZ, Half year report (01-07-2005 – 31-12-2005), ECN-E--07-073 (2007)