measurements performed on 16 h16 horns - mario...
TRANSCRIPT

MeasurementsMeasurements performedperformed
16 hon 16 horns Jean-Michel Le Cléac’h
ETF 2010 Stella Plage Saturday November 26ETF 2010 Stella Plage, Saturday November 261
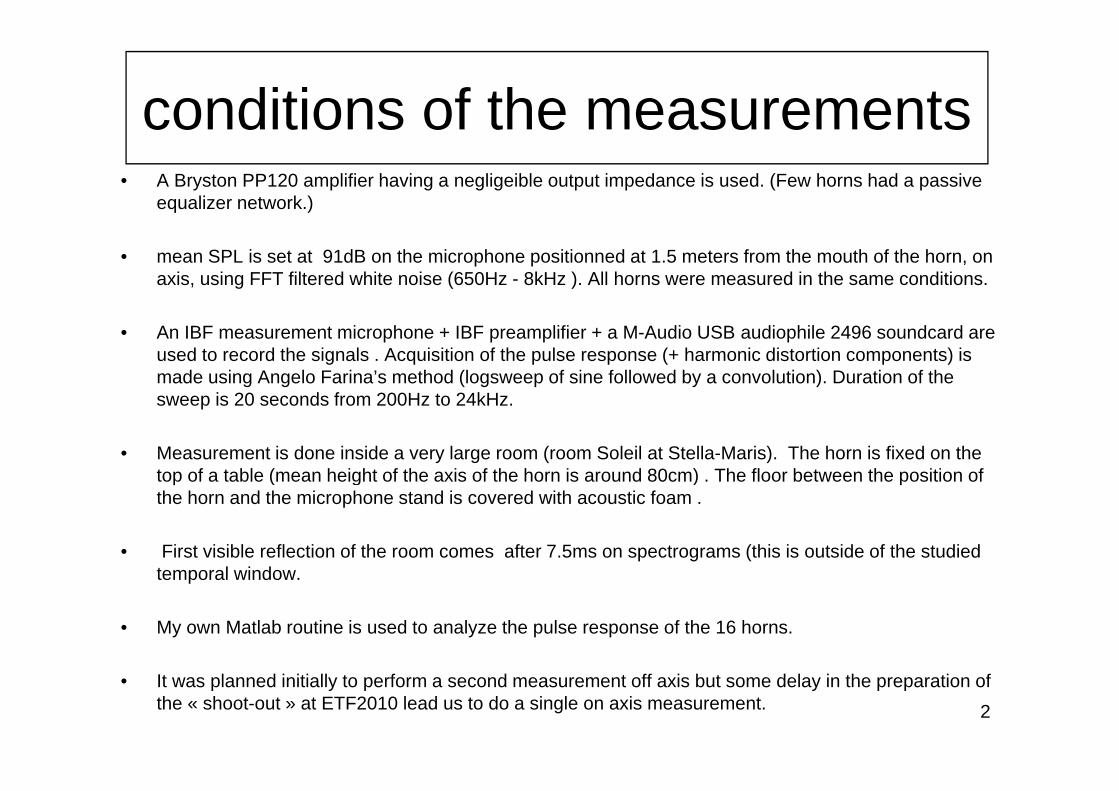
conditions of the measurementsconditions of the measurements• A Bryston PP120 amplifier having a negligeible output impedance is used. (Few horns had a passive
equalizer network.)
• mean SPL is set at 91dB on the microphone positionned at 1.5 meters from the mouth of the horn, on axis, using FFT filtered white noise (650Hz - 8kHz ). All horns were measured in the same conditions.
• An IBF measurement microphone + IBF preamplifier + a M-Audio USB audiophile 2496 soundcard are used to record the signals . Acquisition of the pulse response (+ harmonic distortion components) is made using Angelo Farina’s method (logsweep of sine followed by a convolution). Duration of the
i 20 d f 200H t 24kHsweep is 20 seconds from 200Hz to 24kHz.
• Measurement is done inside a very large room (room Soleil at Stella-Maris). The horn is fixed on the top of a table (mean height of the axis of the horn is around 80cm) . The floor between the position of ( g )the horn and the microphone stand is covered with acoustic foam .
• First visible reflection of the room comes after 7.5ms on spectrograms (this is outside of the studied temporal windowtemporal window.
• My own Matlab routine is used to analyze the pulse response of the 16 horns.
• It was planned initially to perform a second measurement off axis but some delay in the preparation of the « shoot-out » at ETF2010 lead us to do a single on axis measurement. 2

All horns were measured at the same mean SPL level
A SPLmeter was used to set the level to 91dB SPL at 1.50 meters when fed by a filtered white noise having the spectrum shown here:
spectrum of the test signal generated using CoolEdit Pro.
Thanks to Mélaudia and specially to Yves Abourachid and Julien Sullerot for their help to move, install and connect the 16 horns+drivers and to set the SPL level to the chosen valueSPL level to the chosen value.
3

What we expect to detect through or analysis
1 = direct wave
p g y
2 = reflected wave (from mouth edge or zones of rapid variation of the profile)
3 = diffracted wave (from the mouth edge or zones of rapid variation of the profile)
4 = high order modes + breaking modes of the diaphragm + high frequency resonances of the g g g g ydriver
A good horn should provide the less amount of reflected waves, diffracted waves and unwanted high order modes.g
4

4 graphs to present the results of the analysis of each horn
1) left bottom corner : frequency response curve and
4 graphs to present the results of the analysis of each horn
1) left bottom corner : frequency response curve and harmonic distortion components H2, H3, H4 and H5. (a bell shape Fourier window having a width inversely proportionnal to the frequency is used, this means that for every frequency the samenumber of periods is taken in account for the calculation)
2 4
2) Left upper corner : group delay curve. (It is derived from the phase calculated in parallel to the frequency response )
3) Right bottom corner : the impulse response (drawn inside a ) g p p (time window -3.25ms to + 6,5ms. The arrival of the pulse corresponds to 0ms).
4) Right upper corner: a spectrogram obtained using a continuous wavelets method The color map displays for eachcontinuous wavelets method. The color map displays for eachcouple time/frequency, the relative level inside a -40 to 0dB interval. (the width of the used wavelet is equivalent to a constant number of periods at the given frequency, this is why the reddish color zone spreads more at low frequency than at high frequency.)
1 3
5

A reference spectrogram for a theorical horn devoid of anyA reference spectrogram for a theorical horn devoid of any effect of reflection, diffraction and high order modes.
A good horn should possess a spectrogram not to dissimilar to that one.
6

Interpretation of the spectrogram
H = high order modes + breaking modes + HF resonances of the driver
The difference of path between the reflected wave and the direct wave, here 2.7ms ( = 93cm at the speed of sound), is the double of the length between the throat and the mouth (or a zone of rapid variation of the profile at the origin of the reflection)variation of the profile at the origin of the reflection).
The difference of path between the diffracted wave and the direct wave, here 1.7ms ( = 52cm) is roughly equivalent to the mean radius of the horn (whatever mean radius means). See next page for additional comments on diffracted waves as seen on the spectrogramfor additional comments on diffracted waves as seen on the spectrogram.
7

Multiple reflections and multiple diffractions in a Mantaray horn
reflected waves
diffracted waves
high order modes
breaking modes
8

While having different shapes and are used with different drivers,N°6 (Kugelwellen horn) and N°9 (Le Cléac’h horn) results are very similarN 6 (Kugelwellen horn) and N 9 (Le Cléac h horn) results are very similar
Comparison between the profile of a Kugelwellen horn and a Le Cléac’h horn having the same cut-off frequency
Due to its longer roll back, the Le CLéac’h horn has fewer reflected and diffracted energy at the mouth. 9

Individual resultsof the
16 h d i16 horns+drivers couplescouples
10

11
12

13

14
15
16

17

18

19

20
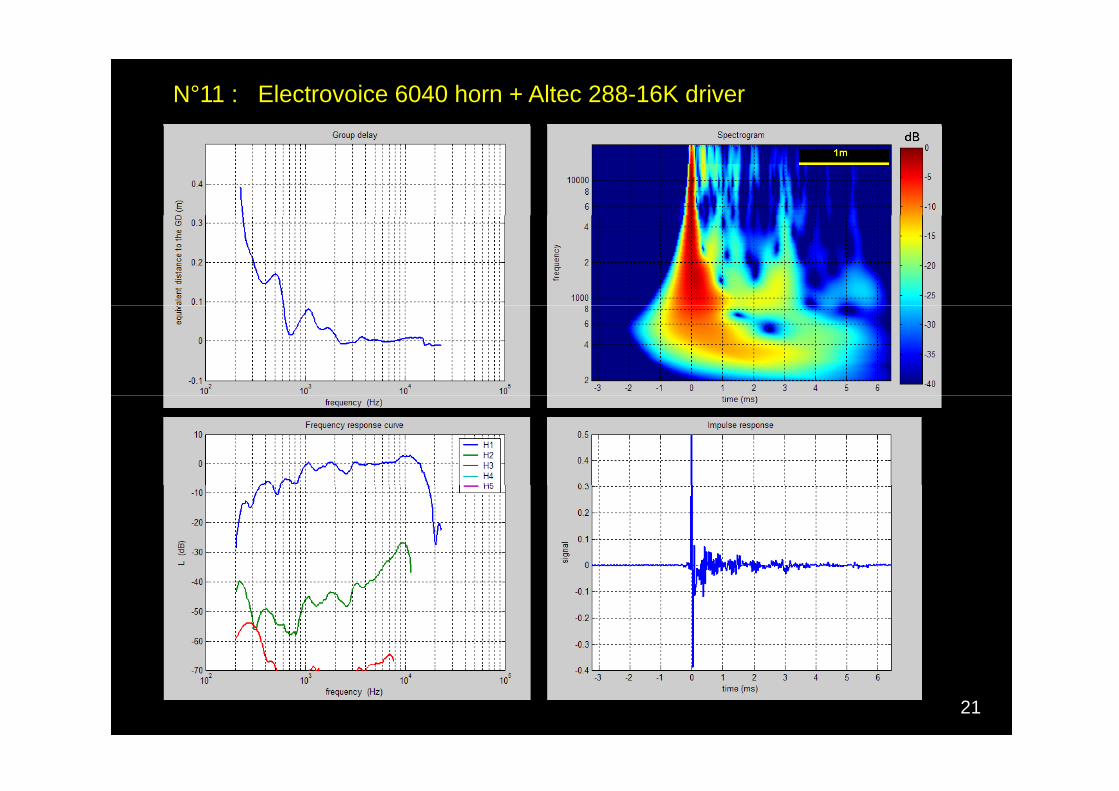
N°11 : Electrovoice 6040 horn + Altec 288-16K driver
21

N°12 : JBL 2353 biradial horn + Altec Lansing 288-8K driver
22

23

24

25

26

Commentaries on the results of the
measurements
27

N°1 : Mélodium 8 cells horn + diy throat + Altec Lansing 802-8D driver The frequency response extends from 600Hz to 10kHz. A noticeable hole is seen on the frequency response curve between 1300Hz and 2700Hz (-10dB at 1800Hz). The distortion rises below 600Hz. The group delay rises below 1300Hz. Better to use that couple horn/driver above 1500Hz. May possibly benefit of the use of a series resistor to fill the holes, in the frequency response curve and on the group delay curve around 1900Hz (see also comparison with TD2001 used without series resistor as in N°3 and with a 30ohm series resistor as in N°9). A noticeable reflection from mouth to throat at t = 2.6ms. Someseries resistor as in N 9). A noticeable reflection from mouth to throat at t 2.6ms. Some diffraction (and HOMs?) at t= 0.27ms ; 0.6ms and 1.1ms.
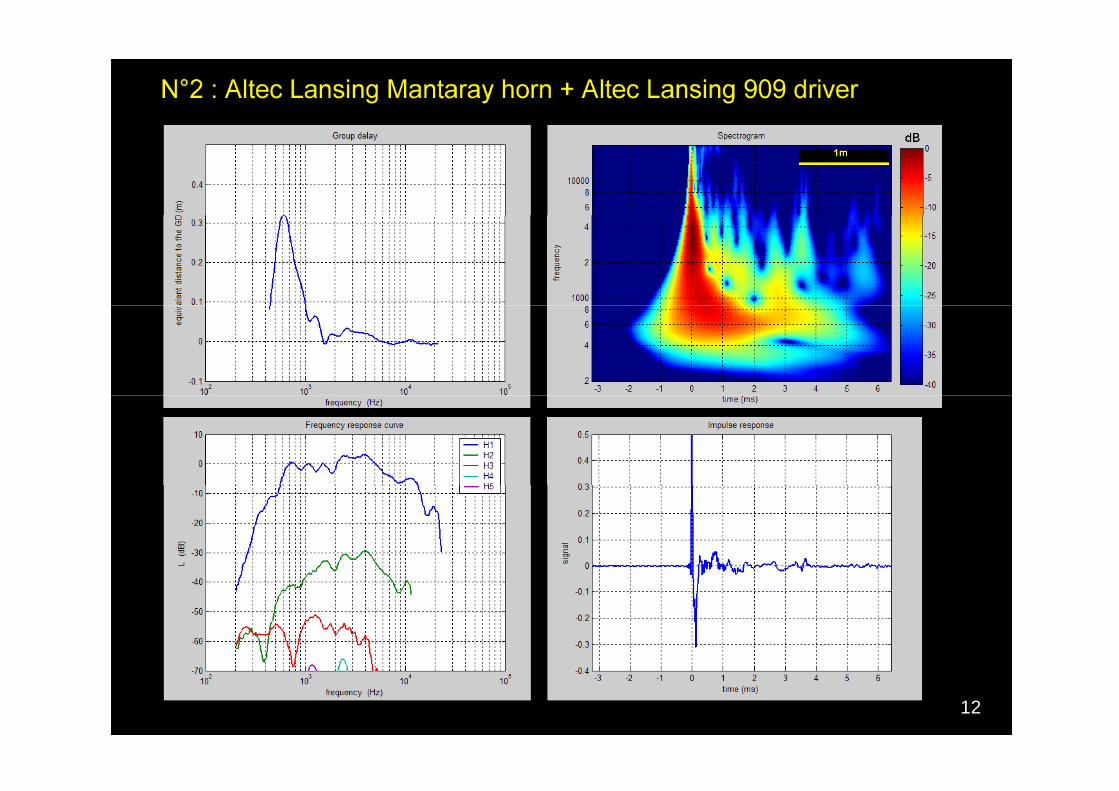
N°2 : Altec Lansing Mantaray horn + Altec Lansing 909 driver S i l i th f A b b t 2kH d 5kH A tiSome ripples in the frequency response curve. A bump between 2kHz and 5kHz. A negative slope above 4kHz . Better to use a tweeter over 5kHz. Low distortion (negligible H4 and H5 components). Probable Fs of the driver around 260Hz. The group delay rises above 10 centimeters (= 0.3ms) below 1kHz. Some roughness in the group delay curve due to diffractions.Spectrogram showing several reflections (t = 2.7ms and t= 3.6ms) and several diffractions (t = 0.8 ; 1.2 and 1.7ms).
N°3 : Le Dauphin sectorial horn + TAD2001 driver without rear coverN 3 : Le Dauphin sectorial horn + TAD2001 driver without rear coverThe distortion is low but around 1000Hz H3 is nearly at the same level than H2. H2 rises 14dB from 600Hz to 7kHz .The -3dB hole typical of the TD2001 is seen at 2000Hz. Also noticeable is the hole at the same frequency on the group delay curve. A series resistor will fill the holes at 2kHz seen on the 2 mentioned curves. It will also reduces distortion due to Le non linearity above 3kHz. (see for comparison N°9 for which the TD2001 is used with a 30ohm series resistor). Good pulse response. Moderate reflection level from mouth to throat. Few diffraction (t = 1.6ms and t = 4.2ms). Homs or submillisecond diffraction probably due to the dividers between sectors.
28

N°4 : Fostex A200 horn + ACR driver Low distortion, Low level of H3, H4, H5... The group delay rises above 10 centimeters ( = 0 3ms) below 800Hz Better to use that horn above 800Hz High level of( 0.3ms) below 800Hz. Better to use that horn above 800Hz. High level of submillisecond breaking modes or HF resonance above 7000Hz. Better to use a tweeter above 7kHz. Reflection from mouth to throat at 2.9ms and diffractions at t= 0.73; 1.27 and 1.7 ms) due to the several rapid variations of the vertical and horizontal profiles of the horn.
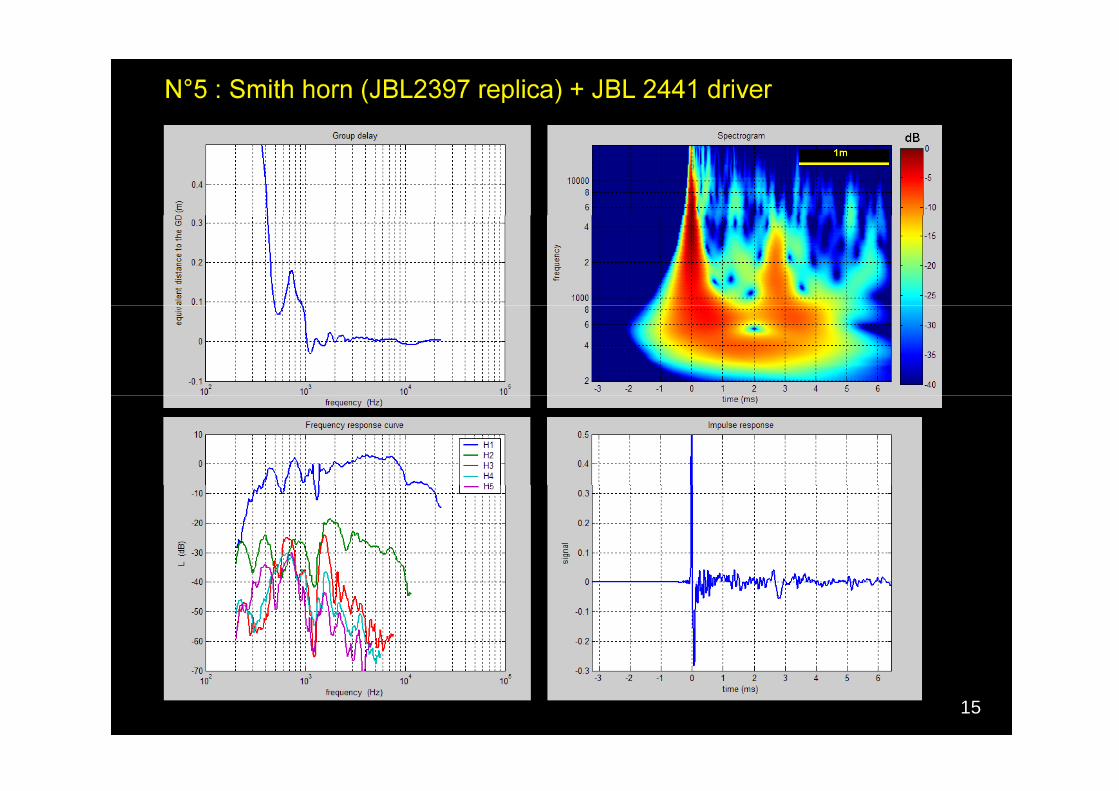
N°5 : Smith horn (JBL2397 replica) + JBL 2441 driver High distortion level for H3,H4, H5 distortion components below 2kHz (probably a problem with the driver).Some submillisecond HOMs above 6kHz.Rapid rise of the group delay below 1100Hz. Better to use that horn/driver couple between 1.1kHz and 8kHz.Large amount of reflected energy from mouth to throat. Large amount of diffraction.
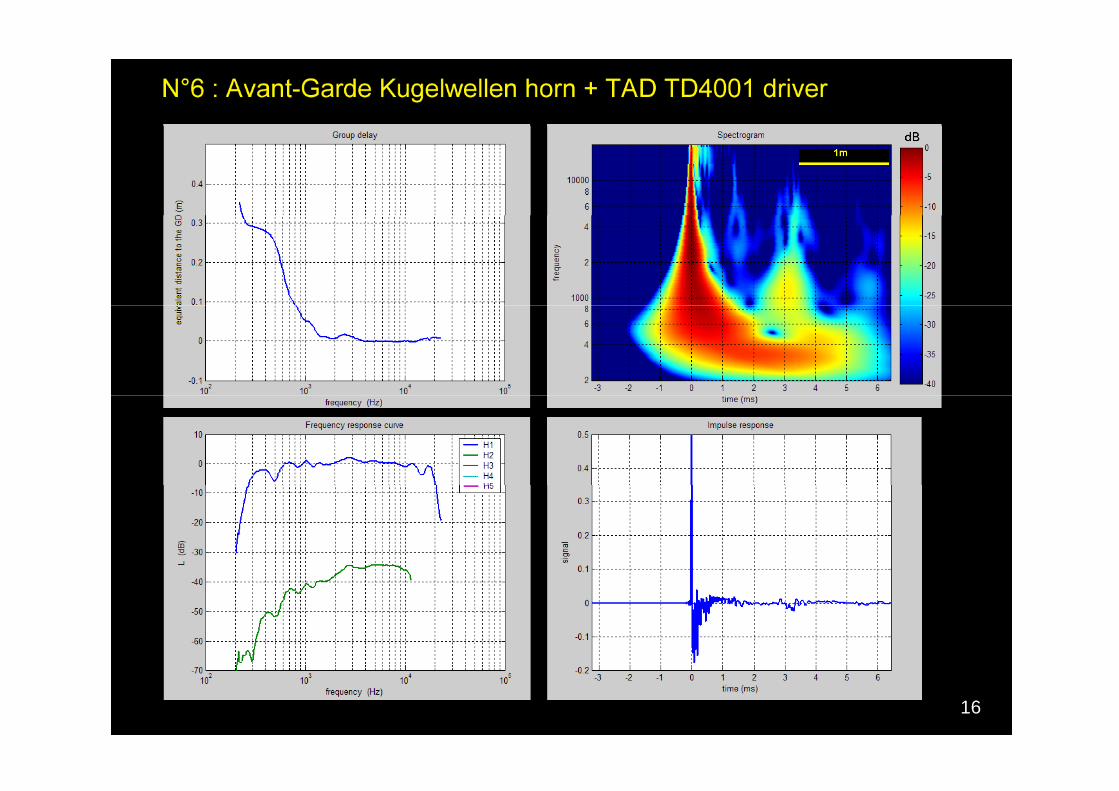
N°6 : Avant Garde Kugelwellen horn + TAD 4001 driverN 6 : Avant-Garde Kugelwellen horn + TAD 4001 driver Extremely low distortion. No H3, H4, H5 visible in the conditions of the measurement. Extended frequency response form 300Hz to 19kHz. Very smooth frequency response from 900Hz to 12kHz.Very smooth group delay curve. The group delay rises over 10centimetres ( = 0.3ms) below 700Hz. Better to use that horn above 700Hz. Very low level of reflected wave from mouth to throat and extremely low level of diffracted waves from the edge of the mouth. Some submillsecond HOMs(?) between 2 and 4kHz. Some breaking modes of the diaphragm or HF inner resonances of the driver above 10kHz. . It may be difficult to find a bass loudspeaker having the same level of fidelity.to d a bass oudspea e a g t e sa e e e o de ty
N°7 : Gaumont Kalee (Vitavox?) horn + Gaumont driver HF frequencies are attenuated above 5500Hz. The group delay rises above 10 centimeters ( = 0.3ms) below 1kHz.H3 H4 d H5 di t ti b l ti l t H2 b l 500H B tt tH3, H4 and H5 distortion becomes large comparatively to H2 below 500Hz. Better to use that couple horn/driver between 1kHz and 5.5kHz. Some diffraction and/or Homs between 4 and 8kHz 29

N°8 : Klangfilm square horn and acoustic lens + field coil Klangfilm driver Smooth frequency response curve with a little negative slope above 1200Hz. Extended frequency response from 350Hz to 10kHz. Low distortion. Rise of all distortion components below 400Hz (Fs of the driver around 250Hz).The group delay curve rises above 10centimeters ( = 0.3ms) below 1000Hz. Better to use that horn/driver couple between 1000Hz and 10kHz .p
N°9 : Musique Concrète J321 Le Cleac'h horn + TAD TD2001 driver Very low distortion. No H4 and H5 visible in the conditions of the measurement.E t d d f 300H t 20kH ith ll ti l b 8kHExtended response from 300Hz to 20kHz with a small negative slope above 8kHz. Very flat and smooth frequency response curve. The classic hole of the TD2001 response around 1900Hz is annulled by the use of a 30ohm serial resistor. The group delay curve is very smooth and rises over 10centimeters (= 0.3ms) below 800Hz. This horn can be used on axis from 800Hz to 20kHz without any tweeter. The cleanest impulse response. Very few reflected energy from mouth to throat . Extremely low level of diffraction, HOMs...No breaking modes of the diaphragm. It may be difficult to find a bass loudspeaker having the same level of fidelity.
N°10 : Acoustichorn AH300 conical horn + RCA 1428B driverN 10 : Acoustichorn AH300 conical horn + RCA 1428B driver Low H2 distortion level but rise of H3 below 3.5kHz. H3 is at the same level than H2 around 2500Hz and 1000Hz. Rise of all distortion components below 600Hz. Probable Fs of the driver around 300Hz. Frequency response curve displaying noticeable ripples between 1500Hz and 18kHz due a strong comb filter effect associated with very strong diffraction (or HOMs) visible
th t (N t th 3 di it ti f th ddi h b 2kH )on the spectrogram. (Note the 3 digitations of the reddish zone above 2kHz).A very wavy group delay curve (with a lot of "negative“ group delay artifacts due to the diffractions, HOMs...)The spectrogram of that conical horn show the less amount of reflected wave from mouth to throat (see the spot at +3.3ms between 2 and 8kHz) but in the same time it shows the largest ( p ) gamount of diffraction + HOMs (for time <1.5ms). The worst possible impulse response!
30

N°11 : Electrovoice 6040 horn (old version) + Altec 288-16G driverExtended frequency response but with a positive slope from 230Hz to 15kHz.Smooth f B tt t th t h b t 900H d 8kH Lfrequency response curve. Better to use that horn between 900Hz and 8kHz. Low distortion. Very low H3 over 400Hz. Note the 24dB rise of the level of the H2 component from 700Hz to 10kHz. The group delay curve rises above 10 centimeters (= .3ms) below 600Hz.Low level of reflected energy from mouth to throat. Few diffractions between 1500Hz and 4kHz around t = .7ms and 1.4ms. HOMs above 8kHz.
N°12 : JBL 2353 biradial horn + Altec Lansing 288-8K driverSmooth frequency response between 600Hz and 8kHz Low distortion No H3 aboveSmooth frequency response between 600Hz and 8kHz. Low distortion. No H3 above 1000Hz but rapid rise below 900Hz. The group delay curve rises above 10 centimeters (= 0.3ms) below 900Hz. Better to use that horn between 900Hz and 8kHz. Reasonable amount of reflected energy from mouth to throat. Some diffractions. Noticeable breaking modes or HOMs above 8kHz.
N°13 : Stereolab tractrix horn + Vitavox S2 driver A bell shape frequency response curve with a smooth slope between 2300Hz and 15kHz (easy to equalize). Low distortion (only H2 and H3 components are visible in the15kHz (easy to equalize). Low distortion (only H2 and H3 components are visible in the condition of the measurement). Very low H3 level. Some rise of H2 and H3 below 500Hz seemingly indicating an Fs of the driver around 320Hz.A very smooth group delay curve but with a bump between 1kHz and 3kHz (related to some .7ms early reflection/diffraction seen on the spectrogram, probably due to the part between diaphragm and throat of the horn)between diaphragm and throat of the horn) . Clean frequency response . Some reflected energy from mouth to throat due to the unbaffled truncated mouth of that small horn.
31
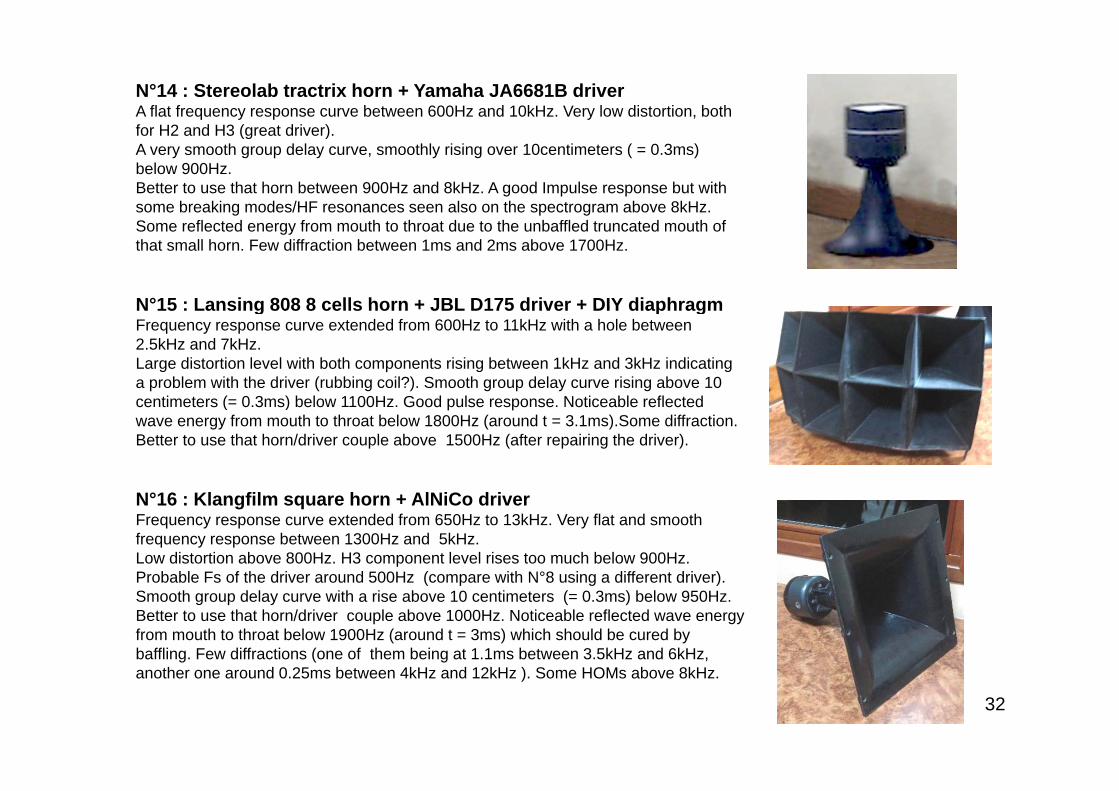
N°14 : Stereolab tractrix horn + Yamaha JA6681B driver A flat frequency response curve between 600Hz and 10kHz. Very low distortion, both f H2 d H3 ( t d i )for H2 and H3 (great driver).A very smooth group delay curve, smoothly rising over 10centimeters ( = 0.3ms) below 900Hz.Better to use that horn between 900Hz and 8kHz. A good Impulse response but with some breaking modes/HF resonances seen also on the spectrogram above 8kHz. Some reflected energy from mouth to throat due to the unbaffled truncated mouth of that small horn. Few diffraction between 1ms and 2ms above 1700Hz.
N°15 : Lansing 808 8 cells horn + JBL D175 driver + DIY diaphragmN 15 : Lansing 808 8 cells horn + JBL D175 driver + DIY diaphragm Frequency response curve extended from 600Hz to 11kHz with a hole between 2.5kHz and 7kHz. Large distortion level with both components rising between 1kHz and 3kHz indicating a problem with the driver (rubbing coil?). Smooth group delay curve rising above 10
i ( 0 3 ) b l 1100H G d l N i bl fl dcentimeters (= 0.3ms) below 1100Hz. Good pulse response. Noticeable reflected wave energy from mouth to throat below 1800Hz (around t = 3.1ms).Some diffraction. Better to use that horn/driver couple above 1500Hz (after repairing the driver).
N°16 : Klangfilm square horn + AlNiCo driver Frequency response curve extended from 650Hz to 13kHz. Very flat and smooth frequency response between 1300Hz and 5kHz.Low distortion above 800Hz. H3 component level rises too much below 900Hz. Probable Fs of the driver around 500Hz (compare with N°8 using a different driver)Probable Fs of the driver around 500Hz (compare with N°8 using a different driver). Smooth group delay curve with a rise above 10 centimeters (= 0.3ms) below 950Hz. Better to use that horn/driver couple above 1000Hz. Noticeable reflected wave energy from mouth to throat below 1900Hz (around t = 3ms) which should be cured by baffling. Few diffractions (one of them being at 1.1ms between 3.5kHz and 6kHz, another one around 0.25ms between 4kHz and 12kHz ). Some HOMs above 8kHz.
32

Semiquantitative sorting ofSemiquantitative sorting of the 16 horns based on thethe 16 horns based on the level of the main reflectionslevel of the main reflections
and the main diffractions
33
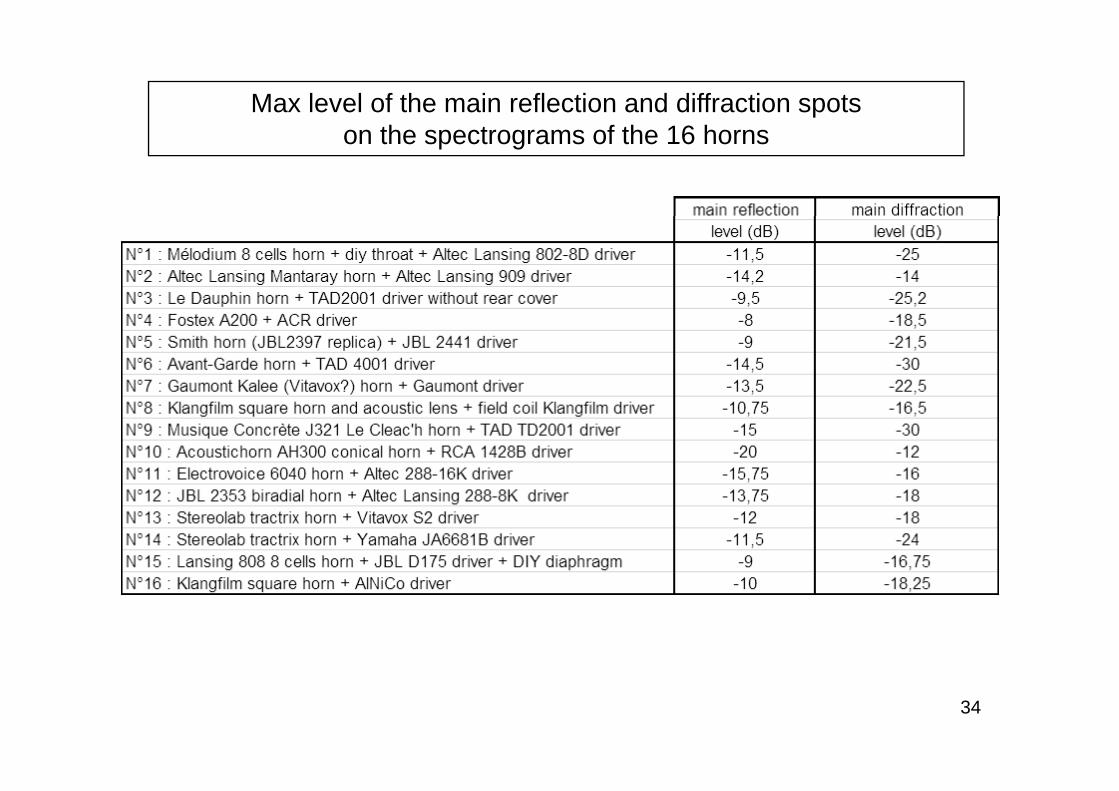
Max level of the main reflection and diffraction spots th t f th 16 hon the spectrograms of the 16 horns
34

The 16 horns have been sorted in 5 classes according to the level of their main reflection and diffraction at the microphone
35

Sorting in 5 classes considering only theSorting in 5 classes considering only the level of the main reflection and diffraction
( 1 = best 5 = worst )( 1 = best, 5 = worst )
36