measures of central tendency - henry county public … title: measures of central tendency brief...
TRANSCRIPT
1
Title: Measures of Central Tendency
Brief Overview: In this unit, students will study the various representations for data analysis. Students will look at measures of central tendency and variance, line plots, frequency distribution tables, and interpretation, application, representation and presentation of data.
NCTM Content Standard/National Science Education Standard:
Data Analysis and Probability • Formulate questions, design studies, and collect data about a characteristic
shared by two populations or different characteristics within one population.
• Select, create, and use appropriate graphical representations of data, including line plot and frequency tables.
• Use observations about differences between two or more samples to make conjectures about the populations from which the samples were taken.
• Use conjectures to formulate new questions and plan new studies to answer them.
Reasoning and Proof
• recognize reasoning and proof as fundamental aspects of mathematics; • make and investigate mathematical conjectures; • develop and evaluate mathematical arguments and proofs; • and use various types of reasoning and methods of proof.
Communication • organize and consolidate their mathematical thinking through
communication; • communicate their mathematical thinking coherently and clearly to peers,
teachers, and others; • analyze and evaluate the mathematical thinking and strategies of others; • he language of mathematics to express mathematical ideas precisely.
Connections • recognize and use connections among mathematical ideas; • understand how mathematical ideas interconnect and build on one another
to produce a coherent whole; • and apply mathematics in contexts outside of mathematics.
Representation • create and use representations to organize, record, and communicate
mathematical ideas; • select, apply, and translate among mathematical representations to solve
problems; • use representations to model and interpret physical, social, and
mathematical phenomena.

2
Grade/Level:
Grades 6 – 8, Algebra I Duration/Length:
Three 45 – minute lessons plus additional time to complete independent assessments and presentations
Student Outcomes:
Students will: • Gather data • Find measures of central tendency and variance • Create a line plot • Create frequency table • Analyze data • Interpret data and draw conclusions • Derive data from and apply data to personal experience • Present data and formulate questions
Materials and Resources:
• Rulers • Graphing calculator • Measuring tapes • Index cards (2 colors) • Website:
http://www.nba.com/statistics/player/Scoring.jsp?league=00&season=22005&conf=OVERALL&position=0&splitType=9&splitScope=GAME&qualified=Y&yearsExp=–1&splitDD=
• Website: Surgeon General’s recommendation http://www.cdc.gov/nccdphp/sgr/summary.html
• Worksheets: 1. Exercise! 2. Calculator directions 3. NBA’s Top Thirty 4. Comparing East and West 5. Hand Span 6. Finding a Job 7. Survey Questions 8. Team Directions 9. Rubric for Constructing Data Analysis Questions 10. Peer Evaluation Sheet 11. Rubric for Gathering Data using a Line Plot
3
Development/Procedures: Lesson 1: Preassessment – Review measures of central tendency. As the students enter the classroom, hand the boys an index card of
one color and the girls an index card of a different color. Have the students brainstorm to list topics that can be discussed using numbers, such as test scores, number of CD’s, cost of video games, baby sitting fees, shoe size, etc. Discuss why data collection and analysis are important.
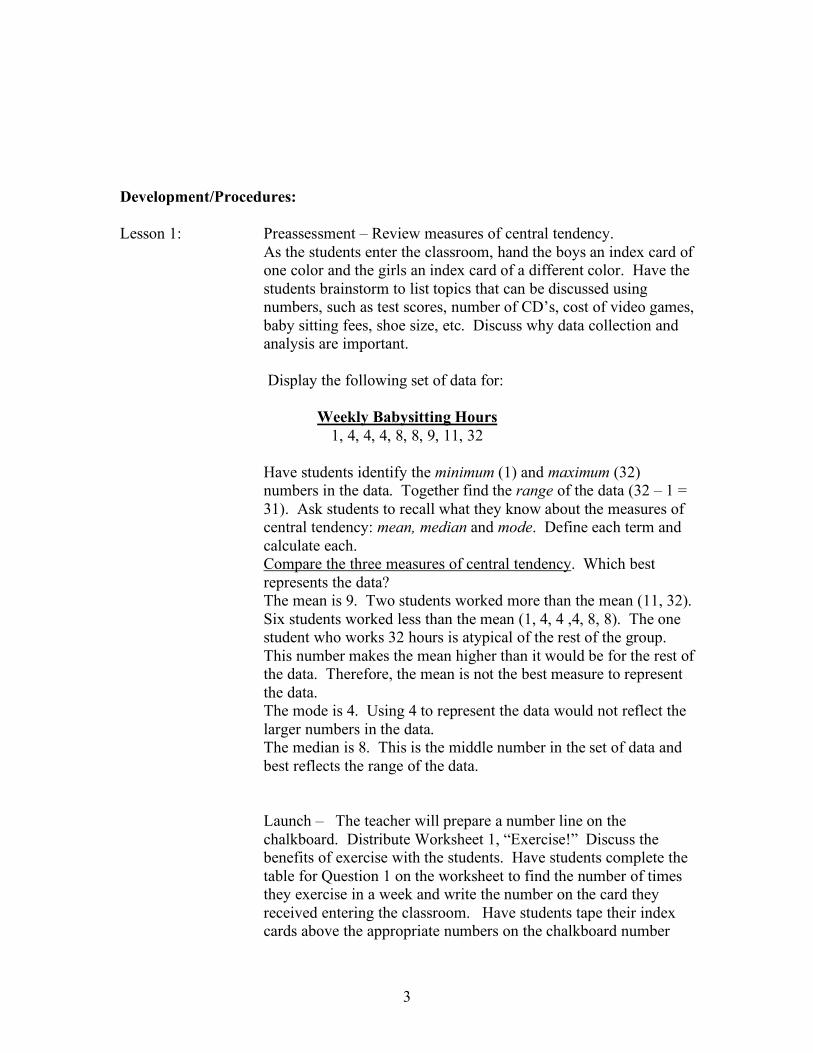
Display the following set of data for:
Weekly Babysitting Hours 1, 4, 4, 4, 8, 8, 9, 11, 32
Have students identify the minimum (1) and maximum (32)
numbers in the data. Together find the range of the data (32 – 1 = 31). Ask students to recall what they know about the measures of central tendency: mean, median and mode. Define each term and calculate each.
Compare the three measures of central tendency. Which best represents the data?
The mean is 9. Two students worked more than the mean (11, 32). Six students worked less than the mean (1, 4, 4 ,4, 8, 8). The one student who works 32 hours is atypical of the rest of the group. This number makes the mean higher than it would be for the rest of the data. Therefore, the mean is not the best measure to represent the data.
The mode is 4. Using 4 to represent the data would not reflect the larger numbers in the data.
The median is 8. This is the middle number in the set of data and best reflects the range of the data.
Launch – The teacher will prepare a number line on the
chalkboard. Distribute Worksheet 1, “Exercise!” Discuss the benefits of exercise with the students. Have students complete the table for Question 1 on the worksheet to find the number of times they exercise in a week and write the number on the card they received entering the classroom. Have students tape their index cards above the appropriate numbers on the chalkboard number

4
line. When all cards have been placed, discuss that they have made a frequency distribution in the form of a line plot on the chalkboard.
Teacher Facilitation: Instruct students to copy the line plot
(Question 2) and fill in the class data in the frequency table (Question 3) on their worksheets. Students will analyze the data and fill in the minimum, maximum, range and the three measures of central tendency on the worksheet (Question 4).
Direct the students to compare the line plot and the frequency table
to see which data display they think makes it easier to find the mean, median and mode using the table in Question 5 on the worksheet. Compare student responses.
Have students compare the measures of central tendency and
answer Question 6. After they have written their responses, discuss which of the measures of central tendency best reflects the data and why.
Question 7 -BCR: Instruct students to read the findings of the
UNC study and answer question 5 independently. Remind them to include specific data from the frequency table and/or line plot and show each step of their thinking when justifying their answer.
Reteach/Extension - Have the students create the new frequency
table using only their color from the line plot on the board (Question 7) and answer Questions 8 and 9 independently for homework or during class, as time permits.
Student Application –Students will complete the worksheet,
“Exercise!:, explaining the similarities and differences in the exercise data collected as a class.
Embedded Assessment – Have the students use the data provided
on Worksheet 3, “NBA’s Top Thirty” to independently determine the measures of central tendency for the heights of the top thirty scorers in the NBA. Collect the students’ work at the end of the class period.
Lesson 2: Preassessment – Review measures of central tendency by referring back to how the mean, median, and mode were calculated for the Weekly Babysitting Hours in Lesson 1.

5
Launch – Tell students that now we will learn to use the graphing calculator for data analysis. Help them to recall other skills that they already know on the graphing calculator.
Teacher Facilitation - Instruct students on how to use a graphing calculator to compute the mean, median, and mode. Directions for TI-84 are provided on Worksheet 2. Use the calculator to compute the Hours Spent Babysitting Each Week data to show the same results found in Lesson 1.
Student Application - The students will work with a partner to
measure their hand spans. The teacher will assist the class in determining the minimum and maximum hand spans. As each student reports his/her measure to the class, all students will place tally marks on the frequency table on Worksheet 5, Hand Span. The students should complete the frequency column by adding up their tally marks.
The teacher will explore finding the mean for the hand spans in the
class. As discussion develops, students will discover the hand span column and the frequency column both play a role in computing the mean. Students will be instructed to multiply the frequency times the hand span measure for each hand span size. Those products are then added to get the sum that is then divided by the number of students in the class.
In determining the median, students should be reminded that the
numbers in the frequency column represent the number of students in the class.
Embedded Assessment - Students will complete the questions. Reteach/Extension - The teacher will lead a discussion about the
heights of the thirty top scorers in the NBA. By looking at the data on Worksheet 3, allow students time to discuss if the heights and numbers of games played would play a role in which players score the most points. The students should be asked to predict which league scores more and which league has taller players.
The students will sort the players into WEST and EAST and
complete the table on Worksheet 4. Students will answer the questions.
Embedded Assessment – Students will work independently to
complete Worksheet 6, “Finding a Job”. In this activity, students will try to help an older sister research the job market based on the
6
data that is provided. They will also have to use mathematics to justify their reasoning for their job recommendation.
Lesson 3 Preassessment – Revisit the “Finding a Job” worksheet. Direct
students to verbalize the steps they followed to find the mean and median salaries of the two companies. Prompt them to weigh the pros and cons of taking a job at either company using the data.
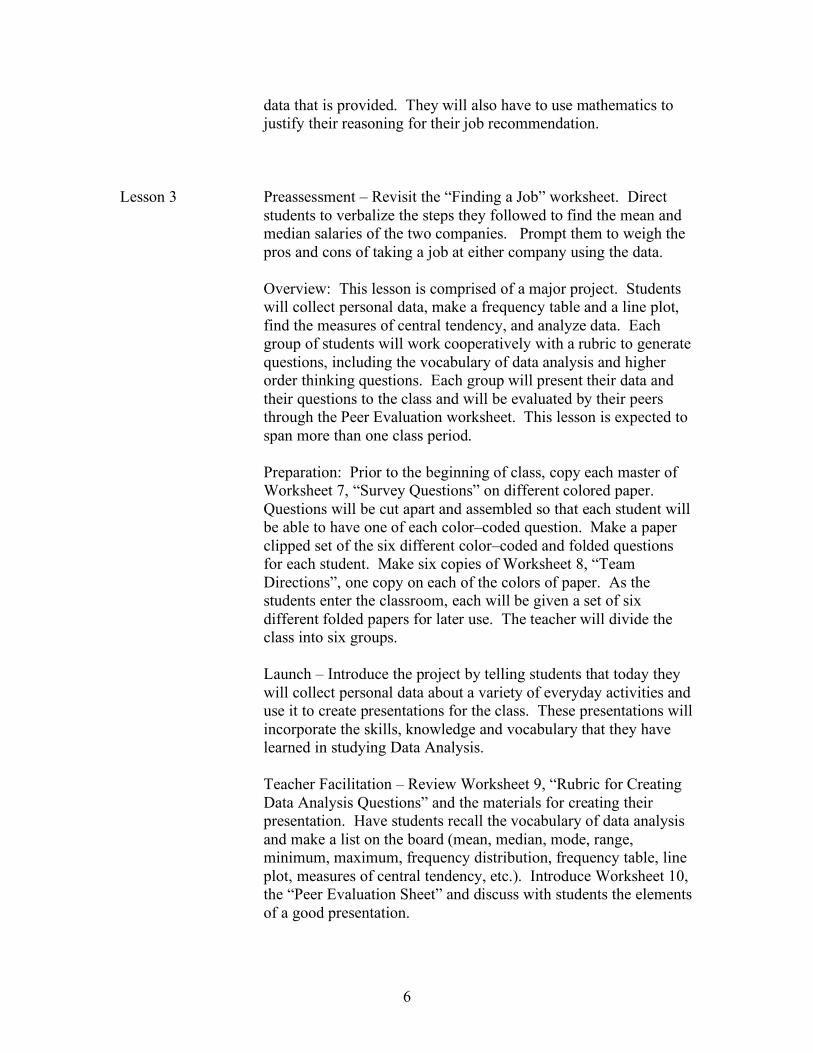
Overview: This lesson is comprised of a major project. Students
will collect personal data, make a frequency table and a line plot, find the measures of central tendency, and analyze data. Each group of students will work cooperatively with a rubric to generate questions, including the vocabulary of data analysis and higher order thinking questions. Each group will present their data and their questions to the class and will be evaluated by their peers through the Peer Evaluation worksheet. This lesson is expected to span more than one class period.
Preparation: Prior to the beginning of class, copy each master of
Worksheet 7, “Survey Questions” on different colored paper. Questions will be cut apart and assembled so that each student will be able to have one of each color–coded question. Make a paper clipped set of the six different color–coded and folded questions for each student. Make six copies of Worksheet 8, “Team Directions”, one copy on each of the colors of paper. As the students enter the classroom, each will be given a set of six different folded papers for later use. The teacher will divide the class into six groups.
Launch – Introduce the project by telling students that today they
will collect personal data about a variety of everyday activities and use it to create presentations for the class. These presentations will incorporate the skills, knowledge and vocabulary that they have learned in studying Data Analysis.
Teacher Facilitation – Review Worksheet 9, “Rubric for Creating
Data Analysis Questions” and the materials for creating their presentation. Have students recall the vocabulary of data analysis and make a list on the board (mean, median, mode, range, minimum, maximum, frequency distribution, frequency table, line plot, measures of central tendency, etc.). Introduce Worksheet 10, the “Peer Evaluation Sheet” and discuss with students the elements of a good presentation.
7
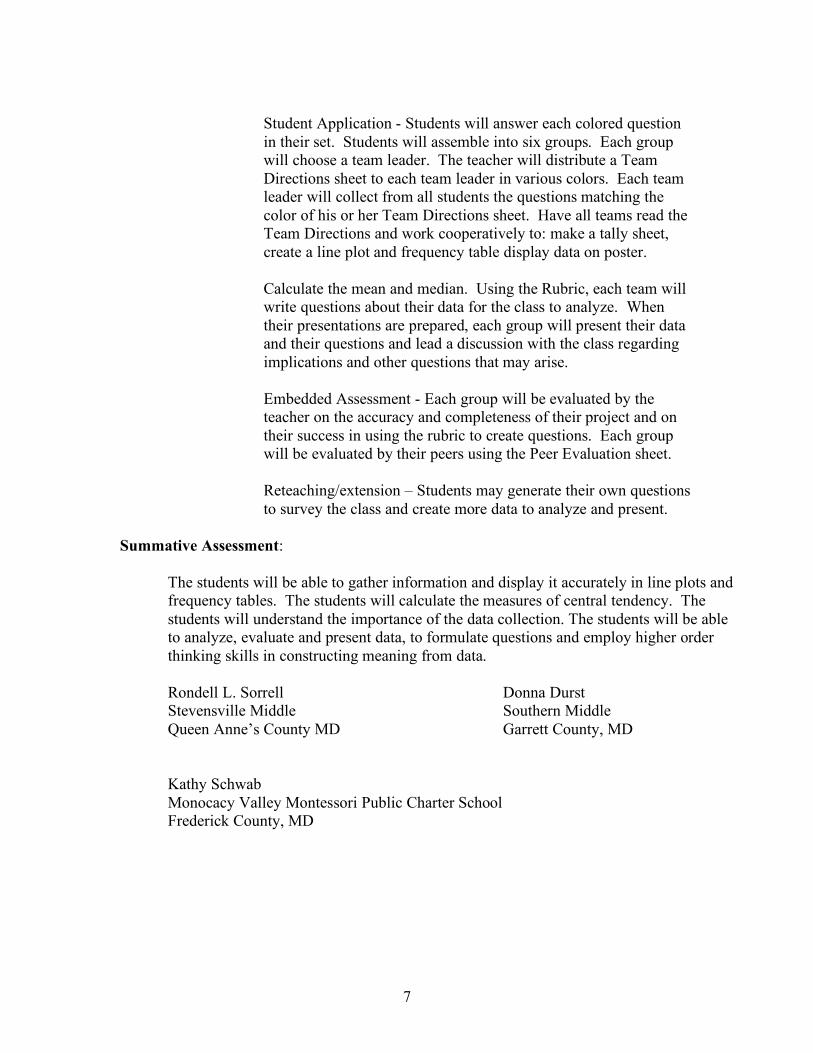
Student Application - Students will answer each colored question
in their set. Students will assemble into six groups. Each group will choose a team leader. The teacher will distribute a Team Directions sheet to each team leader in various colors. Each team leader will collect from all students the questions matching the color of his or her Team Directions sheet. Have all teams read the Team Directions and work cooperatively to: make a tally sheet, create a line plot and frequency table display data on poster.
Calculate the mean and median. Using the Rubric, each team will
write questions about their data for the class to analyze. When their presentations are prepared, each group will present their data and their questions and lead a discussion with the class regarding implications and other questions that may arise.
Embedded Assessment - Each group will be evaluated by the
teacher on the accuracy and completeness of their project and on their success in using the rubric to create questions. Each group will be evaluated by their peers using the Peer Evaluation sheet.
Reteaching/extension – Students may generate their own questions
to survey the class and create more data to analyze and present. Summative Assessment:
The students will be able to gather information and display it accurately in line plots and frequency tables. The students will calculate the measures of central tendency. The students will understand the importance of the data collection. The students will be able to analyze, evaluate and present data, to formulate questions and employ higher order thinking skills in constructing meaning from data.
Rondell L. Sorrell Donna Durst
Stevensville Middle Southern Middle Queen Anne’s County MD Garrett County, MD
Kathy Schwab Monocacy Valley Montessori Public Charter School Frederick County, MD

8
Worksheet 1
EXERCISE!
The benefits of exercise to everyone’s health are proclaimed constantly on television, in exercise equipment displays and, of course, in education. Exercise brings strong muscles, abundant energy, and a heightened sense of well being to each day. The Surgeon General recommends vigorous physical activity most days of each week for optimal health. 1. Fill in the table below with the number of times you exercised during the past
seven days.
Sample activities How many times in the past week roller–blading, roller–skating, skateboarding, bicycling, etc.
Baseball, softball, basketball, soccer, football, etc. jogging, walking, karate, jumping rope, gymnastics, dancing, swimming, skiing, etc.
any activities that raised your heart rate for 20 minutes (mowing the lawn, chasing the dog, etc.)
Total 2. Copy the line plot of the class exercise data from the chalkboard to the line below: _____________________________________________________________________
9
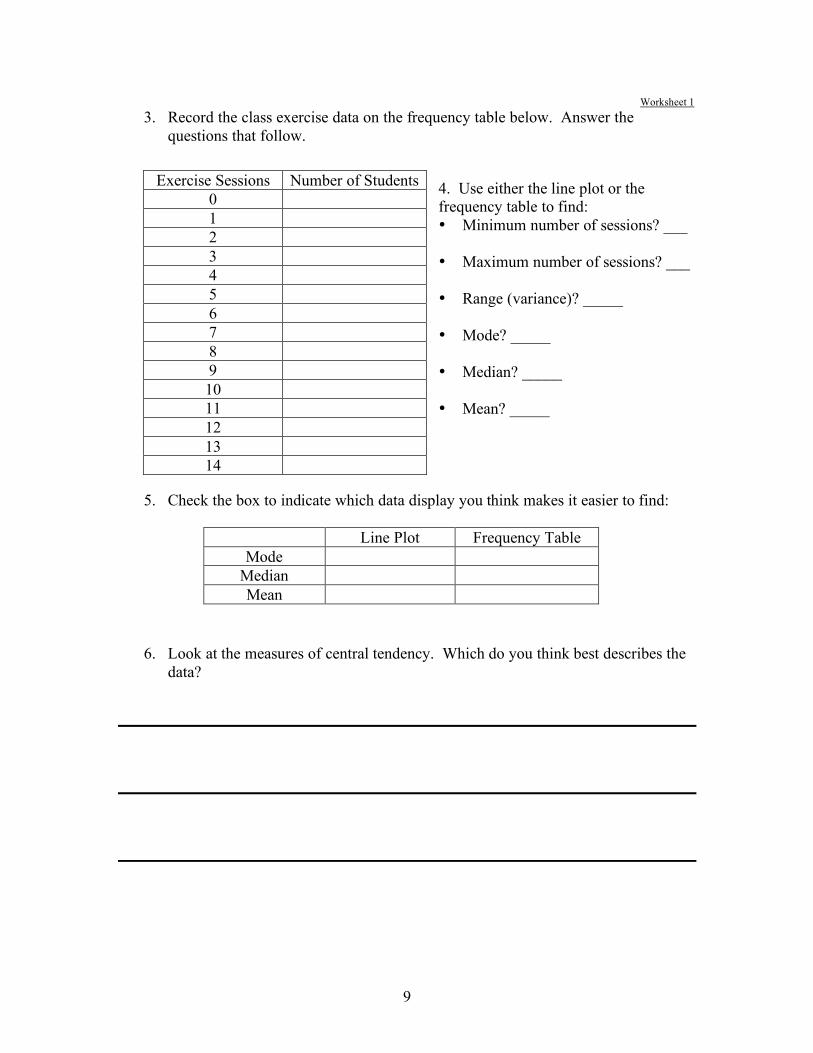
Worksheet 1 3. Record the class exercise data on the frequency table below. Answer the
questions that follow.
4. Use either the line plot or the frequency table to find: • Minimum number of sessions? ___ • Maximum number of sessions? ___ • Range (variance)? _____ • Mode? _____ • Median? _____ • Mean? _____
5. Check the box to indicate which data display you think makes it easier to find:
Line Plot Frequency Table Mode
Median Mean
6. Look at the measures of central tendency. Which do you think best describes the data?
Exercise Sessions Number of Students 0 1 2 3 4 5 6 7 8 9 10 11 12 13 14

10
Worksheet 1
7. Look at the class exercise line plot. Create a new frequency table using only the data from the index cards that are the same color as the one you posted.
8. What is the: • Minimum number of sessions? ___ • Maximum number of sessions? ___ • Range (variance)? _____ • Mode? _____ • Median? _____ • Mean? _____
Exercise Sessions Number of Students 0 1 2 3 4 5 6 7 8 9 10 11 12 13 14
11
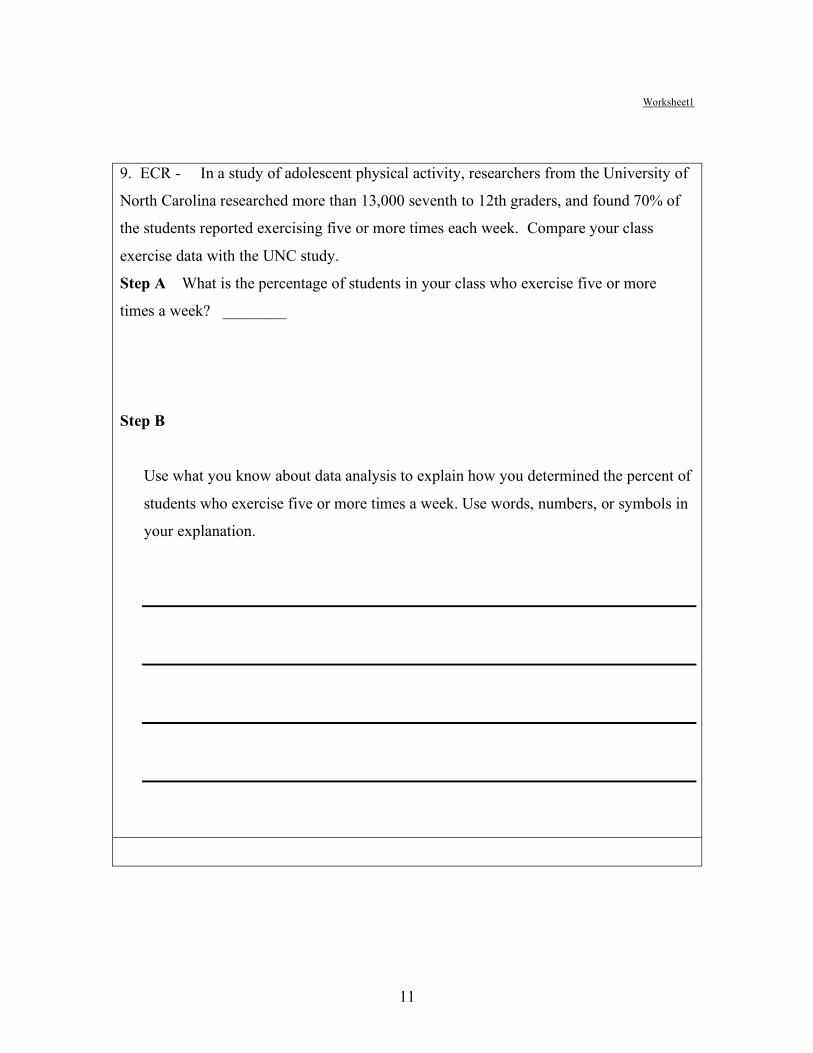
Worksheet1 9. ECR - In a study of adolescent physical activity, researchers from the University of
North Carolina researched more than 13,000 seventh to 12th graders, and found 70% of
the students reported exercising five or more times each week. Compare your class
exercise data with the UNC study.
Step A What is the percentage of students in your class who exercise five or more
times a week? ________
Step B
Use what you know about data analysis to explain how you determined the percent of
students who exercise five or more times a week. Use words, numbers, or symbols in
your explanation.

12
Worksheet 1
10. Suppose the physical education teacher in your school predicted that 75% of the boys and 40% of the girls exercise at least 5 times each week. Compare the percentage of students in your group with the teacher’s prediction.

13
Worksheet 2
CALCULATOR DIRECTIONS
1. on calculator 2. Hit STAT button 3. 1 (edit) 4. arrow up to (
1L )
5. press clear 6. press enter 7. insert data from table by typing each piece of data and press enter 8. press STAT button 9. right arrow to CALC 10. press 1 enter (1 VAR STAT) 11. left parenthesis button ( 12. hit 2nd button 13. press #1 (
1L )
14. right parenthesis button ) 15. press enter

14
Worksheet 3
NBA’S TOP THIRTY SCORERS
Players Games Played PPG Height in feet Conference Kobe Bryant , LAL 80 35.4 6’ 6” Western
Allen Iverson , PHI 72 33 6’ Eastern
LeBron James , CLE 79 31.4 6’ 8” Eastern
Gilbert Arenas , WAS 80 29.3 6’ 4” Eastern Dwyane Wade , MIA 75 27.2 6’ 4” Eastern
Paul Pierce , BOS 79 26.8 6’ 6” Eastern
Dirk Nowitzki , DAL 81 26.6 7’ Western Carmelo Anthony , DEN 80 26.5 6’ 8” Western Michael Redd , MIL 80 25.4 6’ 6” Eastern
Ray Allen , SEA 78 25.1 6’ 5” Western
Elton Brand , LAC 79 24.7 6’ 8” Western
Vince Carter , NJN 79 24.2 6’ 6” Eastern Jason Richardson , GSW 75 23.2 6’ 6” Western Chris Bosh , TOR 70 22.4 6’ 10” Eastern
Shawn Marion , PHX 81 21.8 6’ 7 “ Western
Kevin Garnett , MIN 76 21.8 6’ 11” Western Mike Bibby , SAC 82 21.1 6’ 2” Western Antawn Jamison , WAS 82 20.5 6’ 9” Eastern
Pau Gasol , MEM 80 20.4 7’ Western
Mike James , TOR 79 20.3 6’ 2” Eastern
Chris Webber , PHI 75 20.2 6’ 10” Eastern
Joe Johnson , ATL 82 20.2 6’ 7” Eastern
Richard Hamilton , DET 80 20.1 6’ 7” Eastern Rashard Lewis , SEA 78 20.1 6’ 10” Western
Richard Jefferson , NJN 78 19.5 6’ 7” Eastern
Ricky Davis , MIN-–BOS 78 19.4 6’ 7” Western
Tony Parker , SAS 80 18.9 6’ 2” Western
Steve Nash , PHX 79 18.8 6’ 3” Western AL Harrington , ATL 76 18.6 6’ 9” Eastern Tim Duncan , SAS 80 18.6 6’ 11” Western
15
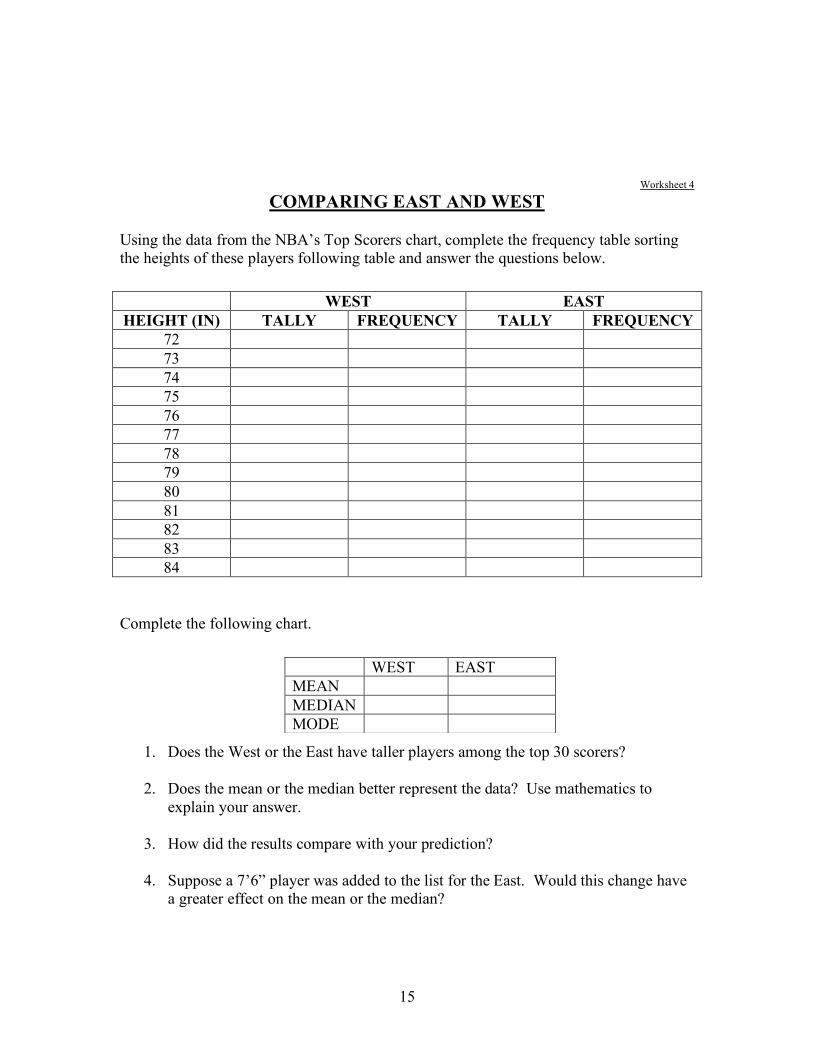
Worksheet 4
COMPARING EAST AND WEST
Using the data from the NBA’s Top Scorers chart, complete the frequency table sorting the heights of these players following table and answer the questions below.
WEST EAST HEIGHT (IN) TALLY FREQUENCY TALLY FREQUENCY
72 73 74 75 76 77 78 79 80 81 82 83 84
Complete the following chart. 1. Does the West or the East have taller players among the top 30 scorers?
2. Does the mean or the median better represent the data? Use mathematics to explain your answer.
3. How did the results compare with your prediction?
4. Suppose a 7’6” player was added to the list for the East. Would this change have
a greater effect on the mean or the median?
WEST EAST MEAN MEDIAN MODE
16
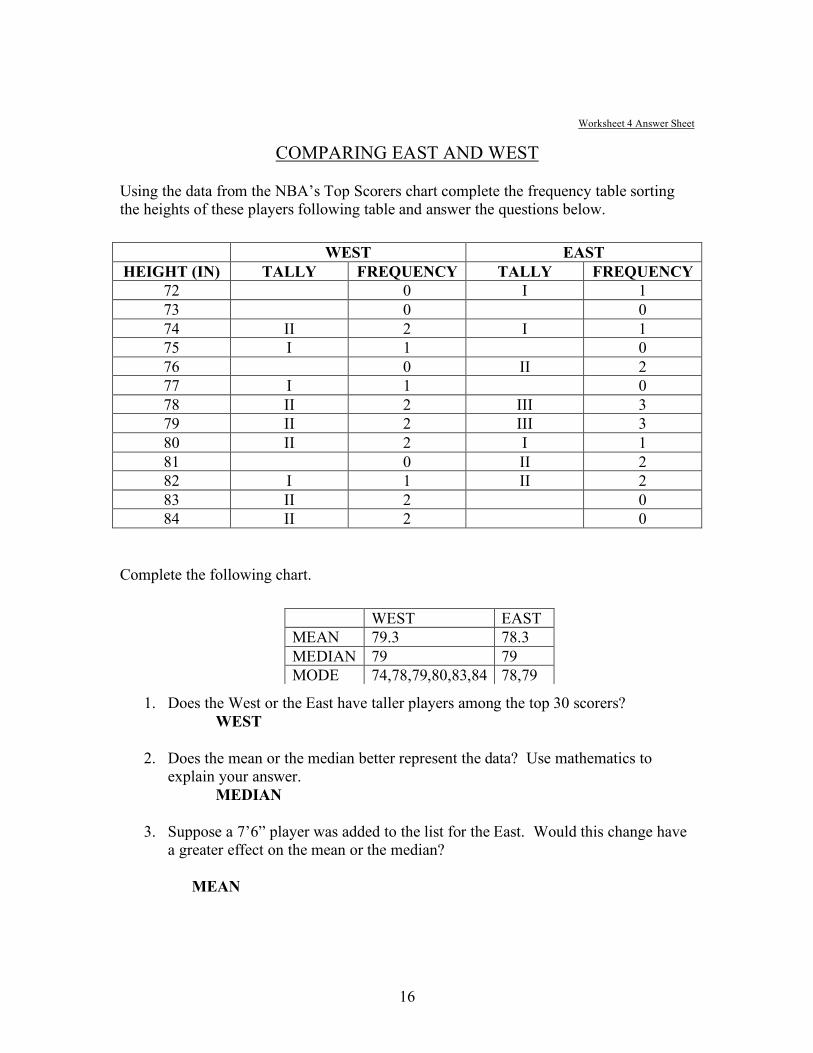
Worksheet 4 Answer Sheet
COMPARING EAST AND WEST Using the data from the NBA’s Top Scorers chart complete the frequency table sorting the heights of these players following table and answer the questions below.
WEST EAST HEIGHT (IN) TALLY FREQUENCY TALLY FREQUENCY
72 0 I 1 73 0 0 74 II 2 I 1 75 I 1 0 76 0 II 2 77 I 1 0 78 II 2 III 3 79 II 2 III 3 80 II 2 I 1 81 0 II 2 82 I 1 II 2 83 II 2 0 84 II 2 0
Complete the following chart. 1. Does the West or the East have taller players among the top 30 scorers? WEST 2. Does the mean or the median better represent the data? Use mathematics to
explain your answer. MEDIAN
3. Suppose a 7’6” player was added to the list for the East. Would this change have a greater effect on the mean or the median?
MEAN
WEST EAST MEAN 79.3 78.3 MEDIAN 79 79 MODE 74,78,79,80,83,84 78,79

17
Worksheet 5
HAND SPAN Name: _________________ Date: __________________ Stretch your fingers apart as much as possible and use a centimeter ruler to measure the distance from your thumb tip to your pinky tip to the nearest centimeter. Use the hand that you use to write. Complete the hand span table.
Hand Span (cm) Tally Frequency
1. What is the range of hand spans? 2. Find the mean and the median.
3. Which better represents the hand spans in your class? 4. Do you think there is a positive correlation between hand span and height?

18
Worksheet 6
FINDING A JOB
Name: _________________ Date: __________________
Your older sister is hoping to get a job as a video game programmer. There are two nearby companies that are accepting applications. You researched the companies for her and found that they both have good working conditions and a good benefit package. You were able to find how many employees each company has and the salary scale. Help her make an educated decision. Action Video Company (AVC) Number of Employees 23 4 2 1
Yearly Salary $25,000 $30,000 $40,000 $120,000
Graphics Video Company (GVC) Number of Employees 20 14 12 10 4
Yearly Salary $24,000 $26,000 $30,000 $36,000 $45,000
Complete the chart.
AVC GVC Mean
Median Mode
1. Does the mean or the median better represent the data? Use mathematics to
explain your answer. 2. Does GVC having more employees affect the mean and/or the median? Explain 3. Does GVC having more salary steps affect the mean and/or the median? Explain
4. Would you recommend that your sister apply to AVC or GVC? Why?

19
Worksheet 6
5. Suppose the highest salary step at GVC was given a raise to $60,000. Would that change have a greater effect on the mean or the median? Explain using words and/or symbols.

20
Worksheet 6 Answer Sheet
FINDING A JOB Name: _________________ Date: __________________
Your older sister is hoping to get a job as a video game programmer. There are two nearby companies that are accepting applications. You researched the companies for her and found that they both have good working conditions and a good benefit package. You were able to find how many employees each company has and the salary scale. Help her make an educated decision. Action Video Company (AVC) Number of Employees 23 4 2 1
Yearly Salary $25,000 $30,000 $40,000 $120,000
Graphics Video Company (GVC) Number of Employees 20 14 12 10 4
Yearly Salary $24,000 $26,000 $30,000 $36,000 $45,000
Complete the chart.
AVC GVC Mean 29833.33 29066.67
Median 25000 26000 Mode 25000 24000
1. Does the mean or the median better represent the data? Use mathematics to
explain your answer. MEDIAN 2. Does GVC having more employees affect the mean and/or the median? Explain NO, BECAUSE THE DATA IS EVENLY DISTRIBUTED AND
CALCUALTED 3. Does GVC having more salary steps affect the mean and/or the median? Explain YES, BECAUSE THE HIGHER SALARRY COULD SKEW THE MEAN 4. Would you recommend that your sister apply to AVC or GVC? Why? GVC, THE PAY RATES ARE CLOSER TOGETHER AND MORE ROOM
FOR ADVANCING 5. Suppose the highest salary step at GVC was given a raise to $60,000. Would that
change have a greater effect on the mean or the median? Explain using words and/or symbols.
MEAN

21
Worksheet 7A
SURVEY QUESTIONS
Use a measuring tape and find the distance from the tip of your nose to the end of your longest fingertip.
Use a measuring tape and find the distance from the tip of your nose to the end of your longest fingertip.
Use a measuring tape and find the distance from the tip of your nose to the end of your longest fingertip.
Use a measuring tape and find the distance from the tip of your nose to the end of your longest fingertip.
Use a measuring tape and find the distance from the tip of your nose to the end of your longest fingertip.
Use a measuring tape and find the distance from the tip of your nose to the end of your longest fingertip.
Use a measuring tape and find the distance from the tip of your nose to the end of your longest fingertip.
Use a measuring tape and find the distance from the tip of your nose to the end of your longest fingertip.
Use a measuring tape and find the distance from the tip of your nose to the end of your longest fingertip.
Use a measuring tape and find the distance from the tip of your nose to the end of your longest fingertip.
22
Worksheet 7B
How many people live in your home?
How many people live in your home?
How many people live in your home?
How many people live in your home?
How many people live in your home?
How many people live in your home?
How many people live in your home?
How many people live in your home?
How many people live in your home?
How many people live in your home?
How many people live in your home?
How many people live in your home?
How many people live in your home?
How many people live in your home?
How many people live in your home?
How many people live in your home?
How many people live in your home?
How many people live in your home?

23
Worksheet 7C
How much money do you spend on music or video games in a month?
How much money do you spend on music or video games in a month?
How much money do you spend on music or video games in a month?
How much money do you spend on music or video games in a month?
How much money do you spend on music or video games in a month?
How much money do you spend on music or video games in a month?
How much money do you spend on music or video games in a month?
How much money do you spend on music or video games in a month?
How much money do you spend on music or video games in a month?
How much money do you spend on music or video games in a month?
How much money do you spend on music or video games in a month?
How much money do you spend on music or video games in a month?

24
Worksheet 7D
In an average household, the shower sprays about six gallons of water per minute. About how many gallons of water do you use every time you take a shower?
In an average household, the shower sprays about six gallons of water per minute. About how many gallons of water do you use every time you take a shower?
In an average household, the shower sprays about six gallons of water per minute. About how many gallons of water do you use every time you take a shower?
In an average household, the shower sprays about six gallons of water per minute. About how many gallons of water do you use every time you take a shower?
In an average household, the shower sprays about six gallons of water per minute. About how many gallons of water do you use every time you take a shower?
In an average household, the shower sprays about six gallons of water per minute. About how many gallons of water do you use every time you take a shower?
In an average household, the shower sprays about six gallons of water per minute. About how many gallons of water do you use every time you take a shower?
In an average household, the shower sprays about six gallons of water per minute. About how many gallons of water do you use every time you take a shower?

25
Worksheet 7E
How many times do you eat junk food in a week?
How many times do you eat junk food in a week?
How many times do you eat junk food in a week?
How many times do you eat junk food in a week?
How many times do you eat junk food in a week?
How many times do you eat junk food in a week?
How many times do you eat junk food in a week?
How many times do you eat junk food in a week?
How many times do you eat junk food in a week?
How many times do you eat junk food in a week?
How many times do you eat junk food in a week?
How many times do you eat junk food in a week?

26
Worksheet 7F
How long does it take you to get to school?
How long does it take you to get to school?
How long does it take you to get to school?
How long does it take you to get to school?
How long does it take you to get to school?
How long does it take you to get to school?
How long does it take you to get to school?
How long does it take you to get to school?
How long does it take you to get to school?
How long does it take you to get to school?
How long does it take you to get to school?
How long does it take you to get to school?
How long does it take you to get to school?
How long does it take you to get to school?

27
Worksheet 8
TEAM DIRECTIONS • Collect your team’s colored surveys. • Work as a team. Read all of these directions then decide which member of
your team will do each task. • Make a tally sheet to record your data. You may round your collected data
if you choose. • Create a frequency table and a line plot for your data. • Display the frequency table and line plot on a poster large enough for the
class to see during your presentation. • Calculate the mean and the median of your data. • Think about your results and use the Rubric for Constructing Data Analysis
Questions to create the questions that your team will present to the class. • Make an answer key for your questions. • Add your questions to the poster. • Present your display and your questions to the class. Students will use your
frequency table and line plot to answer your questions. • Lead a class discussion analyzing your data. Help the class raise other
questions related to the data.
28
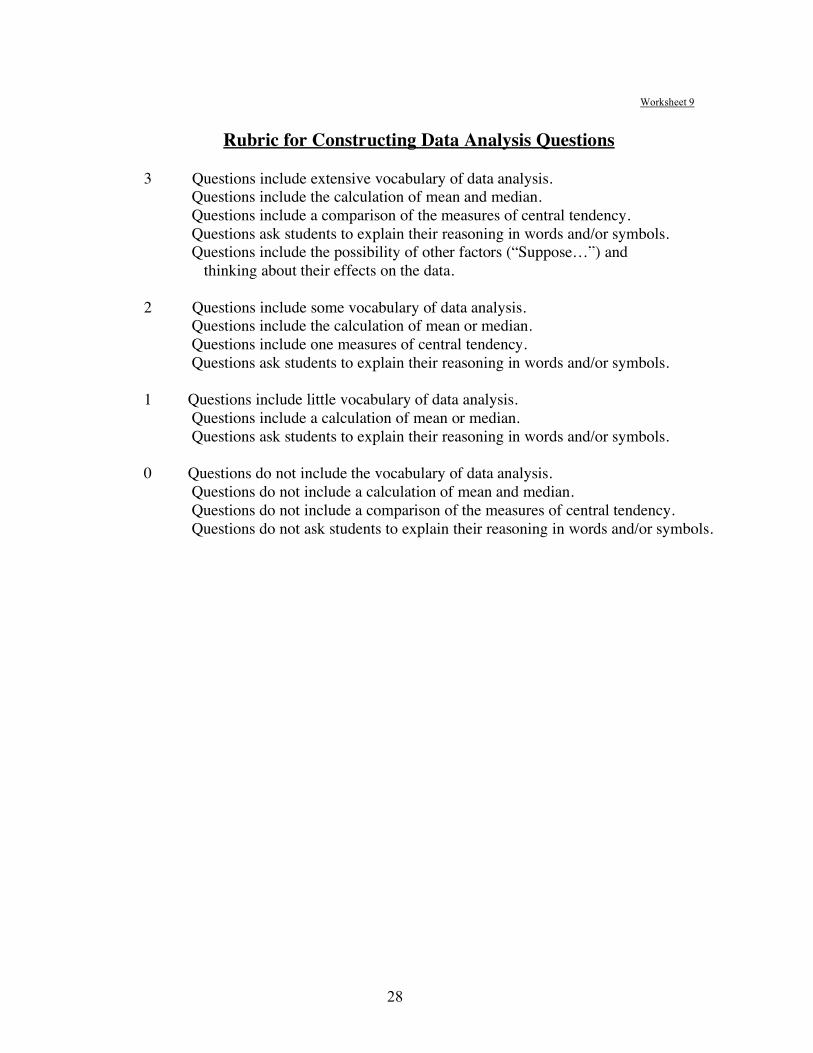
Worksheet 9
Rubric for Constructing Data Analysis Questions
3 Questions include extensive vocabulary of data analysis.
Questions include the calculation of mean and median. Questions include a comparison of the measures of central tendency. Questions ask students to explain their reasoning in words and/or symbols. Questions include the possibility of other factors (“Suppose…”) and thinking about their effects on the data.
2 Questions include some vocabulary of data analysis.
Questions include the calculation of mean or median. Questions include one measures of central tendency. Questions ask students to explain their reasoning in words and/or symbols.
1 Questions include little vocabulary of data analysis.
Questions include a calculation of mean or median. Questions ask students to explain their reasoning in words and/or symbols.
0 Questions do not include the vocabulary of data analysis.
Questions do not include a calculation of mean and median. Questions do not include a comparison of the measures of central tendency. Questions do not ask students to explain their reasoning in words and/or symbols.

29
Worksheet 10
Peer Evaluation Sheet
Group:____________________________________________________________ Question:__________________________________________________________ Scale: 1 – Excellent, 2 – Very Good, 3 – Good, 4 – Fair, 5 – Weak
Team displayed data neatly and attractively. Team demonstrated understanding of data. Team asked thought-provoking questions. Team answered questions. Team led discussion and helped class learn more about Data Analysis.

30
Worksheet 11
Graphing : GATHERING DATA USING A LINE PLOT Teacher Name: _______________________________ Student Name: ________________________________________
CATEGORY 4 3 2 1
Data Table Data in the table is well organized, accurate, and easy to read.
Data in the table is organized, accurate, and easy to read.
Data in the table is accurate and easy to read.
Data in the table is not accurate and/or cannot be read.
Units All units are described (in a key or with labels) and are appropriately sized for the data set.
Most units are described (in a key or with labels) and are appropriately sized for the data set.
All units are described (in a key or with labels) but are not appropriately sized for the data set.
Units are neither described NOR appropriately sized for the data set.
Neatness and Attractiveness
Exceptionally well designed, neat, and attractive. Colors that go well together are used to make the graph more readable. A ruler and graph paper (or graphing computer program) are used.
Neat and relatively attractive. A ruler and graph paper (or graphing computer program) are used to make the graph more readable.
Lines are neatly drawn but the graph appears quite plain.
Appears messy and "thrown together" in a hurry. Lines are visibly crooked.
Title Title is creative and clearly relates to the problem being graphed (includes dependent and independent variable). It is printed at the top of the graph.
Title clearly relates to the problem being graphed (includes dependent and independent variable) and is printed at the top of the graph.
A title is present at the top of the graph.
A title is not present.