measuring “a significant risk of carbon leakage” according ... · presentation eccp meeting 26...
TRANSCRIPT
1
Measuring “a significant risk of carbon leakage”according to the proposed Art. 10a of Directive
2003/87/EC
The European Commission’s approach
Manfred BergmannDevelopment of Industrial Policy
Presentation ECCP meeting 26 September 2008
2
Why do we care about carbon leakage?
• Negative environmental consequences at the global scale
No emission reductions in the EUHigher emissions in the rest of the world
• Negative economic consequences within the EULower growthJob lossesPotential negative consequences on security of supply

3
When could carbon leakage occur?
• Supply-side driven:Transaction costs of delocalising existing production < CO2 costsTransaction costs of capacity expansion abroad (non-EEA) < CO2 costs
• Demand-side driven:Transaction costs of sourcing supplies from abroad (non-EEA) < CO2 costs

4
… Art. 10a (9), 3
…taking into account the following:(a) the extent to which auctioning would lead to a
substantial increase in production cost;(b) … (benchmarking) …(c) market structure, relevant geographic and product
market, the exposure of the sectors to international competition;
(d) The effects of climate change and energy policies implemented, or expected to be implemented outside the EU in the sectors considered
5
Stage 1: quantitative analysis
• Defining / identifying the (sub)sectors where problems may occur
• Measuring the impact in terms of potential product price increases
• Measuring the exposure to international trade

6
Stage 2: qualitative analysis of other market factors
• Relevant product market• Relevant geographic market• Concentration, competition, profit margins• Tightness of market• Transportation costs• Value-chain characteristics• …

7
Subsectors analysed
• Energy-intensive business, i.e. all business outside the energy sector and where the purchases of energy products and electricity amounts to at least 3.0% of its production value
• Data gathering exercise (tentative list)
Expanded clay
Glass
Copper
Tyres
Technical gases
Zinc
Refineries
Ferro-Alloys
Casting of Iron
SugarSteel tube production
TextilesAviation
LeadPotassium
NickelMagnesite & graphite
BoardsPulp and paperCement and Lime
StarchChemicalsSteel and Iron
Man-made fibersCeramicsAluminium
Sectors that will provide
information
Sectors that have provided
informationSectors currently
being analysed

8
The relevant product market: The degree of disaggregation
• NACE 4-digit causes some problemsManufacture of aluminium (DJ2742), but
• Primary versus secondary aluminiumManufacture of basic iron and steel and of ferro-alloys (DJ2710), but
• BOF process• EAF process
Manufacture of cement (DJ 2651), but• Clinker?
• ProdCom 8-digit provides some solutions
9
Art. 10a (9), 3 (a)
• “(substantial) increase in production cost”↓
• Increase in production cost (triggered by direct and indirect emissions)
(€/ton)↓
• Increase in price needed to recover higher production cost
∆€ cost/ € price
10
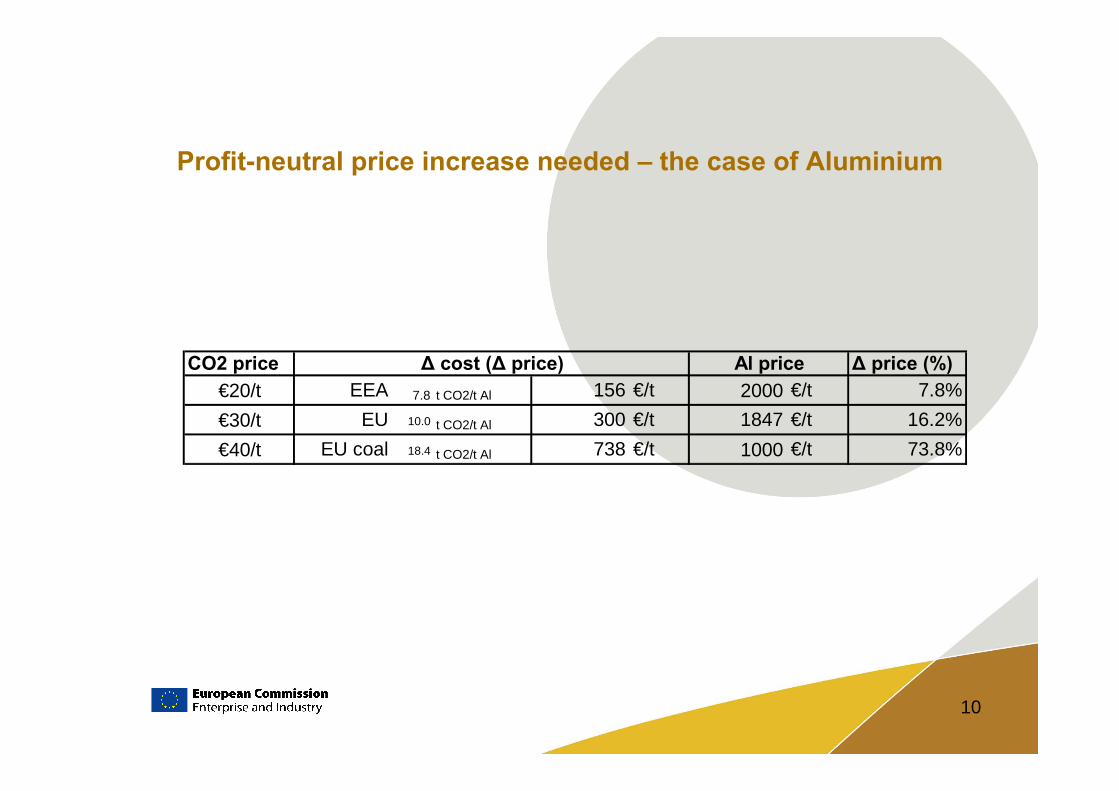
Profit-neutral price increase needed – the case of Aluminium
CO2 price ∆ price (%)€20/t EEA 7.8 t CO2/t Al 156 €/t 2000 €/t 7.8%€30/t EU 10.0 t CO2/t Al 300 €/t 1847 €/t 16.2%€40/t EU coal 18.4 t CO2/t Al 738 €/t 1000 €/t 73.8%
∆ cost (∆ price) Al price
11
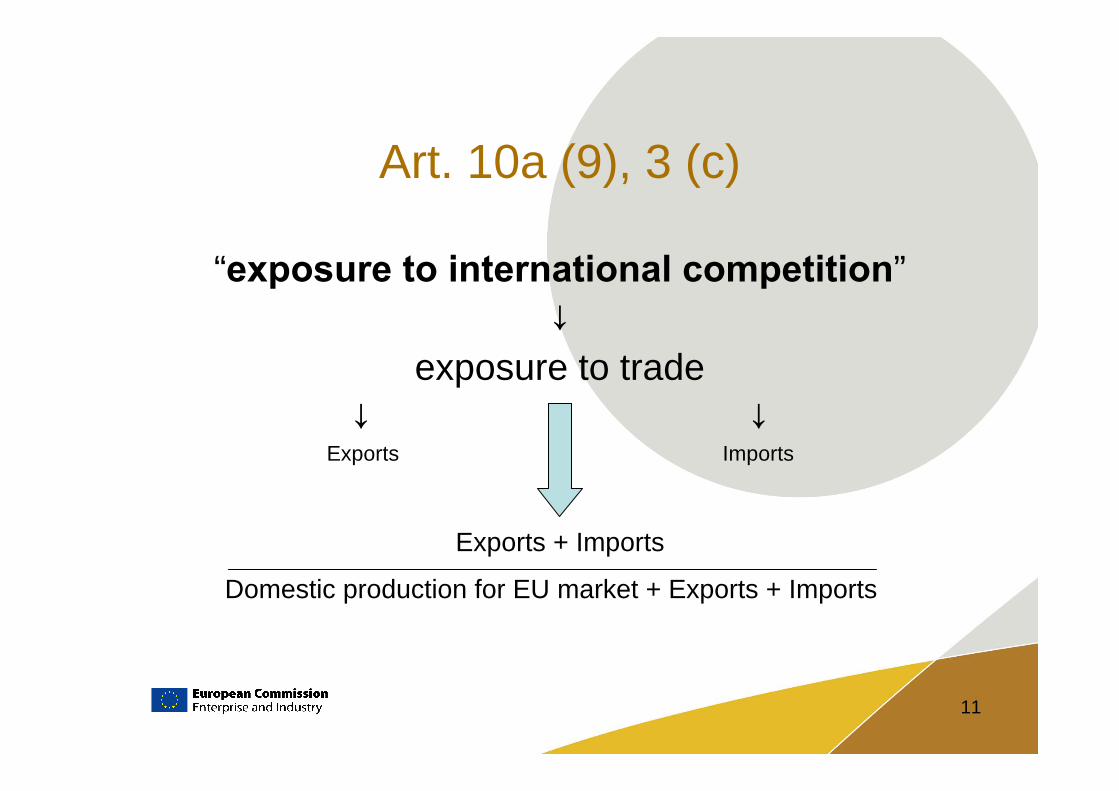
Art. 10a (9), 3 (c)
“exposure to international competition”↓
exposure to trade↓ ↓
Exports Imports
Exports + Imports
Domestic production for EU market + Exports + Imports

12
Trade intensity for selected products
Source: Prodcom total, Prodcom Sold, 2006. Production, Imports and exports are presented in 1000 t.
4.4%36315903214840Cement
53.1%12198119813042Clinker
1.0%6214420648Hot dipped metallic coated
28.4%5006843671Stainless Cold Rolled
0.3%163920281Rebar EAF
0.6%635218674Wire Rod EAF
54.1%543916367629slabs
29.8%7967419032760Hot rolled coil (total)
23.3%6137315146Rolling Aluminium
13.1%3413184699Extrusion Aluminium
8.0%2311013939Recycled Aluminium
47.3%4635855344Primary Aluminium
Exposure to tradeImportsExportsProduction

13
Results of stage 1: A tentative illustration
Preliminary results of Stage 1
0%
20%
40%
60%
80%
100%
0% 20% 40% 60% 80% 100%
Profit neutral price increase
Non
-EU
trad
e in
tens
ity
Recycled Aluminium
Rebar EAF-hot rolling
Wire Rod EAF-hot rolling
Hot dipped metallic coated BOF
Hot rolled coil BOF
slabs BOF
Primary Aluminium (EU average electricitymix)
Grey portland cement Dry process with multistage cyclone preheater and precalciner kilns(EU average clinker industry energy mix)Primary Aluminium (Coal-lignite basedelectricity mix)
Clinker Dry process with multi stage cyclonepreheater and precalciner kilns (EU average
14
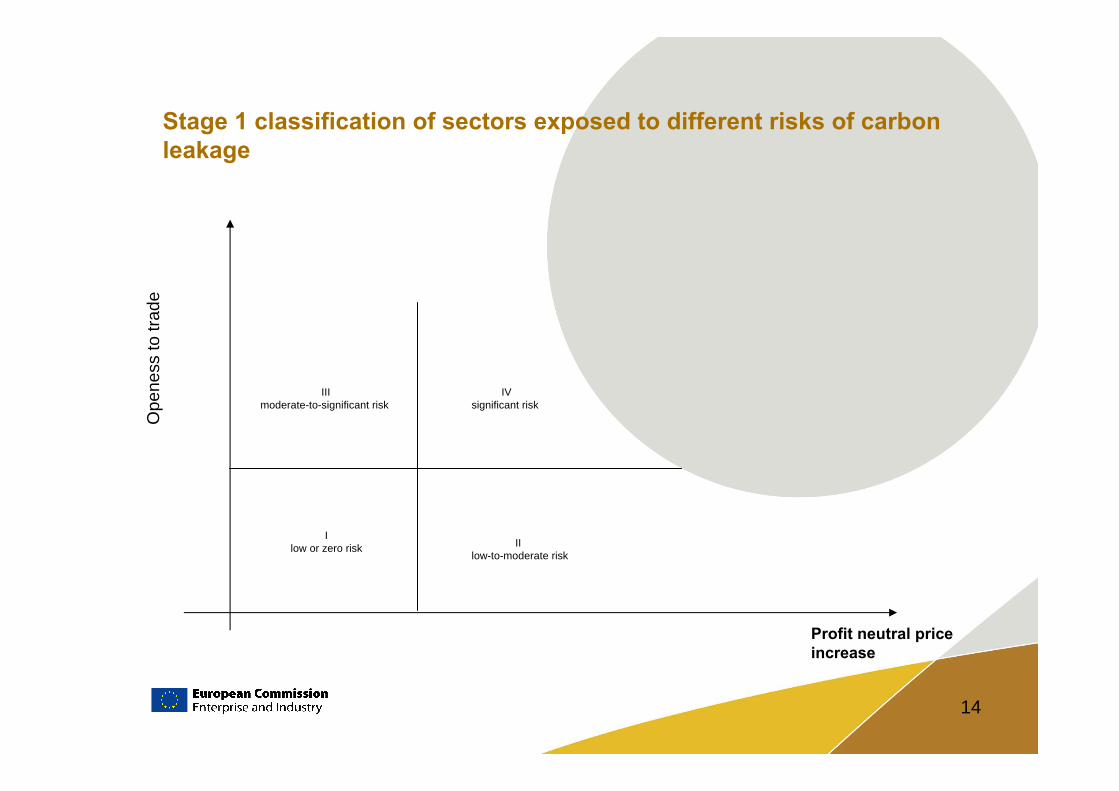
Stage 1 classification of sectors exposed to different risks of carbon leakage
Profit neutral priceincrease
Ope
ness
totra
de
I low or zero risk II
low-to-moderate risk
IIImoderate-to-significant risk
IVsignificant risk

15
Stage 2: qualitative analysis of other market factors
• Relevant product market• Relevant geographic market• Concentration, competition, profit margins• Tightness of market• Transportation costs• Value-chain characteristics• …

16
Art. 10a (9), 4
“For the purposes of evaluating whether the cost increase resulting from the Community scheme can be passed on, estimates of lost sales resulting from the increased carbon price or the impact on the profitability of the installations concerned may inter alia be used”

17
Prices and (global) demand – what price elasticity?Net volumes on the market and price 1992 - 2008 - primary aluminium - quarterly
0
1.000
2.000
3.000
4.000
5.000
6.000
Fourth 1992 Fourth 1993 Fourth 1994 Fourth 1995 Fourth 1996 Fourth 1997 Fourth 1998 Fourth 1999 Fourth2000
Fourth 2001 Fourth2002
Fourth2003
Fourth2004
Fourth 2005 Fourth2006
Fourth 2007
1000
tn
0
500
1.000
1.500
2.000
2.500
€/tn
Quarterly net volume on the market quarterly price (€)

18
Art. 10a (9), 3 (c)
“relevant geographic and product market”↓ ↓
Global market What degree of (yes/no) disaggregation?↓ ↓ ↓ ↓
Global Stock Transport cost NACE ProdComExchange? tbd 4-digit 8-digit
19
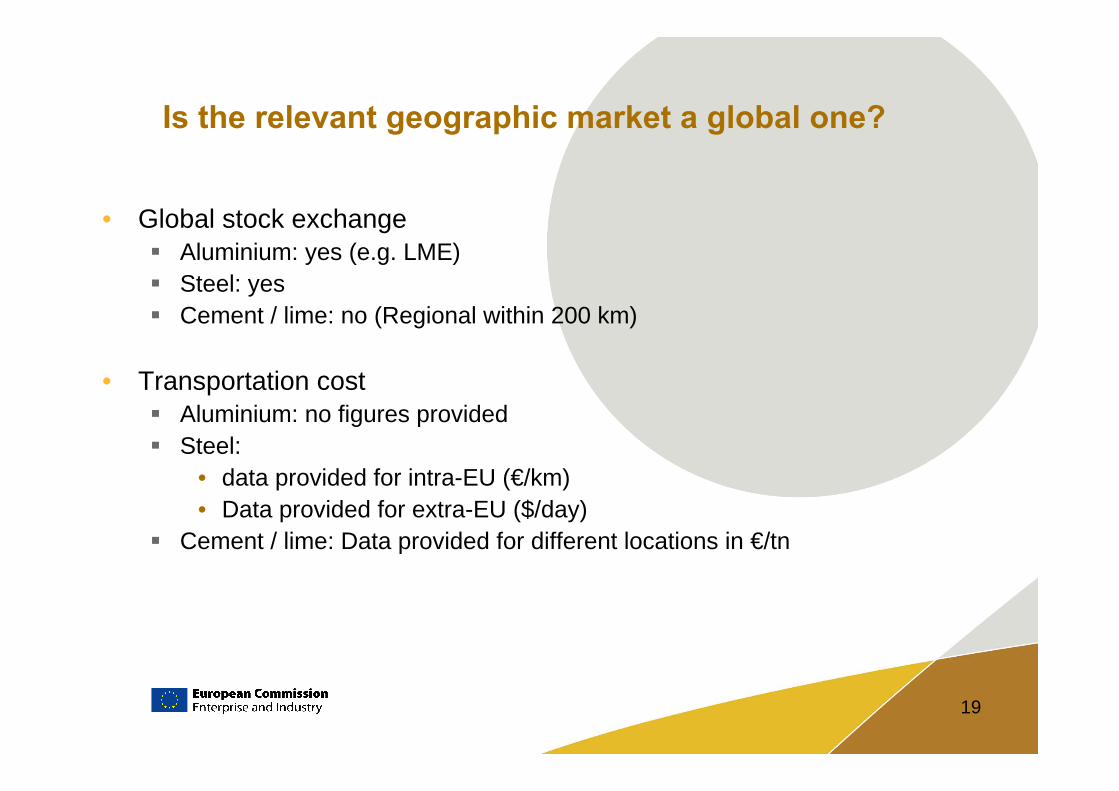
Is the relevant geographic market a global one?
• Global stock exchangeAluminium: yes (e.g. LME)Steel: yesCement / lime: no (Regional within 200 km)
• Transportation costAluminium: no figures providedSteel:
• data provided for intra-EU (€/km)• Data provided for extra-EU ($/day)
Cement / lime: Data provided for different locations in €/tn

20
Art. 10a (9), 3 (c)
Market structure↓ ↓
concentration tightness↓ ↓ ↓ ↓
market vertical level of capacityshares integration (global) utilization
stocks

21
Global market shares
Global market shares of major aluminium producers (2006)
Rusal11%
Alcoa11%
Alcan10%Hydro
5%Chalco
4%
Rio Tinto3%
Venezuela Gov'2%
Century2%
Bahrain Gov'2%
Dubal2%
Other48%

22
AL price and stock evolution 1997 - 2007A L p ric e a n d s to c k e v o lu tio n - 1 9 9 7 -2 0 0 6
0
5 0 0
1 0 0 0
1 5 0 0
2 0 0 0
2 5 0 0
Ja n 9 7 Ja n 9 8 Ja n 9 9 Ja n 0 0 Ja n 0 1 Ja n 0 2 Ja n 0 3 Ja n 0 4 Ja n 0 5 Ja n 0 6 Ja n 0 7
m o n th
Eur
o/tn
0
1 0
2 0
3 0
4 0
5 0
6 0
Sto
cks
in n
b of
day
s of
pro
duct
ion
E u ro sIn ve n to rie s e x p re s s e d in d a y s o f p ro d u c t io n (m o n th ly a ve ra g e )1 2 p e r. M o v. A vg . (E u ro s )1 2 p e r. M o v. A vg . (In ve n to rie s e x p re s s e d in d a y s o f p ro d u c t io n (m o n th ly a ve ra g e ))

23
Stage 2: Tentative illustration of results for aluminium
• Positive impact on ability to pass through cost increases:• market is tight,• little spare capacity at the global level,• a high degree of concentration,• geographically clustered value chain• …• …
• Negative impact on ability to pass through cost increases:• market is global,• homogeneous product easy to substitute (in case of primary aluminium),• eventually installations will compete with each other• …• …
• bottom line:

24
Stage 2: Tentative illustration of results for cement
• Positive impact on ability to pass through cost increases:high transportation cost, especially with respect to inland transport,market is rather regional (except for clinker, where producers close to
overseas ports are in competition with non-EU producers)……
• Negative impact on ability to pass through cost increases:potential cyclical downturn of construction sector in most OECD countries,potential slowdown of boom in China,potentially excess capacities at the regional, global level……
• bottom line:

25
Operational conclusions1. At the end of “Stage 1”, and after the thresholds will have been
decided upon (in a policy process), each (sub)sector will belong to either category I, II, III or IV!
2. The (qualitative) analysis undertaken in “Stage 2” could lead to a reclassification (up or down by at most one category)!
3. The assessment of the results of international negotiations to be undertaken in “Stage 3” could lead to a further reclassification!
4. [Finally, the directive could specify how many free allowances the (sub)sectors should receive, depending on whether they are at the end of “Stage 3” belonging to either category I, II, III or IV]