measuring and valuing unpaid household service work
TRANSCRIPT

Measuring and valuing unpaid
household service work Dominic Webber, Economic Advisor UK Office for
National Statistics
Email: [email protected]
Twitter: @domwebberstats
Workshop on Gender Statistics
Belgrade, Serbia, 27-28 November 2017
Contents
• What is unpaid household service work?
• Why is it important to measure it?
• How do we measure it?
• Time use surveys, and alternatives
• Valuing the labour input
• The Household Satellite Account

Unpaid household service work
• Unpaid household service work
defined within Resolution 1 of 19th
International Conference of
Labour Statisticians.
• Activities include:
• Preparing and serving meals
• Looking after children and
adults
• Cleaning and maintaining
one’s own dwelling.
• Activities for inclusion usually
dictated by the third party
criterion.
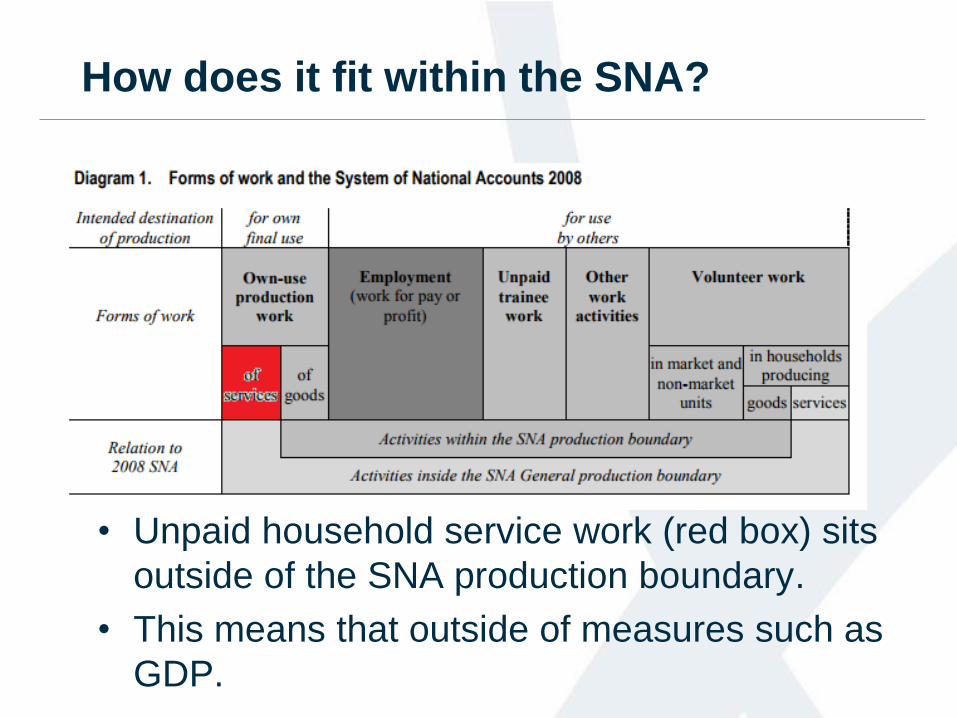
How does it fit within the SNA?
• Unpaid household service work (red box) sits
outside of the SNA production boundary.
• This means that outside of measures such as
GDP.
Why is it important?
• Traditional measures of the economy (GDP)
ignore this work. However, unpaid household
work is closely related to well-being.
• Plays an important contribution to the
successful functioning of the economy, labour
market and society.
• Vital in examining the gender division of work.

Men spend more time than women
doing paid work….
Source: OECD time use database. Latest year data available.
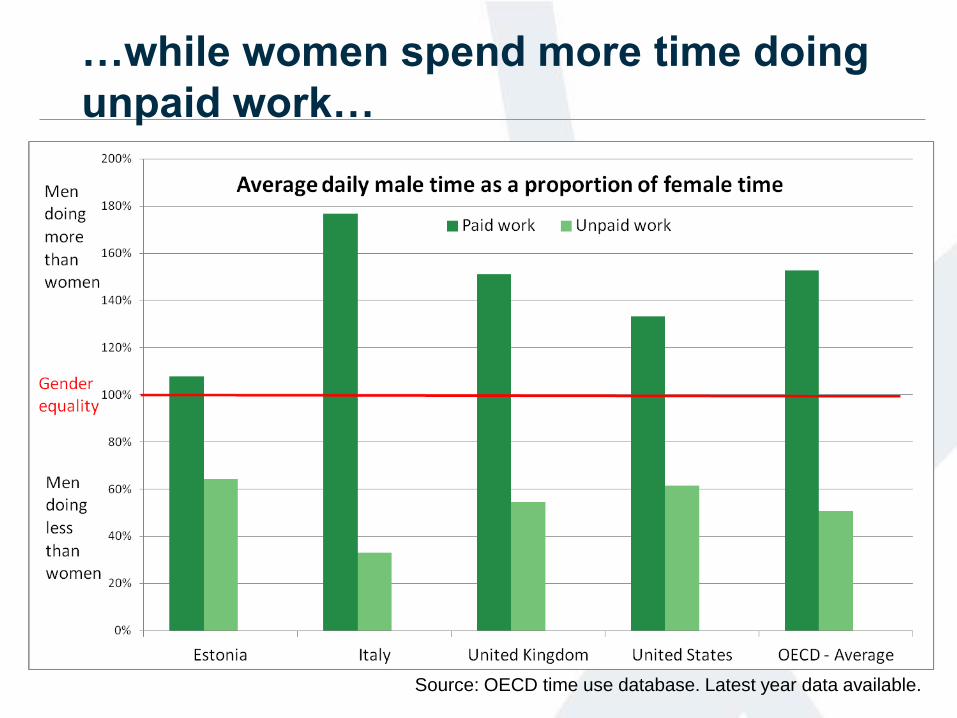
…while women spend more time doing
unpaid work…
Source: OECD time use database. Latest year data available.

…to the extent that women spend
more time in total working than men.
Source: OECD time use database. Latest year data available.
Goal 5: Achieve gender equality and
empower all women and girls
Indicator 5.4
Recognise and value unpaid care and domestic work through the provision of public services, infrastructure and social protection policies and the promotion of shared responsibility within the household and the family as nationally appropriate
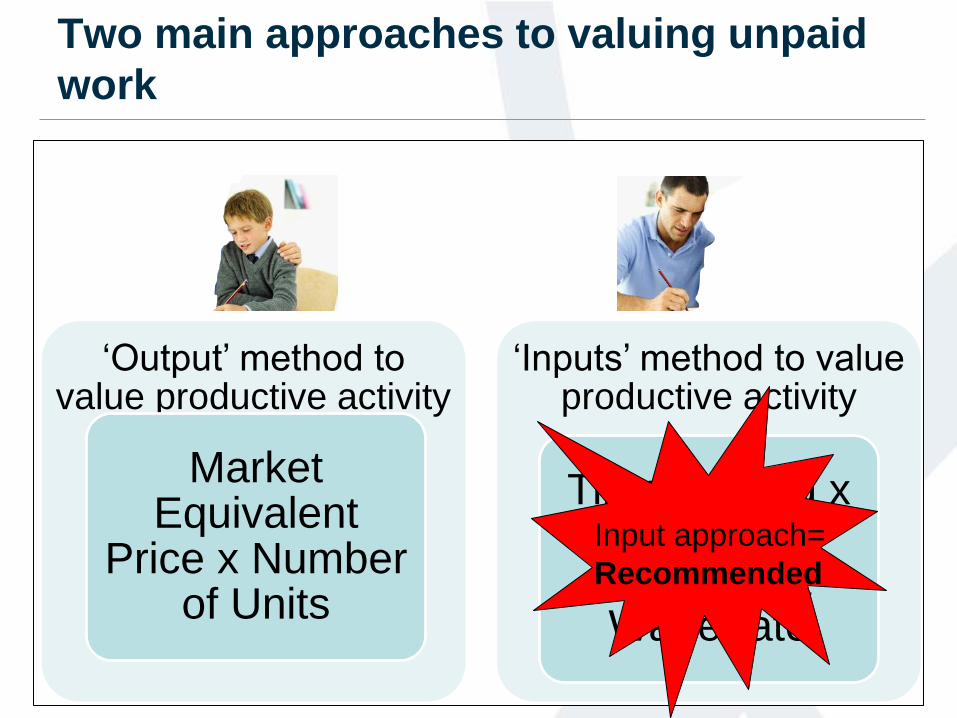
Two main approaches to valuing unpaid
work
‘Output’ method to value productive activity
Market Equivalent
Price x Number of Units
‘Inputs’ method to value productive activity
Time worked x Market
Equivalent Wage rate
Input approach=
Recommended
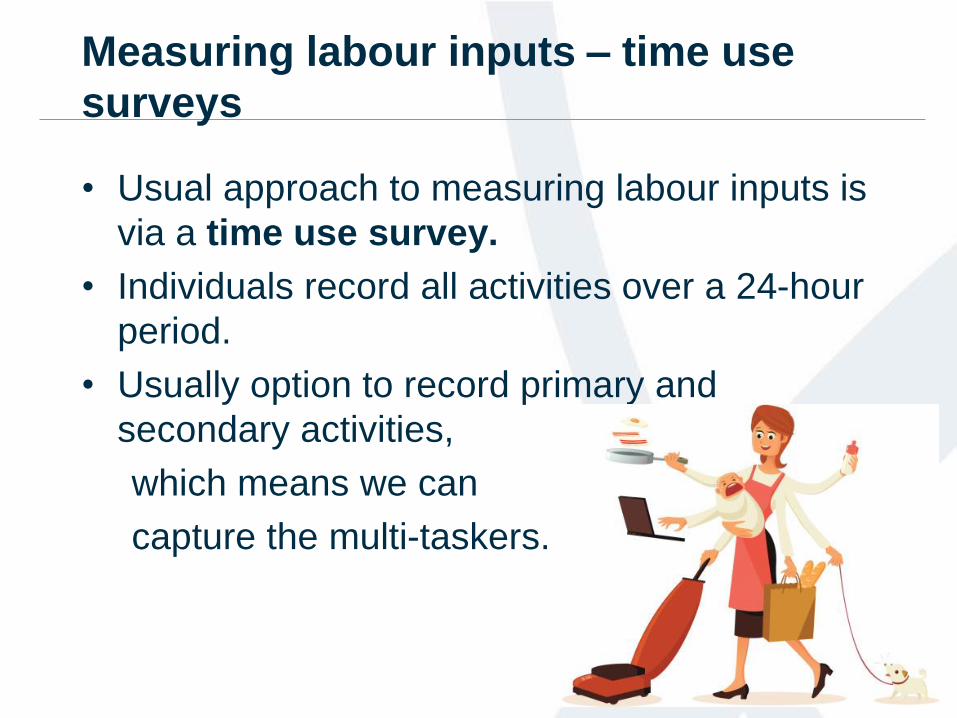
Measuring labour inputs – time use
surveys
• Usual approach to measuring labour inputs is
via a time use survey.
• Individuals record all activities over a 24-hour
period.
• Usually option to record primary and
secondary activities,
which means we can
capture the multi-taskers.

UNECE Guidelines for Harmonizing
Time-Use Surveys
Aims
• Help countries in
carrying out time use
surveys.
• Improve the international
comparability of their
results.

UNECE Guidelines for Harmonizing
Time-Use Surveys
Key recommendations
1. Diary preferred to other
methods
2. Full-scale preferred to
light diary
3. Carried out every ten
years, at least.

UNECE Guidelines for Harmonizing
Time-Use Surveys
Key recommendations
4. Time use over weeks,
months and years
5. At least one
simultaneous activity
6. Use the International
Classification of
Activities for Time Use
Statistics 2016
(ICATUS)*

ICATUS classification 2016
Alternatives to time use surveys
• While full-scale time use surveys are the
recommended approach, they can be
complex, and costly.
• Alternative methods may be explored if
increases the likelihood of obtaining data on
unpaid work.
• Options include:
Light time diary with a household survey
Stylized questions in a household survey

Example of a light diary.
Source: Gershuny, Oxford University Centre for
Time Use Research, UK

Valuing labour inputs
• Once the amount of time spent doing unpaid
work is measured, we need to value this time.
• 4 main approaches considered
Opportunity cost
Replacement cost – generalist
Replacement cost – specialist
Replacement cost - hybrid

Opportunity cost vs. replacement cost
Statistician’s cake
Opportunity cost =
3*£25.04p.h. = £75.12
Baker’s cake
Opportunity cost =
3*£8.51p.h. = £25.53
A lawyer and baker spend 3 hours baking a cake at home
So the statistician’s cake is three times
the value of a baker’s cake??

Opportunity cost vs. replacement cost
Statistician’s cake
Replacement cost =
3*£8.51p.h. = £25.53
Baker’s cake
Replacement cost =
3*£8.51p.h. = £25.53
A lawyer and baker spend 3 hours baking a cake at home
Now each persons cake is worth the
same. What about quality-adjustment?
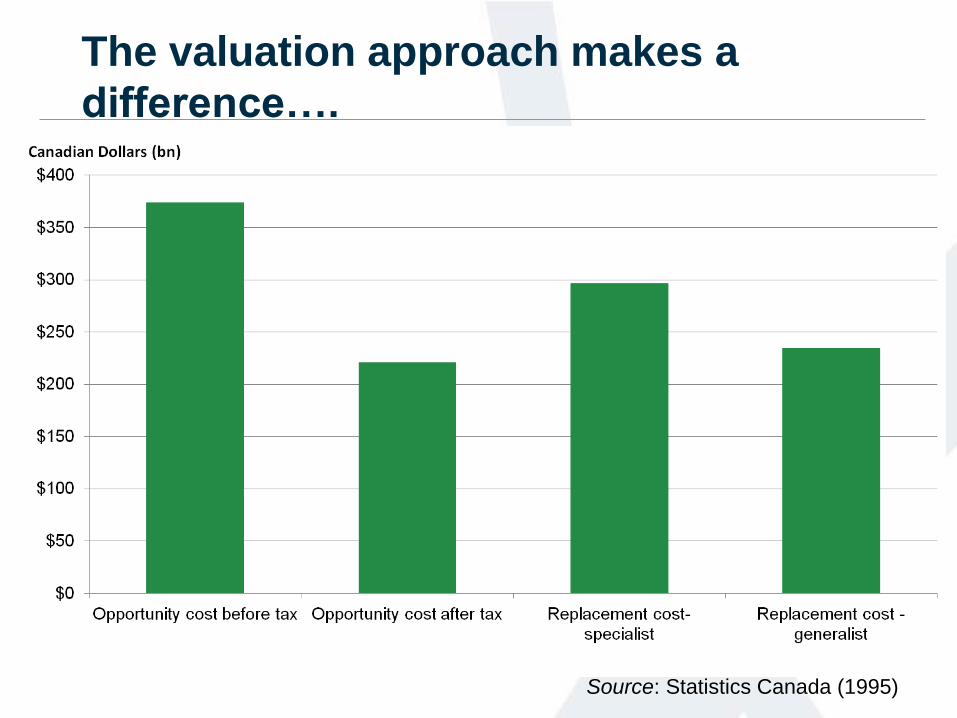
The valuation approach makes a
difference….
Source: Statistics Canada (1995)
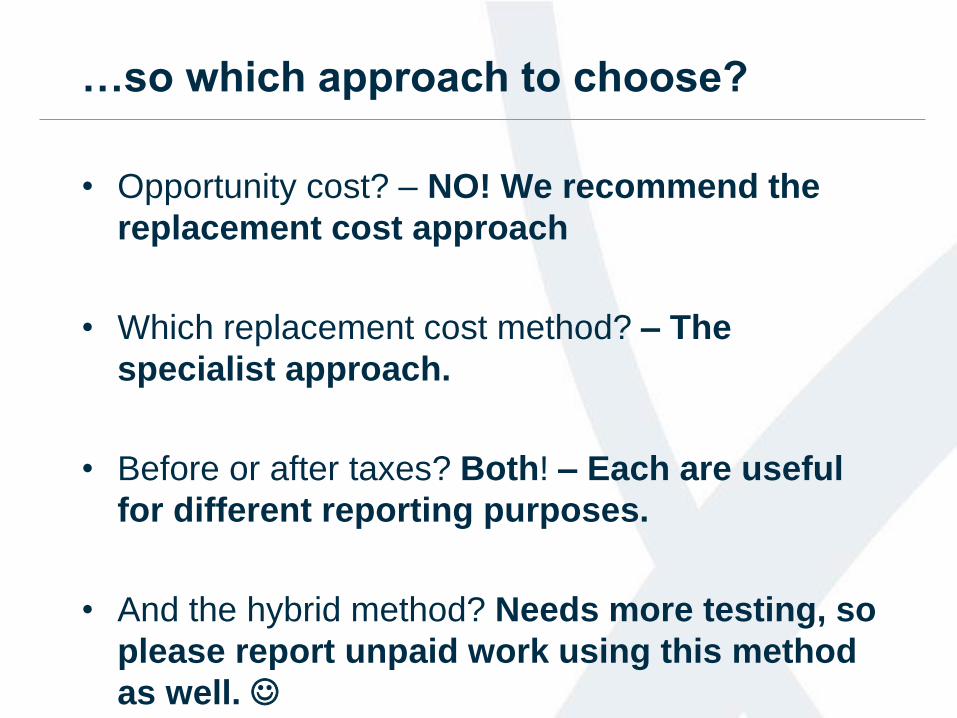
…so which approach to choose?
• Opportunity cost? – NO! We recommend the
replacement cost approach
• Which replacement cost method? – The
specialist approach.
• Before or after taxes? Both! – Each are useful
for different reporting purposes.
• And the hybrid method? Needs more testing, so
please report unpaid work using this method
as well.
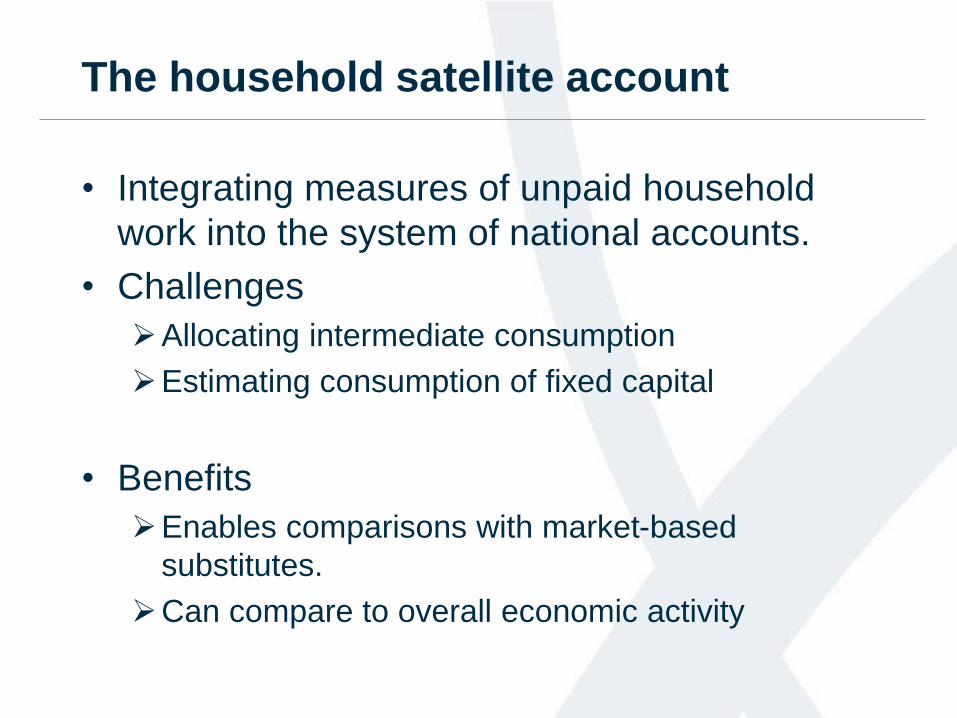
The household satellite account
• Integrating measures of unpaid household
work into the system of national accounts.
• Challenges
Allocating intermediate consumption
Estimating consumption of fixed capital
• Benefits
Enables comparisons with market-based
substitutes.
Can compare to overall economic activity

Satellite accounts enable direct
comparisons with GDP
UK GDP -
£1,817bn in 2014.
Value of home
production -
£1,019bn in
2014.
Equivalent to
56.1% of GDP
Source: Office for National Statistics, UK. 2014.
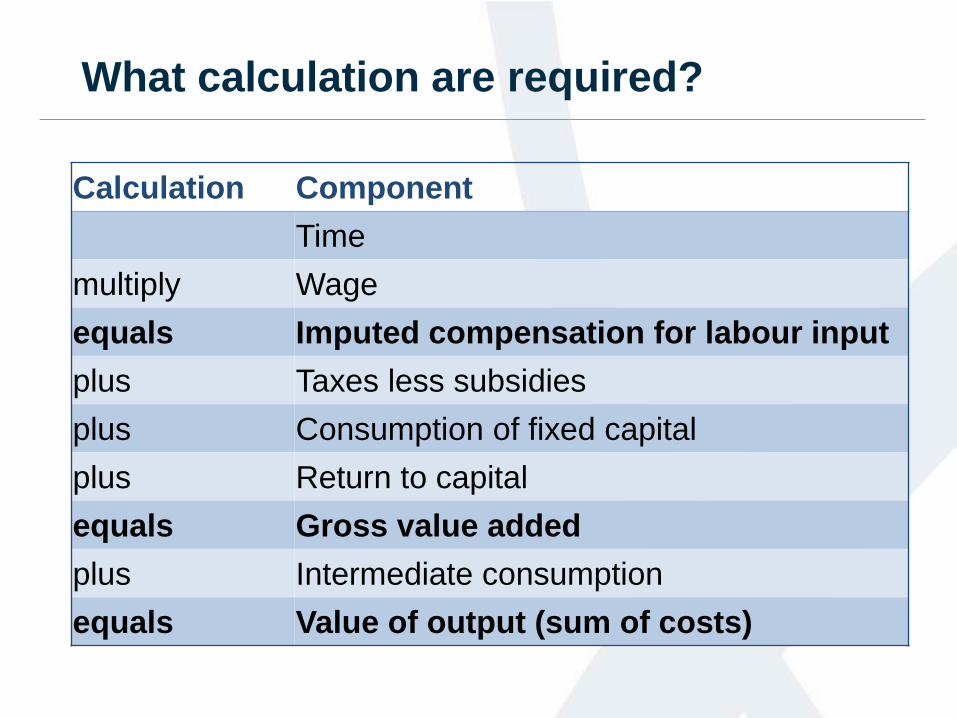
What calculation are required?
Calculation Component
Time
multiply Wage
equals Imputed compensation for labour input
plus Taxes less subsidies
plus Consumption of fixed capital
plus Return to capital
equals Gross value added
plus Intermediate consumption
equals Value of output (sum of costs)

Imputed compensation for labour input
estimated using time use survey data
Calculation Component
Time
multiply Wage
equals Imputed compensation for labour input
plus Taxes less subsidies
plus Consumption of fixed capital
plus Return to capital
equals Gross value added
plus Intermediate consumption
equals Value of output (sum of costs)
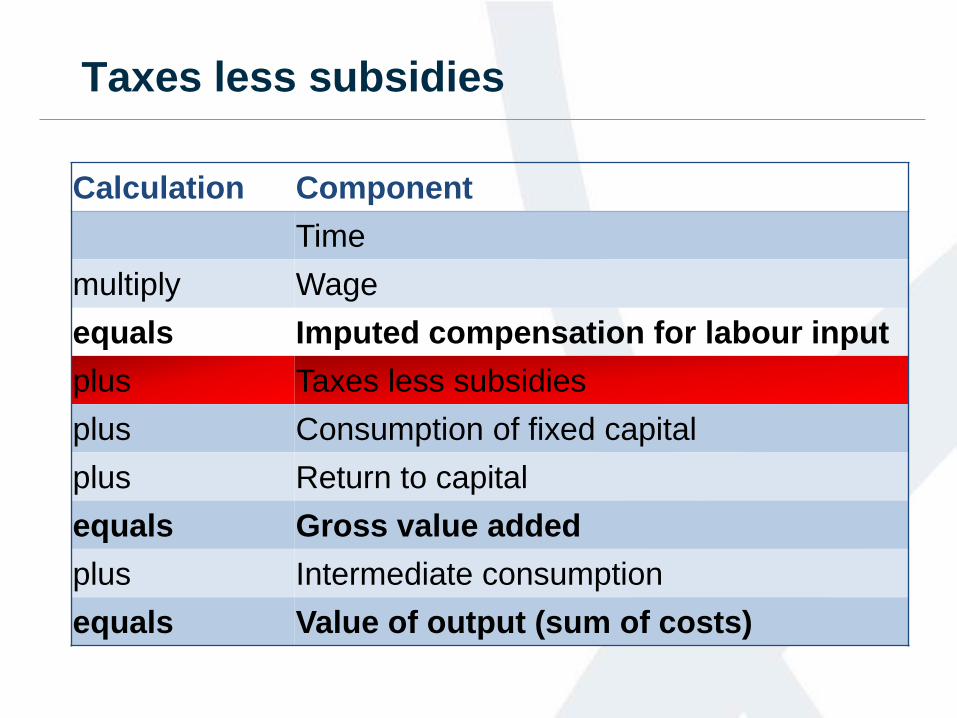
Taxes less subsidies
Calculation Component
Time
multiply Wage
equals Imputed compensation for labour input
plus Taxes less subsidies
plus Consumption of fixed capital
plus Return to capital
equals Gross value added
plus Intermediate consumption
equals Value of output (sum of costs)
Taxes less subsidies
• Some taxes and benefits are explicitly linked
to the provision of unpaid work.
• For instance, taxes on the use of buildings
and machinery involved in the production
unpaid household service work.
• Some people receive subsidies for the care of
children and adults, which needs to allocated
to that production.
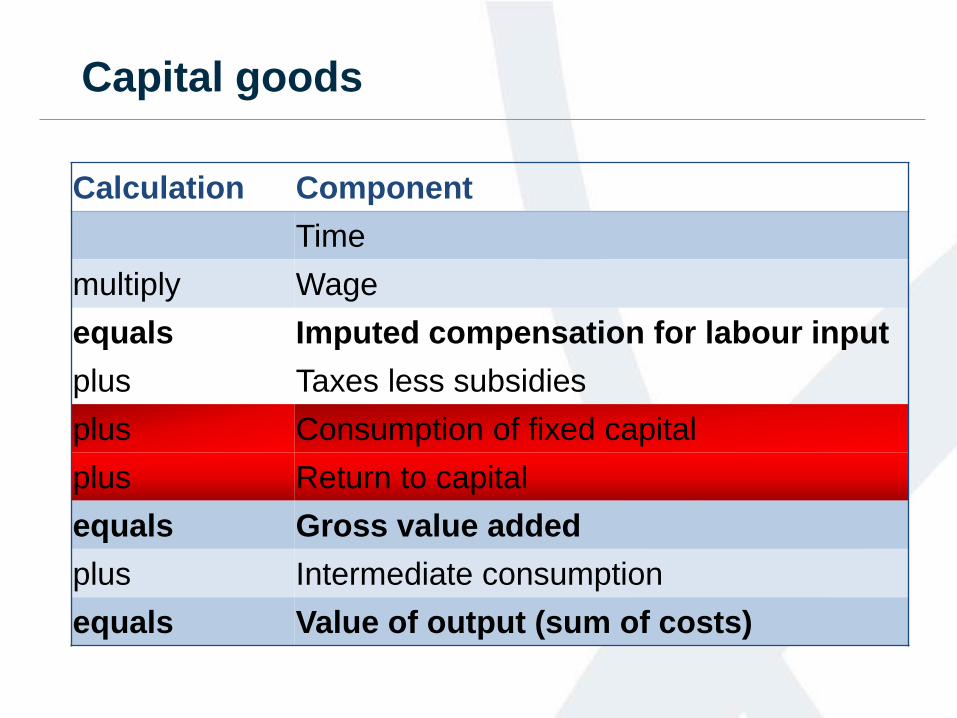
Capital goods
Calculation Component
Time
multiply Wage
equals Imputed compensation for labour input
plus Taxes less subsidies
plus Consumption of fixed capital
plus Return to capital
equals Gross value added
plus Intermediate consumption
equals Value of output (sum of costs)

The treatment of capital goods
• Some final consumption expenditure
needs to be reallocated to gross
fixed capital formation.
• E.g. household appliances, cars etc
that are used to provide own-use
production work of services.
• Further, depreciation and return to
capital need to be accounted for.

Intermediate consumption
Calculation Component
Time
multiply Wage
equals Imputed compensation for labour input
plus Taxes less subsidies
plus Consumption of fixed capital
plus Return to capital
equals Gross value added
plus Intermediate consumption
equals Value of output (sum of costs)
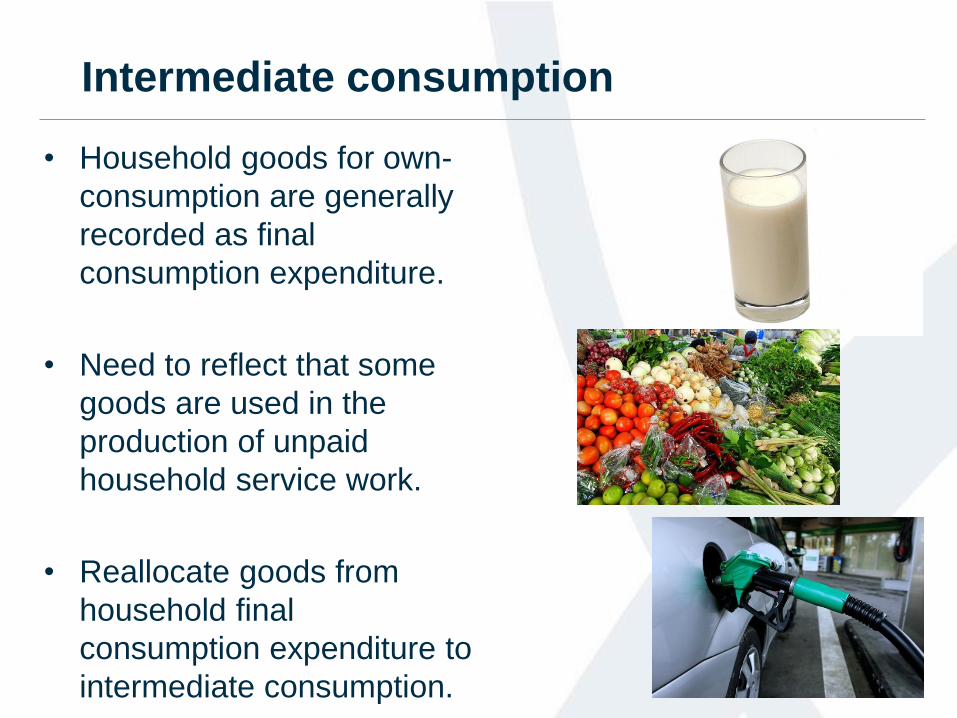
Intermediate consumption
• Household goods for own-
consumption are generally
recorded as final
consumption expenditure.
• Need to reflect that some
goods are used in the
production of unpaid
household service work.
• Reallocate goods from
household final
consumption expenditure to
intermediate consumption.

Supply and use table

Impact on national account variables
• The Supply and Use Table extends the production boundary by
including own-use production work of services. This will impact
GDP in a number of ways.
• GDP increases due to imputed compensation for labour income
and the total capital services from consumer durables.
• Final consumption expenditure of households will increase
because of the additional consumption of own-use production
work of services.
• On the other hand, it will decreases because of the alternative
recording of goods and services used during own-use
production of services work, which adds to intermediate
consumption, and the shifting of consumer durables to gross
fixed capital formation.
• It’s then possible to examine the impact on household
disposable income via the sector accounts.

Thanks for listening!