measuring biodiversity - up · measuring biodiversity geometric series motomura, i. 1932. a...
TRANSCRIPT

Biodiversidade de Ecossistemas Aquáticos 13/04/11 1
Measuring Biodiversity

Biodiversidade de Ecossistemas Aquáticos 13/04/11 2
Measuring Biodiversity
Species Site 1 Site 2 Site 3
Stenothoe monoculoides 122 28 4657
Arcturidae 0 0 16
Campecopea hirsuta 0 0 10
Cymodoce truncata 0 0 103
Dynamene bidentata 378 112 2224
Dynamene edwardsi 0 0 10
Dynamene magnitorata 14 0 1010
Gnathia sp. 20 0 12
Idotea baltica 0 0 22
Idotea granulosa 4 1011 3411
Idotea pelagica 0 107 627
Ischyromene lacazei 0 51 754
Are these communities equally diverse?

Biodiversidade de Ecossistemas Aquáticos 13/04/11 3
Measuring Biodiversity
Commonness and rarity of species

Biodiversidade de Ecossistemas Aquáticos 13/04/11 4
Measuring Biodiversity
Plotting species abundance data
For Site 3For Site 1
1 2 3 4 5 6 7 8 9 10 11 12 13
0
500
1000
1500
2000
2500
3000
3500
4000
4500
5000
1 2 3 4 5 6 7 8 9 10 11 12 13
0
50
100
150
200
250
300
350
400

Biodiversidade de Ecossistemas Aquáticos 13/04/11 5
Measuring Biodiversity
Whittaker plots
1 2 3 4 5 6 7 8 9 10 11 12 130.000
0.100
0.200
0.300
0.400
0.500
0.600
0.700
0.800
Site 1Site 3
Species Rank
Re
lati
ve A
bun
da
n ce

Biodiversidade de Ecossistemas Aquáticos 13/04/11 6
Measuring Biodiversity
Relative Species Abundance Patterns
● Descriptive approaches– attempt to fit a mathematical model to real data sets
● Mechanistic approaches– create a mathematical model based on biological
principles and then test how well these models fit real data sets

Biodiversidade de Ecossistemas Aquáticos 13/04/11 7
Measuring Biodiversity
Descriptive approaches

Biodiversidade de Ecossistemas Aquáticos 13/04/11 8
Measuring Biodiversity
Geometric SeriesMotomura, I. 1932. A statistical treatment of associations, Jpn. J. Zool. 44: 379–383 (in Japanese)
Within the geometric series each species’ level of abundance is a sequential, constant proportion (k) of the total number of individuals in the community. Thus if k is 0.5, the most common species would represent half of individuals in the community (50%), the second most common species would represent half of the remaining half (25%), the third, half of the remaining quarter (12.5%) and so forth.
ni=NC k k 1−k i−1
ni = total number of individuals in the ith species
N = total number of individualsS = total number of speciesk = proportion of the remaining nicheC
k = [1-(1-k)S]-1
Biodiversidade de Ecossistemas Aquáticos 13/04/11 9
Measuring Biodiversity
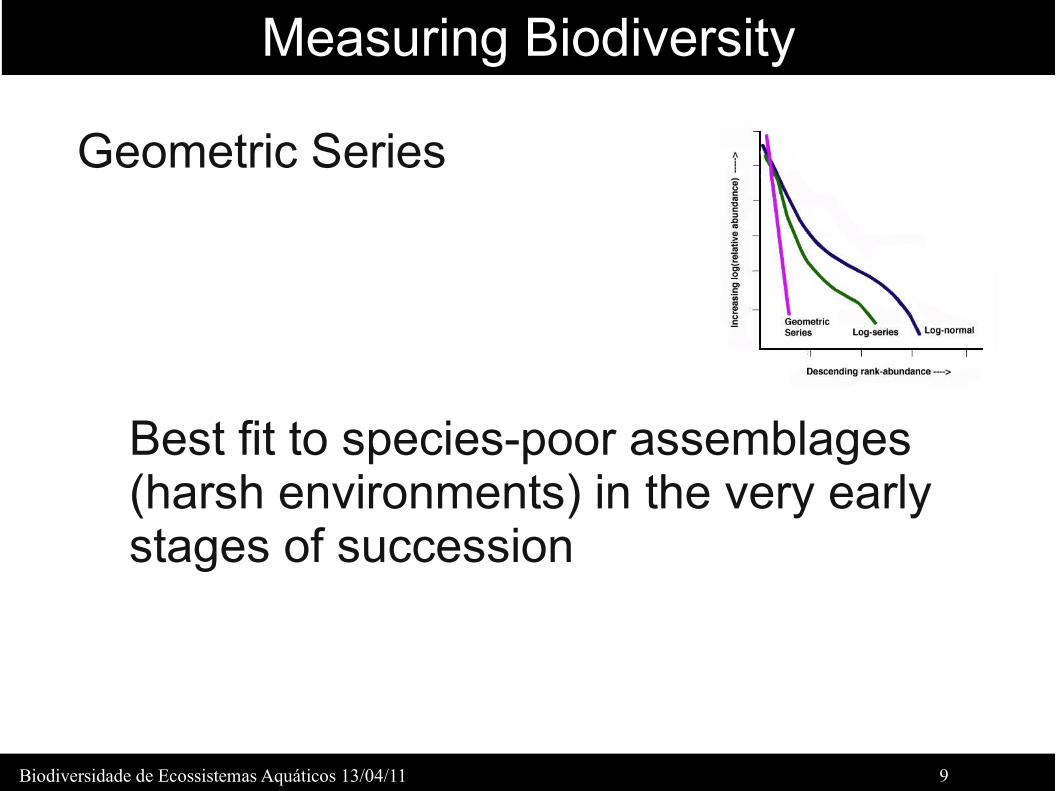
Geometric Series
Best fit to species-poor assemblages (harsh environments) in the very early stages of succession

Biodiversidade de Ecossistemas Aquáticos 13/04/11 10
Measuring Biodiversity
Logseries (Fisher et al 1943)Fisher, R.A, Corbet A.S., Williams C.B. 1943. The relation between the number of species and the number of individuals in a random sample of an animal population. Journal of Animal Ecology 12: 42-58.
S= ln 1N
N = total number of individualsS = total number of speciesα = proportion of the remaining nichex = a positive constant (0<x<1) which is derived from the sample data set and generally approaches 1 in value
n = total number of individuals for a given species
S n= xn
n
The number of species with 1,2,3,...,n individuals is x , x2
2, x3
3 , , xn
n

Biodiversidade de Ecossistemas Aquáticos 13/04/11 11
Measuring Biodiversity
Log Normal (Preston 1948)Preston, F.W. 1948. The Commonness, and Rarity of Species. Ecology 29 (3): 254-283
S R=S 0 exp −a2 R2
S(R) = number of species in the Rth octave (class)S
0 = number of species in the modal class
a=22
Species abundances follow a Normal (Gaussian) distribution. According to this argument, the left-skew observed in species abundance frequency histograms (including those described by the logseries) is a sampling artifact. Given that species toward the left side of the x-axis are increasingly rare, they may be missed in a random species sample. As the sample size increases however, the likelihood of collecting rare species in a way that accurately represents their abundance also increases, and more of the normal distribution becomes visible

Biodiversidade de Ecossistemas Aquáticos 13/04/11 12
Measuring Biodiversity
Log Normal (Preston 1948)

Biodiversidade de Ecossistemas Aquáticos 13/04/11 13
Measuring Biodiversity
(Niche apportionment models)Mechanistic approaches (Niche apportionment models)
● MacArthur's Broken-stick model
● Tokeshi's models

Biodiversidade de Ecossistemas Aquáticos 13/04/11 14
Measuring Biodiversity
MacArthur's Broken-stick modelMac Arthur, R. H. (1957). On the relative abundance of bird species. Proc. Natl. Acad. Sci. 43, 293-295.
ni=N T
S∑n=i
S1n
Niche space is divided randomly between S species (a stick is broken randomly and simultaneously in S parts)
ni = number of individuals in the ith most important species
NT = total number of individuals
S = total number of species

Biodiversidade de Ecossistemas Aquáticos 13/04/11 15
Measuring Biodiversity
Tokeshi's models

Biodiversidade de Ecossistemas Aquáticos 13/04/11 16
Measuring Biodiversity
Tokeshi's models (e.g., Power Fraction)
The probability with which a portion of the niche colonized is dependent on the relative sizes of the established niches, and is scaled by an exponent k. k can take a value between 0 and 1 and if k>0 there is always a slightly higher probably that the larger niche will be colonized. This model is thought as being more biologically realistic because one can imagine many cases where the species with the larger proportion of resources is more likely to be invaded because that niche has more resource space, and thus more opportunity for acquisition.

Biodiversidade de Ecossistemas Aquáticos 13/04/11 17
Measuring Biodiversity
Fitting models to data
The AIC (Akaike Information Criterion)
Y = a + bx + cx²Y = a + bx

Biodiversidade de Ecossistemas Aquáticos 13/04/11 18
Measuring Biodiversity
Species Richness (S)
How many species are there?

Biodiversidade de Ecossistemas Aquáticos 13/04/11 19
Measuring Biodiversity
DMg=1−S ln N
Simple indices
Margalef's diversity index
DMn=S
NMenhinick's index
Both measures remain strongly influenced by sampling effort

Biodiversidade de Ecossistemas Aquáticos 13/04/11 20
Measuring Biodiversity
Species accumulation curves
Plot the cumulative number of species recorded (S) as a function of sampling effort (n)
Sampling effort (n) can be an increase in area, volume, time, pitfalls, nets, etc.

Biodiversidade de Ecossistemas Aquáticos 13/04/11 21
Measuring Biodiversity
Species accumulation curves

Biodiversidade de Ecossistemas Aquáticos 13/04/11 22
Measuring Biodiversity
Species accumulation curves
Estimating the number of (unobserved) species
Parametric methods
S n=Smax n
BnS(n) = total number of species observed in n samplesS
max = total number of species in the assemblage
B = sampling effort required to detect 50% of Smax
Methods try to estimate the fitted constants Smax
and B

Biodiversidade de Ecossistemas Aquáticos 13/04/11 23
Measuring Biodiversity
Species accumulation curves
Estimating the number of (unobserved) species
Non-parametric estimators
SChao 1
SChao 2
SACE
SJack 1
SJack 1
SBoot
Mostly base estimates on “rare” species

Biodiversidade de Ecossistemas Aquáticos 13/04/11 24
Measuring Biodiversity
Species accumulation curves
Estimating the number of (unobserved) species
SChao1=S obsF 1
2
F 22
Sobs
= number of species in sample
F1 = number of singletons
F2 = number of doubletons
SChao2=S obsQ1
2
2Q22
Sobs
= number of species in sample
Q1 = number of species that occur in
one sample only
Q2 = number of species that occur in
two samples

Biodiversidade de Ecossistemas Aquáticos 13/04/11 25
Measuring Biodiversity
Species accumulation curves
Estimating the number of (unobserved) species
S ACE=S abundS rare
C ACE
F 1
C ACE
×2ACE
Srare
= number of rare species (< 10 individuals)
Sabund
= number of common species (> 10 individuals)
Fi = number of species with i individuals
CACE
= 1-F1/N
rare
and 2ACE=max { S rare
C ACE
×
∑i=1
10
i i−1F i
N rare N rare−1 −1.0}

Biodiversidade de Ecossistemas Aquáticos 13/04/11 26
Measuring Biodiversity
Species accumulation curves
Estimating the number of (unobserved) species
S Jack 1=S obsQ1m−1m
Sobs
= number of species in sample
Q1 = number of species that occur in one sample only
Q2 = number of species that occur in two samples
m = number of samples
S Jack 2=S obs[Q1 2m−3
m−Q2m−22
mm−1 ]

Biodiversidade de Ecossistemas Aquáticos 13/04/11 27
Measuring Biodiversity
Species accumulation curves
Estimating the number of (unobserved) species
Sboot=Sobs∑k=1
S obs
1− pk m
Sobs
= number of species in sample
pi = frequency of species i
m = number of samples

Biodiversidade de Ecossistemas Aquáticos 13/04/11 28
Measuring Biodiversity
Performance
Known universe Unknown universe

Biodiversidade de Ecossistemas Aquáticos 13/04/11 29
Measuring Biodiversity
Rarefaction
Technique to standardize and compare species richness computed from samples of different sizes
The larger the number of individuals sampled, the more species will be found

Biodiversidade de Ecossistemas Aquáticos 13/04/11 30
Measuring Biodiversity
Rarefaction
Rarefaction curves are necessary for estimating species richness. Raw species richness counts, which are used to create accumulation curves, can only be compared when the species richness has reached a clear asymptote.
Rarefaction curves produce smoother lines that facilitate point-to-point or full dataset comparisons.

Biodiversidade de Ecossistemas Aquáticos 13/04/11 31
Measuring Biodiversity
Rarefaction
Rarefaction only works well when no taxon is extremely rare or common, or when beta diversity is very high.
Rarefaction assumes that the number of occurrences of a species reflects the sampling intensity, but if one taxon is especially common or rare, the number of occurrences will be related to the extremity of the number of individuals of that species, not to the intensity of sampling.
It also assumes individuals disperse randomly

Biodiversidade de Ecossistemas Aquáticos 13/04/11 32
Measuring Biodiversity
Rarefaction

Biodiversidade de Ecossistemas Aquáticos 13/04/11 33
Measuring Biodiversity
Indices of α diversity

Biodiversidade de Ecossistemas Aquáticos 13/04/11 34
Measuring Biodiversity
Logseries α
Lognormal λ
“Parametric” measures of diversity
S= ln 1N
The number of species with 1,2,3,...,n individuals is x , x2
2, x3
3 , , xn
n

Biodiversidade de Ecossistemas Aquáticos 13/04/11 35
Measuring Biodiversity
“Non-parametric” measures of diversity
Shannon-Wiener H'
Brillouin's Index (HB)
Simpson's Index (D) and variants
Taxonomic diversity

Biodiversidade de Ecossistemas Aquáticos 13/04/11 36
Measuring Biodiversity
Shannon-Wiener* H'
*Note: Incorrectly spelled “Shannon-Weaver” because it was published in a book edited by Shannon and Weaver
H '=−∑
i=1
n
pi ln pi
n = number of species in samplepi = proportion of species i in sample

Biodiversidade de Ecossistemas Aquáticos 13/04/11 37
Measuring Biodiversity
Shannon-Wiener* H'
Site 1 Site 2 Site 1 -p*lnp
Site 2 -p*lnp
Sp A 12 49 0.34 0.06
Sp B 11 1 0.33 0.08
Sp C 14 1 0.36 0.08
Sp D 13 1 0.35 0.08
sum 50 52 1.38 0.28
12/38*Ln(12/38)

Biodiversidade de Ecossistemas Aquáticos 13/04/11 38
Measuring Biodiversity
Shannon Evenness J'
H '=−∑
i=1
n
pi ln pi
n = number of species in samplepi = proportion of species i in sampleS = total number of species observed
J '=
H '
H max
H max=ln S

Biodiversidade de Ecossistemas Aquáticos 13/04/11 39
Measuring Biodiversity
Simpson's Index D
n = number of species in samplepi = proportion of species i in sample
D=∑i=1
n
p2i
Simpsons's D measures the probability of any two individuals drawn at random from an infinitely large community belonging to the same species
Sometimes also reported as 1-D or 1/D

Biodiversidade de Ecossistemas Aquáticos 13/04/11 40
Measuring Biodiversity
Simpson's Index D
ni = total number of individuals of the ith species
N = total number of individualsS = total number of species
D=∑i=1
S niN
×[ni−1]
[N−1]
This version is for finite samples...
Biodiversidade de Ecossistemas Aquáticos 13/04/11 41
Measuring Biodiversity
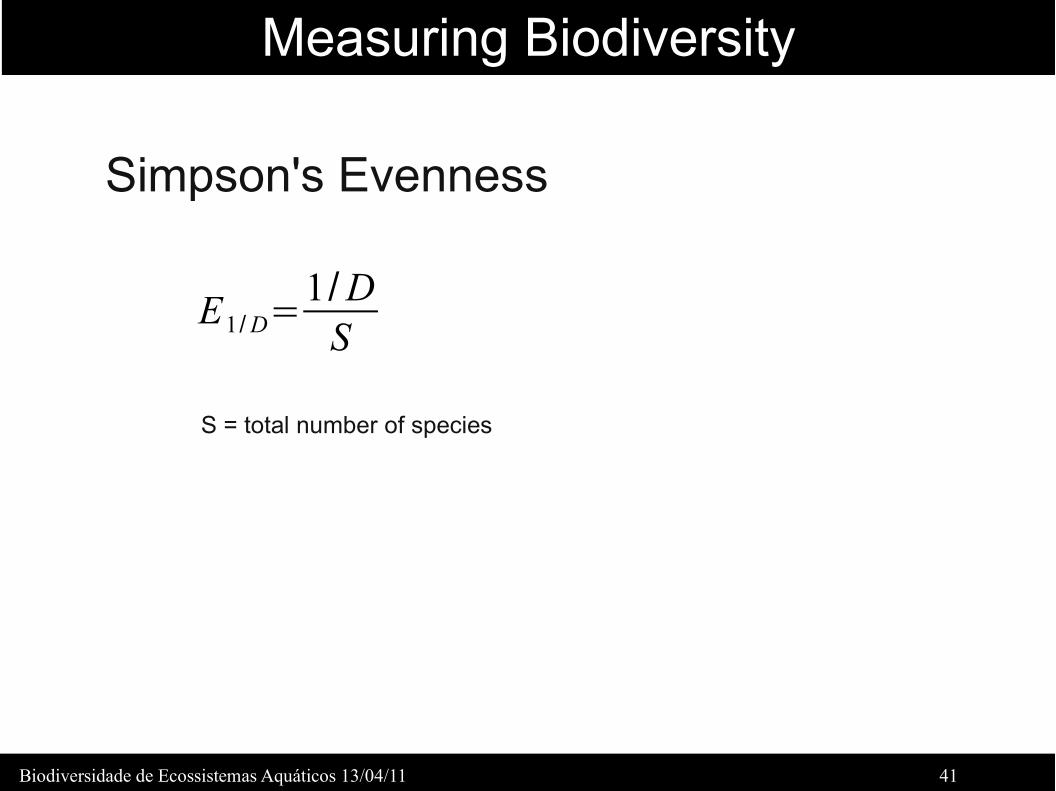
Simpson's Evenness
S = total number of species
E1 /D=1/DS

Biodiversidade de Ecossistemas Aquáticos 13/04/11 42
Measuring Biodiversity
Taxonomic Diversity

Biodiversidade de Ecossistemas Aquáticos 13/04/11 43
Measuring Biodiversity
Taxonomic Diversity
=[∑i=1
S−1
∑j=i1
S
ij xi x j ][ nn−1
2 ]S = total number of speciesx
i = proportion of ith species in sample
n = Σxi

Biodiversidade de Ecossistemas Aquáticos 13/04/11 44
Measuring Biodiversity
Taxonomic Diversity

Biodiversidade de Ecossistemas Aquáticos 13/04/11 45
Measuring Biodiversity
Taxonomic Distinctness
*=
[∑i=1
S−1
∑j=i1
S
ij x i x j ][∑i=1
S−1
∑j=i1
S
x i x j ]S = total number of speciesx
i = proportion of ith species in sample
Effects of proportionsof individuals are “removed”
Measures pure taxonomicrelatedness

Biodiversidade de Ecossistemas Aquáticos 13/04/11 46
Measuring Biodiversity
Average Taxonomic Path Length
+=
[∑i=1
S−1
∑j=i1
S
ij ][ S S−1
2 ]S = total number of species
This measure is a particular case of both Δ and Δ* when data is reduced to presence absence

Biodiversidade de Ecossistemas Aquáticos 13/04/11 47
Measuring Biodiversity
a) Δ+ = 3.0 b) Δ+ = 1.0 c) Δ+ = 1.56 d) Δ+ = 1.2
Average Taxonomic Path Length

Biodiversidade de Ecossistemas Aquáticos 13/04/11 48
Measuring Biodiversity
Taxonomic Diversity: invariant to sample size!
H' Pielou's JMergalef's D
ΔΔ Δ* Δ+

Biodiversidade de Ecossistemas Aquáticos 13/04/11 49
Measuring Biodiversity
Taxonomic Diversity: testing hypothesis

Biodiversidade de Ecossistemas Aquáticos 13/04/11 50
Measuring Biodiversity
Taxonomic Diversity: testing hypothesis

Biodiversidade de Ecossistemas Aquáticos 13/04/11 51
Measuring Biodiversity
Measuring β diversity

Biodiversidade de Ecossistemas Aquáticos 13/04/11 52
Measuring Biodiversity
Biodiversidade de Ecossistemas Aquáticos 13/04/11 53
Measuring Biodiversity
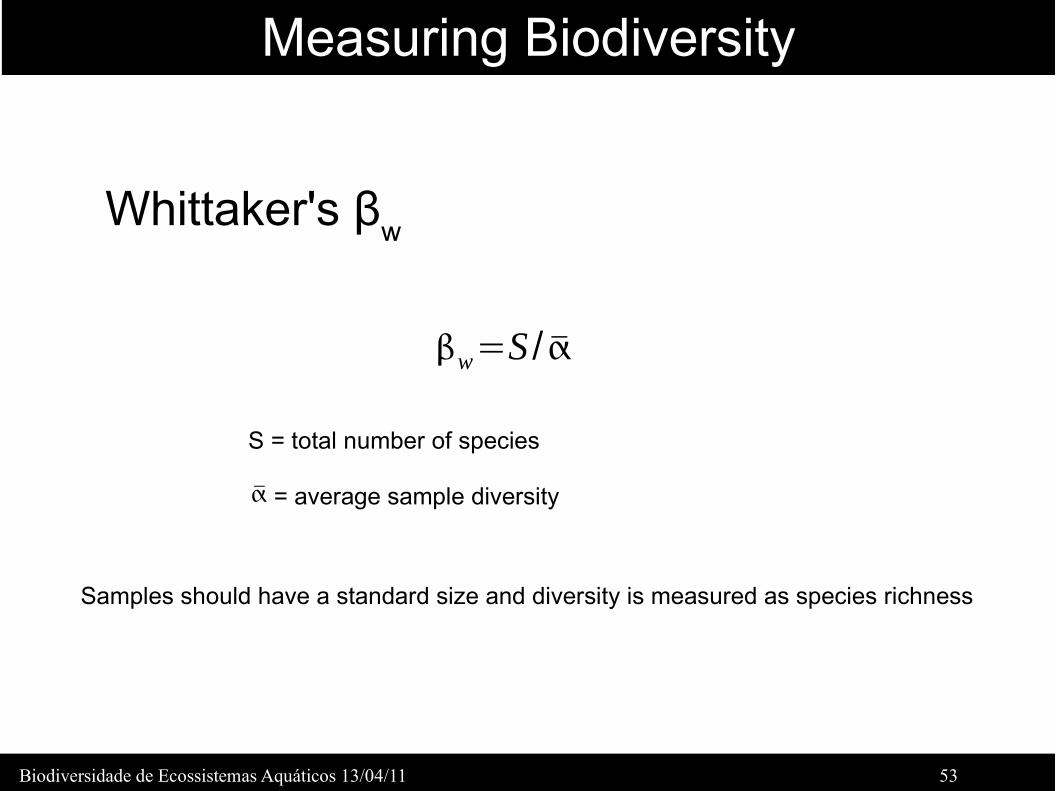
Whittaker's βw
w=S /
S = total number of species
= average sample diversity
Samples should have a standard size and diversity is measured as species richness

Biodiversidade de Ecossistemas Aquáticos 13/04/11 54
Measuring Biodiversity
Other measures
C=g H lH
2Cody's β
C
R=S2
2rS−1 Routledge's β
R
I=logT−[1/T ∑ ei log e i ]−[1/T ∑ Sj log Sj ] Routledge's βI
E=e I Routledge's β
E

Biodiversidade de Ecossistemas Aquáticos 13/04/11 55
Measuring Biodiversity
Indices of similarity and dissimilarity
CM=1−a
abc
a = number of species in both samplesb = number of species exclusive of sample 1c = number of species exclusive from sample 2
C j=a
abcCM is the complement of Jaccard's (1908) index

Biodiversidade de Ecossistemas Aquáticos 13/04/11 56
Measuring Biodiversity
Indices of similarity and dissimilarity
CM=1−a
abc
a = 7b = 2c = 2
CM=1−7
722=0.364
Species Site 1 Site 2 Site 3
Stenothoe monoculoides 122 28 4657
Arcturidae 0 0 16
Campecopea hirsuta 0 0 10
Cymodoce truncata 0 0 103
Dynamene bidentata 378 112 2224
Dynamene edwardsi 0 0 10
Dynamene magnitorata 14 0 1010
Gnathia sp. 20 0 12
Idotea baltica 0 0 22
Idotea granulosa 4 1011 3411
Idotea pelagica 0 107 627
Ischyromene lacazei 0 51 754
Between Site 1 and 2

Biodiversidade de Ecossistemas Aquáticos 13/04/11 57
Measuring Biodiversity
Indices of similarity and dissimilarity
CS=2a
2abc
sim=1− aaminb ,c
CN=2jNN aN b
Plenty of them...

Biodiversidade de Ecossistemas Aquáticos 13/04/11 58
Measuring Biodiversity
Multivariate Analysis
●Cluster Analysis (UPGMA, K-means, etc.)
●PCA (Principal Component Analysis)
●PCo (Principal Coordinate Analysis)
●CA (Correspondence Analysis)
●MDA (Multidimensional Scaling)
●etc.

Biodiversidade de Ecossistemas Aquáticos 13/04/11 59
Measuring Biodiversity
Non-metric Multidimensional Scaling