measuring digital development ict price t rends
TRANSCRIPT

ITUPublications
Measuring digital development
ICT price t rends2020
International Telecommunication UnionDevelopment Sector

Measuring digital development
ICT price trends 2020

© ITU 2021
Some rights reserved. This work is licensed to the public through a Creative Commons Attribution-Non-Commercial-Share Alike 3.0 IGO license (CC BY-NC-SA 3.0 IGO).
Under the terms of this licence, you may copy, redistribute and adapt the work for non-commercial purposes, provided the work is appropriately cited. In any use of this work, there should be no suggestion that ITU endorse any specific organization, products or services. The unauthorized use of the ITU names or logos is not permitted. If you adapt the work, then you must license your work under the same or equivalent Creative Commons licence. If you create a translation of this work, you should add the following disclaimer along with the suggested citation: “This translation was not created by the International Telecommunication Union (ITU). ITU is not responsible for the content or accuracy of this translation. The original English edition shall be the binding and authentic edition”. For more information, please visit https://creativecommons.org/licenses/by-nc-sa/3.0/igo/
Please consider the environment before printing this report.
Acknowledgements
This publication was prepared by the ICT Data and Analytics Division (IDA) within the Digital Knowledge Hub Department (DKH) of the Telecommunication Development Bureau (BDT) of the International Telecommunication Union. The main author was Daniel Vertesy, with substantial input from Thierry Geiger and Martin Schaaper. Nehal Desai and Daniela Pokorna contributed to data verification and preparation, Esperanza Magpantay provided helpful comments on data collection and drafts of the report, and Mihaela Cekovic provided valuable administrative support. The 2020 data were collected by ITU in collaboration with the Alliance for Affordable Internet (A4AI). The contributions of Carlos Iglesias and Ana Maria Rodrigues Pulgarin (A4AI) and Shazna Zuhyle (LIRNEasia) to data collection are gratefully acknowledged. The report was edited by Eduard Friesen. Desktop publishing and cover design were carried out by the ITU Publication Production Service (PUBL).
Disclaimer
The designations employed and the presentation of the material in this publication do not imply the expression of any opinion whatsoever on the part of ITU concerning the legal status of any country, territory, city or area or of its authorities, or concerning the delimitation of its frontiers or boundaries. The mention of specific companies or of certain manufacturers’ products does not imply that they are endorsed or recommended by ITU in preference to others of a similar nature that are not mentioned. Errors and omissions excepted, the names of proprietary products are distinguished by initial capital letters.
All reasonable precautions have been taken by ITU to verify the information contained in this pub-lication. However, the published material is being distributed without warranty of any kind, either expressed or implied. The responsibility for the interpretation and use of the material lies with the reader. The opinions, findings and conclusions expressed in this publication do not necessarily reflect the views of ITU or its membership.
ISBN
978-92-61-32651-7 (Paper version) 978-92-61-32661-6 (Electronic version) 978-92-61-32671-5 (EPUB version) 978-92-61-32681-4 (Mobi version)

Foreword
ICT price trends 2020 is a key element of our Measuring digital development series of statistical and analytical publications. In the current context, with the global pandemic continuing to impose severe constraints on people’s ability to go about their normal business, connectivity represents a lifeline, a way to ensure some level of continuity in critical activities, including working and learning. Yet today, this lifeline remains out of reach of almost half the world’s population. The cost of connecting contributes to explaining why some 3.7 billion people have never gone online. And for many of the 4 billion or so people who are online, high costs
are preventing many from harnessing the full potential of the online world.
This annual publication presents, analyses and compares the prices of ICT services for more than 200 economies, providing unique and invaluable insight into the state of ICT affordability around the world. Crucially, it informs on progress made by countries towards achieving the United Nations Broadband Commission for Sustainable Development affordability target for 2025, according to which entry-level broadband services should be made available in developing countries at a level corresponding to less than 2 per cent of monthly gross national income per capita.
This year’s report reveals that, overall, ICT services have become more affordable. In many countries, however, entry-level broadband services remain prohibitively expensive, and the 2 per cent target a distant prospect. This edition features new measures of affordability that also reveal vast, persisting disparities within countries, showing that, even where the target has been met for a country as a whole, entry-level broadband services often remain out of reach for the poorest. In this context, there is no room for complacency.
This publication is the culmination of a massive data collection effort led by ITU in collaboration with the Alliance for Affordable Internet (A4AI) and the administrations of Member States around the world. I thank them all for their collaboration, and am grateful for their invaluable support.
The COVID-19 global health emergency has made us all acutely aware of the vital importance of broadband networks to social and economic prosperity and global development. I hope this authoritative report serves as a crucial pillar of renewed efforts to urgently drive down costs and make digital services more affordable, and thus more available, to all people of the world.
Doreen Bogdan-Martin Director, Telecommunication Development Bureau
International Telecommunication Union
iii

iv
Acknowledgements ���������������������������������������������������������������������������������������������������������������������� 2
Foreword �����������������������������������������������������������������������������������������������������������������������������������������iii
List of tables, figures and boxes ���������������������������������������������������������������������������������������������������vi
Executive summary ������������������������������������������������������������������������������������������������������������������������ix
Slow progress towards the affordability target ������������������������������������������������������������������ix
ICT prices declined worldwide – but at a slowing pace ����������������������������������������������������ix
Affordability gaps between developed and developing countries still significant ��������x
Inequality causes affordability gaps within countries ��������������������������������������������������������xi
Regional disparities ���������������������������������������������������������������������������������������������������������������xi
Affordability as a barrier to access ��������������������������������������������������������������������������������������xii
More mature regulations, lower prices ������������������������������������������������������������������������������xii
1. Introduction ...............................................................................................................1
2. Measuring ICT prices: the ITU approach ..............................................................4
Data collection������������������������������������������������������������������������������������������������������������������������ 5
Other costs ������������������������������������������������������������������������������������������������������������������������������ 6
Historical comparisons ���������������������������������������������������������������������������������������������������������� 6
Methodology for computing aggregate prices for regions and country groups ���������� 6
3. Basket prices .............................................................................................................8
Broadband baskets ���������������������������������������������������������������������������������������������������������������� 8
3�1 Data-only mobile broadband basket ����������������������������������������������������������������������� 8
Global trends ��������������������������������������������������������������������������������������������������������������� 8
Regional trends �������������������������������������������������������������������������������������������������������� 11
Affordability ��������������������������������������������������������������������������������������������������������������� 12
Affordability changes between 2019 and 2020 ���������������������������������������������������� 13
Data allowance: value for money ���������������������������������������������������������������������������� 14
3�2 Fixed broadband basket (5GB) ������������������������������������������������������������������������������ 19
Global trends ������������������������������������������������������������������������������������������������������������� 19
Regional trends ��������������������������������������������������������������������������������������������������������� 21
Affordability ��������������������������������������������������������������������������������������������������������������� 22
Affordability changes between 2019 and 2020 ���������������������������������������������������� 23
Data allowances: value for money �������������������������������������������������������������������������� 24
Table of Contents

Quality improvements ������������������������������������������������������������������������������������������������ 28
3�3 Mobile cellular low-usage basket ����������������������������������������������������������������������������� 29
Global trends ��������������������������������������������������������������������������������������������������������������� 30
Affordability ����������������������������������������������������������������������������������������������������������������� 31
Regional trends ����������������������������������������������������������������������������������������������������������� 32
3�4 Mobile data and voice baskets ���������������������������������������������������������������������������������� 34
Global trends ��������������������������������������������������������������������������������������������������������������� 36
Affordability ���������������������������������������������������������������������������������������������������������������� 38
Regional trends ����������������������������������������������������������������������������������������������������������� 39
Allowances: value for money ������������������������������������������������������������������������������������� 41
4. Inequality and the affordability of broadband services .....................................44
Inequality indicators �������������������������������������������������������������������������������������������������������������� 44
Africa ���������������������������������������������������������������������������������������������������������������������������������������� 46
Arab States ������������������������������������������������������������������������������������������������������������������������������ 47
Asia and the Pacific ���������������������������������������������������������������������������������������������������������������� 48
CIS �������������������������������������������������������������������������������������������������������������������������������������������� 50
Europe ������������������������������������������������������������������������������������������������������������������������������������� 50
The Americas �������������������������������������������������������������������������������������������������������������������������� 51
5. The regulatory environment and ICT prices .........................................................53
6. Conclusion .................................................................................................................55
Annex 1: ICT price data methodology ..........................................................................56
ICT price baskets �������������������������������������������������������������������������������������������������������������������� 56
The mobile cellular low-usage basket ��������������������������������������������������������������������������������� 57
The fixed broadband basket ������������������������������������������������������������������������������������������������ 59
The data-only mobile broadband price basket ����������������������������������������������������������������� 61
The mobile broadband data-and-voice price baskets ������������������������������������������������������ 63
Price-data collection and sources ���������������������������������������������������������������������������������������� 65
Annex 2: Detailed ICT price tables, 2020 ....................................................................66
Annex 3: Tables on inequality and affordability of broadband services .................96
v

vi
List of tables, figures and boxes
Tables
Table E1: Global median prices and trends for the five baskets, 2020 ..............................x
Table 1: Median voice, SMS and data allowances by region and level of development for the mobile data and voice low-consumption basket, 2020 ................. 42
Table 2: Median voice, SMS and data allowances by region and level of development for the mobile data and voice high-consumption basket, 2020 ............... 43
Annex Table 1.1: Revised mobile cellular low-usage basket, call and SMS distribution ................................................................................................................................. 58
Annex Table A2.1: Data-only mobile broadband basket details, 2020 ........................... 66
Annex Table A2.2: Fixed broadband basket details, 2020 ................................................ 72
Annex Table A2.3: Mobile cellular low-usage basket details, 2020 ................................. 78
Annex Table A2.4: Mobile data and voice low-consumption basket details, 2020 ........ 84
Annex Table A2.5: Mobile data and voice high-consumption basket details, 2020 ...... 90
Annex Table A3.1: Mobile broadband prices as a percentage of income, selected countries, 2020 .......................................................................................................... 96
Annex Table A3.2: Fixed broadband prices as a percentage of income, selected countries, 2020 ........................................................................................................100
Figures
Figure E1: Median price for the 5 baskets, by level of development, as a percentage of monthly GNI per capita, 2019-2020 ...............................................................xi
Figure E2: ICT prices by generation of ICT regulation .........................................................xii
Figure 1: Key trends in the evolution of subscriptions, Internet use and network coverage, 2008-2020* ................................................................................................. 3
Figure 2 Comparison of ICT price baskets .............................................................................. 5
Figure 3: Mapping historical ICT price baskets and definitions ........................................... 7
Figure 4: Evolution of median data-only mobile broadband basket prices, 2013-2020 .................................................................................................................................... 9
Figure 5: Changes in active mobile broadband subscriptions per 100 inhabitants and data-only mobile broadband basket prices, 2013-2020* ....................... 10
Figure 6: Price of mobile broadband basket against GNI per capita, 2020 .................... 11
Figure 7: Mobile broadband prices by region, 2020, in USD (left) and in PPP$ (right) ........................................................................................................................................... 12
Figure 8: Number of economies achieving the Broadband Commission target with data-only mobile broadband services, 2020 ............................................................... 13
Figure 9: Data-only mobile broadband basket price across countries, by region, level of development and income, as % of GNI, 2019-2020 ................................ 14
Figure 10: Median price of 1 GB of mobile broadband data in PPP$, 2020 ................... 15
Figure 11: Mobile broadband price and data allowance by country in Africa, 2020 ..... 15

Figure 12: Mobile broadband price and data allowance by country in the Arab States, 2020 ...................................................................................................................... 16
Figure 13: Mobile broadband price and data allowance by country in the Asia and the Pacific region, 2020 .................................................................................................... 16
Figure 14: Mobile broadband price and data allowance by country in the CIS region, 2020 ............................................................................................................................... 17
Figure 15: Mobile broadband price and data allowance by country in Europe, 2020 ............................................................................................................................................. 18
Figure 16: Mobile broadband price and data allowance by country in the Americas, 2020 .......................................................................................................................... 18
Figure 17: Evolution of median fixed broadband basket prices, 2008-2020 .................. 19
Figure 18: Changes in fixed broadband subscriptions per 100 inhabitants and fixed broadband basket prices, 2008-2020* ........................................................................ 20
Figure 19: Fixed broadband prices by region, 2020, in USD (left) and in PPP$ (right) ........................................................................................................................................... 22
Figure 20: Country progress in achieving the Broadband Commission target with fixed broadband services, 2020 ..................................................................................... 23
Figure 21: Fixed broadband basket prices by region, level of development and income, 2019-2020 ........................................................................................................... 24
Figure 22: Fixed broadband prices as a percentage of GNI p.c., speeds and allowances, Africa, 2020 ........................................................................................................... 25
Figure 23: Fixed broadband prices as a percentage of GNI p.c., speeds and allowances, Arab States, 2020 ................................................................................................. 25
Figure 24: Fixed broadband prices as a percentage of GNI p.c., speeds and allowances, Asia and the Pacific, 2020 ................................................................................... 26
Figure 25: Fixed broadband prices as a percentage of GNI p.c., speeds and allowances, CIS region, 2020 .................................................................................................. 27
Figure 26: Fixed broadband prices as a percentage of GNI p.c., speeds and allowances, Europe, 2020 ........................................................................................................ 27
Figure 27: Fixed broadband prices as a percentage of GNI p.c., speeds and allowances, the Americas, 2020 .............................................................................................. 28
Figure 28: Share of economies according to the advertised speed for the most common entry-level fixed broadband connection, by region and level of development, 2018-2020 ........................................................................................................ 29
Figure 29: Median advertised speed for the most common entry-level fixed broadband connection, by level of development and region ........................................... 29
Figure 30: Evolution of the mobile cellular low-usage basket prices, 2008-2020 .......... 30
Figure 31: Changes in mobile cellular subscriptions per 100 inhabitants and basket prices, 2008-2020* ....................................................................................................... 31
Figure 32: Mobile cellular low-usage basket prices by region, level of development and income, 2019-2020 .................................................................................. 32
Figure 33: Mobile cellular prices by region, 2020, in USD (left) and in PPP$ (right) ...... 33
vii

viii
Figure 34: The mobile data and voice, low-consumption basket prices (PPP$) in comparison with other mobile basket prices, by level of development and income, 2020 ............................................................................................................................. 35
Figure 35: Evolution of mobile data and voice low and high-consumption basket prices, 2018-2020 ......................................................................................................... 37
Figure 36: Mobile data and voice low and high-consumption basket prices by region and level of development, as a percentage of monthly GNI per capita, 2018-2020 .................................................................................................................................. 38
Figure 37: Data and voice low and high-consumption basket prices by region in 2020, in USD (upper) and in PPP$ (lower) ......................................................................... 40
Figure 38: How to read the charts on inequality and affordability .................................... 46
Figure 39: Affordability of broadband baskets by consumption deciles in selected African countries, 2020 ............................................................................................. 47
Figure 40: Affordability of broadband baskets by consumption deciles in selected Arab States, 2020 ...................................................................................................... 48
Figure 41: Affordability of broadband baskets by consumption deciles in selected economies of Asia and the Pacific region, 2020 .................................................. 49
Figure 42: Affordability of broadband baskets by consumption deciles in selected CIS countries, 2020 ................................................................................................... 50
Figure 43: Affordability of broadband baskets by income deciles in Europe, 2020 ...... 51
Figure 44: Affordability of broadband baskets by income deciles in selected countries in the Americas, 2020 .............................................................................................. 52
Figure 45: Evolution of the generation of ICT regulation, 2008-2019 .............................. 53
Figure 46: ICT prices by generation of ICT regulation ........................................................ 54
Annex Figure 1: Current ICT price baskets (from 2018) ...................................................... 56
Annex Figure 2: ICT price baskets up to 2017 ...................................................................... 56
Boxes
Box 1: Affordable ICT services as a development target ...................................................... 1
Box 2: Context: the changing connectivity landscape .......................................................... 3
Annex Box 1.1: Rules applied in collecting mobile cellular price data ............................. 58
Annex Box 1.2: Rules applied in collecting fixed-broadband Internet price data .......... 60
Annex Box 1.3: Rules applied in collecting mobile broadband price data ...................... 62
Annex Box 1.4: Rules applied in collecting data-and-voice price data ............................. 64

Executive summary
The COVID-19 pandemic has brought to the fore the importance of affordable broadband access to the Internet and other information and communication technology (ICT) services. This report describes the output of a 2020 affordability study that looked at prices and historical trends through five representative baskets of services: one for data-only mobile broadband; one for fixed broadband; one for mobile cellular (low usage); and two baskets for combined data and voice mobile services, one for low consumption and one for high consumption. The report is intended to serve as a prime source for monitoring affordability gaps around the world. The data and analyses should, in turn, help develop policies for bridging the digital divide.
Slow progress towards the affordability target
The United Nations Broadband Commission on Sustainable Development aims to make broadband prices affordable in developing countries by having the prices that are charged for broadband access brought below 2 per cent of gross national income (GNI) per capita by 2025. There is some way left to go before the target is reached. By that benchmark, in 2020 the mobile broadband basket remained unaffordable in 84 of the studied economies around the world (45 per cent), and the fixed broadband basket was unaffordable in 111 (56 per cent).
Least developed countries (LDCs) are particularly affected. While the median price paid in those countries for entry-level broadband services has declined over the past year, mobile broadband remains beyond the means of the average consumer in 39 out of the 43 countries for which data were available, and fixed broadband in 32 out of 33.
ICT prices declined worldwide – but at a slowing pace
Prices for all five of the baskets monitored continued their slow but steady decline by all three of the measures used: prices converted to US dollars, adjusted to purchasing power parities, or expressed as a percentage of per capita income (GNI p.c.) (Table E1). The global median price came in under the 2 per cent benchmark for three of the baskets: the mobile cellular low-usage basket, the data-only mobile broadband basket, and the mobile data and voice low-consumption basket. However, the rate at which prices are falling has started to bottom out for both the fixed broadband and the mobile cellular low-usage basket.
ix

Table E1: Global median prices and trends for the five baskets, 2020
Basket (monthly
allowance)
Data-only mobile broad-
band(1.5 GB)
Fixed broad-band(5 GB)
Mobile cellu-lar, low usage(70 mins + 20
SMS)
Mobile data and voice, low consumption(70 mins + 20
SMS + 500 MB)
Mobile data and voice, high consumption
(140 mins + 70 SMS + 1.5 GB)
Worldwide median price 2020
USD 10.1 25.1 9.6 12.1 17.3
PPP$ 18.5 43.4 17.0 22.9 31.6
% GNI p.c. 1.7 3.0 1.6 1.9 2.6
Price trends (period)
(2013-2020) (2008-2020) (2008-2020) (2018-2020) (2018-2020)
USD (constant) -10.4% -4.8% -7.1% -11.4% -16.4%
PPP$ -5.3% -0.5% -3.8% -1.6% -8.8%
% GNI p.c. -7.8% -5.8% -9.6% -10.5% -9.7%
Note: Worldwide median basket prices calculated for all countries with data available for 2020. Price trends are given as compound annual growth rates (CAGR), calculated for the set of countries with data available for the periods indicated and adjusted for inflation.Source: ITU and A4AI.
Affordability gaps between developed and developing countries still significant
The prices of all baskets remained significantly higher in developing countries than in developed ones (Figure E1). The affordability gap was particularly wide for the baskets containing data allowance. Still, developing countries have been the main drivers of a global price decline. The biggest improvement in affordability for developing countries and LDCs, measured in absolute price terms, was seen in the mobile data and voice low-consumption basket (defined as including 70 minutes of voice, 20 SMSs and 500 MB of data per month). This basket proved particularly relevant for consumers in lower-income economies, as indicated by the high price differential between it and the high-consumption basket (140 minutes of voice, 70 SMSs and 1.5 GB data). In higher-income countries, by contrast, that difference was barely significant.
Fixed broadband remains the most expensive of the five baskets. Whether expressed in USD or in GNI per capita, prices for fixed broadband have remained largely unchanged around the world over the past five years. This stagnation is particularly worrying for LDCs: in the absence of policy intervention, they are unlikely to escape from the trap of very low subscription levels and prohibitively high prices by market forces alone. Furthermore, the fixed-broadband gap between developed and developing countries is not limited to the price consumers have to pay; the quality of the service is not the same. In developed economies the median speed of entry-level connections increased from 30 to 40 Mbit/s in the past year, while in developing countries it only went from 3 to 5 Mbit/s.
x

Figure E1: Median price for the 5 baskets, by level of development, as a percentage of monthly GNI per capita, 2019-2020
1.91.7
3.12.9
1.6 1.6
2.11.9
2.92.6
0.80.6
1.2 1.2
0.6 0.60.8 0.8
0.9 0.9
2.9
2.5
4.84.7
2.12.0
4.0
3.1
4.8
4.1
0%
1%
2%
3%
4%
5%
2019 2020 2019 2020 2019 2020 2019 2020 2019 2020
Data-only mobilebroadband
Fixed broadband Mobile cellularlow-usage
Mobile data and voicelow-consumption
Mobile data and voicehigh-consumption
←Af
ford
able
Una
fford
able
→
target (2%)
developing countries
world
developed countries
as % of monthly GNI per capita
Note: Median values for each basket are calculated based on the set of economies for which 2019 and 2020 data were available: 183 economies in the case of the data-only mobile broadband basket; 170 for the fixed broadband basket; 190 for the mobile cellular low-usage basket; and 179 and 182 respectively for the mobile data and voice low and high-usage baskets.
Inequality causes affordability gaps within countries
The data revealed important affordability gaps not only between countries, but also within them. Developing countries were once again particularly affected. The 40 per cent of the population with the lowest income could only afford entry-level mobile broadband services in 10 of the 66 developing countries for which data were available. Domestic affordability gaps were also noted in developed countries, though they were not as severe. Among the 42 economies where the average earner could afford the data-only mobile broadband basket, domestic inequalities within 7 of them meant that the 40 per cent lowest earners would have to spend more than 2 per cent of their monthly income on this basket.
For the populations of the higher-income economies, broadband thus remained within their means. Not so in the low-income economies, particularly those afflicted with high inequality. For them, broadband was a luxury, affordable at best for the highest-earning 20 per cent. Indeed, in 7 of the 24 African region countries for which data were available, even the highest-earning 10 per cent would have to spend over 2 per cent of their monthly income to use mobile broadband services. Addressing the affordability of ICT services in low-income communities is thus crucial for connecting the second half of humanity.
Regional disparities
The biggest relative improvements in affordability for all five baskets were seen in Africa, although median prices for the region remained well above world prices. Basket prices were most affordable in Europe. Most of the other regions were characterized by considerable variation, and inter-regional disparities were less pronounced, by and large, than the disparities between countries with different levels of development and income.
xi

Affordability as a barrier to access
In general there is a negative correlation between price levels and penetration rates, for the ICT services monitored. Yet the relationship is not always a straightforward one. Thus, even as prices in LDCs declined for the mobile and fixed broadband baskets, subscription numbers remained low, a possible indication that penetration will only increase once prices drop to a level where they are affordable for the average earner.
Recent developments in mobile cellular (low usage) subscriptions presented another notable exception. The price of the mobile cellular basket (least expensive of the five) dropped in 2020, and yet global subscription numbers fell for the first time ever, a decline triggered by specific market dynamics in developing countries and LDCs. In the past, the evolution trajectory of developing countries was observed to trail that of developed countries, with a lag of over a decade. The current reversal, even if it proves to be temporary, will further increase the gap in affordability and access between developing and developed countries.
More mature regulations, lower prices
Price levels for ICT services in a country are influenced by a variety of factors; but one overarching influence on overall affordability is the maturity of the regulatory environment. For all five baskets, the median prices (expressed as a percentage of GNI per capita) in 2020 were highest in countries which had the least mature regulatory environment (first or second generation) in 2019; conversely, prices were lowest in countries which had the most mature regulatory environment (fourth generation) the previous year (Figure E2). Worldwide median basket prices were only affordable in the case of these latter group of countries, all meeting the 2 per cent affordability target of the Broadband Commission.
Figure E2: ICT prices by generation of ICT regulation
Note: Median basket prices were computed for each basket and regulatory generation (based on the 2019 classification) for those countries for which relevant data were available (171 for the fixed broadband basket, 181 for the data-only mobile broadband basket and for the low and high-consumption mobile data and voice baskets, and 183 for the mobile cellular low-usage basket).Source: ITU and A4AI.
xii

ICT price trends 2020
1
1. Introduction
Affordability of information and communication technology (ICT) services remains a key obstacle to achieving universal connectivity. With the onset of the COVID-19 pandemic, it has become an even more central and pressing issue. The lack of affordable access can exacerbate the socio-economic hardships brought about by the pandemic. Conversely, affordable Internet access is good news for business and service continuity, and benefits society as a whole by strengthening social cohesion and improving the flow of information.
Although 85 per cent of the world’s population lives in areas covered by networks that allow mobile broadband connections, one person in two was still offline in 2019.1 This paradox is a reminder for policy-makers and telecommunication operators to consider the factors that limit ICT access – including the affordability of ICT services.2
Box 1: Affordable ICT services as a development target
The promotion of affordable Internet access is enshrined in the Sustainable Development Goals. Thus, target 9.c is to “significantly increase access to information and communications technology and strive to provide universal and affordable access to the Internet in least developed countries by 2020” as part of the effort towards achieving Sustainable Development Goal 9: to build resilient infrastructure, promote sustainable industrialization and foster innovation.
ITU’s Connect 2030 Agenda for Global Telecommunication/ICT Development1 also includes two measurable targets related to the affordability of ICT services. Target 1.3 aims to make Internet access 25 per cent more affordable by 2023 compared to the baseline year of 2017; target 2.5 aims to reduce the affordability gap between developed and developing countries by 25 per cent in the same time period. The targets are key drivers to reach the first two of the five goals of the Connect 2030 Agenda: growth and inclusiveness.
1 Connect 2030 Agenda for Global Telecommunication/ICT Development: https:// www .itu .int/ en/ mediacentre/ backgrounders/ Pages/ connect -2030 -agenda .aspx
In 2018 the Broadband Commission for Sustainable Development established by ITU and UNESCO defined seven measurable targets to help connect the “Other Half” of the world’s population. One of the targets for universal digital connectivity concerns affordability: the aim is to reduce the price of entry-level fixed or mobile broadband services in developing countries to less than 2 per cent of monthly gross national income (GNI) per capita by 2025. The Broadband Commission emphasized the importance of affordable access as one of the three pillars of
1 ITU (2020) Measuring digital development: Facts and figures 2020. https:// www .itu .int/ en/ ITU -D/ Statistics/ Documents/ facts/ FactsFigures2020 .pdf
2 The impact of prices or affordability of ICT services on connectivity is very complex. Connectivity depends on socio-economic factors such as income, education level and age, not only the market environment or prices. Moreover, the magnitude of the effect of prices is bound to change with the diffusion of broadband technology (see e.g. Lee et al. 2011; Galperin & Ruzzier, 2013; Lin and Wu, 2013; or Katz and Callorda, 2018). The diversity of findings highlights the importance of collecting detailed, reliable price statistics over time.

ICT price trends 2020
2
its Agenda for Action in response to the COVID-19 crisis.3 While the analysis of ICT prices in this report is guided by the Broadband Commission’s target, there are further targets placing affordability of ICT services high on the global development agenda, as shown in Box 1.
ITU has been collecting statistics on ICT services worldwide, using the methodologies and guidelines defined by the Expert Group on Telecommunication/ICT Indicators (EGTI). In 2020, ITU joined forces with the Alliance for Affordable Internet (A4AI) to jointly collect, analyse and disseminate ICT price statistics. The present report shares the results of the 2020 data collection, covering more than 200 economies around the world. The report presents and analyses the retail prices and affordability of mobile broadband, fixed broadband, and mobile cellular services across countries and regions, using five ICT price baskets. Apart from presenting 2020 prices, where possible the report provides a historical overview of price trends since 2008. The ICT connectivity landscape has changed tremendously over this period, as the chart in Box 2 shows.
This report aims to identify affordability gaps not only between, but also within countries. Given inequalities in income and consumption patterns, it is not enough to focus on how affordable broadband Internet is for the average user: information is needed on the low-income populations, if one hopes to connect the other half of humanity. A separate section of the report (section 4) is therefore dedicated to analysing inequalities and the affordability of broadband prices for the population in the bottom 40 per cent of the income distribution.
The remainder of the report is structured in five main sections. Section 2 provides some context and background, and describes the methodology used for measuring ICT prices. Section 3 is devoted to an analysis of global and regional trends in prices and affordability of all the five price baskets. It begins with the two broadband ones: the mobile broadband basket and the fixed broadband basket, followed by the three mobile baskets in order of increasing complexity: first the voice- and SMS-only mobile cellular low-usage basket and then the two mobile data and voice baskets, one for a low consumption case and the other for high consumption. Section 4 is on inequality and affordability of broadband services, section 5 addresses the link between the regulatory environment and ICT prices, and section 6 concludes. Annex 1 gives the detailed rules used for data collection. Annex 2 gives the detailed country tables for the five baskets. Annex 3 describes the indicators of inequality. Supplementary tables are also available online with the complete set of data collected.
3 COVID-19 crisis. Broadband Commission Agenda for Action. For faster and better recovery. https:// broadbandcommission .org/ publication/ covid19 -crisis -agenda -for -action/

ICT price trends 2020
3
Box 2: Context: the changing connectivity landscape
The ICT connectivity landscape has changed tremendously since 2008. ITU estimates that in mid-2020 there were 105 mobile cellular subscriptions and 75 active mobile broadband subscriptions per 100 individuals, and a year earlier the proportion of the global population that uses the Internet was estimated at over 51.4 per cent (Figure 1). Mobile broadband infrastructure and services have improved significantly in just the past five years. While the share of the world’s population covered by at least a 3G mobile network (technologies enabling broadband connections) was around 78.3 per cent in 2015, it increased to 93.1 per cent by 2020, with subscriptions keeping pace. Global penetration of fixed broadband services continues to lag far behind mobile broadband: the past five years witnessed a more modest increase of about 3.8 percentage points, to an estimated 15.2 subscriptions per 100 inhabitants in 2020. However, the reach of fixed broadband networks should not be underestimated, as a household or organizational subscription usually serves multiple individuals. The large-scale trends shown in Figure 1 were selected to put the developments in ICT prices in context. More detailed information on the trends is available in the 2020 edition of the ITU publication “Measuring digital development: Facts and figures”. 1
Figure 1: Key trends in the evolution of subscriptions, Internet use and network coverage, 2008-2020*
*ITU estimate, June 2020.Source: ITU.
1 https:// www .itu .int/ en/ ITU -D/ Statistics/ Pages/ facts/ default .aspx

ICT price trends 2020
4
2. Measuring ICT prices: the ITU approach
This report uses the latest methodology approved by ITU’s Expert Group on Telecommunication/ICT Indicators (EGTI). It presents and analyses price data for five baskets, selected for their relevance and applicability, to compare ICT prices in developing and developed economies around the world. It is an established practice for the international comparison of prices of non-tradable services to define and benchmark comparable units or baskets of services.
Finding a single benchmark for a global comparison is difficult because economies – and consequently their telecommunication markets – differ in terms of size, physical and socio-geographical attributes (e.g. size and location of habitable areas, distribution of population within countries), and level of development. Moreover, there is a variety of reasons for and ways in which people around the world access and use ICT services, hence the need for relying on a variety of baskets for comparison. To reflect this global diversity, ITU price comparisons encompass both fixed and mobile services, voice and messaging, as well as data traffic. This results in a set of five baskets of ICT services: data-only mobile broadband; fixed broadband; low-usage mobile cellular; and mobile data and voice, divided into a low and a high-consumption basket. The baskets are defined according to specific monthly allowance thresholds, technology and validity requirements to ensure global comparability as much as possible. Figure 2 gives an overview of the baskets and allowances, and Annex 1 provides full details on data collection rules.
The appropriate measure of comparison depends on the purpose. Prices expressed in a widely used currency, such as the United States dollar (USD), allow for a ready comparison across countries. However, for a meaningful comparison, differences in income levels and purchasing power need to be considered. Therefore, ITU has historically measured and published statistics on ICT prices using three measures:
• In USD, using the average exchange rates published by the International Monetary Fund (IMF)4. The rates used for 2020 were those for the second and third quarter; for previous years, the average annual rates were used. For economies where the IMF exchange rates were unavailable, the relevant UN Operational Rate of Exchange5 was used whenever available.
• In international dollars at purchasing power parity (PPP$), using PPP conversion factors instead of market exchange rates.6
4 Exchange Rates, Domestic Currency per US Dollar, Period Average, Rate - ENDA_XDC_USD_RATE (https:// data .imf .org )
5 https:// treasury .un .org/ operationalrates/ OperationalRates .php 6 For example, if country A and country B have the same price in USD for a given ICT service, but in country A
the prices of other products are generally cheaper (in USD), then applying PPP exchange rates will assess the price of the ICT service in country A as being higher. This is because, compared with country B, in country A the same amount of USD (exchanged into national currency at market exchange rates) can buy more products or services. Therefore, the ICT service in country A is more expensive in terms of what could be bought with the same amount in each country. The International Comparison Program is the major global initiative to produce internationally comparable price levels. For more information on PPP methodology and data, see http:// icp .worldbank .org. PPP conversion factors used in this report are from the World Bank’s World Development Indicators, 2019 (or last available year).

ICT price trends 2020
5
• As a percentage of countries’ monthly gross national income per capita (GNI p.c.). These price figures are expressed as a percentage of GNI p.c. to provide an indication of the affordability of each ICT service at the country level.7
Figure 2 provides an overview of the resulting matrix of five baskets and the three affordability measures.
Figure 2 Comparison of ICT price baskets
Source: ITU.
Data collection
The prices collected for each service are those for the cheapest plan offered by the dominant operator (measured in terms of market share by corresponding subscriptions) that fulfils the usage requirement of each basket. (Occasionally, when market data were unclear, the historical incumbent or an alternative operator was used.) ICT price data collection and benchmarking take the perspective of individual and household users, rather than businesses (even if the dividing line is often elusive, especially when considering family-owned micro or small enterprises). The data were collected from country surveys and operator websites over the period June-August 2020, covering 200 economies. Many operators around the world offered special promotions (lower prices, more generous allowances) in response to the COVID-19 pandemic, but following the price rules, these could not be taken into consideration. Detailed rules on price data collection are provided in Annex 1: ICT price data methodology. They are also available in the ITU Handbook for the collection of administrative data on telecommunications/ICT, 2020 edition.8 For each basket, a range of quantitative and qualitative data were collected, including the names, the price and validity of plans and eventual add-ons, allowances and excess prices, and tax rates), which were carefully assessed in computing the comparable basket prices.
7 GNI takes into account all production in the domestic economy (i.e. gross domestic product) plus the net flows of factor income (such as rents, profits and labour income) from abroad. In order to avoid multiple conversions, GNI prices were taken in local currency from the World Bank’s World Development Indicators – NY_GNP_PCAP_CN (GNI per capita current LCU); where prices were registered in USD, the Atlas method (current USD) was used instead.
8 https:// www .itu .int/ en/ ITU -D/ Statistics/ Pages/ publications/ handbook .aspx

ICT price trends 2020
6
Other costs
This report focuses on the prices of ICT services that ITU has been collecting regularly – the price of plans and other recurring charges. It is important to keep in mind that consumers also face other costs in connection with using these services, such as the acquisition cost of devices or the cost of the energy needed to operate them. In lower income markets in particular, these additional costs can significantly affect the affordability of overall ICT services.
Historical comparisons
ITU has systematically benchmarked ICT prices since the 1990s, which allows historical trends in the evolution of ICT prices to be explored. However, ICTs are characterized by fast-paced technological change; generations of technologies replace one another in less than a decade’s time. It is therefore difficult to chart trends over the years without making concessions to quality changes, which inevitably hampers comparability. Following the EGTI, ITU has revised the methodology for computing ICT prices from 2018 on to reflect the changing realities of telecommunication markets worldwide. Some of the baskets currently in use can be mapped – with varying degrees of commonality – to baskets collected according to the methodology that was applicable from 2008 or 2013 until 2017,9 as indicated in the simplified scheme of Figure 3. This is the basis for the historical price series presented in this report. There are breaks in the series between 2017 and 2018 for the data-only mobile broadband and the mobile cellular low-usage baskets. In the first case, prices are shown for the computer-based, postpaid mobile broadband basket with a 1 GB data allowance up to 2017, which was mapped to the current data-only basket with a 1.5 GB allowance. In the latter case, prices for the low-usage basket of 30 local calls (amounting to about 50 minutes) and 100 SMSs are mapped to the mobile cellular basket with 70 voice minutes and 20 SMSs. The prices for the fixed broadband basket, at least at the aggregate level, have no break in series, as most countries already had a data allowance of at least 5 GB by 2017. Details on the comparability of historical baskets are provided in Annex 1 of the ITU publication Measuring Digital Development: ICT Price Trends 2019.10
Methodology for computing aggregate prices for regions and country groups
This report presents fresh evidence on the main trends at the global and regional levels, as well as for country groups defined by level of development and income. This makes possible an analysis of changes in the digital divide observed in terms of telecommunication costs, with a specific focus on whether countries and regions have achieved the UN Broadband Commission’s target for affordability.
Regions and other country groups are compared using the median price11 for the respective baskets. The reason for choosing the median rather than the average (mean) for a set of countries within a given group (the practice used in previous reports) is that the distribution of ICT prices in many regions is highly skewed due to the very high cost of baskets in a few countries. Using
9 The older methodology is available at: https:// www .itu .int/ en/ ITU -D/ Statistics/ Documents/ ICT _Prices/ ICT %20Price %20Basket %20Methodology %20until %202017 .pdf
10 https:// www .itu .int/ en/ ITU -D/ Statistics/ Pages/ ICTprices/ 2019default .aspx 11 The median price divides a set of ICT prices in two parts of equal size, that is, there are as many countries
with basket prices above the median as there are with basket prices below the median.

ICT price trends 2020
7
the median rather than the average significantly dampens the impact of a few extreme values on how such a region compares across groups or over time.12
Given the distribution of ICT prices, median values are lower than simple averages; the more skewed the distribution, the larger the difference. In order not to mask the effect of price changes with changes in statistics, historical prices for regions and country groups shown in this report have been recomputed following the median approach. Readers should note that the median computed for a year (e.g. 2020) as part of a time series may differ slightly from a median computed for a specific year only. This is because the number of observation matter for the median value and there are gaps in the availability of data for some of the economies studied in previous years. Notes to tables and figures in the report provide details on the set of countries used for computing median values.
12 ITU has also considered alternative measurements for group-level aggregates, such as averages weighted by population or by the number of subscribers in a country. These options were rejected as they offer less exposure to the presence of a digital gap due to higher prices in relatively smaller markets. It is acknowledged that representing groups by a single value is always an arbitrary choice. Alternative values can be calculated using the country-level data published with this report.
Figure 3: Mapping historical ICT price baskets and definitions

ICT price trends 2020
8
3. Basket prices
Broadband baskets
The following two sub-sections present and analyse the prices of the data-only mobile and fixed broadband baskets. While the worldwide penetration of mobile broadband is nearly five times that of fixed broadband, both networks play an important role in digital development. The average traffic carried over a fixed broadband subscription by far exceeds the average traffic associated with a mobile broadband subscription. Mobile broadband offers greater mobility and flexibility, while fixed broadband networks meet the demands of heavy data usage associated with videoconferencing and streaming services. Lockdown measures introduced during the COVID-19 pandemic have further demonstrated the important role of fixed broadband networks and Wi-Fi for offloading mobile cellular traffic. Given the limited data allowances and packet latency of 3G and 4G wireless network technologies by comparison with the faster and generally more reliable fixed broadband networks, the two are complementary. Differences in infrastructure needs and deployment costs as well as competition and market structure result in significant variation in the prices for mobile and fixed broadband services across the world.
3.1 Data-only mobile broadband basket
The data-only mobile broadband basket is based on the cheapest data plan with a monthly allowance of at least 1.5 GB, regardless of the device used, over a 3G or higher network, offered by the operator having the largest market share.
Until 2017, price collection for mobile-data baskets made a distinction concerning the device used, and the data allowances used were lower. In fact, mobile-data baskets consisted of two plans: the first was a USB/dongle, computer-based, postpaid subscription of at least 1 GB, while the second was a handset-based, prepaid subscription of at least 500 MB. To allow for the presentation of historical trends, figures between 2013 and 2017 use the definition of the first plan (1 GB, USB/dongle), while data from 2018 to 2020 use the current definition. The impact of this break in series is mitigated by the fact that data allowances have been gradually increasing around the world.13
Global trends
As Figure 4 shows, the global median price for a data-only mobile broadband basket reached USD 8.7 in 2020, after declining by an average of 10.4 per cent per year since 2013.14 Over that period, the annual average decline of the median price for developing countries was 13.3 per cent, while for least developed countries (LDCs) it was even steeper, at 18.5 per cent, as shown in Figure 4.
13 The 11th meeting of EGTI in 2020 decided to revise the allowance threshold starting in 2021 from 1.5 GB to 2 GB to reflect market dynamics.
14 Compound annual growth (or decline) rates (or CAGR) are adjusted by inflation and reported in constant prices, while charts show current prices.

ICT price trends 2020
9
Figure 4: Evolution of median data-only mobile broadband basket prices, 2013-2020
USD PPP$ % GNI p.c.
Note: Medians are based on the 142, 127 and 137 countries (respectively) for which data were available for 2013-2020. There is a break in the series between 2017 and 2018 (up to 2017, prices are for 1 GB of data for a USB/dongle, computer-based subscription). USD values are at current prices. The dashed red line indicates the 2 per cent GNI per capita affordability target. Source: (ITU 2013-2019); ITU and A4AI (2020). USD exchange rates are from IMF and UN, PPP$ conversion factors and GNI p.c. data are from the World Bank.
Prices in USD ignore cross-country differences in purchasing power and income, and do not fully reveal how the gap between the developed and the developing world has changed, driven mostly by market dynamics in LDCs. In fact, in recent years the gap between developing countries and LDCs with respect to developed countries, measured in PPP$, has reversed. Basket prices in developed countries have followed a different trend from those in developing countries, although the trend depends on the denomination in which prices are measured. In USD and PPP terms, since reaching a low in 2015-2016, basket prices in developed countries have been gradually increasing, although in 2020 prices were still below those of 2013 in terms of USD and GNI per capita. The affordability of the basket in developed countries measured in terms of GNI per capita improved on average 2.2 per cent a year, the result of gross national income growth.
The price of the data-only mobile broadband basket in developing countries and LDCs, corrected for differences in purchasing power parities, fell considerably between 2013 and 2020. While the median PPP price for developing countries in 2013 was 24 per cent above the median world price, by 2020 it had fallen to 2 per cent below it. In LDCs the PPP price in 2013 was 69 per cent above the world median; by 2020 the position was reversed and it lay 17 per cent below the world median. During the same period, the basket became relatively more expensive in developed countries, increasing from 38 per cent below the world median to 7 per cent above it.
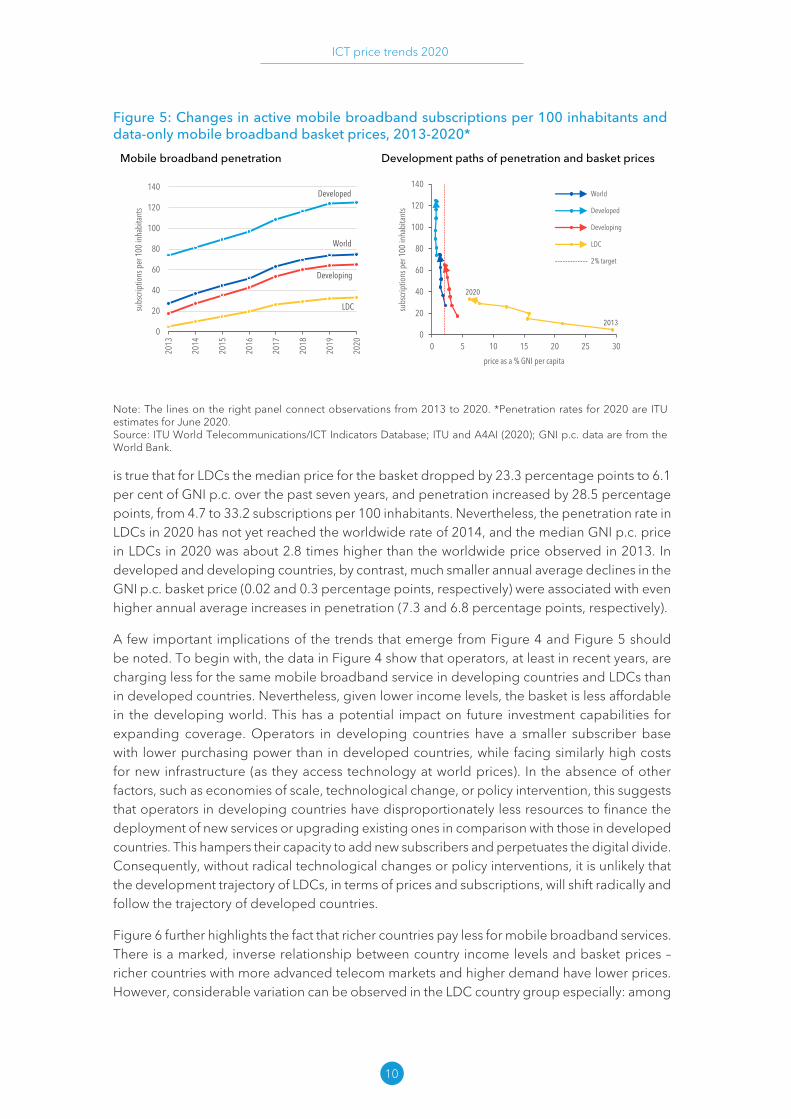
Mobile broadband subscriptions have grown worldwide by 47.6 percentage points between 2013 and 2020, reaching about 75 out of 100 inhabitants (left panel of Figure 5). At the same time, the global median price for the benchmark data-only mobile broadband basket dropped by about 1 percentage point, to 1.2 per cent of GNI p.c. Charting penetration against price over time offers interesting insights into the development trajectories of different country groups and their relations with respect to the Broadband Commission’s affordability target of 2 per cent of GNI per capita (right panel of Figure 5). As mentioned in the introduction, the Broadband Commission aims to achieve a reduction in prices in developing countries below the 2 per cent target (shown as a dashed vertical line) by 2025. The figure shows that in 2020, this target was just achieved by the median for developing countries, but LDCs are still far from reaching it. It
ICT price trends 2020
10
is true that for LDCs the median price for the basket dropped by 23.3 percentage points to 6.1 per cent of GNI p.c. over the past seven years, and penetration increased by 28.5 percentage points, from 4.7 to 33.2 subscriptions per 100 inhabitants. Nevertheless, the penetration rate in LDCs in 2020 has not yet reached the worldwide rate of 2014, and the median GNI p.c. price in LDCs in 2020 was about 2.8 times higher than the worldwide price observed in 2013. In developed and developing countries, by contrast, much smaller annual average declines in the GNI p.c. basket price (0.02 and 0.3 percentage points, respectively) were associated with even higher annual average increases in penetration (7.3 and 6.8 percentage points, respectively).
A few important implications of the trends that emerge from Figure 4 and Figure 5 should be noted. To begin with, the data in Figure 4 show that operators, at least in recent years, are charging less for the same mobile broadband service in developing countries and LDCs than in developed countries. Nevertheless, given lower income levels, the basket is less affordable in the developing world. This has a potential impact on future investment capabilities for expanding coverage. Operators in developing countries have a smaller subscriber base with lower purchasing power than in developed countries, while facing similarly high costs for new infrastructure (as they access technology at world prices). In the absence of other factors, such as economies of scale, technological change, or policy intervention, this suggests that operators in developing countries have disproportionately less resources to finance the deployment of new services or upgrading existing ones in comparison with those in developed countries. This hampers their capacity to add new subscribers and perpetuates the digital divide. Consequently, without radical technological changes or policy interventions, it is unlikely that the development trajectory of LDCs, in terms of prices and subscriptions, will shift radically and follow the trajectory of developed countries.
Figure 6 further highlights the fact that richer countries pay less for mobile broadband services. There is a marked, inverse relationship between country income levels and basket prices – richer countries with more advanced telecom markets and higher demand have lower prices. However, considerable variation can be observed in the LDC country group especially: among
Figure 5: Changes in active mobile broadband subscriptions per 100 inhabitants and data-only mobile broadband basket prices, 2013-2020*
Mobile broadband penetration Development paths of penetration and basket prices
World
Developed
Developing
LDC
0
20
40
60
80
100
120
140
2013
2014
2015
2016
2017
2018
2019
2020
subs
crip
tions
per
100
inha
bita
nts
2013
2020
0
20
40
60
80
100
120
140
0 5 10 15 20 25 30
subs
crip
tions
per
100
inha
bita
nts
price as a % GNI per capita
World
Developed
Developing
LDC
2% target
Note: The lines on the right panel connect observations from 2013 to 2020. *Penetration rates for 2020 are ITU estimates for June 2020.Source: ITU World Telecommunications/ICT Indicators Database; ITU and A4AI (2020); GNI p.c. data are from the World Bank.

ICT price trends 2020
11
the poorest countries, prices expressed as a percentage of GNI per capita span the range from extremely high to quite low, unlike developed countries, where the variation is very low.
Figure 6: Price of mobile broadband basket against GNI per capita, 2020
CAF
HRV
COD
GNB
HND
FSM
MKD
PNG
UKR
0
5
10
15
20
25
30
35
100 1,000 10,000 100,000
as a
% o
f mon
thly
GNI
p.c.
GNI per capita, USD (Atlas method) /logarithmic scale/
DevelopedDevelopingLDCLog. (World)
Source: ITU and A4AI, World Bank.
Regional trends
Prices across regions are presented in two stages. A first overview of USD and PPP$ prices is presented with the help of combined box-and-dot plots that offer a concise view of both the medians and the overall price levels across regions. Prices measured as a percentage of GNI per capita are discussed in greater detail within the analysis of inequality and affordability in section 4.
The region where the data-only mobile broadband basket was the cheapest in terms of both USD and PPP$ prices was the Commonwealth of Independent States (CIS), with a median of USD 3.7 or PPP$ 13.5, while the basket was the most expensive in the Americas, at USD 13.7 or PPP$ 23.4 (see Figure 7). Most of the regions in the plots show high price variation. For instance, in Africa USD prices (left panel) ranged from 2.7 (in Zambia) to USD 22.2 (in Seychelles), with a regional median of USD 6.1; when adjusted for differences in purchasing power, the range expanded in absolute terms, going from PPP$ 7.5 (in Nigeria) to PPP$ 43.8 (in Guinea-Bissau) with a median price of PPP$ 17.6. Prices in PPP$ had a particularly wide range among Arab States and in the Americas. This reflects the significant variation in the level of development within those regions. Europe is the only region where the range of prices expressed in PPP$ is significantly lower than that in USD. It is also noteworthy that while USD prices in the different regions lie fairly close together (with the exception of the CIS region, which has fewer countries), the differences in PPP$ prices are much more pronounced. Thus, the median PPP$ price in the

ICT price trends 2020
12
Americas region (PPP$ 23.4) corresponds to the most expensive prices in the Asia-Pacific, CIS, or Europe regions.
Figure 7: Mobile broadband prices by region, 2020, in USD (left) and in PPP$ (right)
Note: Each dot represents the price of the basket in one country in a region. The midline in the boxes and the labels indicate the median price for the region. Boxes cover the second and third quartile of the distribution (the interquartile range), thus half of the country observations are within the shaded area; whiskers extend to up to 1.5 times the interquartile range, dots outside whiskers are outlier values.Source: ITU and A4AI.
Affordability
As noted in the introduction, the Broadband Commission for Sustainable Development seeks to ensure that broadband services become affordable in developing countries by 2025, with prices no greater than 2 per cent of monthly GNI per capita. The target does not specify whether this should be achieved with mobile or fixed broadband services, but the typically cheaper mobile broadband is likely to be the primary means for countries to do so. Figure 8 shows country progress in achieving this target using data-only mobile broadband services. By 2020, exactly 104 economies had reached the target, which included all 48 developed economies, 56 out of the 97 developing economies that are not LDCs, and 4 of the 43 LDCs for which data were available. From the 84 economies that have yet to meet the target, 48 are close to the threshold, with prices between 2 and 5 per cent of GNI per capita. As the figure also shows, there are 16 developing economies with mobile broadband prices at 10 per cent of GNI or above, out of which 14 are LDCs.
Thanks to the price drops over the past year, nine economies managed to achieve the Broadband Commission’s 2 per cent target for the first time in 2020 (Botswana, Iraq, Libya, Maldives, Moldova, Mongolia, Morocco, Nauru and Nigeria). However, three others that had previously met the target no longer did so in 2020. The group that merits particular attention is those that are farthest from meeting the target, with prices at or above 20 per cent of GNI. There has been considerable progress with respect to 2019, and the size of this group has been reduced from nine to four countries, as five (Burundi, Chad, Madagascar, Niger and Yemen) moved to the 10 to 20 per cent group.

ICT price trends 2020
13
Figure 8: Number of economies achieving the Broadband Commission target with data-only mobile broadband services, 2020
48
52
37
6 2
4
11
1410
410
20
30
40
50
60
70
80
90
100
0-2% 2-5% 5-10% 10-20% >20%
Num
ber o
f eco
nom
ies
Mobile-broadband 1.5 GB prices as a % of GNI p.c.
LDCs
Developing (non LDCs)
Developed
achieved Broadband commission 2025 target: 2% GNI p.c.
Note: Includes 188 economies for which data are available from the 2020 data collection. Source: ITU and A4AI.
Affordability changes between 2019 and 2020
Focusing on the most recent changes over the past year, Figure 9 shows that the median price of a data-only mobile broadband basket with a minimum of 1.5 GB allowance measured as a percentage of the monthly income declined across all regions except for Asia and the Pacific (where it remained constant). As a result, the global affordability of the data-only basket improved, as prices fell last year by 0.2 percentage points to reach 1.7 per cent, 0.3 percentage points below the Broadband Commission’s affordability target. Nonetheless, the basket remains unaffordable in many of the lowest income economies. Although the median price in developing countries dropped from 2.9 to 2.5 per cent of GNI during that time, prices remain particularly high in LDCs; despite the decrease from 8.6 to 6.8 per cent of GNI, the basket price there remains four times the world median.
The lowest prices as a percentage of GNI per capita for the basket with 1.5 GB of data were those charged to consumers in Liechtenstein, Macao (China), Luxembourg, Hong Kong (China) and Poland; in each case the cheapest available plan represents less than 0.3 per cent of the monthly average income. The steepest price drops between 2019 and 2020 were observed in the Democratic Republic of the Congo, Yemen and Chad, where 2020 prices were cheaper than those of the year before by 28.9, 16.1 and 14.6 percentage points, respectively. While prices in the past year dropped the most in Africa, the region was also home to the five countries where the data-only mobile broadband plan was the most expensive in comparison with per capita income: it represented from 18 per cent to more than 32 per cent of the monthly average income in Chad, Malawi, Central African Republic, Guinea-Bissau and the Democratic Republic of the Congo (in order of increasing percentage).

ICT price trends 2020
14
Figure 9: Data-only mobile broadband basket price across countries, by region, level of development and income, as % of GNI, 2019-2020
7.2
1.8
1.4
1.5
0.8
2.7
1.9
0.8
2.9
8.6
4.4
3.1
16.6
3.2
1.9
0.8
6.4
1.4
1.4
1.2
0.6
2.4
1.7
0.6
2.5
6.8
3.6
2.8
10.8
2.8
1.7
0.7
0%
2%
4%
6%
8%
10%
12%
14%
16%
18%
Afric
a
Arab
Sta
tes
Asia
and
the
Pacif
ic CIS
Euro
pe
The A
mer
icas
Wor
ld
Deve
lope
d
Deve
lopi
ng LDC
LLDC
SIDS
Low
inco
me
Lowe
r mid
dle
inco
me
Uppe
r mid
dle i
ncom
e
High
inco
me
as a
% o
f mon
thly
GNI p
.c.
2019 2020 2% Affordability target
Note: Medians based on the 183 economies for which data were available for the two years. Countries are benchmarked according to the price of an entry-level data-only basket, defined as the cheapest data-only mobile broadband subscription available domestically, with a minimum of 1.5 GB monthly data allowance and a technology of 3G or above. Source: ITU and A4AI.
Data allowance: value for money
The representative mobile broadband plan for a country is the cheapest one that offers a monthly data usage of at least 1.5 GB. Nevertheless, in many markets around the world the cheapest plans include higher data allowances. In fact, there is a rather wide range of alternatives, with a worldwide median of 2.5 GB and average of 5 GB. Dividing the basket price by the actual data allowance makes it possible to compare not just price but also value for money – measured here in terms of PPP$ price per 1 GB of data for global benchmarking purposes.
The global median price for 1 GB of data (using the entry-level mobile broadband basket) is PPP$ 5.5, but significant variation can be observed across regions. In Asia and the Pacific, the median price is PPP$ 3.7, while in Africa the median price is PPP$ 8, as shown in Figure 10. Consumers in developing countries pay PPP$ 6.2, 41 per cent more than in developed countries (PPP$ 4.4). Mobile data is particularly costly in small island developing States (SIDS), with a median price of PPP$ 7.5.
Figures 11 to 16 present mobile broadband basket prices by country as a percentage of monthly GNI per capita, together with data allowances for each of the six regions studied by BDT. The bar heights show the price, the data allowance is shown in labels above the bars, and the bars are coloured to facilitate the distinction of four different levels of data allowances offered in the representative plan in a country.
In Africa, only 4 of the 40 countries for which data were available had prices less than or equal to 2 per cent of GNI per capita in 2020 (Figure 11). Thirteen additional countries were in a good position to meet the target of the Broadband Commission, with prices ranging between 2 and 5 per cent of GNI. Finally, with prices making up 10 per cent of GNI per capita or higher, 11 African countries remain far from reaching the affordability target. Since many of the mobile broadband baskets are unaffordable for the majority of consumers, it is a common practice of operators to sell plans with short validity periods. For the purpose of constituting the basket,

ICT price trends 2020
15
these subscriptions need to be renewed on a weekly or even daily basis in order to meet the basket threshold. It is therefore not surprising that data allowances for the baskets in the region are capped close to 1.5 GB: they do not exceed 2 GB in 17 countries, and fall between 2 and 5 GB in the remaining 23 countries. In the region, the basket of Senegal offered the most value for money, at PPP$ 4.1 per GB.
Figure 11: Mobile broadband price and data allowance by country in Africa, 2020
1.7
GB
2 GB 1.5
GB
1.6
GB
1.5
GB
2 GB 1.5
GB
4 GB 2 GB
2 GB 2.7
GB
2 GB 1.5
GB
2.7
GB
1.5
GB
2.5
GB
1.5
GB
2 GB 3 GB 3.4
GB
3 GB 4 GB
2 GB 1.
6 GB
1.5
GB
1.6
GB
1.5
GB
3 GB 2
GB 2 GB
2 GB
2 GB
1.7
GB
2 GB 2 GB 1.
5 GB 2 GB
1.8
GB
1.5
GB
1.8
GB
0%
5%
10%
15%
20%
25%
30%
35%
Mau
ritiu
sBo
tswan
aNi
geria
Gabo
nGh
ana
Seyc
helle
sSo
uth
Afric
aNa
mib
iaCa
bo V
erde
Sene
gal
Ango
laKe
nya
Zam
bia
Cam
eroo
nBe
nin
Côte
d'Iv
oire
Mal
iEs
watin
iSa
o To
me
and
Prin
cipe
Leso
tho
Guin
eaTa
nzan
iaRw
anda
Moz
ambi
que
Cong
o (R
ep. o
f the
)Lib
eria
Gam
bia
Ugan
daEt
hiop
iaBu
rkin
a Fas
oBu
rund
iNi
ger
Togo
Sier
ra Le
one
Mad
agas
car
Chad
Mal
awi
Cent
ral A
frica
n Re
p.Gu
inea
-Biss
auDe
m. R
ep. o
f the
Con
go
As a
% o
f GNI
p.c.
1.5-2 GB2-5 GB5-10 GB
2 % GNI p.c. target
Note: Height of bars indicates the price of a mobile broadband basket as a percentage of monthly GNI per capita. Labels above bars and bar colours indicate the data allowance in GB.Source: ITU and A4AI.
Among the 19 Arab States, 12 met the 2 per cent affordability target in 2020 (Figure 12). The relatively most expensive prices were observed in Yemen, amounting to 10 per cent of GNI per capita. The data allowance in the region generally fell in the range of 2 to 5 GB (10 out of the 19 countries), while allowances of less than 2 GB were advertised in 5 countries, and more than 10 GB in 3 countries. Jordan offered the best value for money in the region at PPP$ 0.6 per GB, thanks to a 45 GB allowance, followed by Bahrain with PPP$ 1.3 per GB.
Figure 10: Median price of 1 GB of mobile broadband data in PPP$, 2020
8.06.3
3.76.4
4.25.4
5.5
4.46.2
6.97.0
7.5
0 1 2 3 4 5 6 7 8 9
AfricaArab StatesAsia-Pacific
CISEurope
The Americas
World
DevelopedDeveloping
LDCLLDCSIDS
Median price per 1 GB in PPP$
Source: ITU and A4AI; PPP$ data from World Bank.

ICT price trends 2020
16
Figure 12: Mobile broadband price and data allowance by country in the Arab States, 2020
3.5
GB
5 GB 2 GB 3 GB
1.6
GB
1.5
GB
1.8
GB
2 GB 2.
5 GB
40 G
B
2 GB 2 GB
1.8
GB
45 G
B
2 GB 1.
5 GB 20
GB
2 GB
4 GB
0%
2%
4%
6%
8%
10%
12%
Qata
r
Kuwa
it
Saud
i Ara
bia
Alge
ria
Mor
occo
Unite
d Ar
ab Em
irate
s
Egyp
t
Oman
Tuni
sia
Bahr
ain
Iraq
Libya
Leba
non
Jord
an
Mau
ritan
ia
Suda
n
Djib
outi
Com
oros
Yem
en
As a
% o
f GNI
p.c.
1.5-2 GB2-5 GB5-10 GB
2 % GNI p.c. target
Note: Height of bars indicate the price of a mobile broadband basket as a percentage of monthly GNI per capita. Labels above bars and bar colours indicate the data allowance in GB.Source: ITU and A4AI.
In Asia and the Pacific region, 25 of the 37 economies met the 2 per cent affordability target, and consumers in 6 further economies faced prices that did not exceed 5 per cent of their per capita monthly income. Prices were significantly higher in the SIDS of the Pacific, where the basket cost more than 10 per cent of GNI per capita in 3 of the economies (Papua New Guinea, Micronesia and the Solomon Islands) and (Afghanistan) a landlocked developing country (LLDC). Caps of 2 GB or less applied in 11 countries, 15 others had allowances up to 5 GB. The region had 7 economies where the allowances exceeded 10 GB a month, among which Malaysia and India both met the 2 per cent target and offered unlimited data – thus representing the best value for money in the region.
Figure 13: Mobile broadband price and data allowance by country in the Asia and the Pacific region, 2020
2 GB
3 GB
2 GB
1.6
GB
1.5
GB
20 G
B
10 G
B
3 GB
2 GB
30 G
B
2 GB
Unl.
1.7
GB
1.6
GB
3.5
GB
3 GB
1.5
GB
5 GB
1.5
GB
1.5
GB
Unl.
2.5
GB
1.5
GB
1.8
GB
5 GB 5.
9 GB
7 GB 2 GB 12
GB 16
GB
2.7
GB
1.5
GB
2.7
GB
2 GB 1.8
GB
2 GB 2.
2 GB
0%2%4%6%8%
10%12%14%
Mac
ao, C
hina
Hong
Kon
g, C
hina
Brun
ei D
arus
sala
mSr
i Lan
kaNe
w Ze
alan
dSi
ngap
ore
Kore
a (Re
p. o
f)Ch
ina
Paki
stan
Austr
alia
Iran
(Isla
mic
Repu
blic
of)
Mal
aysia
Bhut
anM
yanm
arVi
et N
amJa
pan
Thai
land
Indo
nesia
Phili
ppin
esCa
mbo
dia
Indi
aM
aldi
ves
Bang
lade
shNa
uru
Mon
golia
Lao
P.D.
R.To
nga
Nepa
l (Re
publ
ic of
)Fi
jiSa
moa
Timor
-Leste
Vanu
atu
Kirib
ati
Micr
ones
iaPa
pua N
ew G
uine
aAf
ghan
istan
Solo
mon
Isla
nds
As a
% o
f GNI
p.c.
1.5-2 GB2-5 GB5-10 GB
2 % GNI p.c. target
Note: Height of bars indicate the price of a mobile broadband basket as a percentage of monthly GNI per capita. Labels above bars and bar colours indicate the data allowance in GB. Unl. = unlimited data allowance.Source: ITU and A4AI.

ICT price trends 2020
17
Prices for the basket in the CIS region ranged between 0.4 and 7.5 per cent of GNI per capita (Figure 14). The price of a mobile broadband basket did not exceed 1.2 per cent of the average income in five of the nine countries in the region, and three of the remaining countries were close to meeting the 2 per cent target with prices less than 4 per cent of GNI per capita. Among the LLDCs in the region, prices varied significantly: while prices in Kazakhstan were the lowest in the region, Tajikistan was the most expensive. Data allowances corresponded to the basket minimum of 1.5 GB in three countries, and ranged between 2 and 5 GB in four others. The highest allowance was that in the Russian Federation at 10 GB, which made it the country in the region where consumers got the best value for money (PPP$ 2 for one GB of data).
Figure 14: Mobile broadband price and data allowance by country in the CIS region, 2020
3 GB
2 GB
10 G
B
3 GB
1.5
GB 1.5
GB 4.1
GB 1.5
GB
2 GB
0%1%2%3%4%5%6%7%8%9%
10%
Kaza
khsta
n
Bela
rus
Russ
ian
Fede
ratio
n
Arm
enia
Azer
baija
n
Uzbe
kista
n
Kyrg
yzsta
n
Turk
men
istan
Tajik
istan
As a
% o
f GNI
p.c.
5-10 GB
2-5 GB
1.5-2 GB
2 % GNI p.c. target
Note: Height of bars indicates the price of a mobile broadband basket as a percentage of monthly GNI per capita. Labels above bars and bar colours indicate the data allowance in GB. Unl. = unlimited data allowance.Source: ITU and A4AI.
With prices comfortably meeting the 2 per cent target in all 42 countries, Europe was the region where the entry-level mobile broadband baskets were the most affordable in 2020 (Figure 15). The data allowances in the representative plans were generally high in the region. Only five countries offered the minimum of 1.5 GB (all with prices less than 1 per cent of GNI per capita), while 17 countries had a data allowance between 2 and 5 GB. Among the 13 countries where the data allowance was at least 10 GB, two (Finland and Ireland) had unlimited allowances.

ICT price trends 2020
18
Figure 15: Mobile broadband price and data allowance by country in Europe, 2020
20 G
B
2 GB 10
GB
8 GB 1.5
GB
30 G
B
3 GB 2 GB
15 G
B
2 GB 2 GB 1.5
GB
20 G
B
4 GB 2 GB 2.5
GB
3 GB
30 G
B
10 G
B
8 GB 5 GB 1.5
GB
10 G
B
2 GB 30
GB
5 GB 3 GB Un
l.
Unl.
1.5
GB
10 G
B
2 GB
5 GB 1.5
GB
10 G
B
3 GB 5
GB 3 GB 2
GB
2.9
GB
7 GB 3
GB
0%
1%
2%
Liech
tens
tein
Luxe
mbo
urg
Pola
ndAu
stria
Czec
h Re
publ
icIsr
ael
Spai
nHu
ngar
yDe
nmar
kSl
ovak
iaIce
land
Esto
nia
Italy
Germ
any
Belg
ium
Gree
ceM
oldo
vaSw
eden
Fran
ceNo
rway
Unite
d Ki
ngdo
mGe
orgi
aNe
ther
land
sSw
itzer
land
Lithu
ania
Slov
enia
Mal
taFi
nlan
dIre
land
Latv
iaRo
man
iaM
onte
negr
oPo
rtuga
lCy
prus
Turk
eyAl
bani
aSe
rbia
Bulg
aria
Bosn
ia an
d He
rzeg
ovin
aUk
rain
eCr
oatia
North
Mac
edon
ia
As a
% o
f GNI
p.c.
1.5-2 GB2-5 GB5-10 GB
2 % GNI p.c. target
Note: Height of bars indicate the price of a mobile broadband basket as a percentage of monthly GNI per capita. Labels above bars and bar colours indicate the data allowance in GB. Unl. = unlimited data allowance.Source: ITU and A4AI.
Both prices and allowances varied greatly in the Americas region for the data-only mobile broadband basket (Figure 16). Twelve out of the 34 countries met the 2 per cent target, while 19 countries came close to meeting it, with prices between 2 and 5 per cent of GNI per capita. The most expensive basket in the region was in Honduras, where it cost 8.2 per cent of GNI per capita. Data allowances were mostly between 2 and 5 GB (17 countries). The 6 countries where the data allowance was 10 GB or more show a particular picture: while the representative basket for Panama not only cost less than 2 per cent of GNI per capita but also included unlimited data allowance (making it the best value for money in the region), the high allowances of the baskets in Honduras and in Saint Vincent and the Grenadines were at odds with the prices, which exceeded 5 per cent of GNI per capita.
Figure 16: Mobile broadband price and data allowance by country in the Americas, 2020
Note: Height of bars indicate the price of a mobile broadband basket as a percentage of monthly GNI per capita. Labels above bars and bar colours indicate the data allowance in GB. Unl. = unlimited data allowance.Source: ITU and A4AI.
The affordability of the baskets, as presented above, relates the data-only mobile broadband prices to the average income. The section on inequality and affordability (section 4) provides more detailed insights on how affordable the broadband baskets are for different segments of the society.

ICT price trends 2020
19
3.2 Fixed broadband basket (5GB)
The fixed broadband basket is based on the cheapest available fixed broadband subscription that includes at least 5 GB monthly data usage at an advertised download speed of at least 256 kbit/s. Until 2017, the minimum data allowance threshold for the fixed broadband basket was 1 GB; however, most of the plans already included a 5 GB or higher allowance. Thus, as the adjustment of the threshold followed market realities, prices can be monitored assuming a high degree of continuity between 2008 and 2020, and more specifically, between 2017 and 2018.
Global trends
Figure 17: Evolution of median fixed broadband basket prices, 2008-2020
USD PPP$ % GNI p.c.
Note: Medians based on the 138, 126 and 136 countries (respectively) for which data were available for all years indicated. Not shown, because they lie outside the chart, are the following values for LDCs for 2008 to 2010: PPP$ 205.6, 180.2 and 125.4; and 180.1, 135.6 and 74.5 per cent of GNI per capita.Source: ITU (2008-2019); ITU and A4AI (2020).
The world median price of a fixed broadband basket in 2020 was USD 22.8, corresponding to a 4.8 per cent annual decline every year since 2008.15 There has been a considerable slowdown in the price decline for this basket, although, as the charts in Figure 17 show, this depends on the measure used. If prices are measured in terms of GNI per capita, the lowest prices were observed in 2015, at 2.4 per cent, after which they levelled off at around 2.8 per cent.
Fixed broadband basket prices in developed countries measured in USD decreased by 1.5 per cent per year since 2008, bottoming out in 2015. In 2020, the median price in developed countries was USD 28.3. While the trend has been quite flat over the past decade, changes in median connection speeds signal important quality improvements, as will be shown later.
Fixed broadband basket prices in LDCs have shown a significant drop over the past decade. The compound average rate of price decline between 2008 and 2020 was 14.1 per cent, reaching USD 22.3 in 2020. However, the decline slowed down considerably over the past five years, and since 2016 has been only about 8 per cent a year in current prices. However, when expressed in relation to income levels, prices in LDCs have virtually levelled off at slightly over 20 per cent of GNI p.c. in the past few years.
15 Compound annual growth (or decline) rates (or CAGR) are adjusted by inflation and reported in constant prices, while charts show current prices.

ICT price trends 2020
20
Adjusting prices for differences in purchasing power shows that a trend of convergence between developing and developed countries stopped in 2014. In 2008, the median basket price for developing countries was 50 per cent above world prices, and after a period of convergence, by 2015, this gap had dropped to 20 per cent. In 2020, median developing country prices were merely 11 per cent higher than world prices for the basket. This was driven by a radical price drop in LDCs until 2014, where a fixed broadband basket – considering differences in purchasing power – cost 344 per cent more than the median world price in 2008, 76 per cent more in 2015, and 21 per cent more in 2020. The gap between the median price for developing and developed countries shrank from a high of PPP$ 42.4 in 2008 to PPP$ 10.6 in 2015, only to increase again to PPP$ 12.4 by 2020.
Figure 18: Changes in fixed broadband subscriptions per 100 inhabitants and fixed broadband basket prices, 2008-2020*
Fixed broadband penetration Development paths of penetration and median basket prices
World
Developed
Developing
LDC
0
5
10
15
20
25
30
35
2008
2009
2010
2011
2012
2013
2014
2015
2016
2017
2018
2019
2020
subs
crip
tions
per
100
inha
bita
nts
2008
2020
20122020
0
5
10
15
20
25
30
35
0 10 20 30 40 50
subs
crip
tions
per
100
inha
bita
nts
price as a % GNI per capita
World
Developed
Developing
LDC
2% target
Note: The lines on the right panel connect observations from 2008 to 2020. Out of bound rates for LDCs between 2008 and 2011 were removed (2008 price was 180.1 per cent of GNI p.c.) *Penetration rates for 2020 are ITU estimates for June 2020.Source: ITU World Telecommunications/ICT Indicators Database, 2020; ITU and A4AI (2020); GNI p.c. data are from the World Bank.
The worldwide penetration of fixed broadband subscriptions was about one-fifth of that of mobile broadband subscriptions, reaching a quarter in developed economies but only four per cent in LDCs. The lower penetration of fixed broadband subscriptions is partially explained by the fact that they are typically shared within a household. Between 2008 and 2020 the number of fixed broadband subscriptions per 100 inhabitants grew worldwide at an average of 0.8 percentage points per year, and is estimated to have reached 15.2 per 100 inhabitants (left panel of Figure 18). Over the same period, the global median price for the fixed broadband basket dropped at an average 0.2 percentage points to about 2.8 per cent of GNI p.c.16 The right panel of Figure 18 tracks the evolution of prices and penetration rates for countries over time between 2008 and 2020. Three very distinct trajectories can be observed when looking at country groups by level of development. Across LDCs, although the median basket price dropped from 180.1 to 20.1 per cent of GNI p.c. over the past 13 years (an average drop of about 13.3 percentage points a year), the penetration rate only increased 0.1 percentage points per year on average, reaching 1.3 subscriptions per 100 inhabitants. Given the high relative prices (expressed as a percentage of GNI per capita), it is hardly surprising that connectivity
16 This value is based on 136 countries for which data were available for all years between 2008 and 2020. By construction, this may be different from the median computed for the larger set of countries with data availability in 2020.

ICT price trends 2020
21
remains low: the affordability target is met only for a tiny fraction of the society (as explained in section 4 on inequality and affordability). Developing countries more generally (not limited to LDCs) have shown a different trajectory. Between 2008 and 2020, while prices were dropping at an average 0.7 percentage points a year, the increase in the penetration rate mirrored this with a 0.7 percentage point a year increase. The trajectory also shows a “bend” occurring around 2014-2015, after which the penetration rate continued to increase despite stagnant GNI per capita prices.
In recent years developed countries have started showing a trend that is similar to that of developing countries: GNI per capita prices for the fixed broadband basket remained virtually unchanged (overall decline of 0.2 percentage point) between 2008 and 2020. These findings introduce nuance to the relationship between prices and penetration rates, suggesting on the one hand that the penetration rate depends on other factors beyond prices, and on the other hand that price changes can have a multitude of potential impacts beyond changing penetration rates. A careful analysis of other developments in quality of service and market performance is therefore called for.
Regional trends
Fixed broadband prices measured in USD show considerable overlap across regions in the interquartile range, that is, excluding the top and bottom quarter of prices. Nevertheless, due to differences in both the cheapest and most expensive ranges, the median values vary between USD 5.9 in the CIS region (with fewer countries than any other region) and USD 30.3 in the Americas, as shown by the left panel of Figure 19. Differences in purchasing power reveal other important regional disparities. As the right panel of Figure 19 shows, except for a handful of countries, fixed broadband prices in Africa are significantly higher, in relative terms, than those in other regions. For instance, the median price for Africa is about 20 per cent higher than that of the Americas, over 40 per cent higher than in Asia and the Pacific region and about 60 per cent higher than the Arab States or Europe. All regions, with the exception of Europe, have some countries where consumers pay PPP$ 70 or more to access an entry-level fixed broadband connection. That said, the cheapest global fixed broadband prices are concentrated in Asia and the Pacific region, the only region where it is possible for consumers to access the basket for less than PPP$ 10.

ICT price trends 2020
22
Figure 19: Fixed broadband prices by region, 2020, in USD (left) and in PPP$ (right)
USD PPP$
Note: Each dot represents the price of the basket in one country in a region. The midline in the boxes and the labels indicate the median price for the region. Boxes cover the second and third quartile of the distribution (the interquartile range), so that half of the country observations are within the shaded area; whiskers extend to up to 1.5 times the interquartile range, dots outside whiskers are outlier values. Not shown, because they lie outside the chart, are the values of PPP$ 235.2 in Africa and PPP$ 147.3 in the Americas. Source: ITU and A4AI.
Affordability
The challenge of meeting the 2 per cent affordability target of the Broadband Commission by 2025 is greater with fixed broadband services than with the generally more affordable mobile broadband baskets.17 Whereas 55 per cent of the economies with data available had already met the target with mobile broadband baskets by 2020, only 38 per cent of the economies met the target with fixed broadband. As shown in Figure 20, in 2020 this amounted to 67 countries, 44 of which were developed and 23 developing (including an LDC, the Republic of Nepal). The second group of economies, which were closest to meeting the target with GNI per capita prices between 2 and 5 per cent, included 4 developed and 42 developing economies (3 of which were LDCs). Unless prices start falling faster, 41 developing countries (including 25 LDCs) risk failing to meet the target by 2025, given that fixed broadband access still costs 10 per cent of GNI per capita or more in 2020. With respect to 2019, three economies among the latter group had crossed the 20 per cent threshold after a price drop (Côte d’Ivoire, Papua New Guinea and Zambia).
17 Note that the Broadband Commission did not specify whether the target should apply to fixed or mobile broadband services. The baskets are not fully interchangeable, as the minimum data allowance for the fixed basket is 5 GB, whereas for the mobile broadband basket it is 1.5 GB. Due to geographical conditions and patterns of population distribution (among other factors), fixed broadband networks are unavailable in many parts of the world where mobile coverage is available. It should also be noted, nevertheless, that fixed broadband technologies, as defined in ITU’s Handbook for the collection of administrative data on telecommunications/ICT (2020 ed.), also includes fixed wireless services.

ICT price trends 2020
23
Figure 20: Country progress in achieving the Broadband Commission target with fixed broadband services, 2020
44
4
22
39
2013
3
1
3
47
1810
20
30
40
50
60
70
0-2% 2-5% 5-10% 10-20% >20%
Num
ber o
f eco
nom
ies
Fixed-broadband 5 GB prices as a % of GNI p.c.
LDCs
Developing (non LDCs)
Developed
achieved Broadband commission 2025 target: 2% GNI p.c.
Note: Includes 178 economies for which data were available from the 2020 data collection. Source: ITU and A4AI.
Affordability changes between 2019 and 2020
On a global scale, the median price for an entry-level fixed broadband basket amounted to 2.9 per cent of monthly GNI per capita, which, despite a 0.2 percentage point drop, remains almost a percentage point above the 2 per cent affordability target set by the Broadband Commission (Figure 21). The income level of countries had a major impact on the affordability of a fixed broadband connection. While consumers in the Arab States and in Asia and the Pacific faced relative prices close to the world median, those in Africa and the Americas paid six times and one and a half times that, respectively. Europe remained the only region where consumers paid less than 2 per cent of their income on fixed broadband Internet (1.2 per cent of GNI per capita). Regional aggregations hide considerable heterogeneity, which becomes clear when economies are grouped according to their income levels. Fixed broadband Internet was prohibitively expensive not just for low-income economies (where median prices amounted to 35.8 per cent of the average monthly income), but also for many lower-middle-income economies (8.4 per cent of GNI per capita). Among the economies for which data for 2020 were available, entry-level fixed broadband Internet was affordable in only 1 of the 33 LDCs; in none of the 15 low-income economies; and in 4 of the 48 lower-middle-income economies.
The affordability gap between developed and developing countries remained virtually unchanged for fixed broadband Internet that year.
A drop in relative costs in Africa (from 19.9 to 18.4 per cent of GNI per capita) and low-income economies (from 41.2 to 35.8 per cent) was partly offset by slight increases in the median relative prices in the CIS and Americas regions (from 2.2 to 2.3 per cent and from 4.4 to 4.6 per cent, respectively). There was little improvement in the affordability of this basket for consumers living in LDCs and LLDCs.

ICT price trends 2020
24
The economies where entry-level fixed broadband Internet was the most affordable in 2020, with prices below 0.6 per cent of GNI per capita, were Liechtenstein, Kuwait, Macao (China), China and the United Arab Emirates (in order of increasing percentage). The biggest improvements in the affordability of this basket were observed in Yemen, Rwanda, Papua New Guinea, Moldova and Turkey (price drops of 50 per cent or more). At the other end of the scale, only the most affluent consumers could afford fixed broadband Internet in Madagascar, Niger, Malawi, Haiti and Guinea-Bissau, where the relative price amounted to 69 per cent or more of monthly GNI per capita.
Figure 21: Fixed broadband basket prices by region, level of development and income, 2019-2020
19.9
3.1
3.1
2.2
1.3
4.4
3.1
1.2
4.8
22.3
7.6
4.3
41.2
8.7
3.6
1.2
18.4
3.1
3.0
2.3
1.2
4.5
2.9
1.2
4.7
21.5
7.6
4.1
35.8
8.4
3.4
1.2
0%
5%
10%
15%
20%
25%
Afric
a
Arab
Sta
tes
Asia
and
the
Pacif
ic
CIS
coun
tries
Euro
pe co
untri
es
The A
mer
icas
Wor
ld
Deve
lope
d
Deve
lopi
ng LDC
LLDC
SIDS
Low
inco
me
Lowe
r mid
dle
inco
me
Uppe
r mid
dle i
ncom
e
High
inco
me
% o
f GNI
per
capi
ta
2019 2020 2% Affordability target
Note: Medians based on 170 economies for which data were available for the two years. Countries are benchmarked according to the price of an entry-level fixed-broadband basket, defined as the cheapest fixed-broadband subscription available domestically, with a minimum of 5 GB monthly data allowance and an advertised download speed of 256 kbit/s or above. Source: ITU and A4AI.
Data allowances: value for money
Seychelles and Mauritius were the only countries in Africa in which the fixed broadband basket met the 2 per cent affordability threshold (Figure 22). Three other countries, Cabo Verde, Botswana and South Africa were close to meeting the target, with prices below 5 per cent of GNI per capita. Out of the 33 African countries compared, 21 have fixed broadband baskets that include unlimited data usage. However, using this amount is hampered by the fact that connection speeds are rather slow in a global comparison, mostly less than 2 Mbit/s (in 8 of these countries) or ranging between 2 and 10 Mbit/s (in 11 of the countries). Noteworthy exceptions are Gabon, where consumers can benefit from an advertised 10 Mbit/s speed and Madagascar, where the advertised speed is 100 Mbit/s (although this comes at a price that is anything but affordable, amounting to 163 per cent of GNI per capita). The lowest data allowances in Africa, with monthly usage was limited to 10 GB or less, were found in the Seychelles, Lesotho, Guinea, Eswatini, Zambia and Tanzania (in order of increasing prices).

ICT price trends 2020
25
Figure 22: Fixed broadband prices as a percentage of GNI p�c�, speeds and allowances, Africa, 2020
Unl.
Unl.
Unl.
Unl. Un
l.
Unl.
Unl.
Unl.
Unl.
Unl.
Unl.
Unl.
Unl.
Unl. Un
l.
Unl.
Unl.
Unl.
Unl.
Unl.
Unl.
8 GB 30
GB
1000
0 GB
5 GB 30
GB
5 GB 45
GB
6 GB 10
GB
12 G
B
8 GB
20 G
B
0%10%20%30%40%50%60%70%80%90%
100%
Botsw
ana
Sout
h Af
rica
Gabo
n
Nam
ibia
Keny
a
Cong
o (R
ep. o
f the
)
Equa
toria
l Gui
nea
Côte
d'Iv
oire
Sene
gal
Cam
eroo
n
Nige
ria
Mal
i
Ethi
opia
Beni
n
Burk
ina F
aso
Moz
ambi
que
Togo
Rwan
da
Guin
ea-B
issau
Nige
r
Mad
agas
car
Seyc
helle
s
Mau
ritiu
s
Cabo
Ver
de
Leso
tho
Ango
la
Guin
ea
Ghan
a
Eswa
tini
Zam
bia
Sao
Tom
e an
d Pr
incip
e
Tanz
ania
Mal
awi
As a
% o
f GNI
p.c.
-30 Mbit/s-10 Mbit/s
256 kbit/s - 2 Mbit/s2 % GNI p.c. target
Note: Speeds and monthly allowances refer to the advertised speeds and the amount of data included in the entry-level fixed broadband subscription. Unl. = unlimited data allowance.Source: ITU and A4AI (price data); World Bank World Development Indicators (GNI p.c.).
In the Arab States, the fixed broadband basket meets the 2 per cent affordability target in four countries (Kuwait, the United Arab Emirates, Qatar and Bahrain, in order of increasing prices) and costs less than 5 per cent of GNI per capita in nine additional countries (Figure 23). Some notable exceptions to the relatively low cost of the basket in the region are the Comoros and Mauritania, where it made up over 20 per cent of GNI per capita in 2020.
The representative basket in 10 out of the 17 countries in the region included unlimited data allowances, although speeds remained below 2 Mbit/s for the entry-level basket in five of the countries, limiting the possibility to fully benefit from the advertised unlimited allowances in three of these countries. Qatar and Egypt were the only countries in the region where connection speeds of 30 Mbit/s or higher were offered in the benchmark basket.
Figure 23: Fixed broadband prices as a percentage of GNI p�c�, speeds and allowances, Arab States, 2020
Unl.
Unl.
Unl. Un
l.
Unl. Un
l.
Unl.
Unl.
Unl.
Unl.
200
GB
20 G
B
40 G
B
20 G
B
140
GB
16 G
B
30 G
B
0%
5%
10%
15%
20%
25%
30%
35%
Kuwa
it
Unite
d Ar
ab Em
irate
s
Qata
r
Saud
i Ara
bia
Tuni
sia
Mor
occo
Alge
ria
Jord
an
Mau
ritan
ia
Com
oros
Bahr
ain
Libya
Leba
non
Oman
Egyp
t
Yem
en
Djib
outi
As a
% o
f GNI
p.c.
-30 Mbit/s
-10 Mbit/s
256 kbit/s - 2 Mbit/s
2 % GNI p.c. target
Note: Speeds and monthly allowances refer to the advertised speeds and the amount of data included in the entry-level fixed broadband subscription. Unl. = unlimited data allowance.Source: ITU and A4AI (price data); World Bank World Development Indicators (GNI p.c.).
In Asia and the Pacific region, 13 countries met the 2 per cent broadband affordability target, and an additional 9 countries are on track to meet it, with prices below 5 per cent of GNI per capita (Figure 24). Three LDCs (Vanuatu, Timor-Leste and the Solomon Islands, in order of

ICT price trends 2020
26
increasing prices) had clearly unaffordable access to fixed broadband services, with prices exceeding 30 per cent of GNI per capita. Entry-level fixed broadband services were also costly and relatively slow in 6 countries in the region, with prices exceeding 10 per cent of GNI per capita despite speeds that fell in the lowest two bands, below 10 Mbit/s. Such was the case for Pakistan, Myanmar, Samoa, Cambodia, the Marshall Islands, and Afghanistan.
The fixed broadband basket came with unlimited data usage in 19 of the 36 countries in the region; it is fair to add to this list four countries where the allowance exceeded 100 GB. Among the countries that met the 2 per cent GNI target, six offered unlimited access with speeds exceeding 30 Mbit/s.
Figure 24: Fixed broadband prices as a percentage of GNI p�c�, speeds and allowances, Asia and the Pacific, 2020
Unl.
Unl.
Unl.
Unl.
Unl.
Unl.
Unl.
Unl.
Unl. Un
l.
Unl.
Unl. Un
l.
Unl.
Unl.
Unl.
Unl. Un
l.
Unl.
10 G
B
15 G
B
100
GB
500
GB
60 G
B
200
GB
15 G
B
5 GB
60 G
B
30 G
B
13.5
GB
60 G
B
150
GB
25 G
B
20 G
B
37.5
GB
10 G
B
0%
5%
10%
15%
20%
25%
30%
35%
40%
Mac
ao, C
hina
Chin
a
Hong
Kon
g, C
hina
Sing
apor
e
Japa
n
Kore
a (Re
p. o
f)
Bang
lade
sh
Thai
land
Viet
Nam
Micr
ones
ia
Phili
ppin
es
Lao
P.D.
R.
Indo
nesia
Paki
stan
Mya
nmar
Cam
bodi
a
Mar
shal
l Isla
nds
Afgh
anist
an
Vanu
atu
Iran
(Isla
mic
Repu
blic
of)
Sri L
anka
Brun
ei D
arus
sala
m
Austr
alia
New
Zeal
and
Mon
golia
Nepa
l (Re
publ
ic of
)
Tong
a
Mal
aysia
Mal
dive
s
Bhut
an
Indi
a
Fiji
Sam
oa
Papu
a New
Gui
nea
Timor
-Leste
Solo
mon
Isla
nds
As a
% o
f GNI
p.c.
256 kbit/s - 2 Mbit/s-10 Mbit/s
-30 Mbit/s
2 % GNI p.c. target
Note: Speeds and monthly allowances refer to the advertised speeds and the amount of data included in the entry-level fixed broadband subscription. Unl. = unlimited data allowance.Source: ITU and A4AI (price data); World Bank World Development Indicators (GNI p.c.).
In the CIS region, fixed broadband connections in 2020 cost less than 2 per cent of GNI per capita in four countries (Figure 25). In the three most expensive countries in the region, consumers would have to pay between 7.4 and 8.2 per cent of their income to access the service. Two other countries were close to the target, with prices of 2.3 and 3.2 per cent of GNI per capita. In terms of value for money, the benchmark basket showed considerable variation. In the Russian Federation, for instance, unlimited access was offered at advertised connections speeds far exceeding 30 Mbit/s. In Kazakhstan, Azerbaijan and Belarus, speeds did not reach 2 Mbit/s, even though the data allowance for the basket was theoretically unlimited in the first two of those three countries.

ICT price trends 2020
27
Figure 25: Fixed broadband prices as a percentage of GNI p�c�, speeds and allowances, CIS region, 2020
Unl. Unl.Unl.
Unl.
Unl.Unl.
10 GB
5.8 GB
30 GB
0%
2%
4%
6%
8%
10%
Russ
ian
Fede
ratio
n
Kaza
khsta
n
Azer
baija
n
Arm
enia
Turk
men
istan
Kyrg
yzsta
n
Bela
rus
Uzbe
kista
n
Tajik
istan
As a
% o
f GNI
p.c.
-30 Mbit/s
-10 Mbit/s
256 kbit/s - 2 Mbit/s
2 % GNI p.c. target
Note: Speeds and monthly allowances refer to the advertised speeds and the amount of data included in the entry-level fixed broadband subscription. Unl. = unlimited data allowance.Source: ITU and A4AI (price data); World Bank World Development Indicators (GNI p.c.).
Europe was the region where fixed broadband prices were the most affordable in 2020: 37 of the 42 countries monitored met the 2 per cent target of the Broadband Commission, and even in the most expensive country, North Macedonia, the basket only cost 3.4 per cent of GNI per capita (Figure 26). Consumers in general received good value for money, given that data caps were imposed on the entry-level benchmark basket in only five of the countries, and three of these caps were 50 GB or more. Connection speeds for the benchmark basket were generally very high in the region, reaching and exceeding 30 Mbit/s in 23 countries. The only outlier was Albania with a 1 Mbit/s speed offered with the basket.
Figure 26: Fixed broadband prices as a percentage of GNI p�c�, speeds and allowances, Europe, 2020
Unl. Un
l.Un
l.Un
l.Un
l.Un
l.Un
l.Un
l.Un
l.Un
l.Un
l.Un
l.Un
l.Un
l.Un
l.Un
l.Un
l. Unl.
Unl.
Unl.
Unl.
Unl.
Unl.
Unl.
Unl.
Unl.
Unl. Un
l. Unl.
Unl. Un
l.Un
l.Un
l. Unl.
Unl.
Unl.
Unl.
15 G
B10
0 GB
40 G
B 50 G
B25
0 GB
0%
1%
2%
3%
4%
Liech
tens
tein
Rom
ania
Luxe
mbo
urg
Israe
lSl
ovak
iaAu
stria
Norw
ayDe
nmar
kCy
prus
Finl
and
Lithu
ania
Esto
nia
Switz
erla
ndCz
ech
Repu
blic
Germ
any
Mal
taSw
eden
Fran
cePo
land
Neth
erla
nds
Italy
Alba
nia
Gree
ceIre
land
Hung
ary
Portu
gal
Latv
iaUk
rain
eSp
ain
Bulg
aria
Mon
tene
gro
Slov
enia
Unite
d Ki
ngdo
mM
oldo
vaBo
snia
and
Herze
govin
aSe
rbia
Geor
gia
Croa
tiaBe
lgiu
mTu
rkey
Icela
ndNo
rth M
aced
onia
As a
% o
f GNI
p.c.
-30 Mbit/s
-10 Mbit/s
256 kbit/s - 2 Mbit/s
2 % GNI p.c. target
Note: Speeds and monthly allowances refer to the advertised speeds and the amount of data included in the entry-level fixed broadband subscription. Unl. = unlimited data allowance.Source: ITU and A4AI (price data); World Bank World Development Indicators (GNI p.c.).
The Americas region showed a moderate variation in the price of the fixed broadband basket in 2020 (Figure 27). The most common price range in the region was 2 to 5 per cent of GNI per capita (14 countries), and 12 countries had prices between 5 and 10 per cent of GNI per capita. Only five countries met the 2 per cent affordability target in 2020, and consumers in two countries (Nicaragua and Haiti) faced prices over 25 per cent. Data allowances were

ICT price trends 2020
28
very generous throughout the region, with no caps at all in 31 of the 34 countries, and the remaining three countries having at least 100 GB usage included. Advertised connection speeds varied greatly. With the 200 Mbit/s connection (with unlimited data allowance), United States consumers received the best value for money for the basket in the region. By contrast, consumers in four other countries could hardly benefit from the unlimited connection, due to the low connection speeds (below 2 Mbit/s).
Figure 27: Fixed broadband prices as a percentage of GNI p�c�, speeds and allowances, the Americas, 2020
Unl.
Unl.
Unl.
Unl.
Unl.
Unl.
Unl.
Unl.
Unl.
Unl.
Unl.
Unl.
Unl.
Unl.
Unl.
Unl.
Unl.
Unl.
Unl.
Unl.
Unl.
Unl.
Unl.
Unl.
Unl.
Unl.
Unl. Un
l.
Unl.
Unl. Un
l.
100
GB
350
GB 250
GB
0%
5%
10%
15%
20%
25%
30%
35%
Unite
d St
ates
Baha
mas
Trin
idad
and
Toba
goCo
sta R
icaM
exico
Chile
Braz
ilSa
int K
itts a
nd N
evis
Dom
inica
n Re
p.An
tigua
and
Barb
uda
Barb
ados
Peru
Sain
t Luc
iaCo
lom
bia
Pana
ma
Ecua
dor
Para
guay
Dom
inica
Gren
ada
Jam
aica
Surin
ame
Cuba
Guya
naSa
int V
ince
nt an
d th
e Gre
nadi
nes
Guat
emal
aBo
livia
(Plu
rinat
iona
l Sta
te o
f)El
Sal
vado
rBe
lize
Hond
uras
Nica
ragu
aHa
itiCa
nada
Urug
uay
Arge
ntin
a
As a
% o
f GNI
p.c.
-30 Mbit/s
-10 Mbit/s
256 kbit/s - 2 Mbit/s
2 % GNI p.c. target
Note: Speeds and monthly allowances refer to the advertised speeds and the amount of data included in the entry-level fixed broadband subscription. Unl. = unlimited data allowance.Source: ITU and A4AI (price data); World Bank World Development Indicators (GNI p.c.).
Quality improvements
While entry-level fixed broadband prices worldwide have been decreasing rather slowly, significant improvements have been witnessed in the quality of networks around the world due to investments in infrastructure in recent years. Quality improvements can be measured with changes in the advertised speed of the benchmark connections. In 2018 about 3 in 10 economies around the world still had entry-level fixed broadband connection speeds of less than 2 Mbit/s; over the following two years, this share dropped to 2 in 10 economies. By 2020, more than 54 per cent of the economies around the world had connection speeds of 10 Mbit/s or higher for the benchmark basket, up from 39 per cent in 2018 (Figure 28). It is also evident from the figure that the divide between developed and developing countries manifests itself not only in fixed broadband basket prices, but also in the quality dimension – speed. In most developed economies (87 per cent), consumers could find entry-level fixed broadband access at speeds of at least 10 Mbit/s in 2020, and the most common connection speeds were 30 Mbit/s or greater. In developing economies, by contrast, 2 to 10 Mbit/s was the most frequent connection speed with the benchmark basket; 27 per cent of countries still had advertised speeds of less than 2 Mbit/s; and 41 per cent offered speeds of above 10 Mbit/s. In LDCs, the slowest connection speed class has become less prevalent over the past two years, but the improvement was only incremental, as economies moved to the 2 to 10 Mbit/s class; meanwhile, the share of the fastest speed classes (10 Mbit/s or greater) remained unchanged at 9 per cent. Figure 28 also reveals large regional disparities in both the prevalence of speed classes and the pace of speed improvements.

ICT price trends 2020
29
Figure 28: Share of economies according to the advertised speed for the most common entry-level fixed broadband connection, by region and level of development, 2018-2020
0%10%20%30%40%50%60%70%80%90%
100%
2018
2019
2020
2018
2019
2020
2018
2019
2020
2018
2019
2020
2018
2019
2020
2018
2019
2020
2018
2019
2020
2018
2019
2020
2018
2019
2020
2018
2019
2020
2018
2019
2020
2018
2019
2020
Africa Arab States Asia-Pacific CIS Europe Americas World Developed Developing LDC LLDC SIDS
% o
f eco
nom
ies
10-30 Mbit/s
2-10 Mbit/s
256 Kbit/s - 2 Mbit/s
Note: Advertised speeds as included in the entry-level fixed broadband subscription.Source: ITU and A4AI.
The global median speed for entry-level fixed broadband Internet in 2020 reached 10 Mbit/s, which is double the speed of 2019 (Figure 29). However, consumers in developing countries, especially LDCs and LLDCs, did not benefit significantly, with speeds typically below 5 Mbit/s. Evidently, the gap between developed and developing countries in terms of value for money is growing, considering the striking quality improvements in developed economies (median of entry-level speeds reaching 40 Mbit/s in 2020) and the low GNI per capita rates.
Figure 29: Median advertised speed for the most common entry-level fixed broadband connection, by level of development and region
Note: Medians based on available speed data for 2018-2020. Arab States and CIS regions completely overlap, with constant 2 Mbit/s median connection speeds over the observation period.Source: ITU and A4AI.
3.3 Mobile cellular low-usage basket
The mobile cellular low-usage basket is based on the cheapest available standard basket including 70 minutes of voice calls and 20 SMS messages per month in predetermined on-net/off-net/fixed ratios. It is based on either prepaid or postpaid plans, depending on what is the most common modality in an economy. This basket corresponds to the non-data portion of the data and voice low-consumption basket analysed in the following section.
Until 2017, entry-level, low-usage baskets were based on a minimum of 30 calls and 100 SMS messages. When longer trends are charted, the trend breaks between 2017 and 2018 as a result.

ICT price trends 2020
30
Global trends
The world median price of a mobile cellular low-usage basket in 2020 was USD 9, about half what it was in 2008 (Figure 30). While median basket prices in nominal USD terms differed between developed and developing countries (in 2020 prices in developed countries were USD 3.5 higher than world prices, and in developing countries they were USD 2.9 lower), once corrected for differences in purchasing power, the difference virtually vanished, continuing the trend since 2013. In 2008, the median price of the basket in LDCs was 28 per cent higher than world prices; in 2015 it was still 5 per cent above; and by 2020 it was 4 per cent below. Even if the basket price in PPP$ slightly increased in developed countries last year, PPP-adjusted prices in LDCs and in developed and developing countries all lay within approximately PPP$ 2. When expressed in terms of GNI per capita, the difference in the basket price between developing and developed countries decreased from 3.6 percentage points in 2008 to 1.2 in 2020, owing primarily to the price drop in LDCs. Nonetheless, despite the striking decrease in prices in LDCs since 2008 – over 15 percentage points – the basket could hardly be considered affordable in those countries in 2020, at 5 per cent of GNI per capita.
Figure 30: Evolution of the mobile cellular low-usage basket prices, 2008-2020
USD PPP % GNI p.c.
Note: Based on the 138, 126 and 136 countries for which data were available for 2008-2019. There is a break in series between 2017 and 2018. Up to 2017, data are for a basket of 30 calls and 100 SMSs.Source: ITU (2008-2019); ITU and A4AI (2020). USD exchange rates from the IMF and UN, PPP$ conversion factors and GNI p.c. data are from the World Bank.
The decade-long decline in mobile cellular prices corresponded to a steady increase in mobile cellular penetration rates across the world up to 2019. In 2020, ITU estimated that the global number of mobile cellular subscriptions dropped for the first time, the result of market developments in LDCs and developing countries (left panel of Figure 31).
In the long run, two remarkable trends emerge from synchronously charting the evolution of price changes and penetration rates (right panel of Figure 31). First, moderate annual fluctuations notwithstanding, developing countries continue to follow the development path of developed countries, as the two highly aligned trajectories show. In terms of both price and penetration rate, the situation of developing countries in 2020 resembles that of developed countries in 2008. With developing countries reaching a peak at around one subscription per inhabitant, it is the second trend that warrants the most attention, and it concerns LDCs: it is the decline in penetration rates and the high prices in in those countries.

ICT price trends 2020
31
Figure 31: Changes in mobile cellular subscriptions per 100 inhabitants and basket prices, 2008-2020*
Note: The lines on the right panel connect observations from 2008 to 2020. *Penetration rates for 2020 are ITU estimates for June 2020.Source: ITU Facts and Figures 2020; ITU (2008-2019); ITU and A4AI (2020); GNI p.c. data are from the World Bank.
Affordability
In 2020, the worldwide median price for an entry-level mobile cellular basket with a monthly allowance of at least 70 minutes of voice calls and 20 SMSs was USD 9.6, the equivalent of 1.6 per cent of monthly GNI per capita (Figure 32). At the global level, the long decline in the median price for this basket appears to have levelled off. However, this masks two opposite trends in the market. The first is a price decline occurring primarily in the LDCs. Focusing on the most recent trends, between 2019 and 2020 prices there decreased from 7.3 per cent to 6.2 per cent of GNI per capita, and the drop was even more pronounced in low-income economies, from 16.0 per cent to 9.1 per cent. Despite this improvement, the basket continues to remain unaffordable for a large segment of the population in these economies: it costs more than 2 per cent of GNI per capita in 23 out of the 25 low-income economies for which data are available – and in 38 out of the 44 LDCs. Nonetheless, this first trend, the overall price decline, has gradually narrowed the affordability gap across regions, as the median cost for this basket in Africa dropped from 7.3 per cent to 6.1 per cent of GNI per capita.
By contrast, the second trend is triggered by the operator strategy of consolidating the range of offers and phasing out entry-level voice-only plans in favour of combined voice/data plans with higher usage allowances but also higher price tags. As a result, median prices have increased slightly (by 0.1 percentage point) in regions such as Asia and the Pacific and the CIS. This trend warrants most attention as it is witnessed by LLDCs as well, where the median price for this cheapest of the baskets, already above the global median, increased further from 2.8 per cent to 2.9 per cent of GNI.
The economies where the entry-level mobile cellular basket was most affordable, in order, were Hong Kong (China), Macao (China), Luxembourg, Austria and the United Arab Emirates, in all of which the price of the basket did not exceed 0.1 per cent of GNI per capita. The five economies where it decreased the most over the past year were Liberia, Mauritania, Côte d'Ivoire, Jordan and Benin. By contrast, the basket was most expensive in Niger, Burundi, Central African Republic, Malawi and Nicaragua, where it cost more than 21.7 per cent relative to per capita GNI.

ICT price trends 2020
32
Figure 32: Mobile cellular low-usage basket prices by region, level of development and income, 2019-2020
Note: Medians based on 190 economies for which data were available for the two years. The basket is defined as the cheapest mobile cellular basket that offers at least 70 minutes of voice calls and 20 SMS messages. Source: ITU and A4AI.
Regional trends
The USD price of the mobile cellular low-usage basket around the world ranged widely, between USD 0.6 in Sudan and USD 39.7 in Ireland (Figure 33). After adjusting for purchasing power, the prices ranged between PPP$ 2.4 in Sri Lanka and PPP$ 96.6 in Nicaragua. The six BDT regions differed considerably in terms of the median price for the basket. The cheapest region in terms of USD and PPP$ was the CIS region, where the median price for the entry-level mobile cellular basket was USD 2.9 or PPP$ 9.4. The median price for the basket was the highest in the Americas, at USD 13.9 and PPP$ 23.8.
In Africa the median price of the low-usage basket was USD 6.0, and nominal prices did not typically exceed USD 15.5, except for Cabo Verde (USD 20.3) and Gabon (USD 21.5). However, after adjustment for purchasing power, the median was PPP$ 17.8, with prices reaching as high as PPP$ 36.2 in Niger and PPP$ 44.7 in Cabo Verde.
Overall, the Arab region had the second lowest median basket price (USD 4.7), with prices ranging from USD 0.6 in Sudan to USD 16.9 in Djibouti. The range of prices was considerably wider when measured in terms of purchasing power parities, from the cheapest, PPP$ 2.6 in Sudan, to PPP$ 31.6 in Lebanon, and with a regional median at PPP$ 16.9.
In nominal USD terms, prices in Asia and the Pacific as well as the Europe regions spread over a wide range (from USD 0.7 in Sri Lanka to USD 38.5 in Japan in the case of Asia and the Pacific, and from USD 2.3 in Georgia to USD 39.7 in Ireland in the case of Europe). Correcting for differences in purchasing power narrowed the range, with PPP$ 2.4 for Sri Lanka and PPP$ 37.3 for Japan. In Europe, the lowest price in PPP$ was found in Austria (PPP$ 4.3) while the highest was found in Germany (PPP$ 38.5).

ICT price trends 2020
33
Entry-level mobile cellular basket prices were closely bunched across the CIS region. The difference between the cheapest (USD 1.4 in Uzbekistan) and the most expensive (USD 3.7 in Armenia) basket in the region was negligible. Even if prices in PPP$ were somewhat more spread out, the highest price in the region (PPP$ 13.6 in Belarus) was barely twice the lowest (PPP$ 6.6 in Uzbekistan).
Consumers across the Americas faced very different mobile cellular basket prices, both in USD and in PPP$ terms. While the basket could be purchased in Mexico for USD 3.4, consumers in Nicaragua faced 10 times higher prices, at USD 34.5. Applying purchasing power parity ratios, the same countries remained at the two extremes, with prices of PPP$ 7.2 and PPP$ 96.6 respectively. The distribution of basket prices was very diverse in the region and did not follow any pattern, such as levels of income, development, or size of market. For instance, the same basket cost PPP$ 11.9 in Haiti, an LDC and SIDS, PPP$ 16.6 in Brazil, an upper-middle-income developing country, PPP$ 19.2 in Chile, a high-income developing country, PPP$ 21.7 in Canada, a high-income developed country, and PPP$ 66.6 in Argentina, an upper-middle-income developing country.
Figure 33: Mobile cellular prices by region, 2020, in USD (left) and in PPP$ (right)
USD PPP$
Note: Each dot represents the price of the basket in one country in a region. The midline in the boxes and the labels indicate the median price for the region. Boxes cover the second and third quartile of the distribution (the interquartile range), thus half of the country observations are within the shaded area; whiskers extend to up to 1.5 times the interquartile range, dots outside whiskers are outlier values. One value is not shown for the Americas because, at PPP$ 96.6, it lies outside the chart.Source: ITU and A4AI.

ICT price trends 2020
34
3.4 Mobile data and voice baskets
Since 2018, ITU has been collecting data for price baskets that combine data, voice and text messaging services. A low and a high-consumption data basket were defined by EGTI with the aim of aligning ICT price monitoring and benchmarking to operator practices of selling bundled services in low as well as high-income economies. The following allowance thresholds were applied:
• low-consumption basket: 70 voice minutes, 20 SMSs and 500 MB of broadband data; • high-consumption basket: 140 voice minutes, 70 SMSs and 1.5 GB of broadband data.
Strictly defined data and voice bundles (sold as a single service) were not universally available. Therefore, the above-mentioned allowance thresholds could also be met by combining base plans and add-ons. The statistics presented in this section therefore originate from a data collection that encompassed a variety of solutions, based on the principle of selecting the cheapest available option in the market meeting the requirements.18
Comparing mobile basket prices across country groups reveals why it is useful to monitor both the low- and high-consumption basket prices. As shown in Figure 34, consumers in developed and developing countries paid virtually the same price for the low-consumption basket (PPP$ 22.2 vs. 22.7). The high-consumption basket prices, however, diverged. Worldwide, the median price of the low-consumption basket (at PPP$ 22.5) was PPP$ 6.7 lower than that of the high-consumption basket. In other words, consumers had to pay a 30 per cent premium for the additional 70 voice minutes, 50 SMSs and 1 GB data. This premium was significantly smaller in developed economies (PPP$ 3.6 or 16 per cent) than in developing ones, where the PPP$ 10.4 translated into 46 per cent higher prices. The premium for the high-consumption basket was even higher in LDCs, amounting to PPP$ 15.8 (or 74 per cent). Considering income levels, the low-consumption basket not only cost more in high-income economies (PPP$ 25.1) than in low-income ones (PPP$ 23.2), but the premium for the high-consumption basket was also higher (PPP$ 13.8 compared to 4.8).
On the “opposite” side, the differences between the median price for the mobile data and voice low-consumption basket and those for the mobile cellular low-usage basket (with the same voice and SMS, but no data allowance) and the data-only mobile broadband basket (with three times higher data, but no voice or SMS allowance) are also telling. Figure 34 shows that the differences, to a large extent, mirrored those observed between the high and low-consumption baskets in two respects.
18 Data collection proved particularly challenging for these combined baskets. While identifying relevant bundles was straightforward in numerous countries, bundles were not universally available. In some countries – for instance, where allowances “overshot” the benchmark data, voice or SMS thresholds –, combining plans and add-ons offered a cheaper alternative to meeting the basket requirements. In certain cases, bundles were only available in promotions, which could not be considered for data collection as per the rules. Guided by the principle of collecting data for the cheapest solution that met basket requirements resulted in a multitude of different solutions, as shown in the tables of Annex 2.

ICT price trends 2020
35
Figure 34: The mobile data and voice, low-consumption basket prices (PPP$) in comparison with other mobile basket prices, by level of development and income, 2020
Note: The chart is based on median prices computed for economies with 2020 data available (162 economies for the low-consumption basket; 165 economies for the high-consumption basket; and 166 economies for the mobile cellular low-consumption basket and the data-only mobile broadband basket). The price of the mobile data and voice low-consumption basket, which is taken as the reference, is shown inside the filled circles. Source: ITU and A4AI.
First, the data and voice low consumption basket cost more than both the no-data mobile cellular basket as well as the data-only mobile broadband baskets across all country groupings in 2020, with a worldwide difference in median prices of about 4.5 and 5.7 PPP$ (amounting to a 20 and 25 per cent reduction), respectively. Second, consumers in developing countries paid a higher premium than those in developed countries to access the data and voice low-consumption services compared to both mobile cellular low-usage and data-only mobile broadband services. For instance, in developing countries, the data and voice low-consumption basket cost 4.8 PPP$ more than the data-only basket and 6 PPP$ more than the mobile cellular basket. Interestingly, however, the magnitude of difference with respect to the two cheaper plans was less than the difference with respect to the more costly plan for developed as well as developing countries. This was also true for LDCs, where the median basket price for the combined basket was only about 5.3 and 5.7 PPP$ more than the two with less components. At the same time, the difference in absolute terms was much larger in the context of LLDCs, SIDS and low-income economies. (It is also noteworthy that lower-middle income economies are a special group not only with the cheapest prices across income groups, but also because the mobile cellular low-usage basket cost more than the data-only mobile broadband basket.)
A possible explanation for the larger price differences between the high and low-consumption basket prices in developing and lower-income markets is the degree of maturity of the regulatory environment and competition. While the mechanisms may need further research to reach full understanding, it is an interesting fact that the use of add-ons to meet the basket requirements is more widespread in developing countries, while bundles are more common in developed countries. In fact, the benchmark basket included an add-on in around 1 in 10 of the developed economies, but 1 in 3 developing economies. The data suggest that consumers in many countries could not benefit from scale “bargains” (decreasing marginal prices) when adding more or larger add-ons to reach the high-consumption allowance threshold. The price difference between the high and low-consumption baskets in developing countries requires

ICT price trends 2020
36
policy attention, considering also that the 500 MB of monthly data allowance is most likely insufficient to meet foundational online activities.19
Global trends
Consumers around the world paid less for the two mobile data and voice baskets in 2020 than two years before, which is the first important trend shown in Figure 35.20 The median price of the low-consumption basket was USD 12 in 2020, following a 10 per cent annual average decline21 over the previous two years, driven chiefly by price drops in developing countries. The high-consumption basket cost USD 16.5 in 2020, showing an even steeper decline at 16 per cent annual average rate – this price drop was observable in developed and developing countries alike.
The second trend observed is the price drop in developing countries for both the low and high-consumption baskets regardless of the measure used. In terms of PPP$, both baskets dropped at an annual average rate of slightly over 8 per cent to PPP$ 22.7 and 33.1, respectively. In terms of GNI per capita, prices for both baskets declined in developing countries at a rate of about 14 per cent annually to 3.1 and 4.1 per cent, resulting in a slight convergence between the low and high-consumption baskets.
The third important trend to highlight concerns the gap between LDC prices and world prices. Although median prices for LDCs dropped significantly between 2018 and 2020, the gap between LDCs and the world hardly diminished, with the magnitude of the gap depending on the measure used. The median price for LDCs in USD terms for the low and high-consumption baskets was USD 7.6 and USD 13.6 respectively in 2020, following a nearly 20 per cent annual average drop over the previous two years. However, while the baskets appeared to be the cheapest in LDCs when measured in USD terms (in 2020, LDC median prices were 63 and 82 per cent lower than world prices in nominal terms for the low and high-consumption basket), differences in income levels meant that they were the least affordable when prices were measured in GNI per capita (at over 5 and 6 times the world median). More details on the implications for affordability will be provided in the section that follows. The evolution of the gap is even more complicated when measured in terms of PPPs, as the low and high-consumption baskets followed different trajectories. On the one hand, the median price for the low-consumption basket in LDCs was 16 per cent above the world median in 2018, but by 2020 it had decreased to below the world price by 6 per cent, in PPP$ terms. The gap between the high-consumption basket and world median prices, on the other hand, increased slightly from 24 to 27 per cent over the period.
Fourth, the data show that the premium paid for the high-consumption basket over the low-consumption basket (essentially, the cost of the additional 70 minutes of voice calls, 50 SMSs and 1 GB of data usage) has been shrinking worldwide. In USD terms, the premium decreased from USD 8.1 to 4.5 between 2018 and 2020, in PPP$ terms from PPP$ 11.8 to 6.7, but in terms
19 Foundational online activities, such as accessing news, reaching online government and health services, basic online shopping or minimal education, were recently estimated to require around 660 MB of monthly data consumption in a selection of developing countries. See World Bank (2021) Minimum data consumption: How much is needed to support online activities, and is it affordable? Analytical Insight; World Bank, Washington, DC. https:// openknowledge .worldbank .org/ handle/ 10986/ 35149
20 Since the data and voice baskets were introduced only recently, trends are only available for the 2018-2020 period.
21 For the calculation of CAGR, USD values were adjusted for inflation. The graphs show current USD prices.

ICT price trends 2020
37
of GNI per capita it only changed by one tenth of a percentage point. Not only was the price premium relatively the smallest in developed countries, but it had also decreased much more in developed than in developing countries or LDCs in all three measures, falling from PPP$ 7.8 to 3.6 in developed countries (54 per cent) but only from PPP$ 12.6 to 10.4 (18 per cent) in developing countries and from PPP$ 16.7 to 15.8 (merely 6 per cent) in LDCs. In LDCs, the decrease notwithstanding, the premium remains very high.
Finally, it is useful to recall the mobile broadband penetration levels and changes discussed earlier in this report. Over the past two years, as prices in terms of GNI per capita decreased by 0.5 and 0.6 percentage points, penetration rates increased by 5.5 percentage points to 75 subscriptions per 100 inhabitants worldwide. The fact that the highest increase in penetration rates was observed in developed countries (8.6 percentage points, to 125.2 subscription per 100 inhabitants) while prices remained virtually the same indicates that there is no evident relationship between changes in these two basket prices and subscriptions.
Figure 35: Evolution of mobile data and voice low and high-consumption basket prices, 2018-2020
Low-consumption baskets
USD PPP$ % GNI p.c.
High-consumption baskets
USD PPP$ % GNI p.c.
Note: Based on the 138, 126 and 136 countries (respectively) for which data were available for all years indicated. Source: ITU (2018-2019); ITU and A4AI (2020).

ICT price trends 2020
38
Affordability
Figure 36 offers a more detailed view across country groups of how prices for the two mobile data and voice baskets, measured as a share of GNI per capita, changed between 2018 and 2020. In 2020 the worldwide median price for the low-consumption basket dropped below 2 per cent of GNI per capita for the first time (to 1.9 per cent), while the high-consumption basket cost 2.6 per cent. Over the past two years, the premium for the high-consumption basket dropped slightly as both baskets became more affordable. Nevertheless, considerable differences remained across countries, as described below.
Figure 36: Mobile data and voice low and high-consumption basket prices by region and level of development, as a percentage of monthly GNI per capita, 2018-2020
Note: Medians based on the 179 and 182 economies for which data were available for the three years for the low and high-consumption baskets, respectively. The mobile data and voice low-consumption basket is defined as the cheapest mobile data and voice basket subscription available domestically, with a minimum of 70 minutes, 20 SMSs and 500 MB monthly data allowance and a technology of 3G or above. The mobile data and voice high-consumption basket is defined as the cheapest such subscription 140 minutes, 70 SMSs and a 1.5 GB monthly data allowance and a technology of 3G or above.Source: ITU (2018-2019); ITU and A4AI (2020).
Across regions, the biggest improvements in affordability of the data and voice low-consumption basket were registered in Africa and the Arab States, at 1.6 and 0.8 percentage points, respectively (Figure 36) Prices effectively stagnated in the CIS, Europe and the Americas regions.
Despite the 1.3 percentage point drop between 2018 and 2020, developing countries continue to lag behind their developed counterparts in median prices for the low-consumption basket, although the gap reduced from 3.4 percentage points in 2018 to 2.3 in 2020.
In 2020 Luxembourg, Macao (China), Austria, Hong Kong (China) and Israel (in that order) had the most affordable data and voice low-consumption baskets. By contrast, Burundi, Democratic Republic of the Congo, Chad, Niger and Central African Republic had the least affordable baskets (in order of increasing expense). In these countries, the low-consumption basket would have cost an average earner at least 30 per cent of their monthly income, making the basket was affordable only for the highest earners.
The GNI per capita price trends for the data and voice high-consumption basket followed the trends for the low-consumption basket (Figure 36). Globally, affordability levels improved by 0.6 percentage points from 2018 to 2020. Basket prices declined in all regions, although the

ICT price trends 2020
39
biggest beneficiaries were consumers in Africa and the CIS, where median prices dropped by 5.5 and 1.3 percentage points, respectively.
The gap in affordability of high-consumption baskets between developed and developing countries narrowed further between 2018 and 2020, as prices decreased in developing countries (the median price falling by 1.4 percentage points to 4.1 per cent of GNI per capita) while the affordability of the basket remained essentially unchanged in developed countries. In LDCs, the high-consumption basket remained unaffordable for the average earner despite the 5.2 percentage point drop, as relative prices were still at 16.6 per cent of GNI per capita. For LLDCs, the median basket price in 2020 fell below the 10 per cent threshold for the first time, to 8.3 per cent. For SIDS, the price drop slowed down in the past year, so that, at 4.4 per cent of GNI per capita, it was trailing the median prices of developing countries in 2020.
In 2020, the economies that offered the most affordable low-consumption baskets were the same ones offering the most affordable high-consumption baskets: Luxembourg, Macao (China), Austria, Hong Kong (China) and Israel (in that order), where the average earner would need to spend less than half a per cent of their income for access. At the other end of the scale, countries where the high-consumption baskets were the most unaffordable were Democratic Republic of the Congo, Malawi, Burundi, Central African Republic and Chad (in that order), where the basket price amounted to as much as 62 per cent of the average income per capita.
Figure 36 also shows the size of the premium between the prices of the high and the low-consumption baskets in many low-income markets (such as in Africa, or in LDCs and LLDCs); in developed countries the two baskets are much closer in terms of affordability, a reflection of the growing ubiquity of such services in those countries. As the high-consumption option has become affordable for nearly their entire population, the low-consumption option has all but disappeared for customers in up to 42 per cent of the high-income countries covered in the data collection in 2020.
Despite this premium, statistics show that, overall, considerable progress has been made between 2018 and 2020. Making high-consumption baskets affordable in all countries should be a key policy goal. Low-consumption baskets may be attractive as a starting point for access, but they do not allow users to benefit fully from the many advantages that a more meaningful Internet connectivity offers. This is especially true because it is often the case that the more powerful and beneficial tools requiring Internet access are also the most data-intensive.
Regional trends
Prices for both the low and the high-consumption mobile data and voice basket in 2020 were cheapest in the CIS region, both in absolute terms (USD 3.5 and 4.4) and after adjustment for purchasing power parity (PPP$ 12.2 and 15.6) (Figure 37). The most expensive region for the low-consumption basket was the Americas (USD 19.7 or PPP$ 33.1). The Americas also had the most expensive high-consumption basket nominally, at USD 26.3, but in adjusted figures, at PPP$ 37.1, it was a close second to Africa, where the median price was PPP$ 39.7.

ICT price trends 2020
40
Figure 37: Data and voice low and high-consumption basket prices by region in 2020, in USD (upper) and in PPP$ (lower)
Low-consumption basket, USD High-consumption basket, USD
Low-consumption basket, PPP$ High-consumption basket, PPP$
Note: Each dot represents the price of the basket in one country in a region. The midline in the boxes and the labels indicate the median price in that region. Boxes cover the second and third quartile of the distribution (the interquartile range), thus half of the country observations are within the shaded area; whiskers extend to up to 1.5 times the interquartile range, dots outside the whiskers are outlier values. Not shown, because it lies beyond the chart at PPP$ 113.0, is one adjusted price datum for the high-consumption basket in Africa.Source: ITU and A4AI.
With the exception of the low-consumption basket in the CIS region, data and voice basket prices showed a high variation within each region when measured in purchasing power parities. In Africa, the cheapest prices for both baskets were to be found in Senegal (both at PPP$ 8.1), while the most expensive ones were in Cabo Verde (PPP$ 55.4 and PPP$ 113.0 for the low and high-consumption basket). In the Arab States, the low-consumption basket was priced at
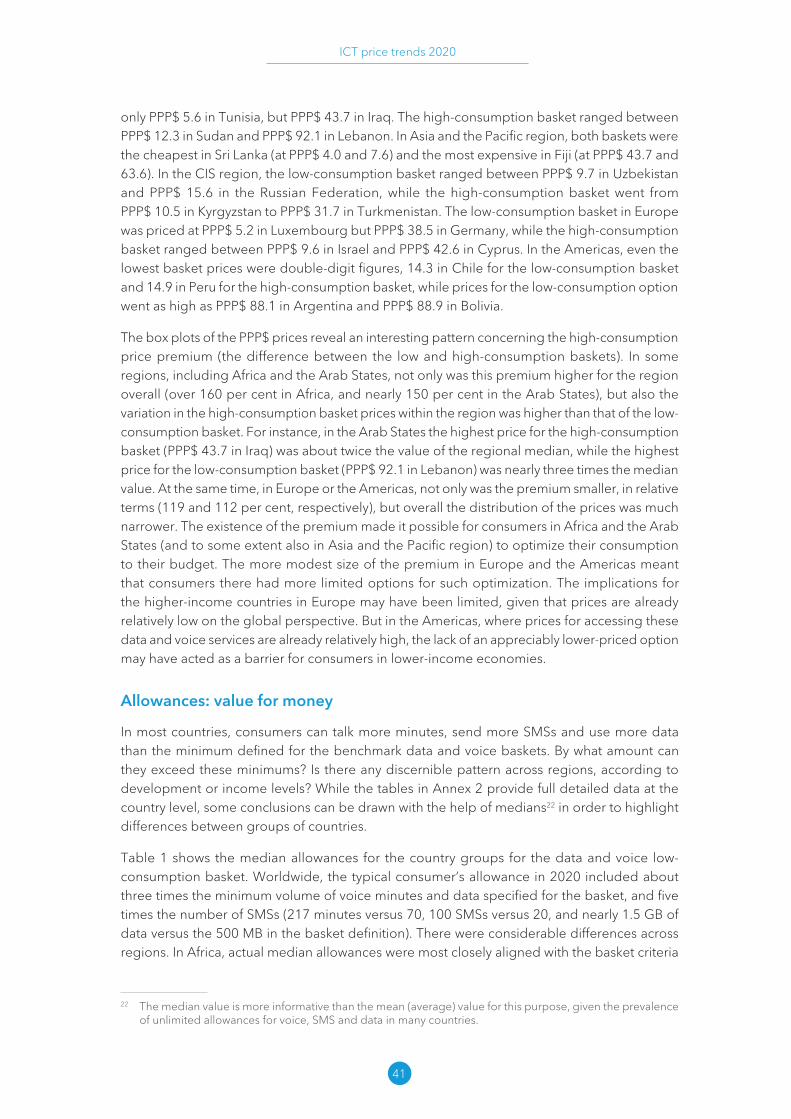
ICT price trends 2020
41
only PPP$ 5.6 in Tunisia, but PPP$ 43.7 in Iraq. The high-consumption basket ranged between PPP$ 12.3 in Sudan and PPP$ 92.1 in Lebanon. In Asia and the Pacific region, both baskets were the cheapest in Sri Lanka (at PPP$ 4.0 and 7.6) and the most expensive in Fiji (at PPP$ 43.7 and 63.6). In the CIS region, the low-consumption basket ranged between PPP$ 9.7 in Uzbekistan and PPP$ 15.6 in the Russian Federation, while the high-consumption basket went from PPP$ 10.5 in Kyrgyzstan to PPP$ 31.7 in Turkmenistan. The low-consumption basket in Europe was priced at PPP$ 5.2 in Luxembourg but PPP$ 38.5 in Germany, while the high-consumption basket ranged between PPP$ 9.6 in Israel and PPP$ 42.6 in Cyprus. In the Americas, even the lowest basket prices were double-digit figures, 14.3 in Chile for the low-consumption basket and 14.9 in Peru for the high-consumption basket, while prices for the low-consumption option went as high as PPP$ 88.1 in Argentina and PPP$ 88.9 in Bolivia.
The box plots of the PPP$ prices reveal an interesting pattern concerning the high-consumption price premium (the difference between the low and high-consumption baskets). In some regions, including Africa and the Arab States, not only was this premium higher for the region overall (over 160 per cent in Africa, and nearly 150 per cent in the Arab States), but also the variation in the high-consumption basket prices within the region was higher than that of the low-consumption basket. For instance, in the Arab States the highest price for the high-consumption basket (PPP$ 43.7 in Iraq) was about twice the value of the regional median, while the highest price for the low-consumption basket (PPP$ 92.1 in Lebanon) was nearly three times the median value. At the same time, in Europe or the Americas, not only was the premium smaller, in relative terms (119 and 112 per cent, respectively), but overall the distribution of the prices was much narrower. The existence of the premium made it possible for consumers in Africa and the Arab States (and to some extent also in Asia and the Pacific region) to optimize their consumption to their budget. The more modest size of the premium in Europe and the Americas meant that consumers there had more limited options for such optimization. The implications for the higher-income countries in Europe may have been limited, given that prices are already relatively low on the global perspective. But in the Americas, where prices for accessing these data and voice services are already relatively high, the lack of an appreciably lower-priced option may have acted as a barrier for consumers in lower-income economies.
Allowances: value for money
In most countries, consumers can talk more minutes, send more SMSs and use more data than the minimum defined for the benchmark data and voice baskets. By what amount can they exceed these minimums? Is there any discernible pattern across regions, according to development or income levels? While the tables in Annex 2 provide full detailed data at the country level, some conclusions can be drawn with the help of medians22 in order to highlight differences between groups of countries.
Table 1 shows the median allowances for the country groups for the data and voice low-consumption basket. Worldwide, the typical consumer’s allowance in 2020 included about three times the minimum volume of voice minutes and data specified for the basket, and five times the number of SMSs (217 minutes versus 70, 100 SMSs versus 20, and nearly 1.5 GB of data versus the 500 MB in the basket definition). There were considerable differences across regions. In Africa, actual median allowances were most closely aligned with the basket criteria
22 The median value is more informative than the mean (average) value for this purpose, given the prevalence of unlimited allowances for voice, SMS and data in many countries.

ICT price trends 2020
42
for voice (exact match) and data (median allowance 50 per cent higher than the basket), while the SMS allowance was more generous, being 200 per cent higher. Baskets in the Americas offered high value for money, with unlimited minutes, four times as many SMSs and eight times as much data as the basket definition requires. In the CIS, Europe and the Americas regions, the median allowance for the low-consumption basket is actually more generous than the minimal criteria for the high-consumption basket. Given the relatively high price levels in the Americas, this “overshooting” of the benchmark minimum is to the detriment of lower income users in the region. By contrast, baskets appear to have been “right-sized” for the entry-level low-consumption users in Africa and in Asia and the Pacific.
In general, the data show that the higher the income or level of development is, the more generous are the allowances, effectively turning the low-consumption basket into a high-consumption one for the median country in the developed, SIDS, upper-medium-income and high-income groups.
Table 1: Median voice, SMS and data allowances by region and level of development for the mobile data and voice low-consumption basket, 2020
minutes SMS data (MB)
includedExceedsminimum included
Exceedsminimum included
Exceedsminimum
Basket minimum 70 20 500
World 217 209% 100 400% 1,500 200%
Regions
Africa 70 0% 60 200% 750 50%
Arab States 100 43% 40 100% 900 80%
Asia and the Pacific 70 0% 20 0% 1,160 132%
CIS 1,000 1,329% 200 900% 3,072 514%
Europe 5,000 7,043% 3,000 14,900% 2,048 310%
The Americas Unlimited Unlimited 80 300% 4,096 719%
Development
Developed Unlimited Unlimited 3,000 14,900% 2,048 310%
Developing 145 107% 50 150% 1,300 160%
LDC 92 31% 50 150% 850 70%
LLDC 140 100% 20 0% 1024 105%
SIDS 270 286% 100 400% 2,500 400%
Income
Low income 70 0% 50 150% 790 58%
Lower-middle-income 100 43% 25 25% 1,062 112%
Upper-middle-income 250 257% 100 400% 2,048 310%
High income 725 936% 900 4,400% 2,048 310%
Notes: Median of voice, SMS and data allowance computed by group across countries with data available. Data in the “Exceeds minimum” columns indicate the percentage by which a group median is above the respective reference value, i.e. the minimum allowance specified in the definition of the basket. Source: ITU and A4AI.
Table 2 shows that the actual worldwide median allowances for the high-consumption basket are also considerably higher than the basket minimum, giving consumers more than twice the

ICT price trends 2020
43
minimum number of voice minutes (300 rather than 140), 2.5 times the minimum number of SMSs (175 rather than 70), and one extra GB of data (2.5 GB as opposed to 1.5 GB).23 Again, there is considerable regional variation in the actual allowances. The two regions that are closest to the basket minimum are Africa and Asia and the Pacific. In Africa, the median allowance for voice minutes matches the basket exactly, while SMS and data usage can go over the basket minimum by about one-third. In Asia and the Pacific, too, the median voice and SMS allowances are just at the minimum level for the basket, while the data allowance is 80 per cent higher. As with the low-consumption basket, while allowances in both Europe and the Americas are very generous, there is a steep differential in terms of affordability: the basket price was a comfortable 0.9 per cent of GNI per capita in Europe, but 3.1 per cent in the Americas, well above the affordability benchmark. Thus, increasing the variety of products on offer – including those with lower allowances – would be a means of connecting more users to the Internet.
Table 2: Median voice, SMS and data allowances by region and level of development for the mobile data and voice high-consumption basket, 2020
minutes SMS data (GB)
includedExceedsminimum Included
Exceedsminimum included
Exceedsminimum
Basket minimum 140 70 1.5
World 300 114% 175 150% 2.5 63%
Regions
Africa 140 0% 90 29% 2 33%
Arab States 150 7% 100 43% 2 33%
Asia and the Pacific 140 0% 70 0% 2.7 80%
CIS 300 114% 100 43% 3 100%
Europe Unlimited Unlimited Unlimited Unlimited 3 100%
The Americas Unlimited Unlimited 125 79% 4.8 220%
Development
Developed Unlimited Unlimited Unlimited Unlimited 3 100%
Developing 200 43% 100 43% 2 33%
LDC 140 0% 95 36% 2 33%
LLDC 150 7% 70 0% 2 33%
SIDS 330 136% 195 179% 3.6 140%
Income
Low income 140 0% 100 43% 2 33%
Lower-middle-income 140 0% 70 0% 2 33%
Upper-middle-income 300 114% 100 43% 3 100%
High income 1,750 1,150% 2,500 3,471% 3 100%
Notes: Median of voice, SMS and data allowance computed by group across countries with data available. Data in the “Exceeds minimum” columns indicate the percentage by which a group median is above the respective reference value, i.e. the minimum allowance specified in the definition of the basket.Source: ITU and A4AI.
23 This confirms the agreement of EGTI to increase the data allowance threshold to 2 GB for this basket for the ITU ICT price benchmark data collection from 2021 onwards.

ICT price trends 2020
44
4. Inequality and the affordability of broadband services
Thus far, the affordability of broadband baskets has been measured by relating domestic basket prices to the monthly per capita gross national income and benchmarking against a set target. This offers a high-level indicator of affordability for the average earner. It reveals considerable inequality across countries. Now, inequality in income and consumption also persists within countries, and even where a basket appears to be affordable for the average citizen, a significant share of the population may find the price to be beyond their means. The present section provides finer-grained insights into the affordability of broadband prices for different income groups within countries, where data on the distribution of household income or consumption expenditure are available. This supports efforts not only to achieve Sustainable Development Goal 10 – reduce inequality within and among countries – but also to help understand one of the key barriers to Internet access for the unconnected 49 per cent of the world.
ITU’s Measuring the Information Society Report for 2014 presented important considerations for measuring inequality in the context of ICT prices, and these must be kept in mind when using such data. First, there are fundamental conceptual differences between gross national income (GNI) and household income. GNI is an aggregate used to measure economic development by the size of the economy, measured in the context of national accounts, accounting for primary flows in and out of the country, and thus also including the business sector. Household income excludes the business sector and measures all the income received by the members of a household less taxes and social security contributions. It relies on data collected through household surveys, which is used to calculate income deciles.
Second, income is not the only way to measure inequality. Household consumption expenditure may be a better indicator, particularly where income is difficult to measure (e.g. due to large informal sectors or self-employment). It should be borne in mind that consumption inequalities tend to be lower than income inequalities. Inequality data based on consumption is more widespread for developing countries, while developed economies typically use income as a reference. Finally, apart from the choice of measurement, as all the data originate from household surveys, the vehicle, periodicity, and equivalence scales used may limit the comparability of inequality data across countries. Nevertheless, the data used for the calculations in this report correspond to the basis of SDG indicator 10.1.1,24 elaborated using the most recent data available through the World Bank PovcalNet tool.
Inequality indicators
Inequality can be measured using a wide range of indicators, with some focusing on the overall distribution (such as the Gini coefficient) while others focus on selected segments of the population, such as the top or bottom 20 or 40 per cent in terms of income or consumption. Calculations in the present report follow the philosophy of indicator 10.1.1 relevant for the SDG
24 SDG Indicator 10.1.1 is defined as “Growth rates of household expenditure or income per capita among the bottom 40 per cent of the population and the total population”.

ICT price trends 2020
45
target (“reduce income inequalities”) and focus on affordability for the bottom 40 per cent of incomes, exploiting available data collected for this indicator. The data source is the World Bank’s PovcalNet database. Two important limitations of the source should be recognized. First, it relies on both the income and consumption approaches, depending on the availability of country-level data. Second, data are not collected annually; thus, in order to maximize country coverage around the world, the most recent available data were taken within the 2015 to 2018 window, on the assumption that indicators relevant to social structures take longer to change. In total, the calculations cover 108 economies for which data were available.
To assess inequalities in the affordability of broadband within a country, a more granular view is needed than that provided by the countrywide average (the relative price of a basket expressed as a percentage of GNI per capita). Three additional indicators were therefore used to provide answers to the following questions:
• How affordable are broadband prices for the most affluent 40 per cent of the population? • How affordable are they for the least affluent 40 per cent?• For what share of the country’s population (how many deciles) are broadband prices
affordable, using the Broadband Commission’s 2 per cent target as a criterion?
Thus, for the two segments containing the top and bottom 40 per cent of the population by income, the relative price was calculated as before, but dividing the basket prices by the calculated income for each segment rather than the GNI per capita average. The same calculation was also performed for each of the ten deciles, with the help of PovcalNet data. The resulting figures give the price of a broadband basket as a percentage of income for the following segments of the population: top 40 percent, bottom 40 per cent, and, separately, each of the ten decile segments.
To take the example of Rwanda, at the nationwide level the price of the data-only mobile broadband basket was calculated at 6.9 per cent of GNI per capita. For the most affluent segment of the population (top 40 per cent in terms of consumption), the relative price was lower; although, at 3.9 per cent of the income for that segment, it still remained well above the affordability target. At the most granular level, a decile-by-decile review shows that the only group in which the affordability target was met was the top 10 per cent of the population, where the relative price was equivalent to 1.9 per cent of their income; for the second-highest decile, the cost was already 4.5 per cent of income.
The results of the calculation are presented below for both the mobile and fixed broadband basket with a regional breakdown. (Given the incomplete coverage, aggregates were not computed for country groups based on level of development or income.) Figure 38 aims to help readers interpret the charts on inequality and affordability that follow. Tables in Annex 3 complement the graphs with country-level statistics and information on the inequality data source.

ICT price trends 2020
46
Figure 38: How to read the charts on inequality and affordability
0%10%20%30%40%50%60%70%80%90%100%0
2468
101214161820
Country
% p
opul
atio
n
as %
of a
djus
ted
mon
thly
inco
me
per c
apita
Top population deciles that can afford basket →
←Average
←Bottom 40%
←Highest 40%
the top 20 % highest earners can afford the basket (basket price per adjusted monthly per capita income the top 2 deciles)80 % of the Country's population cannot afford the basket (basket price per adjusted monthly per capita income the lower 8 deciles)
RIGHT VERTICAL AXISLEFT VERTICAL AXIS
The basket price amounts to 12 % of monthly income per capita for the bottom 40% lowest earners in the Country
The basket price amounts to 2.4 % of GNI per capita
The basket price amounts to 1.2 % of the monthly per capita income for the 40% highest earners
indicators measured on left vertical axis
indicator measured on right vertical axis
Source: ITU.
Africa
Taking household consumption expenditure into consideration further highlights the prohibitive entry-level price of broadband services for a large majority of the population in those African countries for which data are available.25 The spread between the adjusted monthly income per capita for the bottom and top 40 per cent of the population (charted on the left axes in Figure 39) reveals large inequalities in most of the countries covered. In Ethiopia, for instance, while the mobile broadband basket cost 9.5 per cent of monthly income for the average consumer, it was 5.9 per cent for the highest 40 per cent, but 19.6 per cent for the bottom 40 per cent of the population. In Botswana, on the other hand, both the relative basket prices and inequality were lower. The mobile broadband basket in the country cost 1.0 per cent for the average consumer, 0.5 per cent for the highest consuming 40 per cent, and 3.8 per cent of monthly consumption for the bottom 40 per cent of the population. Meanwhile, fixed broadband access was clearly a luxury throughout Africa. Even for the highest-consuming 40 per cent, it cost 15.6 per cent of adjusted income in Ethiopia and 2.3 per cent in Botswana. Only in Cabo Verde and Mauritius (from among the countries with sufficient data) could the highest-consuming 40 per cent afford the fixed broadband basket, with relative prices corresponding to 1.5 and 0.8 per cent of adjusted income in the two countries, respectively. In sum, among the countries covered in this analysis, mobile broadband prices were affordable for the average consumer in four countries, for the bottom 40 per cent of the population in one country, and for the top 40 per cent in ten countries. Entry-level fixed broadband prices were affordable for the average consumer in one country, for the bottom 40 per cent in none of the countries, and for the top 40 per cent in two of the countries covered.
25 Data are available for 24 countries of the Africa region, which account for about 63 per cent of the population in the region.

ICT price trends 2020
47
Figure 39: Affordability of broadband baskets by consumption deciles in selected African countries, 2020
→ ← ← ← → ← ← ←
Note: Prices in terms of adjusted monthly income per capita for the average, bottom 40 per cent and highest 40 per cent consumers are shown on the left vertical axis; every green square indicates a population decile that can afford a basket (price relative to adjusted monthly income is 2 per cent or less), conversely, every grey square indicates a population decile that cannot afford a basket. Not shown because they lie outside the chart are the values for the mobile broadband basket for the bottom 40 per cent of the population in Malawi, Sierra Leone and Togo (49.4, 31.9 and 41.4 per cent, respectively) and those for the fixed broadband basket in Malawi, Rwanda and Togo (266.7, 121.6, and 103.6 per cent). Detailed statistics are provided in Annex 3. Source: Price data from ITU and A4AI; income and consumption expenditure data from World Bank PovcalNet.
As indicated by the green squares in Figure 39, in 7 of the 24 countries for which statistics were available, even the most affluent 10 per cent of the population (those with the highest household consumption) had to pay more than 2 per cent of their income to access mobile broadband services; and for fixed broadband services that was the case in 15 of the 20 countries covered. The generally cheaper mobile broadband services were affordable only to the top 10 per cent in 9 countries, and to the top 20 per cent in three more countries. Even among the best performing countries, only half of the population could afford mobile broadband services (Botswana, Gabon, and Nigeria). Mauritius was an outlier, with 90 per cent of the population paying able to obtain mobile broadband access for less than 2 per cent of their consumption expenditure-adjusted income. Only the highest-consuming 10 per cent of the population could afford fixed broadband prices in Namibia, Lesotho, and Botswana, and the highest 20 per cent in Cabo Verde. In Mauritius (showing patterns more similar to other regions of the world) 60 per cent had access to affordable fixed broadband connection.
Arab States
Only very limited fine-grained information can be provided on the affordability of broadband baskets in Arab States, due to a lack of data on income or consumption distribution. The countries with data available show a very diverse pattern. To highlight a few examples: with relatively low inequality in terms of consumption, the difference in the affordability of the mobile broadband basket between the top and bottom 40 per cent of the population is only 1.2 percentage points in Egypt and 1.7 in Tunisia. In Egypt, mobile broadband service was affordable for 90 per cent of the population, while in Tunisia it was affordable for 70 per cent. Fixed broadband, on the other hand, remained above the 2 per cent target for most of the population – except for the top 10 per cent in Djibouti and Egypt and the top 20 per cent of consumers in Tunisia. Nevertheless, the right panel of Figure 40 also shows important differences across the region, since the price of fixed broadband services faced by the bottom 40 per cent relative to their income was about 5.9 per cent in both Egypt and Tunisia, 13.2 per cent in Djibouti and 15.5 per cent in Palestine.

ICT price trends 2020
48
Figure 40: Affordability of broadband baskets by consumption deciles in selected Arab States, 2020
Data-only mobile broadband basket, 1.5 GB Fixed broadband basket, 5 GB
→
←
←
←
Note: Prices in terms of adjusted monthly income per capita for the average, bottom 40 per cent and highest 40 per cent consumers are shown on the left vertical axis; every green square indicates a population decile that can afford a basket (price relative to adjusted monthly income is 2 per cent or less), conversely, every grey square indicates a population decile that cannot afford a basket. Palestine is not an ITU Member State; *the status of Palestine in ITU is the subject of Resolution 99 (Rev. Dubai, 2018) of the ITU Plenipotentiary Conference. Detailed statistics are provided in Annex 3.Source: Price data from ITU and A4AI; income and consumption expenditure data from World Bank PovcalNet.
Asia and the Pacific
Data on inequality (based mostly on the consumption approach) are only available for 15 economies in Asia and the Pacific region, representing about 60 per cent of the region in terms of population. For the countries covered, the data show that mobile broadband connectivity is not a luxury reserved for the most affluent. At least 60 per cent of the population in the region can afford mobile broadband services in 10 of the 15 countries. In all of the 15 countries for which data are available except for Tonga, the bottom 40 per cent of the population pay less than 5 per cent of their monthly income for the mobile broadband basket. In 10 of these countries, that figure is 3 per cent or less (Figure 41), and in 4 – China, Myanmar, Pakistan and Sri Lanka – even the bottom 40 per cent pays less than 2 per cent of their income on the basket.
It may seem puzzling at first that there are 4 countries in the region – Bhutan, the Islamic Republic of Iran, Malaysia and Viet Nam – where, despite the fact that 80 per cent of the population could afford the mobile broadband basket, the relative price for the bottom 40 per cent was still below the affordability threshold. This is due to the fact that consumption (or income) distribution is heavily skewed and the relative cost increases sharply for the poorest decile.
The three countries in Asia and the Pacific region where fixed broadband services are affordable for the majority of the population are China (prices relative to income are below 2 per cent for the entire population), the Islamic Republic of Iran, and Sri Lanka. At the other end of the scale, the basket price relative to adjusted income is above the 2 per cent threshold even for the top 10 per cent of consumers in the Philippines, Indonesia, Pakistan and Myanmar.

ICT price trends 2020
49
Figure 41: Affordability of broadband baskets by consumption deciles in selected economies of Asia and the Pacific region, 2020
Data-only mobile broadband basket, 1.5 GB
→ ← ← ←
Fixed broadband basket, 5 GB
→ ← ← ←
Note: Prices in terms of adjusted monthly income per capita for the average, bottom 40 per cent and highest 40 per cent consumers are shown on the left vertical axis; every green square indicates a population decile that can afford a basket (price relative to adjusted monthly income is 2 per cent or less), conversely, every grey square indicates a population decile that cannot afford a basket. *Data for Malaysia are based on income distribution. Detailed statistics are provided in Annex 3. Source: Price data from ITU and A4AI; income and consumption expenditure data from World Bank PovcalNet.

ICT price trends 2020
50
CIS
Inequality data are available for six of the nine countries in the CIS region (based on the consumption approach), accounting for 80 per cent of the region’s total population. Broadband access is affordable for at least 90 per cent of the population of Armenia, Belarus, Kazakhstan and the Russian Federation, through either fixed or mobile services. While consumers in the latter three countries generally have the option to choose services, Armenia is a special case where the fixed broadband basket is only affordable for 10 per cent of the population. Affordability is an important barrier preventing the vast majority of the population from using the Internet in Tajikistan and Kyrgyzstan. There are notable differences in the relative price of the two baskets for the two countries: for the bottom 40 per cent, mobile broadband prices amounted to 15.3 and 4.8 per cent of income in Tajikistan and Kyrgyzstan, respectively; while for fixed broadband, the respective prices were 15.3 and 14.3 per cent.
Figure 42: Affordability of broadband baskets by consumption deciles in selected CIS countries, 2020
Data-only mobile broadband basket, 1.5 GB Fixed broadband basket, 5 GB
→
←
←
←
Note: Prices in terms of adjusted monthly income per capita for the average, bottom 40 per cent and highest 40 per cent consumers are shown on the left vertical axis; every green square indicates a population decile that can afford a basket (price relative to adjusted monthly income is 2 per cent or less), conversely, every grey square indicates a population decile that cannot afford a basket. Detailed statistics are provided in Annex 3. Source: Price data from ITU and A4AI; income and consumption expenditure data from World Bank PovcalNet.
Europe
Europe is the region where both mobile and fixed broadband services are most affordable, as indicated by the widely available inequality data, based mainly on the income approach. The benchmark mobile broadband basket was affordable for the entire population in 22 of the 40 countries covered. The bottom 40 per cent could afford it in 32 of the countries. Even in places where the basket was relatively more expensive (Albania, Bulgaria, Croatia, Montenegro, North Macedonia, Serbia, Ukraine, and Turkey), it did not exceed 4 per cent of the adjusted income.
The affordability of fixed broadband connections showed more regional variation. At least 70 per cent of the population could afford it in 23 of the 40 countries, while between 10 and 30 per cent could afford it in North Macedonia, Georgia, Serbia and Moldova (in order of increasing affordability). The bottom 10 per cent of the population had to pay more than 2 per cent of their income on fixed broadband access in all of the European countries covered. There are some notable differences between the two baskets in some of the countries of the region.
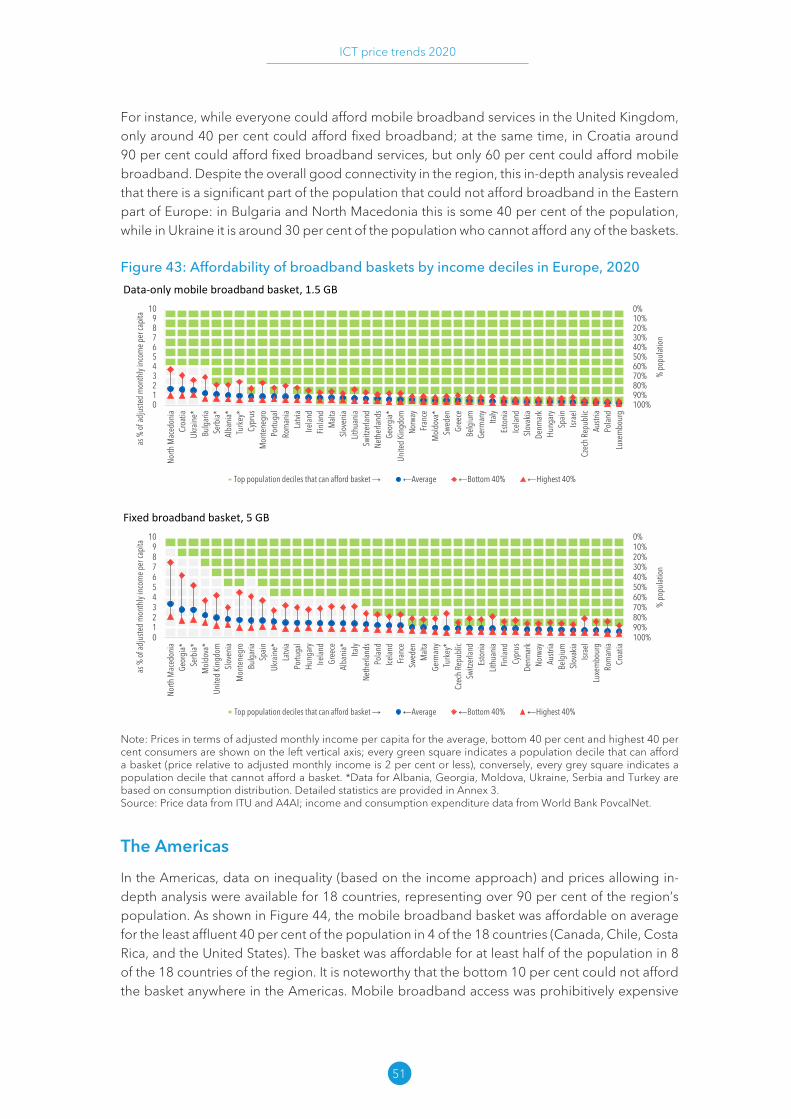
ICT price trends 2020
51
For instance, while everyone could afford mobile broadband services in the United Kingdom, only around 40 per cent could afford fixed broadband; at the same time, in Croatia around 90 per cent could afford fixed broadband services, but only 60 per cent could afford mobile broadband. Despite the overall good connectivity in the region, this in-depth analysis revealed that there is a significant part of the population that could not afford broadband in the Eastern part of Europe: in Bulgaria and North Macedonia this is some 40 per cent of the population, while in Ukraine it is around 30 per cent of the population who cannot afford any of the baskets.
Figure 43: Affordability of broadband baskets by income deciles in Europe, 2020
Data-only mobile broadband basket, 1.5 GB
→ ← ← ←
Fixed broadband basket, 5 GB
→ ← ← ←
Note: Prices in terms of adjusted monthly income per capita for the average, bottom 40 per cent and highest 40 per cent consumers are shown on the left vertical axis; every green square indicates a population decile that can afford a basket (price relative to adjusted monthly income is 2 per cent or less), conversely, every grey square indicates a population decile that cannot afford a basket. *Data for Albania, Georgia, Moldova, Ukraine, Serbia and Turkey are based on consumption distribution. Detailed statistics are provided in Annex 3. Source: Price data from ITU and A4AI; income and consumption expenditure data from World Bank PovcalNet.
The Americas
In the Americas, data on inequality (based on the income approach) and prices allowing in-depth analysis were available for 18 countries, representing over 90 per cent of the region’s population. As shown in Figure 44, the mobile broadband basket was affordable on average for the least affluent 40 per cent of the population in 4 of the 18 countries (Canada, Chile, Costa Rica, and the United States). The basket was affordable for at least half of the population in 8 of the 18 countries of the region. It is noteworthy that the bottom 10 per cent could not afford the basket anywhere in the Americas. Mobile broadband access was prohibitively expensive

ICT price trends 2020
52
in Honduras, where even the highest-earning 40 per cent faced prices amounting to 4.3 per cent of their income.
The fixed broadband basket was expensive throughout the Americas. The bottom 20 per cent of the population could not afford it anywhere in the region, and the bottom 40 per cent faced very high relative prices: between 15 and 25 per cent of adjusted monthly income per capita in 8 countries, and between 5 and 10 per cent of income in 5 others. Honduras is an extreme case, where the prices faced by the bottom 40 per cent amounted to as much as 54 per cent, and not even the top 10 per cent could afford the connection (indicating that it was de facto only accessible for selected business subscribers).
Considering the relative prices of both baskets, broadband services in 2020 were essentially unaffordable for at least 80 per cent of the population in 6 countries: the Dominican Republic, Colombia, El Salvador, Honduras, Paraguay and Saint Lucia.
Figure 44: Affordability of broadband baskets by income deciles in selected countries in the Americas, 2020Data-only mobile broadband basket, 1.5 GB Fixed broadband basket, 5 GB
Note: Prices in terms of adjusted monthly income per capita for the average, bottom 40 per cent and highest 40 per cent consumers are shown on the left vertical axis; every green square indicates a population decile that can afford a basket (price relative to adjusted monthly income is 2 per cent or less), conversely, every grey square indicates a population decile that cannot afford a basket. *For Argentina, inequality data coverage is limited to the urban population. Detailed statistics are provided in Annex 3. Source: Price data from ITU and A4AI; income and consumption expenditure data from World Bank PovcalNet.

ICT price trends 2020
53
5. The regulatory environment and ICT prices
One of the key enablers of both ICT adoption and price reduction is the maturity of the regulatory environment. Regulators, by awarding licenses, allocating and assigning spectrum, enabling interoperability and infrastructure sharing, and directing investment (among other activities), can influence market structure and competition, and incentivize innovation. ITU’s ICT Regulatory Tracker, has been monitoring the evolution of this environment based on fifty qualitative and quantitative indicators that describe:
• the regulatory authority (e.g. autonomy and accountability), • regulatory mandates (market segments and thematic areas regulated), • regulatory regimes (existing regulations in key areas), and • the competition framework (level and nature of competition in various segments).
As its regulatory environment becomes more mature, a country moves up the regulatory ladder to a higher generation of ICT regulation. Figure 45 shows the evolution of the generations of regulation globally. In 2008, nearly a third of countries were in G1 – the first and less advanced generation of regulation – while G4 countries accounted for less than 3 per cent. Progress has been remarkable since: as of 2019, a third of the countries had adopted G4 regulation and the share of G1 countries had shrunk to 8 per cent.
Figure 45: Evolution of the generation of ICT regulation, 2008-2019
Note: 2007-2010: data for 190 countries; 2011-2013: 191 countries; 2014-2017: 192 countries; 2018-2019: 193 countries. Countries are classified to generations based on their Regulatory Tracker scores. Source: ITU Global ICT Regulatory Outlook 2020.
According to recent research,26 a G4 environment was found to be particularly conducive for increasing uptake in both mobile and fixed broadband services. G5 (introduced in 2020) is the next frontier in terms of shaping an actionable, agile, collaborative, innovative, and outcome-based approach for inducing the digital transformation. G4 and G5 combined set the gold standard for digital regulation.
26 https:// www .itu .int/ dms _pub/ itu -d/ opb/ pref/ D -PREF -EF .ICT _SECT _PERF -2021 -PDF -E .pdf

ICT price trends 2020
54
Figure 46: ICT prices by generation of ICT regulation
Note: Median basket prices were computed for each of the baskets and for each regulatory generation (based on the 2019 regulatory classes), covering 171 countries (fixed broadband basket), 181 countries (data-only mobile broadband and data and voice low and high-consumption baskets) and 183 countries (mobile cellular low-usage basket) with available data.Source: ITU and A4AI.
The generation of ICT regulation matters for the level of ICT prices in a country. In 2020 the median ICT prices were highest in those countries that were associated with a G1 or G2 regulatory environment the previous year. Prices in a G3 environment were consistently lower, while countries associated with a G4 environment had the lowest prices of all, as shown in Figure 46. This finding holds across all five price baskets. For instance, the median price for the data-only mobile broadband basket with a minimum allowance of 1.5 GB cost 3.5 per cent of GNI p.c. across countries in a G1 environment, 2.7 per cent of GNI in a G2, 2.4 per cent of GNI in a G3 and merely 0.7 per cent of GNI in a G4 environment.
It is particularly remarkable from the perspective of affordability that in a G4 environment the median price for every basket, including the broadband baskets, amounted to less than 2 per cent of monthly GNI per capita. Although country prices vary considerably within each generation of ICT regulation, the medians indicate that moving up the regulatory ladder is a key ingredient for meeting the target of the Broadband Commission and making ICT services more affordable.

ICT price trends 2020
55
6. Conclusion
The COVID-19 pandemic precipitated an unprecedented increase in online activities and in data traffic. It provided a reminder that merely having connectivity may not be sufficient, unless it is associated with sufficiently high speeds and is available at an affordable price, particularly when using video connections for work or education. This report has outlined the trends and latest developments in ICT prices for nearly two hundred economies around the world, distinguish-ing between mobile cellular, mobile and fixed broadband services. Overall, all ICT services have become more affordable worldwide since 2008, while the number of subscribers to all three of the above-mentioned services has increased.27 These are promising trends. However, the dynamics below the surface warrant attention.
First, the slow-down in the decline in broadband basket prices observed over the past five years in developing countries – and LDCs in particular – continued in 2020. For many countries, following the current path will not be sufficient to achieve the Broadband Commission’s affordability target by 2025. The steadily increasing number of subscriptions in mobile broadband testifies to dynamic market growth, but fixed broadband penetration in LDCs has remained negligible, with barely one subscription per one hundred inhabitants. It is true that mobile broadband can substitute for many of the fixed broadband services and offers a means to connect larger communities at lower cost; but high-speed fixed broadband remains the preferred option for many data-intensive activities. More affordable fixed broadband access could help increase the subscriber base, which in turn could generate scale effects leading to price reduction – setting in motion a virtuous cycle to reduce the digital divide between LDCs and the rest of the world.
Second, we found that in many developing and developed countries entry-level mobile or fixed broadband baskets were affordable for the average earner, but remained beyond the means of a significant share of the population. Pursuing the goal of making broadband services affordable for all implies accounting for inequality in income and consumption patterns. It is important to assess affordability not only from the perspective of the average earner but also that of the 40 per cent of the population with the lowest income, if the digital divide not only between, but also within countries is to be closed.
Thirdly, there are notable cross-country differences in the quality of connectivity and the value consumers receive with the same baskets. Advertised median fixed broadband connection speeds were found to be about an order of magnitude higher in developed than in developing countries. Consumers in developed countries often acquire unlimited allowances when purchasing the bench-mark entry-level baskets, while those in LDCs find voice and data allowances that are close to the minimum. The entry-level plans available in higher-income markets not only cost less, but also allow more meaningful connectivity than do those in the developing world.
The COVID-19 pandemic has shown the paramount importance of connectivity. As the world continues to face the effects of the pandemic and enters the “new normal”, this role will only grow over the coming years. Affordability will remain a key barrier to connectivity, especially in lower income countries and in lower income segments of the population in countries around the world. For designing measures that address the affordability gaps, continued monitoring of the evolution of ICT prices remains as important as ever.
27 We note that the number of mobile cellular subscriptions decreased for the first time in 2020; however, this decrease is negligible compared to the long-term growth between 2008 and 2020.

ICT price trends 2020
56
Annex 1: ICT price data methodology
ICT price baskets
ICT price data are collected for five baskets, as shown in Annex Figure 1.
Annex Figure 1: Current ICT price baskets (from 2018)
These baskets were introduced in 2018, following a revision of the ICT price baskets in place up to 2017, as shown in Annex Figure 2.
Annex Figure 2: ICT price baskets up to 2017

ICT price trends 2020
57
At the 2017 meeting of the Expert Group on Telecommunication/ICT Indicators (EGTI)28, a subgroup was created to review consumption patterns and any changes that had occurred over the previous seven years and propose, if needed, new baskets for implementation. The subgroup collected evidence on the average consumption of voice, SMS and data services from a large set of economies, which resulted in two different consumption groupings (low/high) based on the countries for which evidence was available. The ICT price basket revision was approved by the 2018 meeting of EGTI. The main changes made include the following:
• Two baskets with a combination of voice and data (broadband) were introduced, with two dif-ferent usage patterns:
a. Low-consumption data-and-voice basket: 70 minutes, 20 SMSs and 500 MB.b. High-consumption data-and-voice basket: 140 minutes, 70 SMSs and 1.5 GB.
• Up to 2018, a distinction was made based on the device used for mobile broadband (comput-er-based vs. smartphone-based). As from 2018, this distinction has been eliminated.
• Based on the trends towards decreasing usage, the SMS allowance was reduced from 100 to 20 SMSs for the mobile cellular low-usage basket.
• The number of minutes included in the mobile cellular low-usage basket was increased from 50 to 70.
• The amount of data consumed for the fixed broadband basket was increased from 1 GB to 5 GB.
The mobile cellular low-usage basket
The mobile cellular basket refers to the price of a standard basket of 70 minutes and 20 SMS messages per month in predetermined on-net/off-net/fixed ratios.29 The mobile cellular basket is based on the most common contract modality (prepaid or postpaid) in the economy in question, i.e. if more than 50 per cent of subscriptions are prepaid, then prepaid is selected. Otherwise, a postpaid plan is selected.
The previous mobile cellular basket was based on the 2009 methodology of the Organisation for Economic Co-operation and Development (OECD) low-usage basket, which is the entry-level basket with the lowest number of calls included. In light of the changes in the market, at the 2017 meeting of EGTI a subgroup was created to study how to improve the baskets to better reflect the consumption patterns in the markets. The subgroup collected evidence on average consumption of voice, SMS and data services from a large set of countries. Based on this exercise, the mobile cellular basket composition was updated to a low-usage mobile cellular basket that includes 70 minutes and 20 SMSs per month, in predetermined ratios (Annex Table 1.1). The prices are collected for the largest mobile operator. The ITU mobile cellular basket does not take into account calls to voicemail or non-recurring charges, such as the one-time charge for a SIM card. The cost of a national SMS is the charge to the consumer for sending a single SMS text message. Both on-net and off-net SMS prices are taken into account. The basket considers on-net and off-net calls as well as calls to a fixed telephone.
28 EGTI was created in May 2009 with the mandate to revise the list of ITU supply-side indicators (i.e. data collected from operators), as well as to discuss outstanding methodological issues and new indicators. EGTI is open to all ITU members and experts in the field of ICT statistics and data collection. It works through an online discussion forum (http:// www .itu .int/ ITU -D/ ict/ ExpertGroup/ default .asp) and face-to-face meetings. EGTI reports to the World Telecommunication/ICT Indicators Symposium (WTIS).
29 On-net refers to a call made to the same mobile network, while off-net and fixed-line refer to calls made to other (competing) mobile networks and to a fixed-telephone line, respectively.

ICT price trends 2020
58
Annex Table 1�1: Revised mobile cellular low-usage basket, call and SMS distribution
To fixed On-net Off-net TOTAL
Call distribution (%) 7 67 26 100
Call distribution (minutes) 4.9 46.9 18.2 70
SMS 10 10 20
Source: ITU.
Another significant change to the new mobile cellular basket is the contract modality. In previous years, only prepaid prices were collected for mobile cellular prices. However, in order to reflect market reality, prices in the updated mobile cellular basket refer to the most common contract modality (prepaid/postpaid) in the economy concerned. If more than 50 per cent of mobile cellular subscriptions are postpaid, then a postpaid plan should be chosen. Otherwise a prepaid plan is selected. Data-collection rules for the low-usage mobile cellular basket can be found in Annex Box 1.1.
Annex Box 1�1: Rules applied in collecting mobile cellular price data
1. The prices of the operator with the largest market share (measured by the number of subscriptions) are used. If prices vary between different regions of the country, prices refer to those applied in the largest city (in terms of population) or in the capital city.
2. Prices should be collected in the currency they are advertised in, including taxes. If prices are not advertised in local currency, a note should be added specifying the currency.
3. Prices refer to the most common contract modality (prepaid/postpaid) in the country. If more than 50 per cent of mobile cellular subscriptions are postpaid, then a postpaid plan should be chosen. Otherwise a prepaid plan should be selected.
4. Where the operator offers different packages with a certain number of calls and/or SMS messages included, the cheapest one based on 70 voice minutes and 20 SMSs per month (i.e. with a 30-day validity) should be selected. If instead of a pay-per-use plan a package is selected for the whole basket (e.g. a bundle including 100 minutes, 50 SMSs and 100 MB) or for some of its elements (e.g. a package including 100 SMSs), this should be indicated in the notes.
5. If per-minute prices are only advertised in internal units rather than in national currency, the price of the top-up/refill charge is used to convert internal units into national currency. If there are different refill prices, then the “cheapest/smallest” refill card is used. If different refill charges exist depending on the validity period, the validity period for 30 days (or closest to 30 days) is used.
6. Prices refer to a regular (non-promotional) plan and exclude special or promotional offers, limited discounts or options such as special prices for certain numbers or restricted to new customers, or plans where calls can only be made during a limited number of (or on specific) days during the month.

ICT price trends 2020
59
7. If subscribers can choose “favourite” numbers (for family, friends, etc.) with a special price, this special price will not be taken into consideration, irrespective of how many numbers are involved.
8. Prices refer to outgoing local calls. If different rates apply for local and national calls, then the local rate is used. If different charges apply depending on the mobile operator called, the price of calls to the operator with the second largest market share (measured by the number of subscriptions) should be used, indicating in the notes the rates for calling other mobile operators. If charges apply to incoming calls, these are not taken into consideration.
9. If prices vary between minutes (1st minute = price A, 2nd minute = price B), the per-minute cost of a two-minute call should be reported (i.e. price per minute = (A+B)/2). Call set-up rates should not be included in the per-minute price, but reported under call connection charge.
10. If prices vary beyond two minutes, the average price per minute is calculated based on the actual cost of the first two minutes.
11. If there is a connection cost per call, then this is taken into consideration in the formula for the mobile cellular basket, based on 35 calls.
12. If there are different off-peak prices, then the one that is the cheapest before midnight is used. If the only off-peak period is after midnight, then this is not used. Instead, the peak price is used.
13. If there are different peak prices, the most expensive one during daytime is used. 14. If peak and off-peak SMS prices exist, the average of both is used for on-net and
off-net SMS. 15. If calls are charged by call or by hour (and not by minute), the mobile cellular
basket formula will be calculated on the basis of 35 calls or 70 minutes. Similarly, if calls are charged by call or by number of minutes for a specific network/time of day, this will be taken into account for that particular network/time of day.
16. Where monthly, recurring charges exist, they are added to the basket.
Source: ITU.
The fixed broadband basket
The fixed broadband basket refers to the price of a monthly subscription to an entry-level fixed-broadband plan. For comparability reasons, the fixed-broadband basket is based on a monthly data usage of a minimum of 5 GB. For plans that limit the monthly amount of data transferred by including data volume caps below 5 GB, the cost for the additional bytes is added to the basket. The minimum speed of a broadband connection is 256 kbit/s.
Where several offers are available, preference is given to the cheapest available connection that offers a speed of at least 256 kbit/s and 5 GB of data volume. Where providers set a limit of less than 5 GB on the amount of data that can be transferred within a month, then the price per additional byte is added to the monthly price in order to calculate the cost of 5 GB of data per month. Preference is given to the most widely used fixed (wired)-broadband technology (DSL, fibre, cable, etc.). The basket does not include the installation charges, modem prices or telephone-line rentals that may be required for a DSL service. The price represents the broadband entry plan in terms of the minimum speed of 256 kbit/s, but does not take into account special offers that are limited in time or to specific geographical areas. The plan does not necessarily represent the fastest or most cost-effective connection since the price for a

ICT price trends 2020
60
higher-speed plan is often cheaper in relative terms (i.e. in terms of the price per Mbit/s). The rules applied to collecting fixed-broadband price data may be found in Annex Box 1.2.
Annex Box 1�2: Rules applied in collecting fixed-broadband Internet price data
1. The prices of the operator with the largest market share (measured by the number of fixed-broadband subscriptions) should be used.
2. Prices should be collected in the currency they are advertised in, including taxes. If prices are not advertised in local currency, a note should be added specifying the currency.
3. Only residential, single-user prices should be collected. If prices vary between different regions of the country, prices applying to the largest city (in terms of the population) should be provided. If that information is not available, prices applying to the capital city should be reported. The selected city should be mentioned in a note under the monthly subscription indicator.
4. From all fixed-broadband plans meeting the above-mentioned criteria, the cheapest one based on a 5 GB monthly usage and an advertised download speed of at least 256 kbit/s should be selected. If there is a price distinction between residential and business tariffs, the residential tariff should be used.
5. If the plan selected has no limit on monthly data usage, the cap should be set at 0 and a note added to that indicator specifying “unlimited”.
6. Plans with limited hours of use will not be considered.7. If operators propose different commitment periods, the 12-month plan (or the
one closest to this commitment period) should be used. If the plan selected requires a longer commitment (i.e. above 12 months), this should be indicated in a note under the monthly subscription. Furthermore, if there are different prices (e.g. a discounted price for the first year and a higher price as of the 13th month), then the price after the discount period should be selected. The discounted price charged during the initial period should be indicated in a note under the monthly subscription charge. This is because the initial price paid is considered a limited/discounted price, and the other is the regular price.
8. Prices should be collected for the fixed-broadband (access) technology with the greatest number of subscriptions in the country (FTTH, DSL, cable, etc.).
9. The same price plan should be used for collecting all the data specified. For example, if a given Plan A is selected for the fixed-broadband service, according to the criteria mentioned above, the elements in Plan A apply to the monthly subscription, the excess charge, the volume of data that can be downloaded, etc.
10. Prices should be collected for regular (non-promotional) plans and should not include promotional offers or limited or restricted discounts (e.g. students only, already existing customers only, etc.).
11. With convergence, operators are increasingly providing multiple (bundled) services such as voice telephony, Internet access and TV reception over their networks. They often bundle these offers into a single subscription. This can present a challenge for price-data collection, since it may not be possible to isolate the prices for a given service.
Source: ITU.

ICT price trends 2020
61
The data-only mobile broadband price basket
The data-only mobile broadband basket is based on a monthly data usage of a minimum of 1.5 GB. For plans that limit the monthly amount of data transferred by including data volume caps below 1.5 GB, the cost for the additional bytes is added to the basket. The minimum speed of a broadband connection is 256 kbit/s. The data-only mobile broadband basket is based on the most common contract modality (prepaid or postpaid) in the economy in question, i.e. if more than 50 per cent of subscriptions are prepaid, then prepaid is selected. Otherwise, a postpaid plan is selected.
ITU has been collecting mobile broadband price data through its annual ICT Price Basket Questionnaire since 2012. The collection of mobile broadband price data from ITU Member States was agreed upon by EGTI in 2012, and revised by EGTI in 2013 in the light of the lessons learned from the first data-collection exercise. The revised methodology was then applied in the 2014 data collection. Initially, a distinction based on the device used (computer-based, handset-based) as well as the contract modality (prepaid, postpaid) was applied. This was then further updated with the 2018 revision, whereby only one data-only mobile broadband basket was kept, with at least a 1.5 GB monthly data allowance, irrespective of the device used, and prices referring to the most common contract modality (prepaid/postpaid) in the economy.
For plans that are limited in terms of validity (less than 30 days), the price of the additional days was calculated and added to the base package in order to obtain the final price. Two possibilities exist, depending on the operator, for extending a plan that is limited in terms of data allowance (or validity). The customer either (i) continues to use the service and pays an excess usage charge for additional data30, or (ii) purchases an additional (add-on) package. Thus, for some countries, prices reflect the price of the base package plus an excess-usage charge (e.g. a base package including 1 GB plus the price for 500 MB of excess usage for a monthly usage of 1.5 GB), or a multiplication of the base package price (e.g. three times the price of a 500 MB plan for a monthly usage of 1.5 GB).
The plans selected represent the least expensive offers that include the minimum monthly amount of 1.5 GB of data. The guiding principle is to base each plan on what customers could and would purchase given the data allowance and validity of each plan.
Prices for the revised data-only mobile broadband basket are collected using an updated set of rules (see Annex Box 1.3).
30 Some operators throttle speeds after the data allowance included in the base package has been used up. Customers can then pay an excess-usage charge in order to continue to have full-speed connections. In some cases, even throttled speeds are still considered to be broadband (i.e. equal to or greater than 256 kbit/s, according to ITU’s definition).

ICT price trends 2020
62
Annex Box 1�3: Rules applied in collecting mobile broadband price data
1. Prices should be collected based on 3G technologies or above, e.g. UMTS, HSDPA+/HSDPA, CDMA2000, IEEE 802.16e, LTE, LTE-Advanced and WiMAX/WirelessMAN. Prices applying to Wi-Fi or hotspots should be excluded.
2. Prices should be collected in the currency they are advertised in, including taxes. If prices are not advertised in local currency, a note should be added specifying the currency.
3. Only residential, single-user prices should be collected. If prices vary between different regions of the country, prices applying to the largest city (in terms of population) or to the capital city should be provided.
4. Prices refer to the most common contract modality (prepaid/postpaid) in the country. If more than 50 per cent of mobile broadband subscriptions are postpaid, then a postpaid plan should be chosen. Otherwise a prepaid plan should be selected.
5. Mobile broadband prices should be collected from the operator with the largest market share measured by the number of mobile broadband subscriptions. If this information is not available, mobile broadband prices should be collected from the mobile cellular operator with the largest market share (measured by the number of mobile cellular subscriptions) in the country.
6. The validity period considered for the basket is 30 days or four weeks. If a plan with a validity of 15 days is selected, it will be taken twice to cover the whole period. Likewise, if a plan with a validity of a day or a week is selected, it will be taken as many times as necessary to cover a period of four weeks. The cheapest plan on the basis of a validity period of 30 days or four weeks should be selected.
7. Price data should be collected for the cheapest plan with a data volume allowance of a minimum of 1.5 GB per month (irrespective of the device used). The selected plan should not necessarily be the one with the cap closest to 1.5 GB, but include a minimum of 1.5 GB. For example, if an operator offers a 500 MB and a 2 GB plan, the 2 GB plan or three times the 500 MB plan (if the package can be purchased thrice for a monthly capacity of 1.5 GB) could be selected for the data-only mobile broadband basket. The cheapest option should be chosen. Data volumes should refer to both upload and download data volumes. If prices are linked to “hours of use” and not to data volumes, this information should be added in a separate note. Note: ITU will most likely not be able to include these cases in a comparison.
8. Pay-as-you-go offers should be used when they are the cheapest option for a given basket or the only option available. If operators charge different pay-as-you-go rates depending on the time of day (peak/off-peak), then the average of both should be recorded. Night-time data allowances will not be considered.
9. Even if the plan is advertised as “unlimited”, the fine print should be carefully reported since most often there are limits on the data volumes (e.g. fair-usage policies), either applied by throttling (limiting the speed) or by cutting the service.
10. Data on non-recurrent fees, such as installation/set-up fees, are not collected.11. Preference should be given to the cheapest available package even if this is
bundled with other services (e.g. voice services). If the plan chosen includes other services besides mobile broadband access, these should be specified in a note. Zero-rated services (i.e. services that can be consumed besides the monthly data allowance) should be specified in a note.

ICT price trends 2020
63
12. Prices refer to a regular (non-promotional) plan and exclude promotional offers and limited discounts or special user groups (e.g. existing clients). Special prices that apply to a certain type of phone (e.g. iPhone, iPad) should be excluded. Night-time allowances are not included.
Source: ITU.
The mobile broadband data-and-voice price baskets
The low-consumption data-and-voice price basket is based on a monthly data usage of a minimum of 500 MB of data, 70 voice minutes, and 20 SMSs. The high-consumption data-and-voice price basket is based on a monthly data usage of a minimum of 1.5 GB, 140 minutes, and 70 SMSs. For plans that limit the monthly amount of data transferred by including data volume caps below 500 MB (low-consumption) or 1.5 GB (high-consumption), the cost of the additional bytes is added to the basket. The minimum speed of a broadband connection is 256 kbit/s. The data-and-voice basket is based on the most common contract modality (prepaid or postpaid) in the economy in question, i.e. if more than 50 per cent of subscriptions are prepaid, then prepaid is selected. Otherwise, a postpaid plan is selected.
Price baskets with a combination of data, voice and SMS were added by EGTI in the 2017 revision of the price baskets. To capture the prices of different data packages, covering low- and high-usage consumption patterns, data-and-voice price data are collected for two different thresholds for data, voice and SMS, based on a set of rules (see Annex Box 1.4):
a. Low-consumption data-and-voice basket: 70 minutes, 20 SMSs and 500 MB.b. High-consumption data-and-voice basket: 140 minutes, 70 SMSs and 1.5 GB.
For plans that are limited in terms of validity (less than 30 days), the price of the additional days is calculated and added to the base package in order to obtain the final price. Two possibilities exist, depending on the operator, for extending a plan that is limited in terms of data allowance (or validity). The customer either (i) continues to use the service and pays an excess usage charge for additional data,31 or (ii) purchases an additional (add-on) package. Thus, for some countries, prices reflect the price of the base package plus an excess-usage charge (e.g. a base package including 1 GB plus the price for 500 MB of excess usage for a monthly usage of 1.5 GB), or a multiplication of the base package price (e.g. twice the price of a 250 MB plan for a monthly usage of 500 MB).
The plans selected represent the least expensive offers that include the minimum amount of data for each respective data-and-voice basket. The guiding principle is to base each plan on what customers could and would purchase given the data allowance and validity of each plan.
31 Some operators throttle speeds after the data allowance included in the base package has been used up. Customers can then pay an excess-usage charge in order to continue to have full-speed connections. In some cases, even throttled speeds are still considered to be broadband (i.e. equal to or greater than 256 kbit/s, according to ITU’s definition).

ICT price trends 2020
64
Annex Box 1�4: Rules applied in collecting data-and-voice price data
1. Prices should be collected based on 3G technologies or above, e.g. UMTS, HSDPA+/HSDPA, CDMA2000, IEEE 802.16e, LTE, LTE-Advanced and WiMAX/WirelessMAN. Prices applying to Wi-Fi or hotspots should be excluded.
2. Prices should be collected in the currency they are advertised in, including taxes. If prices are not advertised in local currency, a note should be added specifying the currency.
3. Only residential, single-user prices should be collected. If prices vary between different regions of the country, prices applying to the largest city (in terms of population) or to the capital city should be provided.
4. Prices refer to the most common contract modality (prepaid/postpaid) in the country. If more than 50 per cent of mobile cellular subscriptions are postpaid, then a postpaid plan should be chosen. Otherwise a prepaid plan should be selected.
5. Prices should be collected from the operator with the largest market share measured by the number of mobile cellular subscriptions.
6. The validity period considered for the basket is 30 days or four weeks. If a plan with a validity of 15 days is selected, it will be taken twice to cover the whole period. Likewise, if a plan with a validity of a day or a week is selected, it will be taken as many times as necessary to cover a period of four weeks. The cheapest plan on the basis of a validity period of 30 days or four weeks should be selected.
7. Price data should be collected for two data-and-voice baskets separately. The cheapest plan meeting the requirements of each data-and-voice basket should be selected:
a. Low-consumption data-and-voice basket: 70 minutes, 20 SMSs and 500 MB.
b. High-consumption data-and-voice basket: 140 minutes, 70 SMSs and 1.5 GB.
The selected plan should not necessarily be the one with the data, voice and SMS allowances closest to the consumption set for each data-and-voice basket, but rather the cheapest including the minimum allowances set for each consumption profile. For example, if an operator offers a plan including 35 minutes, 10 SMSs and 250 MB, and a plan including 1 GB and unlimited domestic voice and SMS, either twice the first plan (if the package can be purchased twice per month) or the second plan could be selected for the low-consumption data-and-voice basket. The cheapest option should be chosen. Data volumes should refer to both upload and download data volumes. If prices are linked to “hours of use” and not to data volumes, this information should be added in a separate note. Note: ITU will most likely not be able to include these cases in a comparison.
8. The excess price per voice minute should be reported as the on-net price. If different peak and off-peak prices exist, an average shall be reported. If prices vary between minutes (1st minute = price A, 2nd minute = price B, call set-up rate = price C), the per-minute cost of a two-minute call should be reported (i.e. (A+B+C)/2). Call set-up rates should be included in the per-minute price of excess usage and indicated in the corresponding note. If the excess price reported corresponds to a package of minutes, the total price for the package should be reported and the number of minutes included should be specified in a note.

ICT price trends 2020
65
9. The excess price per SMS should be reported as the on-net SMS price. If different peak and off-peak prices exist, the average should be reported. If the excess price reported corresponds to a package of SMSs, the total price for the package should be reported and the number of SMSs included should be specified in a note.
10. Pay-as-you-go offers should be used when they are the cheapest option for a given data-and-voice basket or the only option available. If operators charge different pay-as-you-go rates depending on the time of day (peak/off-peak), then the average of both should be recorded. Night-time data allowances will not be considered.
11. Even if the plan is advertised as “unlimited”, the fine print should be carefully reported since most often there are limits on the data volumes (e.g. fair-usage policies), either applied by throttling (limiting the speed) or by cutting the service.
12. Data on non-recurrent fees, such as installation/set-up fees, are not collected.13. Preference should be given to the cheapest available package even if this is
bundled with other services (e.g. online TV content). If the plan chosen includes other services besides data, voice and SMS, these should be specified in a note. Zero-rated services (i.e. services that can be consumed besides the monthly allowances) should be specified in a note.
14. Prices refer to a regular (non-promotional) plan and exclude promotional offers and limited discounts or special user groups (e.g. existing clients). Special prices that apply to a certain type of phone (e.g. iPhone, iPad) should be excluded. Night-time allowances are not included.
Source: ITU.
Price-data collection and sources
Up to 2018, price data were collected in the fourth quarter of the year. In 2019, price data were col-lected in the first quarter of the year, in 2020, in the second quarter. Up to 2017, data were collected through the ITU ICT Price Basket Questionnaire, with the exception of data on mobile broadband prices, which were collected directly from operator websites. From 2018 onwards, all data were collected through the ITU ICT Price Basket Questionnaire, which was sent to the administrations and statistics contacts of 220 economies in October 2018 for 2018 and in April 2019 for 2019 data. Through the questionnaire, contacts were requested to provide data for fixed broadband prices; mobile cellular low-usage prices; data-only mobile broadband prices; and voice-and-data-prices (low and high consumption). For those economies that did not reply to the ITU ICT Price Basket Questionnaire, price data were collected directly from operator websites and/or through direct correspondence with the operator. Price data were collected from the operator with the largest market share, as measured by the number of subscriptions. If it was not clear which Internet service provider (ISP) had the dominant market share, preference was given to the (former) incumbent tele-communication operator. In some cases, especially where prices were not clearly advertised or were indicated only in the local language, and where operators did not respond to queries, alternative operators were chosen. All prices were converted into United States dollars using IMF’s average annual rate of exchange for 202032, and into PPP$ using World Bank conversion factors for 2019 (as published in October 2020). Prices are also presented as a percentage of countries’ monthly GNI p.c. using GNI p.c. values from the World Bank for 2019 (as published in October 2020). Price data for 2008 to 2018, which are also shown and used in this publication, were collected in previous years (always during the second half of the respective year), in national currencies, and converted using the same sources.
32 For economies where IMF’s average annual rate of exchange was not available, the average UN Operational exchange rate for the second and third quarter was used when available.

ICT price trends 2020
66
Annex 2: Detailed ICT price tables, 2020
This annex contains detailed tables on basket prices and allowances. Additional metadata and an application to browse the results are available online on the ITU ICT Price statistics website.
Annex Table A2�1: Data-only mobile broadband basket details, 2020
Data-only mobile-broadband basket (1.5GB)
Rank Economy as % of GNI p.c.
USD PPP$ Monthly data allowance
(in GB)
Tax rate
1 Liechtenstein 0.16 25.48 .. 20 7.7
Macao, China 0.16 11.02 14.73 2 0.0
3 Luxembourg 0.18 11.33 10.46 2 17.0
4 Hong Kong, China 0.21 9.03 11.10 3 0.0
Poland 0.21 2.53 5.31 10 23.0
6 Austria 0.27 11.34 12.15 8 20.0
7 Brunei Darussalam 0.28 7.18 14.88 2 0.0
Sri Lanka 0.28 0.82 2.74 1.6 10.2
9 Czech Republic 0.30 5.29 8.96 1.5 21.0
10 Faroe Islands 0.31 14.30 .. 2 25.0
Israel 0.31 11.51 9.59 30 17.0
Qatar 0.31 16.48 21.72 3.5 0.0
Spain 0.31 7.88 9.87 3 21.0
14 Hungary 0.34 4.15 8.33 2 5.0
15 Denmark 0.35 18.10 15.48 15 25.0
Slovakia 0.35 5.67 8.46 2 20.0
17 Kazakhstan 0.36 2.37 7.39 3 12.0
18 Iceland 0.37 18.64 16.84 2 24.0
New Zealand 0.37 12.13 12.06 1.5 15.0
Singapore 0.37 17.94 23.89 20 7.0
21 Estonia 0.38 7.36 10.46 1.5 20.0
22 Italy 0.40 11.33 13.34 20 22.0
Korea (Rep. of) 0.40 10.27 12.76 10 10.0
United States 0.40 21.78 21.78 2 8.9
25 Germany 0.42 17.00 19.27 4 19.0
26 Belgium 0.44 17.01 17.94 2 21.0
27 Greece 0.47 7.83 10.94 2.5 24.0
28 Moldova 0.48 1.74 4.54 3 20.0
Sweden 0.48 21.45 21.38 30 25.0

ICT price trends 2020
67
Data-only mobile-broadband basket (1.5GB)
Rank Economy as % of GNI p.c.
USD PPP$ Monthly data allowance
(in GB)
Tax rate
30 France 0.49 17.00 18.02 10 20.0
31 China 0.51 4.28 7.18 3 0.0
Kuwait 0.51 16.27 27.37 5 0.0
Pakistan 0.51 0.48 2.16 2 32.0
34 Norway 0.52 31.23 27.86 8 25.0
35 Bahamas 0.55 14.55 13.13 2 12.0
United Kingdom 0.55 18.99 19.34 5 20.0
37 Georgia 0.56 1.92 6.29 1.5 18.0
38 Netherlands 0.64 28.35 29.46 10 21.0
39 Switzerland 0.65 47.78 34.27 2 7.7
40 Canada 0.67 24.95 26.04 2 13.0
Mauritius 0.67 6.15 13.75 1.7 15.0
42 Costa Rica 0.71 6.88 10.72 2 13.0
Lithuania 0.71 11.23 19.54 30 21.0
44 Chile 0.72 7.48 12.27 6 0.0
Saudi Arabia 0.72 14.00 31.67 2 5.0
46 Belarus 0.74 3.38 12.76 2 25.0
Cayman Islands 0.74 30.00 21.55 2 0.0
Slovenia 0.74 15.87 21.80 5 22.0
49 Malta 0.75 17.01 23.58 3 18.0
50 Finland 0.77 31.64 30.22 Unlimited 24.0
51 Algeria 0.78 2.34 7.70 3 19.0
Ireland 0.78 39.70 35.93 Unlimited 23.0
53 Morocco 0.79 2.08 4.76 1.6 20.0
United Arab Emirates 0.79 28.59 38.22 1.5 5.0
55 Australia 0.81 34.21 32.76 30 10.0
56 Latvia 0.84 12.46 19.19 1.5 21.0
57 Romania 0.86 9.07 20.41 10 19.0
58 Iran (Islamic Republic of) 0.88 3.31 6.30 2 9.0
59 Montenegro 0.89 6.69 14.18 2 21.0
Portugal 0.89 17.00 23.40 5 23.0
61 Cyprus 0.90 20.41 27.41 1.5 19.0
62 Malaysia 0.91 8.21 20.81 Unlimited 0.0
Russian Federation 0.91 7.54 20.42 10 20.0
64 Bhutan 0.93 2.08 7.53 1.7 0.0
65 Turkey 0.95 5.68 18.28 10 25.5
66 Armenia 0.96 3.71 10.79 3 20.0
Annex Table A2�1: Data-only mobile broadband basket details, 2020 (continued)

ICT price trends 2020
68
Data-only mobile-broadband basket (1.5GB)
Rank Economy as % of GNI p.c.
USD PPP$ Monthly data allowance
(in GB)
Tax rate
67 Egypt 1.01 2.71 11.27 1.8 43.0
68 Oman 1.02 13.00 24.40 2 0.0
69 Albania 1.03 4.56 9.81 3 20.0
Uruguay 1.03 10.78 16.74 3 0.0
71 Myanmar 1.04 1.30 4.14 1.6 5.0
Viet Nam 1.04 2.15 6.28 3.5 10.0
73 Botswana 1.05 5.86 13.54 2 12.0
74 Argentina 1.06 5.82 19.19 4 26.3
75 Serbia 1.14 6.74 14.37 5 20.0
76 Japan 1.16 40.97 39.69 3 10.0
77 Thailand 1.18 7.24 17.66 1.5 7.0
78 Aruba 1.20 27.37 31.95 4 0.0
79 Azerbaijan 1.23 4.71 16.33 1.5 18.0
Bulgaria 1.23 9.85 22.56 3 20.0
81 Tunisia 1.28 3.53 12.27 2.5 19.0
82 Mexico 1.30 8.80 18.80 3.5 16.0
83 Bosnia and Herzegovina 1.33 6.78 14.99 2 17.0
Indonesia 1.33 4.24 12.14 5 10.0
85 Philippines 1.36 4.53 11.22 1.5 12.0
86 Brazil 1.43 7.43 16.67 3 40.2
87 Bahrain 1.51 27.93 51.62 40 5.0
Peru 1.51 8.23 14.90 2.8 0.0
89 Ukraine 1.54 4.59 15.55 2.9 20.0
90 Croatia 1.60 19.36 33.52 7 25.0
91 Cambodia 1.62 2.00 5.51 1.5 10.0
India 1.62 2.65 9.44 Unlimited 18.0
93 North Macedonia 1.68 8.24 20.11 3 18.0
94 Iraq 1.71 8.46 18.38 2 0.0
Nigeria 1.71 2.70 7.45 1.5 7.5
96 Gabon 1.72 10.37 18.27 1.6 18.0
97 Palau 1.74 25.00 28.20 10 0.0
98 Panama 1.75 21.40 43.76 Unlimited 7.0
99 Libya 1.76 11.38 22.35 2 0.0
100 Maldives 1.83 14.95 24.47 2.5 6.0
101 Barbados 1.88 27.50 22.42 5 21.0
102 Bangladesh 1.90 3.04 8.18 1.5 31.0
103 Nauru 1.92 21.21 23.55 1.8 15.0
Annex Table A2�1: Data-only mobile broadband basket details, 2020 (continued)

ICT price trends 2020
69
Data-only mobile-broadband basket (1.5GB)
Rank Economy as % of GNI p.c.
USD PPP$ Monthly data allowance
(in GB)
Tax rate
104 Mongolia 1.95 5.85 17.19 5 10.0
105 Curacao 2.01 33.16 39.66 2.9 6.0
106 Ghana 2.03 3.41 9.82 1.5 26.5
Seychelles 2.03 22.19 43.67 2 15.0
108 Puerto Rico 2.13 39.03 39.55 2 11.5
109 Ecuador 2.21 11.20 20.32 2 12.0
110 Uzbekistan 2.32 2.95 13.47 1.5 20.0
111 Palestine* 2.33 7.21 10.66 3 16.0
Trinidad and Tobago 2.33 33.17 53.91 7 12.5
113 Suriname 2.34 11.39 28.34 4 8.0
114 Colombia 2.35 10.55 27.12 1.8 19.0
115 Lao P.D.R. 2.37 4.90 13.89 5.9 10.0
Saint Kitts and Nevis 2.37 37.04 40.64 10 0.0
117 Tonga 2.47 8.68 11.53 7 15.0
118 Bolivia (Plurinational State of)
2.49 7.24 19.17 2 16.0
119 South Africa 2.53 10.21 26.05 1.5 15.0
120 Namibia 2.54 8.45 20.57 4 15.0
121 Nepal (Republic of) 2.55 2.16 8.09 2 26.0
122 Antigua and Barbuda 2.65 37.04 41.01 7 0.0
123 Fiji 2.72 12.82 27.92 12 9.0
124 Cabo Verde 2.76 8.22 17.12 2 15.0
Senegal 2.76 3.28 8.13 2 23.0
126 Kyrgyzstan 2.83 2.58 10.49 4.1 17.0
127 Jamaica 2.85 11.84 23.37 5 25.0
128 Paraguay 2.95 11.81 30.75 3 10.0
129 El Salvador 3.00 10.00 20.02 5 0.0
130 Cuba 3.02 20.00 .. 2.5 0.0
131 Dominican Rep. 3.08 18.20 42.18 3 30.0
132 Angola 3.24 4.65 18.66 2.7 10.0
133 Saint Lucia 3.25 29.59 38.62 10 0.0
134 Kenya 3.31 4.66 11.75 2 29.0
135 Grenada 3.40 28.15 42.92 4 0.0
Guatemala 3.40 12.84 21.80 8 12.0
137 Haiti 3.42 1.69 4.52 1.6 10.0
138 Lebanon 3.46 21.90 41.37 1.8 10.0
139 Jordan 3.54 12.68 27.09 45 16.0
140 Turkmenistan 3.60 20.00 42.57 1.5 15.0
Annex Table A2�1: Data-only mobile broadband basket details, 2020 (continued)

ICT price trends 2020
70
Data-only mobile-broadband basket (1.5GB)
Rank Economy as % of GNI p.c.
USD PPP$ Monthly data allowance
(in GB)
Tax rate
141 Zambia 3.65 2.67 10.52 1.5 33.5
142 Cameroon 3.90 4.84 11.90 2.7 19.3
143 Mauritania 3.95 5.35 15.90 2 18.0
144 Guyana 4.08 18.23 33.15 3.5 14.0
145 Benin 4.24 4.32 11.89 1.5 18.0
146 Samoa 4.44 14.91 21.42 16 15.0
Timor-Leste 4.44 7.00 16.51 2.7 5.0
148 Sudan 4.46 1.75 7.56 1.5 30.0
149 Côte d'Ivoire 4.62 8.64 21.26 2.5 18.0
Dominica 4.62 31.48 45.96 20 0.0
151 Mali 4.72 3.46 10.30 1.5 18.0
152 Belize 4.80 17.50 24.68 5.5 12.5
153 Vanuatu 5.10 12.93 12.68 1.5 15.0
154 Kiribati 5.14 13.69 19.53 2.7 0.0
155 Eswatini 5.33 12.63 34.88 2 14.0
156 Nicaragua 5.44 8.18 22.91 6 15.0
157 Saint Vincent and the Grenadines
5.70 35.19 52.64 10 16.0
158 Djibouti 5.71 16.88 28.87 20 10.0
159 Sao Tome and Principe 6.11 9.88 19.42 3 15.0
160 Lesotho 6.29 5.74 18.05 3.4 9.0
161 Guinea 6.51 5.29 13.50 3 18.0
162 Tanzania 6.75 6.17 18.28 4 18.0
163 Rwanda 6.88 4.26 13.79 2 18.0
164 Tajikistan 7.45 5.85 21.88 2 23.0
165 Comoros 7.81 9.22 18.66 2 0.0
166 Mozambique 7.99 2.86 8.88 1.6 17.0
167 Congo (Rep. of the) 8.00 12.10 24.69 1.5 16.0
168 Honduras 8.23 16.20 35.34 20 15.0
169 Liberia 8.28 4.00 7.79 1.6 15.0
170 Gambia 8.37 5.02 15.66 1.5 21.3
171 Uganda 8.49 5.36 16.18 3 18.0
172 Ethiopia 9.52 5.57 17.69 2 15.0
173 Yemen 10.06 15.98 44.27 4 5.0
174 Micronesia 10.59 30.00 28.73 2 0.0
175 Papua New Guinea 10.69 24.26 29.90 1.8 10.0
176 Afghanistan 10.79 4.65 20.78 2 0.0
177 Burkina Faso 10.86 6.91 21.17 2 18.0
Annex Table A2�1: Data-only mobile broadband basket details, 2020 (continued)

ICT price trends 2020
71
Data-only mobile-broadband basket (1.5GB)
Rank Economy as % of GNI p.c.
USD PPP$ Monthly data allowance
(in GB)
Tax rate
178 Solomon Islands 11.97 19.95 21.21 2.2 10.0
179 Burundi 14.90 3.15 9.91 2 2.0
180 Niger 15.00 6.91 16.95 2 22.6
181 Togo 15.10 8.64 20.81 1.7 18.0
182 Sierra Leone 15.60 5.63 20.23 2 15.0
183 Madagascar 16.41 6.56 23.61 2 20.0
184 Chad 17.59 10.37 25.50 1.5 18.0
185 Malawi 20.02 6.70 17.53 2 26.5
186 Central African Rep. 24.44 10.37 20.13 1.8 19.0
187 Guinea-Bissau 24.65 15.56 43.78 1.5 19.0
188 Dem. Rep. of the Congo 32.31 14.00 34.20 1.8 26.0
Monaco** .. 45.35 .. 20 20.0
Anguilla** .. 44.44 .. 10 7.0
San Marino** .. 17.01 .. 10 0.0
Somalia** .. 4.00 .. 6 10.0
Greenland** .. 53.10 .. 3 0.0
Falkland (Malvinas) Is.** .. 63.30 .. 2 0.0
Gibraltar** .. 22.79 .. 2 0.0
British Virgin Islands** .. 20.00 18.25 2 0.0
Taiwan, Province of China** .. 10.07 .. 1.7 5.0
Andorra** .. 28.46 .. 1.5 4.5
Zimbabwe** .. 11.22 .. 1.5 25.0
Note: * Palestine is not an ITU Member State; the status of Palestine in ITU is the subject of Resolution 99 (Rev. Dubai, 2018) of the ITU Plenipotentiary Conference. Data not available indicated as: .. ** Economy not ranked because no recent (2017 or later) data on GNI p.c. were available. Gross National Income (GNI) per capita data and PPP conversion factors are from the World Bank World Development Indicators, 2019 (or last available year). GNI per capita current LCU was used for all cases, unless when prices were registered in USD. In those cases the Atlas method (current US$) was used instead. Where private consumption PPP ratios were unavailable in recent years (since 2017), estimations are used based on applying change index of PPP ratios for GDP if available on last available PPP ratio for private consumption. The reference exchange rates are based on 2020 Q2-Q3 average (extracted 20.11.2020) from the IMF (Exchange Rates, Domestic Currency per US Dollar, Period Average, Rate - ENDA_XDC_USD_RATE) and UN OPS (Operational rates of exchange - monthly).Source: ITU and A4AI. GNI p.c. and PPP conversion factors are from the World Bank. USD exchange rates are from the IMF or the UN.
Annex Table A2�1: Data-only mobile broadband basket details, 2020 (continued)
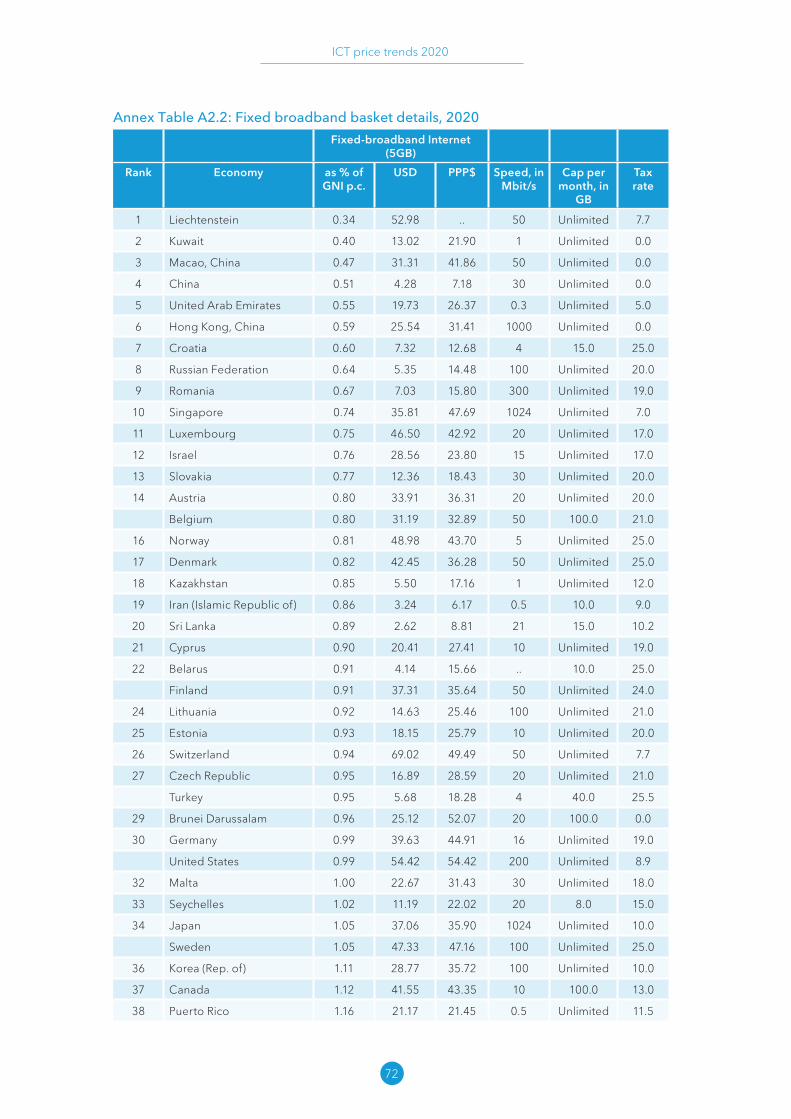
ICT price trends 2020
72
Annex Table A2�2: Fixed broadband basket details, 2020
Fixed-broadband Internet (5GB)
Rank Economy as % of GNI p.c.
USD PPP$ Speed, in Mbit/s
Cap per month, in
GB
Tax rate
1 Liechtenstein 0.34 52.98 .. 50 Unlimited 7.7
2 Kuwait 0.40 13.02 21.90 1 Unlimited 0.0
3 Macao, China 0.47 31.31 41.86 50 Unlimited 0.0
4 China 0.51 4.28 7.18 30 Unlimited 0.0
5 United Arab Emirates 0.55 19.73 26.37 0.3 Unlimited 5.0
6 Hong Kong, China 0.59 25.54 31.41 1000 Unlimited 0.0
7 Croatia 0.60 7.32 12.68 4 15.0 25.0
8 Russian Federation 0.64 5.35 14.48 100 Unlimited 20.0
9 Romania 0.67 7.03 15.80 300 Unlimited 19.0
10 Singapore 0.74 35.81 47.69 1024 Unlimited 7.0
11 Luxembourg 0.75 46.50 42.92 20 Unlimited 17.0
12 Israel 0.76 28.56 23.80 15 Unlimited 17.0
13 Slovakia 0.77 12.36 18.43 30 Unlimited 20.0
14 Austria 0.80 33.91 36.31 20 Unlimited 20.0
Belgium 0.80 31.19 32.89 50 100.0 21.0
16 Norway 0.81 48.98 43.70 5 Unlimited 25.0
17 Denmark 0.82 42.45 36.28 50 Unlimited 25.0
18 Kazakhstan 0.85 5.50 17.16 1 Unlimited 12.0
19 Iran (Islamic Republic of) 0.86 3.24 6.17 0.5 10.0 9.0
20 Sri Lanka 0.89 2.62 8.81 21 15.0 10.2
21 Cyprus 0.90 20.41 27.41 10 Unlimited 19.0
22 Belarus 0.91 4.14 15.66 .. 10.0 25.0
Finland 0.91 37.31 35.64 50 Unlimited 24.0
24 Lithuania 0.92 14.63 25.46 100 Unlimited 21.0
25 Estonia 0.93 18.15 25.79 10 Unlimited 20.0
26 Switzerland 0.94 69.02 49.49 50 Unlimited 7.7
27 Czech Republic 0.95 16.89 28.59 20 Unlimited 21.0
Turkey 0.95 5.68 18.28 4 40.0 25.5
29 Brunei Darussalam 0.96 25.12 52.07 20 100.0 0.0
30 Germany 0.99 39.63 44.91 16 Unlimited 19.0
United States 0.99 54.42 54.42 200 Unlimited 8.9
32 Malta 1.00 22.67 31.43 30 Unlimited 18.0
33 Seychelles 1.02 11.19 22.02 20 8.0 15.0
34 Japan 1.05 37.06 35.90 1024 Unlimited 10.0
Sweden 1.05 47.33 47.16 100 Unlimited 25.0
36 Korea (Rep. of) 1.11 28.77 35.72 100 Unlimited 10.0
37 Canada 1.12 41.55 43.35 10 100.0 13.0
38 Puerto Rico 1.16 21.17 21.45 0.5 Unlimited 11.5

ICT price trends 2020
73
Fixed-broadband Internet (5GB)
Rank Economy as % of GNI p.c.
USD PPP$ Speed, in Mbit/s
Cap per month, in
GB
Tax rate
39 France 1.20 41.95 44.48 15 Unlimited 20.0
40 Australia 1.21 51.32 49.15 20 500.0 10.0
41 Iceland 1.22 60.87 54.99 50 50.0 24.0
42 New Zealand 1.26 41.51 41.26 50 60.0 15.0
Poland 1.26 15.19 31.91 300 Unlimited 23.0
44 Bahamas 1.32 34.71 31.32 8 Unlimited 12.0
45 Netherlands 1.35 60.11 62.45 50 Unlimited 21.0
46 Mauritius 1.37 12.47 27.89 10 30.0 15.0
47 Italy 1.40 39.58 46.62 200 Unlimited 22.0
48 Albania 1.44 6.38 13.73 1 Unlimited 20.0
49 Greece 1.45 23.89 33.39 30 Unlimited 30.2
50 Ireland 1.46 74.84 67.75 150 Unlimited 23.0
51 Hungary 1.48 18.33 36.80 150 Unlimited 5.0
Trinidad and Tobago 1.48 21.04 34.19 5 Unlimited 12.5
53 Latvia 1.49 22.12 34.06 200 Unlimited 21.0
Portugal 1.49 28.34 39.02 30 Unlimited 23.0
55 Azerbaijan 1.54 5.88 20.41 1 Unlimited 18.0
56 Ukraine 1.60 4.77 16.17 20 Unlimited 20.0
57 Qatar 1.72 90.66 119.47 50 Unlimited 0.0
Spain 1.72 43.10 53.96 300 Unlimited 21.0
59 Bulgaria 1.73 13.80 31.60 50 Unlimited 20.0
60 Costa Rica 1.75 17.02 26.52 1 Unlimited 13.0
61 Montenegro 1.77 13.22 28.02 2 Unlimited 21.0
62 Faroe Islands 1.80 82.84 .. 20 Unlimited 25.0
63 Bahrain 1.82 33.51 61.95 10 200.0 5.0
64 Slovenia 1.85 39.70 54.54 100 Unlimited 22.0
65 Mongolia 1.88 5.63 16.56 1 200.0 10.0
66 Nepal (Republic of) 1.96 1.66 6.22 5 15.0 13.0
67 United Kingdom 1.99 68.46 69.73 10 Unlimited 20.0
68 Tonga 2.13 7.49 9.95 .. 5.0 15.0
69 Libya 2.19 14.22 27.94 2 20.0 0.0
Malaysia 2.19 19.64 49.80 30 60.0 6.0
71 Bosnia and Herzegovina 2.25 11.53 25.49 5 Unlimited 17.0
Moldova 2.25 8.10 21.18 150 Unlimited 20.0
73 Mexico 2.27 15.35 32.81 20 Unlimited 16.0
74 Uzbekistan 2.33 2.96 13.51 2 5.8 20.0
75 Cayman Islands 2.46 99.59 71.53 10 Unlimited 0.0
Annex Table A2�2: Fixed broadband basket details, 2020 (continued)

ICT price trends 2020
74
Fixed-broadband Internet (5GB)
Rank Economy as % of GNI p.c.
USD PPP$ Speed, in Mbit/s
Cap per month, in
GB
Tax rate
76 Brazil 2.51 13.00 29.17 10 Unlimited 40.2
Chile 2.51 26.18 42.91 200 Unlimited 19.0
78 Bangladesh 2.57 4.12 11.10 2 Unlimited 15.0
79 Cabo Verde 2.59 7.70 16.03 12 10000.0 15.0
80 Uruguay 2.65 27.65 42.91 3 350.0 22.0
81 Aruba 2.66 60.72 70.87 150 Unlimited 3.5
82 Lebanon 2.71 17.54 33.13 4 40.0 10.0
83 Saint Kitts and Nevis 2.74 42.90 47.07 6 Unlimited 17.0
84 Serbia 2.77 16.38 34.94 20 Unlimited 20.0
85 Georgia 2.79 9.62 31.45 20 Unlimited 18.0
86 Curacao 2.88 47.47 56.77 8 Unlimited 6.0
Saudi Arabia 2.88 56.00 126.68 25 Unlimited 5.0
88 Dominican Rep. 2.89 17.06 39.54 4 Unlimited 30.0
89 Maldives 2.96 24.11 39.48 5 30.0 6.0
90 Bhutan 2.97 6.64 24.09 2 13.5 0.0
Tunisia 2.97 8.20 28.47 4 Unlimited 7.0
92 Antigua and Barbuda 3.05 42.59 47.16 10 Unlimited 0.0
93 Oman 3.07 39.01 73.19 4 20.0 0.0
94 Barbados 3.08 45.00 36.69 60 Unlimited 0.0
95 India 3.17 5.18 18.48 6 60.0 18.0
96 Armenia 3.19 12.37 35.96 18 Unlimited 20.0
97 Egypt 3.22 8.65 36.00 30 140.0 14.0
98 Thailand 3.29 20.26 49.43 200 Unlimited 7.0
99 North Macedonia 3.35 16.51 40.26 20 250.0 18.0
100 Peru 3.56 19.36 35.08 15 Unlimited 0.0
101 Fiji 3.79 17.88 38.95 20 150.0 9.0
102 Viet Nam 3.92 8.13 23.72 30 Unlimited 10.0
103 Morocco 3.93 10.30 23.57 4 Unlimited 20.0
104 Yemen 3.96 6.29 17.43 1 16.0 5.0
105 Saint Lucia 4.07 37.04 48.33 25 Unlimited 12.5
106 Colombia 4.16 18.70 48.07 30 Unlimited 0.0
107 Palau 4.17 60.00 67.67 10 Unlimited 0.0
108 Algeria 4.18 12.46 41.08 2 Unlimited 0.0
109 Botswana 4.40 24.63 56.93 1 Unlimited 12.0
110 Panama 4.49 55.00 112.46 60 Unlimited 0.0
111 Ecuador 4.62 23.41 42.48 5 Unlimited 12.0
112 South Africa 4.69 18.88 48.15 4 Unlimited 15.0
Annex Table A2�2: Fixed broadband basket details, 2020 (continued)

ICT price trends 2020
75
Fixed-broadband Internet (5GB)
Rank Economy as % of GNI p.c.
USD PPP$ Speed, in Mbit/s
Cap per month, in
GB
Tax rate
113 Paraguay 4.98 19.93 51.88 20 Unlimited 10.0
114 Dominica 5.17 35.19 51.36 15 Unlimited 15.0
115 Djibouti 5.24 15.47 26.47 1 30.0 10.0
116 Grenada 5.37 44.44 67.77 50 Unlimited 0.0
117 Jamaica 5.69 23.63 46.63 1 Unlimited 15.0
118 Suriname 5.96 29.03 72.22 10 Unlimited 8.0
119 Lesotho 6.23 5.68 17.87 256 5.0 9.0
120 Cuba 6.79 45.00 .. 0.5 Unlimited 0.0
121 Argentina 6.96 38.15 125.72 50 250.0 21.0
122 Micronesia 7.06 20.00 19.15 0.5 Unlimited 0.0
123 Guyana 7.09 31.65 57.57 1.5 Unlimited 14.0
124 Gabon 7.17 43.21 76.12 10 Unlimited 18.0
125 Saint Vincent and the Grenadines
7.20 44.44 66.49 50 Unlimited 16.0
126 Palestine* 7.44 23.08 34.13 4 200.0 16.0
127 Tajikistan 7.45 5.85 21.88 4 30.0 18.0
128 Guatemala 7.52 28.40 48.21 10 Unlimited 12.0
129 Bolivia (Plurinational State of)
7.68 22.29 59.04 10 Unlimited 13.0
130 Turkmenistan 7.71 42.86 91.23 0.3 Unlimited 15.0
131 Philippines 7.85 26.14 64.80 10 Unlimited 12.0
132 Kyrgyzstan 8.20 7.46 30.36 2 Unlimited 12.0
133 Lao P.D.R. 8.31 17.16 48.61 3 Unlimited 10.0
134 El Salvador 8.40 28.00 56.05 10 Unlimited 0.0
135 Angola 8.60 12.34 49.48 1 30.0 10.0
Namibia 8.60 28.63 69.75 2 Unlimited 0.0
137 Belize 9.47 34.50 48.66 10 Unlimited 12.5
138 Indonesia 10.93 34.81 99.64 10 Unlimited 10.0
139 Pakistan 11.22 10.59 47.24 6 Unlimited 32.0
140 Myanmar 11.55 14.50 46.01 1 Unlimited 5.0
141 Jordan 12.08 43.30 92.54 24 Unlimited 16.0
142 Samoa 12.11 40.62 58.36 .. 25.0 15.0
143 Cambodia 12.16 15.00 41.34 4 Unlimited 10.0
144 Marshall Islands 12.33 49.95 45.53 0.3 Unlimited 0.0
145 Guinea 12.50 10.15 25.91 .. 5.0 18.0
146 Papua New Guinea 12.73 28.88 35.59 24 20.0 10.0
147 Ghana 12.81 21.47 61.86 12 45.0 26.5
148 Honduras 14.06 28.00 61.08 10 Unlimited 15.0
Annex Table A2�2: Fixed broadband basket details, 2020 (continued)

ICT price trends 2020
76
Fixed-broadband Internet (5GB)
Rank Economy as % of GNI p.c.
USD PPP$ Speed, in Mbit/s
Cap per month, in
GB
Tax rate
149 Afghanistan 15.15 6.53 29.18 0.3 Unlimited 0.0
150 Eswatini 15.20 35.98 99.40 0.3 6.0 14.0
151 Kenya 16.23 22.91 57.72 5 Unlimited 29.0
152 Congo (Rep. of the) 17.15 25.93 52.92 2 Unlimited 16.0
153 Equatorial Guinea 17.50 90.74 .. 0.5 Unlimited 0.0
154 Côte d'Ivoire 17.56 32.84 80.79 1 Unlimited 18.0
155 Zambia 18.26 13.33 52.61 2 10.0 33.5
156 Sao Tome and Principe 18.60 30.08 59.16 1 12.0 15.0
157 Senegal 18.75 22.30 55.17 2 Unlimited 23.0
158 Cameroon 20.78 25.75 63.35 1 Unlimited 19.3
159 Tanzania 21.46 19.61 58.08 1 8.0 32.5
160 Nigeria 22.08 34.83 96.12 8 Unlimited 7.5
161 Mauritania 23.28 31.56 93.81 2 Unlimited 18.0
162 Mali 23.37 17.11 51.00 2 Unlimited 18.0
163 Ethiopia 25.01 14.63 46.45 1 Unlimited 15.0
164 Benin 25.45 25.94 71.34 0.5 Unlimited 18.0
165 Nicaragua 27.01 42.99 120.33 20 Unlimited 15.0
166 Comoros 29.28 34.58 69.99 0.5 Unlimited 0.0
167 Vanuatu 30.09 76.27 74.75 1 Unlimited 15.0
168 Timor-Leste 31.11 49.00 115.59 7 37.5 5.0
169 Burkina Faso 33.94 21.60 66.16 2 Unlimited 18.0
170 Mozambique 35.97 12.88 39.97 2 Unlimited 17.0
171 Togo 37.75 21.60 52.03 2 Unlimited 18.0
172 Rwanda 48.14 29.79 96.50 5 Unlimited 18.0
173 Solomon Islands 54.39 90.70 96.43 10 10.0 10.0
174 Guinea-Bissau 69.07 43.58 122.67 0.3 Unlimited 19.0
175 Haiti 83.54 55.00 147.35 2 Unlimited 10.0
176 Malawi 108.10 36.20 94.67 5 20.0 26.5
177 Niger 111.54 51.42 126.06 0.3 Unlimited 19.0
178 Madagascar 163.41 65.35 235.16 100 Unlimited 20.0
Andorra** .. 28.35 .. 1 Unlimited 4.5
Anguilla** .. 55.19 .. 10 Unlimited 0.0
British Virgin Islands** .. 99.00 90.33 50 Unlimited 0.0
Falkland (Malvinas) Is.** .. 46.84 .. 2.7 12.7 0.0
Gibraltar** .. 35.45 .. 75 Unlimited 0.0
Greenland** .. 75.92 .. 5 Unlimited 0.0
Monaco** .. 45.35 .. 100 Unlimited 20.0
Annex Table A2�2: Fixed broadband basket details, 2020 (continued)

ICT price trends 2020
77
Fixed-broadband Internet (5GB)
Rank Economy as % of GNI p.c.
USD PPP$ Speed, in Mbit/s
Cap per month, in
GB
Tax rate
San Marino** .. 33.91 .. 200 Unlimited 0.0
Somalia** .. 10.00 0.5 6.0 10.0
Taiwan, Province of China** .. 10.54 .. 16 Unlimited 5.0
Zimbabwe** .. 9.54 .. 2 10.0 25.0
"Note: * Palestine is not an ITU Member State; the status of Palestine in ITU is the subject of Resolution 99 (Rev. Dubai, 2018) of the ITU Plenipotentiary Conference. Data not available indicated as: ..**Economy not ranked because no recent (2017 or later) data on GNI p.c. were available. Gross National Income (GNI) per capita data and PPP conversion factors are from the World Bank World Development Indicators, 2019 (or last available year). GNI per capita current LCU was used for all cases, unless when prices were registered in USD. In those cases the Atlas method (current US$) was used instead. Where private consumption PPP ratios were unavailable in recent years (since 2017), estimations are used based on applying change index of PPP ratios for GDP if available on last available PPP ratio for private consumption. The reference exchange rates are based on 2020 Q2-Q3 average (extracted 20 Nov 2020) from the IMF (Exchange Rates, Domestic Currency per US Dollar, Period Average, Rate - ENDA_XDC_USD_RATE) and UN OPS (Operational rates of exchange - monthly).Source: ITU and A4AI. GNI p.c. and PPP conversion factors are from the World Bank. USD exchange rates are from the IMF or the UN.
Annex Table A2�2: Fixed broadband basket details, 2020 (continued)
..

ICT price trends 2020
78
Annex Table A2�3: Mobile cellular low-usage basket details, 2020
Mobile cellular - low usage basket (70 min, 20 SMS), 2020
Rank Economy as % of GNI p.c. USD PPP$ Tax rate
1 Hong Kong, China 0.05 2.06 2.53 0.0
2 Macao, China 0.06 4.13 5.52 0.0
3 Austria 0.09 3.98 4.26 20.0
Luxembourg 0.09 5.66 5.22 17.0
5 United Arab Emirates 0.10 3.70 4.95 5.0
6 Liechtenstein 0.13 21.13 .. 7.7
7 Sri Lanka 0.24 0.71 2.37 22.6
8 Bahrain 0.25 4.68 8.65 5.0
9 France 0.26 9.06 9.61 20.0
Iceland 0.26 12.91 11.66 24.0
Qatar 0.26 13.68 18.03 0.0
12 China 0.28 2.38 4.00 0.0
13 Belgium 0.29 11.34 11.96 21.0
Estonia 0.29 5.67 8.06 20.0
15 Israel 0.31 11.51 9.59 17.0
16 Brunei Darussalam 0.32 8.25 17.11 0.0
Russian Federation 0.32 2.62 7.10 20.0
18 Kazakhstan 0.33 2.16 6.75 12.0
19 Kuwait 0.36 11.55 19.44 0.0
20 Singapore 0.37 17.94 23.89 7.0
21 Finland 0.39 16.00 15.28 24.0
22 Mauritius 0.41 3.77 8.43 15.0
Netherlands 0.41 18.15 18.85 21.0
24 Egypt 0.42 1.14 4.73 43.0
25 Norway 0.43 26.01 23.20 25.0
26 New Zealand 0.44 14.69 14.60 15.0
Tunisia 0.44 1.22 4.23 19.0
28 Iran (Islamic Republic of) 0.45 1.69 3.21 9.0
29 Switzerland 0.48 35.31 25.33 7.7
United Kingdom 0.48 16.46 16.76 20.0
31 Denmark 0.50 25.71 21.98 25.0
Latvia 0.50 7.36 11.33 21.0
Malta 0.50 11.34 15.72 18.0
Mexico 0.50 3.37 7.21 16.0
35 Costa Rica 0.51 4.96 7.73 13.0
36 Faroe Islands 0.52 23.89 .. 25.0
37 Portugal 0.53 10.11 13.91 23.0
38 Spain 0.54 13.49 16.88 21.0
39 Cyprus 0.55 12.48 16.75 19.0

ICT price trends 2020
79
Mobile cellular - low usage basket (70 min, 20 SMS), 2020
Rank Economy as % of GNI p.c. USD PPP$ Tax rate
40 Canada 0.56 20.80 21.70 13.0
Sweden 0.56 25.11 25.03 25.0
42 Thailand 0.57 3.53 8.62 7.0
43 Greece 0.58 9.64 13.47 24.0
44 Czech Republic 0.59 10.59 17.92 21.0
United States 0.59 32.66 32.66 8.9
46 Jordan 0.60 2.15 4.61 46.2
47 Saudi Arabia 0.61 11.87 26.84 5.0
48 Malaysia 0.63 5.63 14.27 0.0
49 Libya 0.65 4.19 8.23 0.0
50 Maldives 0.66 5.36 8.78 6.0
Mongolia 0.66 1.97 5.79 10.0
Turkmenistan 0.66 3.65 7.78 15.0
53 Georgia 0.68 2.35 7.67 18.0
Slovakia 0.68 10.89 16.24 20.0
55 Cayman Islands 0.69 28.03 20.14 ..
Panama 0.69 8.40 17.18 7.0
57 Lithuania 0.71 11.23 19.54 21.0
58 Poland 0.73 8.86 18.62 23.0
59 Bahamas 0.76 19.94 17.99 12.0
Bhutan 0.76 1.69 6.14 0.0
61 Ireland 0.78 39.70 35.93 23.0
62 Belarus 0.79 3.60 13.61 25.0
Morocco 0.79 2.08 4.76 20.0
64 Italy 0.80 22.67 26.70 22.0
Korea (Rep. of) 0.80 20.55 25.51 10.0
Oman 0.80 10.09 18.93 0.0
67 Australia 0.81 34.21 32.76 10.0
Palau 0.81 11.70 13.20 ..
69 Turkey 0.83 4.98 16.03 25.5
70 Myanmar 0.84 1.06 3.36 5.0
71 Germany 0.85 34.01 38.55 19.0
Slovenia 0.85 18.14 24.92 22.0
73 Romania 0.86 9.07 20.41 19.0
74 Azerbaijan 0.87 3.33 11.55 18.0
75 Seychelles 0.88 9.64 18.96 15.0
76 Armenia 0.96 3.71 10.79 20.0
77 Hungary 1.01 12.51 25.12 27.0
78 Bangladesh 1.03 1.65 4.43 31.0
Annex Table A2�3: Mobile cellular low-usage basket details, 2020 (continued)

ICT price trends 2020
80
Mobile cellular - low usage basket (70 min, 20 SMS), 2020
Rank Economy as % of GNI p.c. USD PPP$ Tax rate
79 Trinidad and Tobago 1.04 14.74 23.96 12.5
80 Botswana 1.05 5.86 13.54 12.0
81 Jamaica 1.08 4.49 8.86 25.0
82 Japan 1.09 38.50 37.30 10.0
83 Chile 1.12 11.72 19.22 ..
84 Uzbekistan 1.13 1.44 6.58 20.0
85 Aruba 1.16 26.50 30.93 ..
86 Uruguay 1.22 12.69 19.69 ..
87 Tonga 1.23 4.34 5.77 15.0
88 Colombia 1.24 5.58 14.35 23.0
89 Nauru 1.35 14.95 16.60 15.0
90 Serbia 1.38 8.19 17.46 20.0
91 South Africa 1.39 5.62 14.33 15.0
92 Brazil 1.43 7.43 16.67 40.2
93 Sudan 1.52 0.60 2.58 30.0
94 Saint Kitts and Nevis 1.57 24.56 26.94 ..
95 Nepal (Republic of) 1.58 1.34 5.01 26.0
96 Croatia 1.60 19.36 33.52 25.0
Pakistan 1.60 1.51 6.73 32.0
98 Iraq 1.61 7.95 17.27 0.0
Ukraine 1.61 4.81 16.29 20.0
100 India 1.62 2.65 9.44 18.0
101 Albania 1.65 7.29 15.69 20.0
Bulgaria 1.65 13.21 30.26 20.0
Fiji 1.65 7.80 17.00 9.0
104 Eswatini 1.67 3.96 10.94 14.0
105 Ethiopia 1.69 0.99 3.14 15.0
106 Algeria 1.72 5.12 16.88 19.0
107 Samoa 1.76 5.89 8.47 15.0
108 Barbados 1.82 26.61 21.70 21.0
Dominican Rep. 1.82 10.75 24.92 30.0
110 Indonesia 1.83 5.84 16.73 10.0
111 Moldova 1.88 6.77 17.70 20.0
112 Antigua and Barbuda 1.89 26.33 29.16 ..
113 Curacao 1.93 31.80 38.03 6.0
114 Namibia 1.95 6.48 15.79 15.0
115 Peru 1.96 10.66 19.32 ..
Viet Nam 1.96 4.06 11.85 10.0
117 Bosnia and Herzegovina 1.99 10.17 22.48 17.0
Annex Table A2�3: Mobile cellular low-usage basket details, 2020 (continued)
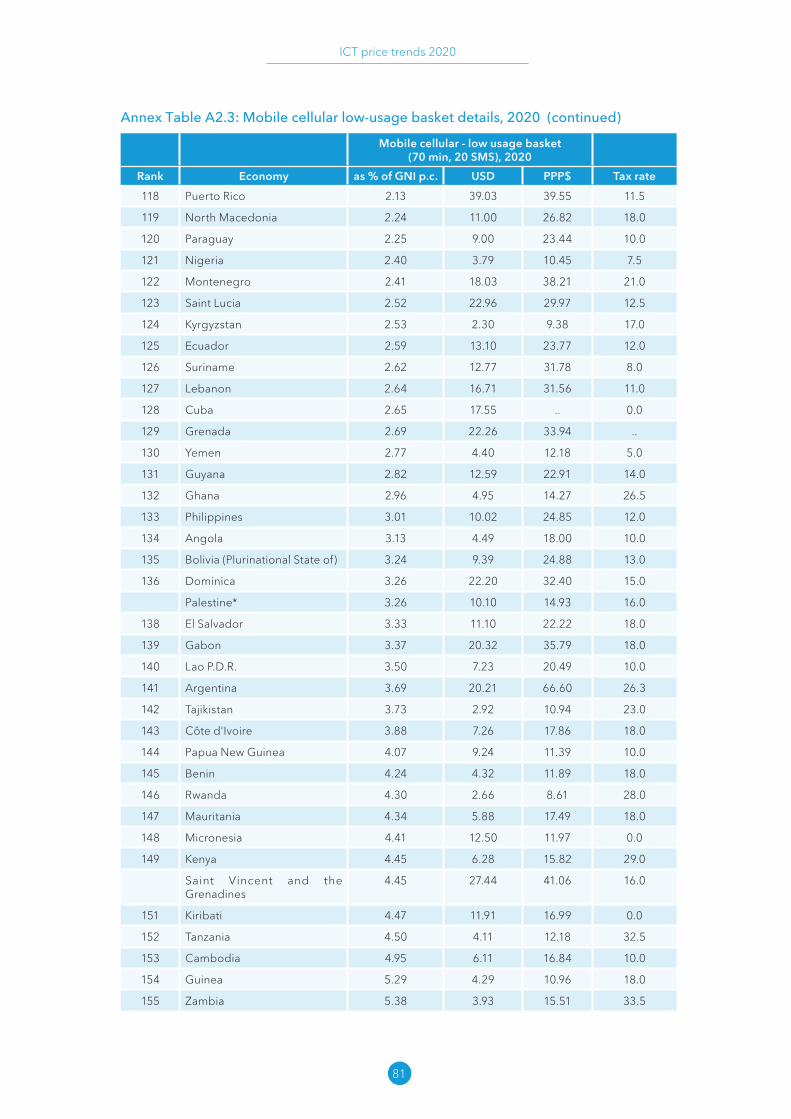
ICT price trends 2020
81
Mobile cellular - low usage basket (70 min, 20 SMS), 2020
Rank Economy as % of GNI p.c. USD PPP$ Tax rate
118 Puerto Rico 2.13 39.03 39.55 11.5
119 North Macedonia 2.24 11.00 26.82 18.0
120 Paraguay 2.25 9.00 23.44 10.0
121 Nigeria 2.40 3.79 10.45 7.5
122 Montenegro 2.41 18.03 38.21 21.0
123 Saint Lucia 2.52 22.96 29.97 12.5
124 Kyrgyzstan 2.53 2.30 9.38 17.0
125 Ecuador 2.59 13.10 23.77 12.0
126 Suriname 2.62 12.77 31.78 8.0
127 Lebanon 2.64 16.71 31.56 11.0
128 Cuba 2.65 17.55 .. 0.0
129 Grenada 2.69 22.26 33.94 ..
130 Yemen 2.77 4.40 12.18 5.0
131 Guyana 2.82 12.59 22.91 14.0
132 Ghana 2.96 4.95 14.27 26.5
133 Philippines 3.01 10.02 24.85 12.0
134 Angola 3.13 4.49 18.00 10.0
135 Bolivia (Plurinational State of) 3.24 9.39 24.88 13.0
136 Dominica 3.26 22.20 32.40 15.0
Palestine* 3.26 10.10 14.93 16.0
138 El Salvador 3.33 11.10 22.22 18.0
139 Gabon 3.37 20.32 35.79 18.0
140 Lao P.D.R. 3.50 7.23 20.49 10.0
141 Argentina 3.69 20.21 66.60 26.3
142 Tajikistan 3.73 2.92 10.94 23.0
143 Côte d'Ivoire 3.88 7.26 17.86 18.0
144 Papua New Guinea 4.07 9.24 11.39 10.0
145 Benin 4.24 4.32 11.89 18.0
146 Rwanda 4.30 2.66 8.61 28.0
147 Mauritania 4.34 5.88 17.49 18.0
148 Micronesia 4.41 12.50 11.97 0.0
149 Kenya 4.45 6.28 15.82 29.0
Saint Vincent and the Grenadines
4.45 27.44 41.06 16.0
151 Kiribati 4.47 11.91 16.99 0.0
152 Tanzania 4.50 4.11 12.18 32.5
153 Cambodia 4.95 6.11 16.84 10.0
154 Guinea 5.29 4.29 10.96 18.0
155 Zambia 5.38 3.93 15.51 33.5
Annex Table A2�3: Mobile cellular low-usage basket details, 2020 (continued)

ICT price trends 2020
82
Mobile cellular - low usage basket (70 min, 20 SMS), 2020
Rank Economy as % of GNI p.c. USD PPP$ Tax rate
156 Djibouti 5.71 16.88 28.87 10.0
Vanuatu 5.71 14.49 14.20 15.0
158 Belize 5.95 21.70 30.60 12.5
159 Sao Tome and Principe 6.00 9.71 19.09 15.0
160 Gambia 6.14 3.68 11.48 21.3
161 Madagascar 6.15 2.46 8.85 20.0
162 Timor-Leste 6.57 10.35 24.41 5.0
163 Marshall Islands 6.58 26.65 24.29 0.0
Uganda 6.58 4.15 12.54 18.0
165 Solomon Islands 6.61 11.01 11.71 10.0
166 Lesotho 6.74 6.15 19.35 9.0
167 Guatemala 6.93 26.20 44.47 12.0
168 Afghanistan 7.06 3.04 13.60 0.0
169 Cabo Verde 7.22 21.48 44.72 15.0
170 Honduras 7.80 15.35 33.48 15.0
171 Comoros 7.81 9.22 18.66 0.0
172 Cameroon 8.10 10.04 24.70 19.3
173 Liberia 8.48 4.10 7.98 14.0
174 Haiti 9.00 4.43 11.88 10.0
175 Burkina Faso 9.12 5.81 17.78 18.0
176 Congo (Rep. of the) 10.25 15.50 31.64 ..
177 Senegal 10.62 12.63 31.26 23.0
178 Sierra Leone 13.54 4.89 17.56 15.0
179 Mali 13.86 10.15 30.24 18.0
180 Eritrea 14.98 8.09 16.07 ..
181 Dem. Rep. of the Congo 17.19 7.45 18.20 26.0
182 Guinea-Bissau 18.16 11.46 32.25 19.0
183 Mozambique 19.87 7.12 22.08 17.0
184 Chad 20.08 11.84 29.11 18.0
185 Togo 20.68 11.83 28.50 18.0
186 Nicaragua 21.68 34.50 96.57 15.0
187 Malawi 22.11 7.40 19.36 26.5
188 Central African Rep. 25.81 10.95 21.26 19.0
189 Burundi 27.74 5.86 18.45 18.0
190 Niger 32.05 14.78 36.23 22.6
Andorra** .. 17.78 .. 4.5
Anguilla** .. 27.02 .. ..
British Virgin Islands** .. 23.70 21.63 0.0
Falkland (Malvinas) Is.** .. 11.39 .. ..
Annex Table A2�3: Mobile cellular low-usage basket details, 2020 (continued)

ICT price trends 2020
83
Mobile cellular - low usage basket (70 min, 20 SMS), 2020
Rank Economy as % of GNI p.c. USD PPP$ Tax rate
Gibraltar** .. 19.22 .. 0.0
Greenland** .. 30.27 .. 0.0
Monaco** .. 28.34 .. 20.0
San Marino** .. 9.97 .. ..
Somalia** .. 3.70 .. 10.0
Syrian Arab Republic** .. 0.96 .. 5.0
Taiwan, Province of China** .. 10.08 .. 5.0
Zimbabwe** .. 4.06 .. 25.0
Note: * Palestine is not an ITU Member State; the status of Palestine in ITU is the subject of Resolution 99 (Rev. Dubai, 2018) of the ITU Plenipotentiary Conference. Data not available indicated as: ..** Economy not ranked because no recent (2017 or later) data on GNI p.c. was available. Gross National Income (GNI) per capita data and PPP conversion factors are from the World Bank World Development Indicators, 2019 (or last available year). GNI per capita current LCU was used for all cases, unless when prices were registered in USD. In those cases the Atlas method (current US$) was used instead. Where private consumption PPP ratios were unavailable in recent years (since 2017), estimations are used based on applying change index of PPP ratios for GDP if available on last available PPP ratio for private consumption. The reference exchange rates are based on 2020 Q2-Q3 average (extracted 20.11.2020) from the IMF (Exchange Rates, Domestic Currency per US Dollar, Period Average, Rate - ENDA_XDC_USD_RATE) and UN OPS (Operational rates of exchange - monthly).Source: ITU and A4AI. GNI p.c. and PPP conversion factors are from the World Bank. USD exchange rates are from the IMF or the UN.
Annex Table A2�3: Mobile cellular low-usage basket details, 2020 (continued)
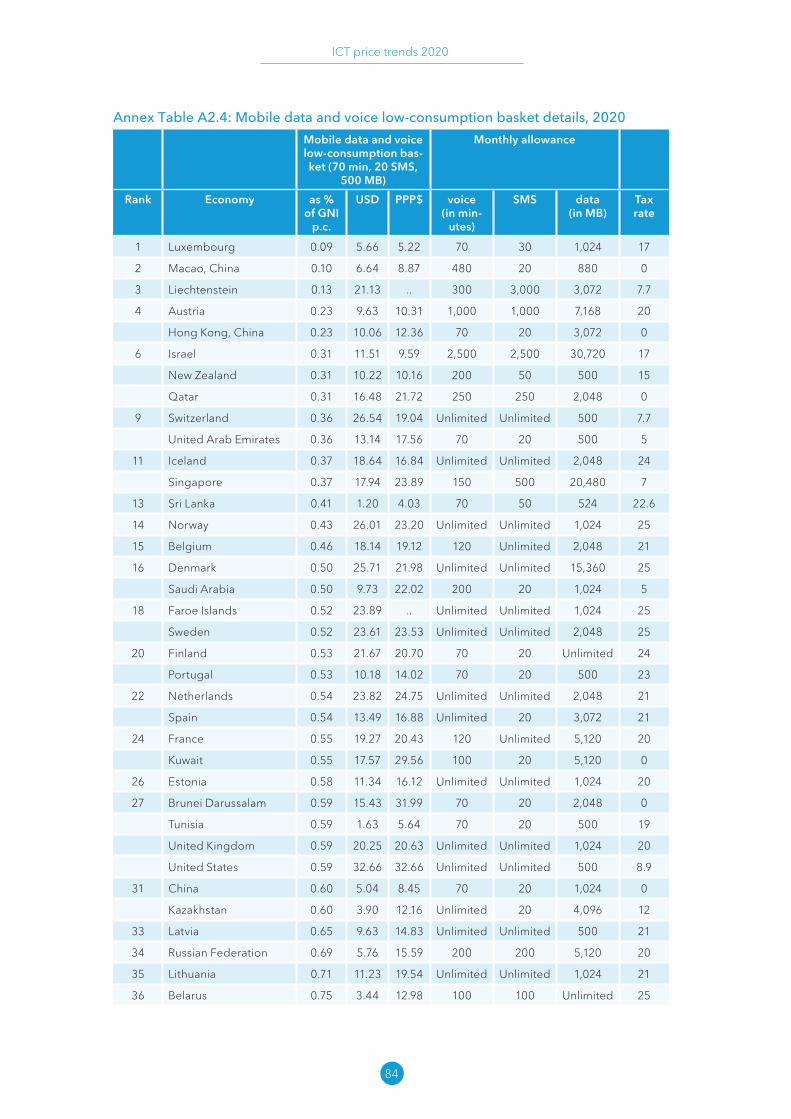
ICT price trends 2020
84
Annex Table A2�4: Mobile data and voice low-consumption basket details, 2020
Mobile data and voice low-consumption bas-ket (70 min, 20 SMS,
500 MB)
Monthly allowance
Rank Economy as % of GNI
p.c.
USD PPP$ voice (in min-
utes)
SMS data (in MB)
Tax rate
1 Luxembourg 0.09 5.66 5.22 70 30 1,024 17
2 Macao, China 0.10 6.64 8.87 480 20 880 0
3 Liechtenstein 0.13 21.13 .. 300 3,000 3,072 7.7
4 Austria 0.23 9.63 10.31 1,000 1,000 7,168 20
Hong Kong, China 0.23 10.06 12.36 70 20 3,072 0
6 Israel 0.31 11.51 9.59 2,500 2,500 30,720 17
New Zealand 0.31 10.22 10.16 200 50 500 15
Qatar 0.31 16.48 21.72 250 250 2,048 0
9 Switzerland 0.36 26.54 19.04 Unlimited Unlimited 500 7.7
United Arab Emirates 0.36 13.14 17.56 70 20 500 5
11 Iceland 0.37 18.64 16.84 Unlimited Unlimited 2,048 24
Singapore 0.37 17.94 23.89 150 500 20,480 7
13 Sri Lanka 0.41 1.20 4.03 70 50 524 22.6
14 Norway 0.43 26.01 23.20 Unlimited Unlimited 1,024 25
15 Belgium 0.46 18.14 19.12 120 Unlimited 2,048 21
16 Denmark 0.50 25.71 21.98 Unlimited Unlimited 15,360 25
Saudi Arabia 0.50 9.73 22.02 200 20 1,024 5
18 Faroe Islands 0.52 23.89 .. Unlimited Unlimited 1,024 25
Sweden 0.52 23.61 23.53 Unlimited Unlimited 2,048 25
20 Finland 0.53 21.67 20.70 70 20 Unlimited 24
Portugal 0.53 10.18 14.02 70 20 500 23
22 Netherlands 0.54 23.82 24.75 Unlimited Unlimited 2,048 21
Spain 0.54 13.49 16.88 Unlimited 20 3,072 21
24 France 0.55 19.27 20.43 120 Unlimited 5,120 20
Kuwait 0.55 17.57 29.56 100 20 5,120 0
26 Estonia 0.58 11.34 16.12 Unlimited Unlimited 1,024 20
27 Brunei Darussalam 0.59 15.43 31.99 70 20 2,048 0
Tunisia 0.59 1.63 5.64 70 20 500 19
United Kingdom 0.59 20.25 20.63 Unlimited Unlimited 1,024 20
United States 0.59 32.66 32.66 Unlimited Unlimited 500 8.9
31 China 0.60 5.04 8.45 70 20 1,024 0
Kazakhstan 0.60 3.90 12.16 Unlimited 20 4,096 12
33 Latvia 0.65 9.63 14.83 Unlimited Unlimited 500 21
34 Russian Federation 0.69 5.76 15.59 200 200 5,120 20
35 Lithuania 0.71 11.23 19.54 Unlimited Unlimited 1,024 21
36 Belarus 0.75 3.44 12.98 100 100 Unlimited 25

ICT price trends 2020
85
Mobile data and voice low-consumption bas-ket (70 min, 20 SMS,
500 MB)
Monthly allowance
Rank Economy as % of GNI
p.c.
USD PPP$ voice (in min-
utes)
SMS data (in MB)
Tax rate
37 Mauritius 0.77 7.00 15.65 70 800 1,200 15
38 Ireland 0.78 39.70 35.93 Unlimited Unlimited Unlimited 23
Korea (Rep. of) 0.78 20.07 24.92 Unlimited Unlimited 700 10
40 Italy 0.80 22.67 26.70 Unlimited Unlimited 40,960 22
Oman 0.80 10.09 18.93 70 50 500 0
42 Australia 0.81 34.21 32.76 Unlimited Unlimited 30,720 10
43 Greece 0.82 13.61 19.02 300 400 800 24
Poland 0.82 9.88 20.75 Unlimited 20 3,072 23
45 Turkey 0.83 4.98 16.03 750 100 5,120 25.5
46 Chile 0.84 8.73 14.31 200 20 6,144 ..
Egypt 0.84 2.26 9.39 80 20 500 43
48 Cyprus 0.85 19.28 25.89 300 300 650 19
Germany 0.85 34.01 38.55 Unlimited Unlimited Unlimited 19
Slovenia 0.85 18.14 24.92 Unlimited Unlimited 2,048 22
51 Czech Republic 0.89 15.88 26.87 100 100 1,500 21
52 Azerbaijan 0.92 3.53 12.25 300 Unlimited 3,072 18
53 Slovakia 0.93 14.97 22.32 100 20 650 20
54 Armenia 0.96 3.71 10.79 10,200 200 3,072 20
55 Romania 0.97 10.21 22.96 Unlimited Unlimited 15,360 19
56 Iran (Islamic Republic of)
0.98 3.71 7.06 100 100 512 9
57 Malaysia 0.99 8.91 22.60 Unlimited 20 Unlimited 0
Morocco 0.99 2.60 5.95 80 40 500 20
59 Malta 1.00 22.68 31.44 500 500 2,048 18
60 Hungary 1.01 12.51 25.12 Unlimited Unlimited 2,048 5
61 Uruguay 1.03 10.78 16.74 111 Unlimited 3,072
62 Bahamas 1.06 28.00 25.26 240 240 2,600 12
63 Myanmar 1.07 1.34 4.25 70 20 630 5
64 Japan 1.09 38.50 37.30 Unlimited 20 1,024 10
65 Bahrain 1.10 20.21 37.36 500 20 8,192 5
66 Costa Rica 1.14 11.03 17.18 70 30 2,048 13
67 Turkmenistan 1.28 7.14 15.20 1,000 300 500 15
68 Bangladesh 1.30 2.08 5.61 100 50 500 31
Mexico 1.30 8.80 18.80 Unlimited Unlimited 2,048 16
70 Bhutan 1.31 2.93 10.62 70 20 1,100 0
71 Indonesia 1.33 4.24 12.14 100 60 500 10
Annex Table A2�4: Mobile data and voice low-consumption basket details, 2020 (continued)

ICT price trends 2020
86
Mobile data and voice low-consumption bas-ket (70 min, 20 SMS,
500 MB)
Monthly allowance
Rank Economy as % of GNI
p.c.
USD PPP$ voice (in min-
utes)
SMS data (in MB)
Tax rate
72 Serbia 1.38 8.19 17.46 100 100 512 20
73 Cayman Islands 1.40 56.88 40.86 300 20 6,144 ..
74 Brazil 1.43 7.43 16.67 Unlimited Unlimited 4,096 40.2
75 Moldova 1.45 5.21 13.61 200 300 2,048 20
76 Aruba 1.47 33.52 39.12 1,000 100 9,216 ..
77 Maldives 1.50 12.24 20.04 70 20 700 6
78 Peru 1.51 8.23 14.90 Unlimited Unlimited 2,800 ..
79 Croatia 1.60 19.36 33.52 2,500 2,500 7,168 25
Thailand 1.60 9.82 23.97 70 20 1,024 7
81 Ukraine 1.61 4.81 16.29 Unlimited 20 3,000 20
82 India 1.62 2.65 9.44 Unlimited Unlimited 43,008 18
83 Bulgaria 1.67 13.33 30.52 200 20 600 20
84 Uzbekistan 1.68 2.13 9.73 1,000 20 500 20
85 Canada 1.69 62.94 65.67 Unlimited Unlimited 10,240 13
86 Palau 1.74 25.00 28.20 190 2,000 10,240 0
87 Panama 1.75 21.40 43.76 Unlimited 100 Unlimited 7
88 Colombia 1.76 7.91 20.34 Unlimited Unlimited 1,200 23
Seychelles 1.76 19.32 38.02 70 20 1,024 15
90 Botswana 1.86 10.44 24.14 70 20 700 12
Georgia 1.86 6.41 20.97 Unlimited Unlimited 4,000 18
92 Viet Nam 1.87 3.87 11.30 100 30 3,072 10
93 Libya 1.89 12.23 24.03 70 20 800 0
94 Ghana 1.92 3.22 9.28 70 100 500 26.5
95 Pakistan 1.96 1.85 8.27 70 20 3,000 32
96 Bosnia and Herzegovina
1.99 10.17 22.48 150 150 500 17
97 Puerto Rico 2.13 39.03 39.55 Unlimited Unlimited 2,048 11.5
98 North Macedonia 2.24 11.00 26.82 Unlimited Unlimited 1,024 18
99 Trinidad and Tobago 2.33 33.17 53.91 Unlimited Unlimited 7,168 12.5
100 Saint Kitts and Nevis 2.37 37.04 40.64 1,000 1,000 10,240 ..
101 Montenegro 2.41 18.03 38.21 5,000 4,000 4,096 21
102 Suriname 2.45 11.95 29.74 70 60 550 8
103 Albania 2.47 10.94 23.53 2,000 200 2,024 20
104 Ecuador 2.48 12.54 22.76 Unlimited 20 2,048 12
105 South Africa 2.52 10.15 25.89 70 20 500 15
106 Namibia 2.54 8.45 20.57 1,400 2,800 800 15
Annex Table A2�4: Mobile data and voice low-consumption basket details, 2020 (continued)

ICT price trends 2020
87
Mobile data and voice low-consumption bas-ket (70 min, 20 SMS,
500 MB)
Monthly allowance
Rank Economy as % of GNI
p.c.
USD PPP$ voice (in min-
utes)
SMS data (in MB)
Tax rate
107 Mongolia 2.57 7.72 22.69 70 20 5,120 10
108 Algeria 2.61 7.79 25.68 Unlimited Unlimited 13,312 19
109 Antigua and Barbuda 2.65 37.04 41.01 700 700 7,168
110 Senegal 2.76 3.28 8.13 250 200 2,048 23
111 Lebanon 2.80 17.74 33.51 70 440 600 11
112 Kyrgyzstan 2.83 2.58 10.49 1,200 2,000 4,200 17
113 Gabon 2.87 17.28 30.45 120 100 500 18
114 Philippines 2.90 9.66 23.94 Unlimited Unlimited 12,288 12
115 Barbados 3.08 45.00 36.69 Unlimited Unlimited 5,120 21
Curacao 3.08 50.75 60.69 70 20 750 6
117 Paraguay 3.13 12.55 32.67 Unlimited 20 3,072 10
118 Nauru 3.28 36.16 40.15 70 20 1,843 15
119 Saint Lucia 3.41 31.07 40.55 2,500 20 10,240 ..
120 Nigeria 3.42 5.40 14.90 288 20 650 7.5
121 Jamaica 3.48 14.45 28.52 Unlimited 20 2,400 25
122 Cuba 3.58 23.70 .. 70 20 600 ..
123 Eswatini 3.61 8.55 23.62 70 20 500 14
124 El Salvador 3.62 12.07 24.16 Unlimited 20 5,120 ..
125 Tonga 3.70 13.02 17.30 1,000 1,000 2,048 15
126 Tajikistan 3.73 2.92 10.94 200 50 500 23
127 Dominican Rep. 3.83 22.64 52.46 Unlimited 1,000 1,024 30
128 Nepal (Republic of) 3.90 3.30 12.37 70 20 1,200 26
129 Papua New Guinea 4.07 9.24 11.39 Unlimited 100 1,024 10
130 Guyana 4.08 18.23 33.15 80 80 3,584 14
Iraq 4.08 20.14 43.74 70 100 2,048 0
132 Jordan 4.12 14.77 31.58 5,000 300 8,192 46.2
133 Fiji 4.25 20.04 43.65 70 20 12,288 9
Grenada 4.25 35.19 53.65 Unlimited Unlimited 8,192 ..
135 Mauritania 4.34 5.88 17.49 120 20 2,048 18
136 Sao Tome and Principe 4.58 7.41 14.57 1,800 1,800 900 15
137 Lao P.D.R. 4.63 9.56 27.08 70 20 540 10
138 Kenya 4.75 6.71 16.90 70 20 1,400 29
139 Djibouti 4.76 14.07 24.06 120 250 500 10
140 Yemen 4.78 7.59 21.03 300 100 575 5
141 Dominica 4.84 32.96 48.12 Unlimited 20 20,480 15
Annex Table A2�4: Mobile data and voice low-consumption basket details, 2020 (continued)

ICT price trends 2020
88
Mobile data and voice low-consumption bas-ket (70 min, 20 SMS,
500 MB)
Monthly allowance
Rank Economy as % of GNI
p.c.
USD PPP$ voice (in min-
utes)
SMS data (in MB)
Tax rate
142 Argentina 4.88 26.73 88.09 70 20 4,096 26.3
143 Zambia 5.11 3.73 14.73 380 800 500 33.5
144 Cambodia 5.19 6.40 17.64 70 20 700 10
145 Guatemala 5.22 19.71 33.46 200 20 9,008 12
146 Angola 5.27 7.56 30.32 70 20 500 10
147 Bolivia (Plurinational State of)
5.38 15.63 41.41 70 20 500 13
148 Nicaragua 5.44 8.18 22.91 Unlimited 80 6,144 15
149 Palestine* 5.58 17.31 25.60 200 200 3,072 16
150 Vanuatu 5.71 14.49 14.20 560 560 560 15
151 Guinea 5.83 4.74 12.09 70 60 1,200 18
152 Ethiopia 5.90 3.45 10.96 70 20 700 15
153 Saint Vincent and the Grenadines
5.92 36.52 54.63 1,000 20 10,240 16
154 Cameroon 5.98 7.41 18.22 70 250 1,536 19.3
155 Samoa 6.24 20.95 30.09 70 20 16,384 15
156 Belize 6.86 25.00 35.26 180 Unlimited 5,400 12.5
157 Benin 6.93 7.06 19.43 84 84 500 18
158 Sudan 7.25 2.84 12.27 400 400 2,048 30
159 Côte d'Ivoire 7.77 14.52 35.72 840 840 1,400 18
160 Timor-Leste 8.10 12.75 30.08 70 20 1,200 5
161 Rwanda 8.85 5.48 17.75 70 2,000 1,024 18
162 Cabo Verde 8.95 26.62 55.42 70 20 1,000 15
163 Madagascar 9.19 3.67 13.22 233 560 560 20
164 Tanzania 9.48 8.66 25.65 800 200 550 32.5
165 Kiribati 9.61 25.59 36.51 70 20 2,800 0
166 Comoros 9.76 11.53 23.33 240 120 900 0
167 Honduras 9.97 19.61 42.78 Unlimited 20 20,480 15
168 Lesotho 10.58 9.65 30.36 300 20 1,500 9
169 Micronesia 11.12 31.50 30.16 70 900 2,048 0
170 Gambia 11.34 6.80 21.23 70 20 750 21.3
171 Mali 11.57 8.47 25.24 150 500 500 18
172 Haiti 11.91 5.87 15.72 70 20 1,600 10
173 Solomon Islands 12.76 21.28 22.63 1,200 1,200 1,160 10
174 Congo (Rep. of the) 13.17 19.91 40.64 70 20 600 ..
175 Burkina Faso 13.20 8.40 25.72 140 140 780 18
Annex Table A2�4: Mobile data and voice low-consumption basket details, 2020 (continued)

ICT price trends 2020
89
Mobile data and voice low-consumption bas-ket (70 min, 20 SMS,
500 MB)
Monthly allowance
Rank Economy as % of GNI
p.c.
USD PPP$ voice (in min-
utes)
SMS data (in MB)
Tax rate
176 Mozambique 15.98 5.73 17.77 122 800 800 17
177 Afghanistan 16.12 6.95 31.05 70 20 1,024 0
178 Sierra Leone 19.37 6.99 25.12 70 20 585 15
179 Liberia 20.69 10.00 19.47 450 500 500 14
180 Uganda 21.24 13.40 40.45 900 1,000 1,024 18
181 Togo 22.65 12.96 31.22 285 150 1,050 18
182 Guinea-Bissau 22.84 14.41 40.57 70 20 1,536 19
183 Malawi 30.99 10.38 27.14 70 20 600 26.5
184 Burundi 32.53 6.87 21.63 70 50 500 2
185 Dem. Rep. of the Congo
33.35 14.45 35.30 70 20 560 26
186 Chad 35.59 20.98 51.60 70 20 1,400 18
187 Niger 37.49 17.28 42.37 3,000 Unlimited 4,096 22.6
188 Central African Rep. 43.58 18.49 35.91 70 20 1,800 19
Andorra** .. 17.78 .. 200 100 500 4.5
Anguilla** .. 44.44 .. 1,000 1,000 10,240 7
British Virgin Islands** .. 70.00 63.87 750 Unlimited 4,096 0
Falkland (Malvinas) Is.** .. 37.98 .. 250 50 500 ..
Gibraltar** .. 21.20 .. 70 25 1,024 0
Greenland** .. 37.88 .. Unlimited Unlimited 1,024 0
Monaco** .. 56.70 .. Unlimited Unlimited 51,200 20
San Marino** ... 10.21 .. 200 100 2,048 ..
Somalia** .. 2.00 .. 100 30 2,560 10
Taiwan, Province of China**
.. 20.84 .. 70 20 1,024 5
Zimbabwe** .. 8.92 .. 70 20 640 25
Note: * Palestine is not an ITU Member State; the status of Palestine in ITU is the subject of Resolution 99 (Rev. Dubai, 2018) of the ITU Plenipotentiary Conference. Data not available indicated as: ..** Economy not ranked because no recent (2017 or later) data on GNI p.c. were available. Gross National Income (GNI) per capita data and PPP conversion factors are from the World Bank World Development Indicators, 2019 (or last available year). GNI per capita current LCU was used for all cases, unless when prices were registered in USD. In those cases the Atlas method (current US$) was used instead. Where private consumption PPP ratios were unavailable in recent years (since 2017), estimations are used based on applying change index of PPP ratios for GDP if available on last available PPP ratio for private consumption. The reference exchange rates are based on 2020 Q2-Q3 average (extracted 20.11.2020) from the (Exchange Rates, Domestic Currency per US Dollar, Period Average, Rate - ENDA_XDC_USD_RATE) and UN OPS (Operational rates of exchange - monthly).Source: ITU and A4AI. GNI p.c. and PPP conversion factors are from the World Bank. USD exchange rates are from the IMF or the UN.
Annex Table A2�4: Mobile data and voice low-consumption basket details, 2020 (continued)

ICT price trends 2020
90
Annex Table A2�5: Mobile data and voice high-consumption basket details, 2020
Mobile data and voice high-consumption basket (140 min, 70 SMS, 1.5GB)
Monthly allowance
Rank Economy as % of GNI
p.c.
USD PPP$ voice (in min-
utes)
SMS data (in GB)
Tax rate
1 Liechtenstein 0.13 21.13 .. 300 3,000 3 7.7
2 Luxembourg 0.18 11.33 10.46 500 500 5 17
3 Macao, China 0.20 13.21 17.66 480 70 2 0
4 Austria 0.23 9.63 10.31 1,000 1,000 7 20
5 Hong Kong, China 0.27 11.47 14.10 140 70 3 0
6 Qatar 0.31 16.48 21.72 250 250 2 0
Israel 0.31 11.51 9.59 2,500 2,500 30 17
8 Singapore 0.37 17.94 23.89 150 500 20 7
9 Iceland 0.37 18.64 16.84 Unlimited Unlimited 2 24
10 New Zealand 0.41 13.41 13.33 200 500 1.5 15
11 Denmark 0.50 25.71 21.98 Unlimited Unlimited 15 25
12 Netherlands 0.51 22.68 23.57 Unlimited Unlimited 2 21
13 Norway 0.52 31.23 27.86 Unlimited Unlimited 3 25
Sweden 0.52 23.61 23.53 Unlimited Unlimited 2 25
15 Belgium 0.64 24.94 26.30 140 Unlimited 2 21
16 Faroe Islands 0.65 29.97 .. Unlimited Unlimited 6 25
Switzerland 0.65 47.78 34.27 Unlimited Unlimited 2 7.7
18 Estonia 0.67 13.03 18.52 Unlimited Unlimited 1.5 20
19 Russian Federation 0.69 5.76 15.59 200 200 5 20
20 United Kingdom 0.70 24.05 24.50 Unlimited Unlimited 3 20
21 Kazakhstan 0.73 4.74 14.78 Unlimited 70 4 12
22 Finland 0.74 30.51 29.14 Unlimited Unlimited Unlimited 24
23 Sri Lanka 0.77 2.27 7.62 140 70 1.6 22.6
24 Ireland 0.78 39.70 35.93 Unlimited Unlimited Unlimited 23
25 United States 0.79 43.55 43.55 Unlimited Unlimited 1.5 8.9
26 Italy 0.80 22.67 26.70 Unlimited Unlimited 40 22
Korea (Rep. of) 0.80 20.55 25.51 Unlimited Unlimited 1.5 10
28 Australia 0.81 34.21 32.76 Unlimited Unlimited 30 10
29 Portugal 0.83 15.88 21.86 1,000 1,000 4 23
Turkey 0.83 4.98 16.03 750 100 5 25.5
31 Latvia 0.84 12.46 19.19 Unlimited Unlimited 1.5 21
32 Germany 0.85 34.01 38.55 Unlimited Unlimited Unlimited 19
Slovenia 0.85 18.14 24.92 Unlimited Unlimited 2 22
34 France 0.88 30.61 32.45 140 70 10 20
35 Azerbaijan 0.92 3.53 12.25 300 Unlimited 3 18
36 United Arab Emirates
0.93 33.74 45.10 140 70 1.5 5

ICT price trends 2020
91
Mobile data and voice high-consumption basket (140 min, 70 SMS, 1.5GB)
Monthly allowance
Rank Economy as % of GNI
p.c.
USD PPP$ voice (in min-
utes)
SMS data (in GB)
Tax rate
Belarus 0.93 4.25 16.04 140 100 Unlimited 25
38 Poland 0.94 11.40 23.94 Unlimited Unlimited 7 23
39 Kuwait 0.95 30.59 51.46 150 70 25 0
Brunei Darussalam 0.95 24.76 51.33 140 70 2 0
41 Armenia 0.96 3.71 10.79 10,200 200 3 20
42 Romania 0.97 10.21 22.96 Unlimited Unlimited 15 19
43 Lithuania 0.99 15.76 27.43 Unlimited Unlimited 4 21
44 Malta 1.00 22.68 31.44 500 500 2 18
45 Czech Republic 1.01 18.00 30.46 200 200 1.5 21
Hungary 1.01 12.51 25.12 Unlimited Unlimited 2 5
47 Spain 1.03 25.78 32.28 Unlimited 70 3 21
48 Bahamas 1.06 28.00 25.26 240 240 2.6 12
Greece 1.06 17.47 24.41 200 200 2.5 24
50 China 1.08 9.08 15.23 140 70 3 0
51 Saudi Arabia 1.10 21.47 48.56 200 70 2 5
52 Mauritius 1.13 10.35 23.14 140 1,000 1.7 15
Chile 1.13 11.85 19.42 200 70 6 ..
54 Malaysia 1.19 10.67 27.06 Unlimited 70 Unlimited 0
55 Mexico 1.30 8.80 18.80 Unlimited Unlimited 3 16
56 Bahrain 1.33 24.57 45.43 500 70 8 5
57 Oman 1.37 17.43 32.69 150 70 4 0
58 Cyprus 1.40 31.76 42.64 Unlimited Unlimited 2 19
59 Japan 1.42 50.33 48.76 Unlimited 70 3 10
60 Brazil 1.43 7.43 16.67 Unlimited Unlimited 4 40.2
61 Moldova 1.45 5.21 13.61 200 300 2 20
62 Aruba 1.47 33.52 39.12 1,000 100 9 ..
63 Peru 1.51 8.23 14.90 Unlimited Unlimited 2.8 ..
64 Uruguay 1.52 15.84 24.58 251 Unlimited 6 ..
65 Cayman Islands 1.58 64.08 46.03 300 70 6 ..
66 Croatia 1.60 19.36 33.52 2,500 2,500 7 25
67 Slovakia 1.62 26.09 38.90 Unlimited Unlimited 1.5 20
India 1.62 2.65 9.44 Unlimited Unlimited 42 18
69 Costa Rica 1.66 16.09 25.07 140 70 2 13
Iran (Islamic Republic of)
1.66 6.25 11.90 200 100 2 9
71 Canada 1.69 62.94 65.67 Unlimited Unlimited 10 13
Annex Table A2�5: Mobile data and voice high-consumption basket details, 2020 (continued)

ICT price trends 2020
92
Mobile data and voice high-consumption basket (140 min, 70 SMS, 1.5GB)
Monthly allowance
Rank Economy as % of GNI
p.c.
USD PPP$ voice (in min-
utes)
SMS data (in GB)
Tax rate
72 Serbia 1.71 10.12 21.57 200 200 10 20
73 Palau 1.74 25.00 28.20 190 2,000 2 0
74 Panama 1.75 21.40 43.76 Unlimited 100 Unlimited 7
75 Tunisia 1.77 4.88 16.93 140 70 1.5 19
76 Egypt 1.80 4.85 20.17 140 70 1.5 43
Ukraine 1.80 5.36 18.16 Unlimited 70 2.9 20
78 Georgia 1.86 6.41 20.97 Unlimited Unlimited 4 18
79 Viet Nam 1.87 3.87 11.30 140 250 5 10
80 Pakistan 1.96 1.85 8.27 140 70 2.9 32
81 Puerto Rico 2.13 39.03 39.55 Unlimited Unlimited 2 11.5
82 Morocco 2.18 5.72 13.09 140 70 1.8 20
83 Bulgaria 2.19 17.49 40.06 200 80 1.5 20
84 Trinidad and Tobago
2.33 33.17 53.91 Unlimited Unlimited 7 12.5
85 Colombia 2.35 10.55 27.12 Unlimited Unlimited 1.8 23
86 Saint Kitts and Nevis
2.37 37.04 40.64 1,000 1,000 10 ..
87 Montenegro 2.41 18.03 38.21 5,000 4,000 4 21
88 Indonesia 2.43 7.74 22.16 300 100 2 10
89 Bhutan 2.45 5.48 19.87 140 70 1.7 0
90 Albania 2.47 10.94 23.53 2,000 2,000 2 20
91 Bosnia and Herzegovina
2.49 12.74 28.18 500 500 3 17
92 Bangladesh 2.52 4.04 10.88 150 200 1.5 31
Myanmar 2.52 3.17 10.06 140 70 1.6 5
94 Namibia 2.54 8.45 20.57 400 2,800 4 15
95 Algeria 2.61 7.79 25.68 Unlimited Unlimited 13 19
96 Suriname 2.63 12.80 31.84 300 300 1.5 8
97 Antigua and Barbuda
2.65 37.04 41.01 700 700 7 ..
98 Thailand 2.66 16.33 39.85 140 70 1.5 7
99 Turkmenistan 2.67 14.86 31.63 140 100 2 15
100 Senegal 2.76 3.28 8.13 250 200 2 23
101 North Macedonia 2.79 13.74 33.52 Unlimited Unlimited 1.5 18
102 Kyrgyzstan 2.83 2.58 10.49 1,200 2,000 4.1 17
103 Philippines 2.90 9.66 23.94 Unlimited Unlimited 12 12
104 Maldives 3.05 24.87 40.71 140 70 2.5 6
Annex Table A2�5: Mobile data and voice high-consumption basket details, 2020 (continued)

ICT price trends 2020
93
Mobile data and voice high-consumption basket (140 min, 70 SMS, 1.5GB)
Monthly allowance
Rank Economy as % of GNI
p.c.
USD PPP$ voice (in min-
utes)
SMS data (in GB)
Tax rate
105 Libya 3.06 19.84 38.98 140 70 2 0
106 Barbados 3.08 45.00 36.69 Unlimited Unlimited 5 21
107 Ecuador 3.14 15.89 28.84 Unlimited 70 2 12
108 Botswana 3.17 17.74 41.02 140 70 2 12
109 Mongolia 3.27 9.79 28.78 140 70 5 10
110 Uzbekistan 3.45 4.39 20.04 1,200 70 1.5 20
111 Nigeria 3.53 5.56 15.35 140 70 3 7.5
112 Seychelles 3.59 39.29 77.31 140 70 1.5 15
Paraguay 3.59 14.39 37.47 Unlimited 70 3 10
114 Tonga 3.70 13.02 17.30 1,000 1,000 2 15
115 Jamaica 3.80 15.76 31.10 Unlimited 70 2.4 25
116 Saint Lucia 3.82 34.78 45.39 2,500 70 10
117 Jordan 4.12 14.77 31.58 5,000 300 8 46.2
118 Curacao 4.16 68.69 82.15 Unlimited Unlimited 20 6
119 Ghana 4.19 7.02 20.22 140 100 1.5 26.5
120 Grenada 4.25 35.19 53.65 Unlimited Unlimited 8
121 Dominican Rep. 4.60 27.19 63.00 Unlimited 1,000 2 30
122 Nauru 4.87 53.78 59.71 140 70 1.8 15
123 Djibouti 5.14 15.19 25.98 150 300 1.5 10
124 El Salvador 5.18 17.25 34.53 Unlimited 70 5
125 Dominica 5.38 36.67 53.52 Unlimited 70 20 15
126 Nicaragua 5.44 8.18 22.91 Unlimited 80 6 15
127 Nepal (Republic of) 5.49 4.65 17.42 490 300 2 26
128 Iraq 5.52 27.24 59.18 140 100 2 0
129 South Africa 5.55 22.34 56.99 140 70 1.5 15
130 Palestine* 5.58 17.31 25.60 200 200 3 16
131 Gabon 5.74 34.57 60.89 300 200 1.5 18
132 Guyana 5.91 26.38 47.98 150 150 4.6 14
133 Fiji 6.19 29.19 63.58 140 70 12.3 9
134 Saint Vincent and the Grenadines
6.46 39.85 59.62 1,000 70 10 16
135 Belize 6.86 25.00 35.26 180 Unlimited 5.4 12.5
136 Guatemala 6.93 26.20 44.47 200 70 8.8 12
137 Kenya 7.12 10.05 25.31 200 70 4 29
138 Sudan 7.25 2.84 12.27 400 400 2 30
139 Zambia 7.63 5.57 21.97 310 70 1.8 33.5
Annex Table A2�5: Mobile data and voice high-consumption basket details, 2020 (continued)

ICT price trends 2020
94
Mobile data and voice high-consumption basket (140 min, 70 SMS, 1.5GB)
Monthly allowance
Rank Economy as % of GNI
p.c.
USD PPP$ voice (in min-
utes)
SMS data (in GB)
Tax rate
140 Lebanon 7.70 48.78 92.14 140 110 1.8 11
Tajikistan 7.70 6.04 22.60 150 70 2 23
142 Mauritania 8.01 10.86 32.28 140 70 2 18
143 Côte d'Ivoire 8.32 15.56 38.27 900 900 1.5 18
144 Sao Tome and Principe
8.33 13.47 26.49 1,800 600 1.8 15
145 Cuba 8.39 55.55 .. 140 70 2.5 ..
146 Samoa 8.64 29.00 41.66 140 70 16 15
147 Eswatini 8.89 21.06 58.18 140 70 2 14
148 Argentina 9.02 49.47 .. 140 70 4 26.3
149 Lao P.D.R. 9.43 19.49 55.21 140 70 5.9 10
150 Angola 9.62 13.81 55.36 140 70 2.7 10
151 Guinea 10.31 8.37 21.38 140 100 2 18
152 Yemen 10.82 17.18 47.59 200 100 1.7 5
153 Cambodia 10.99 13.55 37.34 140 70 1.5 10
154 Papua New Guinea 11.07 25.12 30.97 Unlimited 100 11 10
155 Bolivia (Pluri- national State of)
11.57 33.57 88.95 140 70 2 13
156 Cameroon 11.95 14.81 36.43 140 250 1.5 19.3
157 Ethiopia 13.21 7.73 24.53 140 70 2 15
158 Vanuatu 13.61 34.49 33.80 Unlimited Unlimited 18 15
159 Tanzania 13.90 12.70 37.63 800 200 4 32.5
160 Honduras 14.30 28.14 61.38 Unlimited 70 20 15
161 Benin 14.42 14.70 40.42 140 90 1.6 18
162 Micronesia 14.82 42.00 40.22 140 900 2 0
163 Lesotho 14.89 13.58 42.73 300 70 3.4 9
164 Mali 16.29 11.93 35.54 150 500 2 18
165 Kiribati 16.30 43.38 61.90 140 70 2.7 0
166 Timor-Leste 16.89 26.60 62.75 140 70 2.7 5
167 Rwanda 17.71 10.96 35.50 140 4,000 2 28
168 Cabo Verde 18.24 54.26 112.98 140 70 2 15
169 Comoros 19.52 23.05 46.66 360 240 2 0
170 Gambia 19.78 11.86 37.01 140 70 1.5 21.3
171 Mozambique 19.98 7.16 22.21 229 500 2 17
172 Burkina Faso 19.99 12.72 38.95 140 140 2.3 18
173 Haiti 21.13 10.42 27.90 140 70 1.6 10
174 Madagascar 22.97 9.19 33.05 166 100 2.2 20
Annex Table A2�5: Mobile data and voice high-consumption basket details, 2020 (continued)

ICT price trends 2020
95
Mobile data and voice high-consumption basket (140 min, 70 SMS, 1.5GB)
Monthly allowance
Rank Economy as % of GNI
p.c.
USD PPP$ voice (in min-
utes)
SMS data (in GB)
Tax rate
175 Uganda 25.48 16.08 48.55 900 1,000 1.6 18
176 Afghanistan 26.28 11.33 50.60 140 70 2 0
177 Congo (Rep. of the) 28.49 43.07 87.91 140 70 1.5 ..
178 Solomon Islands 28.54 47.60 50.61 140 70 3.2 10
179 Liberia 31.03 15.00 29.20 450 500 2.4 14
180 Togo 32.02 18.32 44.12 240 70 1.5 18
181 Guinea-Bissau 37.19 23.47 66.05 140 70 1.5 19
182 Niger 37.49 17.28 42.37 3,000 Unlimited 4 22.6
183 Sierra Leone 43.20 15.58 56.02 140 70 2 15
184 Chad 56.99 33.60 82.62 140 70 1.5 18
185 Central African Rep.
57.02 24.20 46.98 1,680 2,800 2.7 19
186 Burundi 62.07 13.11 41.28 140 100 2 2
187 Malawi 64.58 21.62 56.56 140 70 2 26.5
188 Dem. Rep. of the Congo
69.46 30.10 73.53 140 70 1.8 26
Falkland (Malvinas) Is.**
.. 63.30 .. 450 150 2 ..
Monaco** .. 56.70 .. Unlimited Unlimited 50 20
Greenland** .. 53.10 .. Unlimited Unlimited 3 0
Anguilla** .. 44.44 .. 1,000 1,000 10 7
Gibraltar** .. 37.98 .. 300 300 5 0
Taiwan, Province of China**
.. 31.17 .. 140 70 1.5 5
Andorra** .. 28.46 .. 200 100 1.5 4.5
Zimbabwe** .. 22.04 .. 140 70 1.5 25
San Marino** .. 10.21 .. 200 100 2 ..
Somalia** .. 5.00 .. 200 100 7 10
British Virgin Islands**
.. 70.00 63.87 750 Unlimited 4 0
Note: * Palestine is not an ITU Member State; the status of Palestine in ITU is the subject of Resolution 99 (Rev. Dubai, 2018) of the ITU Plenipotentiary Conference. Data not available indicated as: ..
** Economy not ranked because no recent (2017 or later) data on GNI p.c. were available. Gross National Income (GNI) per capita data and PPP conversion factors are from the World Bank World Development Indicators, 2019 (or last available year). GNI per capita current LCU was used for all cases, unless when prices were registered in USD. In those cases the Atlas method (current US$) was used instead. Where private consumption PPP ratios were unavailable in recent years (since 2017), estimations are used based on applying change index of PPP ratios for GDP if available on last available PPP ratio for private consumption. The reference exchange rates are based on 2020 Q2-Q3 average (extracted 20.11.2020) from the IMF (Exchange Rates, Domestic Currency per US Dollar, Period Average, Rate - ENDA_XDC_USD_RATE) and UN OPS (Operational rates of exchange - monthly).
Source: ITU and A4AI. GNI p.c. and PPP conversion factors are from the World Bank. USD exchange rates are from the IMF or the UN.
Annex Table A2�5: Mobile data and voice high-consumption basket details, 2020 (continued)

ICT price trends 2020
96
Annex 3: Tables on inequality and affordability of broadband services
Annex Table A3�1: Mobile broadband prices as a percentage of income, selected countries, 2020
Country name
Inequality data
Data-only mobile broadband prices as a % of adjusted
per capita income% population with mobile broadband
access ≤ 2% of adjusted incomeyear note Average
Bottom 40%
Highest 40%
Albania 2017 consumption 1.03 2.10 0.60 80
Angola 2018 consumption 3.24 11.30 1.70 20
Argentina 2018income; urban
only 1.06 2.80 0.60 70
Armenia 2018 consumption 0.96 1.90 0.60 90
Austria 2017 income 0.27 0.50 0.20 100
Bangladesh 2016 consumption 1.90 3.60 1.20 40
Belarus 2018 consumption 0.74 1.20 0.50 100
Belgium 2017 income 0.44 0.80 0.30 100
Benin 2015 consumption 4.24 13.20 2.30 10
Bhutan 2017 consumption 0.93 2.10 0.60 80
Bolivia 2018 income 2.49 6.80 1.40 30
Botswana 2015 consumption 1.05 3.80 0.50 50
Brazil 2018 income 1.43 5.50 0.70 40
Bulgaria 2017 income 1.23 2.90 0.70 60
Cabo Verde 2015 consumption 2.76 7.20 1.60 20
Canada 2017 income 0.67 1.40 0.40 90
Chile 2017 income 0.72 1.90 0.40 90
China 2016 consumption 0.51 1.20 0.30 100
Colombia 2018 income 2.35 7.80 1.20 20
Costa Rica 2018 income 0.71 2.20 0.40 80
Cote d'Ivoire 2015 consumption 4.62 11.60 2.70 10
Croatia 2017 income 1.60 3.10 1.00 60
Cyprus 2017 income 0.90 1.70 0.60 90
Czech Republic 2017 income 0.30 0.50 0.20 100
Denmark 2017 income 0.35 0.60 0.20 100
Djibouti 2017 consumption 5.71 14.40 3.30 10
Dominican Republic 2018 income 3.08 7.90 1.70 10
Ecuador 2018 income 2.21 6.40 1.20 30
Egypt 2017 consumption 1.01 1.80 0.60 90

ICT price trends 2020
97
Country name
Inequality data
Data-only mobile broadband prices as a % of adjusted
per capita income% population with mobile broadband
access ≤ 2% of adjusted incomeyear note Average
Bottom 40%
Highest 40%
El Salvador 2018 income 3.00 7.00 1.80 20
Estonia 2017 income 0.38 0.70 0.20 100
Eswatini 2016 consumption 5.33 20.40 2.70 10
Ethiopia 2015 consumption 9.52 19.60 5.90 0
Finland 2017 income 0.77 1.30 0.50 100
France 2017 income 0.49 0.90 0.30 100
Gabon 2017 consumption 1.72 4.10 1.00 50
Gambia 2015 consumption 8.37 17.70 5.10 0
Georgia 2018 consumption 0.56 1.20 0.30 90
Germany 2016 income 0.42 0.80 0.30 100
Ghana 2016 consumption 2.03 5.70 1.10 30
Greece 2017 income 0.47 1.00 0.30 100
Honduras 2018 income 8.23 31.60 4.30 0
Hungary 2017 income 0.34 0.60 0.20 100
Iceland 2015 income 0.37 0.60 0.30 100
Indonesia 2018 consumption 1.33 3.00 0.80 60
Iran (Islamic Republic of) 2017 consumption 0.88 2.20 0.50 80
Ireland 2016 income 0.78 1.50 0.50 90
Israel 2016 income 0.31 0.80 0.20 100
Italy 2017 income 0.40 0.90 0.20 90
Kazakhstan 2017 consumption 0.36 0.60 0.20 100
Kenya 2015 consumption 3.31 8.10 1.90 10
Kyrgyzstan 2018 consumption 2.83 4.80 1.90 20
Latvia 2017 income 0.84 1.80 0.50 90
Lesotho 2017 consumption 6.29 18.70 3.50 10
Liberia 2016 consumption 8.28 17.60 5.10 0
Lithuania 2017 income 0.71 1.60 0.40 90
Luxembourg 2017 income 0.18 0.40 0.10 100
North Macedonia 2017 income 1.68 3.70 1.00 60
Malawi 2016 consumption 20.02 49.40 11.40 0
Malaysia 2015 income 0.91 2.30 0.50 80
Maldives 2016 consumption 1.83 3.50 1.20 50
Malta 2017 income 0.75 1.40 0.50 90
Mauritius 2017 consumption 0.67 1.40 0.40 90
Mexico 2018 income 1.30 3.50 0.70 50
Annex Table A3�1: Mobile broadband prices as a percentage of income, selected countries, 2020 (continued)

ICT price trends 2020
98
Country name
Inequality data
Data-only mobile broadband prices as a % of adjusted
per capita income% population with mobile broadband
access ≤ 2% of adjusted incomeyear note Average
Bottom 40%
Highest 40%
Moldova 2018 consumption 0.48 0.80 0.30 100
Mongolia 2018 consumption 1.95 3.90 1.20 40
Montenegro 2015 income 0.89 2.30 0.50 80
Myanmar 2017 consumption 1.04 1.90 0.70 90
Namibia 2015 consumption 2.54 11.80 1.20 20
Netherlands 2017 income 0.64 1.10 0.40 100
Nigeria 2018 consumption 1.71 3.70 1.10 50
Norway 2017 income 0.52 0.90 0.40 100
Pakistan 2015 consumption 0.51 1.00 0.30 100
Palestine* 2016 consumption 2.33 4.80 1.40 30
Panama 2018 income 1.75 5.90 0.90 40
Paraguay 2018 income 2.95 8.50 1.60 20
Peru 2018 income 1.51 4.10 0.90 50
Philippines 2015 consumption 1.36 3.20 0.80 50
Poland 2017 income 0.21 0.40 0.10 100
Portugal 2017 income 0.89 1.80 0.60 90
Romania 2017 income 0.86 2.00 0.50 80
Russian Federation 2018 consumption 0.91 2.00 0.50 80
Rwanda 2016 consumption 6.88 17.40 3.90 10
Sao Tome and Principe 2017 consumption 6.11 21.10 3.20 10
Serbia 2018 consumption 1.14 2.10 0.70 80
Sierra Leone 2018 consumption 15.60 31.90 9.60 0
Slovakia 2016 income 0.35 0.60 0.20 100
Slovenia 2017 income 0.74 1.20 0.50 100
Spain 2017 income 0.31 0.70 0.20 100
Sri Lanka 2016 consumption 0.28 0.60 0.20 100
Saint Lucia 2016 income 3.25 11.70 1.70 20
Sweden 2017 income 0.48 0.90 0.30 100
Switzerland 2017 income 0.65 1.30 0.40 90
Tajikistan 2015 consumption 7.45 15.30 4.60 0
Tanzania 2017 consumption 6.75 15.60 3.90 10
Thailand 2018 consumption 1.18 2.60 0.70 70
Togo 2015 consumption 15.10 41.40 8.50 0
Tonga 2015 consumption 2.47 5.40 1.50 20
Tunisia 2015 consumption 1.28 2.50 0.80 70
Annex Table A3�1: Mobile broadband prices as a percentage of income, selected countries, 2020 (continued)

ICT price trends 2020
99
Country name
Inequality data
Data-only mobile broadband prices as a % of adjusted
per capita income% population with mobile broadband
access ≤ 2% of adjusted incomeyear note Average
Bottom 40%
Highest 40%
Turkey 2018 consumption 0.95 2.40 0.50 70
Uganda 2016 consumption 8.49 21.30 4.80 0
Ukraine 2018 consumption 1.54 2.60 1.10 60
United Kingdom 2016 income 0.55 1.20 0.30 100
United States 2016 income 0.40 1.00 0.20 90
Uruguay 2018 income 1.03 2.50 0.60 70
Viet Nam 2018 consumption 1.04 2.20 0.60 80
Zambia 2015 consumption 3.65 16.40 1.80 10
Note: Data-only mobile broadband (1.5 GB) basket prices were divided by the gross national income adjusted by the disposable income or consumption for the bottom and top 40 per cent of the population as well as population deciles. *Palestine is not an ITU Member State; the status of Palestine in ITU is the subject of Resolution 99 (Rev. Dubai, 2018) of the ITU Plenipotentiary Conference.Source: Price data from ITU and A4AI (2020); Income and consumption expenditure data from World Bank PovcalNet.
Annex Table A3�1: Mobile broadband prices as a percentage of income, selected countries, 2020 (continued)

ICT price trends 2020
100
Annex Table A3�2: Fixed broadband prices as a percentage of income, selected countries, 2020
Country name
Inequality dataFixed broadband prices as a % of
adjusted per capita income% population with fixed broadband access ≤ 2% of
adjusted incomeyear note AverageBottom
40%Highest
40%
Albania 2017 consumption 1.44 3.00 0.90 60
Angola 2018 consumption 8.60 30.10 4.50 0
Argentina 2018income; urban
only 6.96 18.60 4.00 0
Armenia 2018 consumption 3.19 6.30 2.00 10
Austria 2017 income 0.80 1.50 0.50 90
Bangladesh 2016 consumption 2.57 4.90 1.60 20
Belarus 2018 consumption 0.91 1.50 0.60 90
Belgium 2017 income 0.80 1.40 0.50 90
Benin 2015 consumption 25.45 79.10 13.90 0
Bhutan 2017 consumption 2.97 6.80 1.80 20
Bolivia 2018 income 7.68 21.00 4.40 0
Botswana 2015 consumption 4.40 16.10 2.30 10
Brazil 2018 income 2.51 9.60 1.30 20
Bulgaria 2017 income 1.73 4.10 1.00 40
Cabo Verde 2015 consumption 2.59 6.70 1.50 20
Canada 2017 income 1.12 2.30 0.70 80
Chile 2017 income 2.51 6.50 1.40 20
China 2016 consumption 0.51 1.20 0.30 100
Colombia 2018 income 4.16 13.80 2.20 10
Costa Rica 2018 income 1.75 5.50 0.90 40
Cote d'Ivoire 2015 consumption 17.56 44.10 10.10 0
Croatia 2017 income 0.60 1.20 0.40 90
Cyprus 2017 income 0.90 1.70 0.60 90
Czech Republic 2017 income 0.95 1.50 0.70 90
Denmark 2017 income 0.82 1.40 0.50 90
Djibouti 2017 consumption 5.24 13.20 3.00 10
Dominican Republic 2018 income 2.89 7.40 1.60 20
Ecuador 2018 income 4.62 13.40 2.60 10
Egypt 2017 consumption 3.22 5.90 2.10 10
El Salvador 2018 income 8.40 19.70 5.00 0
Estonia 2017 income 0.93 1.80 0.60 90
Eswatini 2016 consumption 15.20 58.00 7.70 0
Ethiopia 2015 consumption 25.01 51.50 15.60 0
Finland 2017 income 0.91 1.60 0.60 90
France 2017 income 1.20 2.30 0.80 80
Gabon 2017 consumption 7.17 17.00 4.30 0
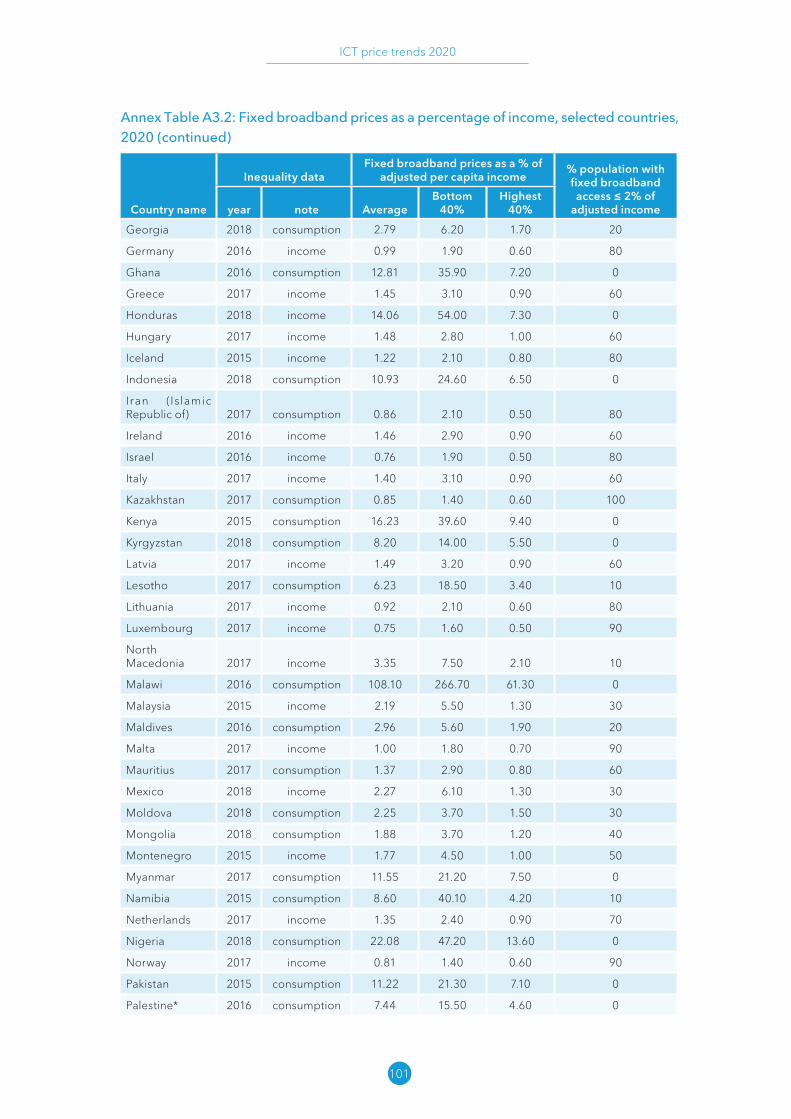
ICT price trends 2020
101
Country name
Inequality dataFixed broadband prices as a % of
adjusted per capita income% population with fixed broadband access ≤ 2% of
adjusted incomeyear note AverageBottom
40%Highest
40%
Georgia 2018 consumption 2.79 6.20 1.70 20
Germany 2016 income 0.99 1.90 0.60 80
Ghana 2016 consumption 12.81 35.90 7.20 0
Greece 2017 income 1.45 3.10 0.90 60
Honduras 2018 income 14.06 54.00 7.30 0
Hungary 2017 income 1.48 2.80 1.00 60
Iceland 2015 income 1.22 2.10 0.80 80
Indonesia 2018 consumption 10.93 24.60 6.50 0
Iran (Islamic Republic of) 2017 consumption 0.86 2.10 0.50 80
Ireland 2016 income 1.46 2.90 0.90 60
Israel 2016 income 0.76 1.90 0.50 80
Italy 2017 income 1.40 3.10 0.90 60
Kazakhstan 2017 consumption 0.85 1.40 0.60 100
Kenya 2015 consumption 16.23 39.60 9.40 0
Kyrgyzstan 2018 consumption 8.20 14.00 5.50 0
Latvia 2017 income 1.49 3.20 0.90 60
Lesotho 2017 consumption 6.23 18.50 3.40 10
Lithuania 2017 income 0.92 2.10 0.60 80
Luxembourg 2017 income 0.75 1.60 0.50 90
North Macedonia 2017 income 3.35 7.50 2.10 10
Malawi 2016 consumption 108.10 266.70 61.30 0
Malaysia 2015 income 2.19 5.50 1.30 30
Maldives 2016 consumption 2.96 5.60 1.90 20
Malta 2017 income 1.00 1.80 0.70 90
Mauritius 2017 consumption 1.37 2.90 0.80 60
Mexico 2018 income 2.27 6.10 1.30 30
Moldova 2018 consumption 2.25 3.70 1.50 30
Mongolia 2018 consumption 1.88 3.70 1.20 40
Montenegro 2015 income 1.77 4.50 1.00 50
Myanmar 2017 consumption 11.55 21.20 7.50 0
Namibia 2015 consumption 8.60 40.10 4.20 10
Netherlands 2017 income 1.35 2.40 0.90 70
Nigeria 2018 consumption 22.08 47.20 13.60 0
Norway 2017 income 0.81 1.40 0.60 90
Pakistan 2015 consumption 11.22 21.30 7.10 0
Palestine* 2016 consumption 7.44 15.50 4.60 0
Annex Table A3�2: Fixed broadband prices as a percentage of income, selected countries, 2020 (continued)

ICT price trends 2020
102
Country name
Inequality dataFixed broadband prices as a % of
adjusted per capita income% population with fixed broadband access ≤ 2% of
adjusted incomeyear note AverageBottom
40%Highest
40%
Panama 2018 income 4.49 15.20 2.40 10
Paraguay 2018 income 4.98 14.40 2.70 10
Peru 2018 income 3.56 9.60 2.00 10
Philippines 2015 consumption 7.85 18.70 4.60 0
Poland 2017 income 1.26 2.30 0.80 80
Portugal 2017 income 1.49 3.00 0.90 60
Romania 2017 income 0.67 1.60 0.40 90
Russian Federation 2018 consumption 0.64 1.40 0.40 90
Rwanda 2016 consumption 48.14 121.60 27.30 0
Sao Tome and Principe 2017 consumption 18.60 64.20 9.60 0
Serbia 2018 consumption 2.77 5.20 1.80 20
Slovakia 2016 income 0.77 1.30 0.50 90
Slovenia 2017 income 1.85 3.00 1.30 50
Spain 2017 income 1.72 3.70 1.10 50
Sri Lanka 2016 consumption 0.89 2.00 0.50 80
Saint Lucia 2016 income 4.07 14.70 2.10 10
Sweden 2017 income 1.05 1.90 0.70 90
Switzerland 2017 income 0.94 1.90 0.60 90
Tajikistan 2015 consumption 7.45 15.30 4.60 0
Tanzania 2017 consumption 21.46 49.50 12.50 0
Thailand 2018 consumption 3.29 7.20 2.00 10
Togo 2015 consumption 37.75 103.60 21.30 0
Tonga 2015 consumption 2.13 4.70 1.30 30
Tunisia 2015 consumption 2.97 5.90 1.90 20
Turkey 2018 consumption 0.95 2.40 0.50 70
Ukraine 2018 consumption 1.60 2.70 1.10 60
United Kingdom 2016 income 1.99 4.20 1.20 40
United States 2016 income 0.99 2.50 0.60 70
Uruguay 2018 income 2.65 6.50 1.60 20
Viet Nam 2018 consumption 3.92 8.40 2.40 10
Zambia 2015 consumption 18.26 82.20 9.10 0
Note: Fixed-broadband (5 GB) basket prices were divided by the gross national income adjusted by the disposable income or consumption for the bottom and top 40 per cent of the population as well as population deciles. *Palestine is not an ITU Member State; the status of Palestine in ITU is the subject of Resolution 99 (Rev. Dubai, 2018) of the ITU Plenipotentiary Conference.Source: Price data from ITU and A4AI (2020); Income and consumption expenditure data from World Bank PovcalNet.
Annex Table A3�2: Fixed broadband prices as a percentage of income, selected countries, 2020 (continued)


International Telecommunication
UnionPlace des Nations
CH-1211 Geneva 20Switzerland
Published in SwitzerlandGeneva, 2020
Photo credits: Shutterstock
ISBN: 978-92-61-32661-6
9 7 8 9 2 6 1 3 2 6 6 1 6