measuring disability prevalence - world...
TRANSCRIPT

S P D I S C U S S I O N P A P E R
About this series...Social Protection Discussion Papers are published to communicate the results of The World Bank'swork to the development community with the least possible delay. The typescript manuscript of thispaper therefore has not been prepared in accordance with the procedures appropriate to formallyedited texts. The findings, interpretations, and conclusions expressed herein are those of the author(s),and do not necessarily reflect the views of the International Bank for Reconstruction and Development/ The World Bank and its affiliated organizations, or those of the Executive Directors of The World Bankor the governments they represent.
The World Bank does not guarantee the accuracy of the data included in this work. For free copiesof this paper, please contact the Social Protection Advisory Service, The World Bank, 1818 H Street,N.W., Room G7-703, Washington, D.C. 20433-0001. Telephone: (202) 458-5267, Fax: (202) 614-0471, E-mail: [email protected] or visit the Social Protection website atwww.worldbank.org/sp.
March 2007
Summary Findings
Disability and poverty are intricately interlinked. Unfortunately,high quality, internationally comparable data on disability thatis important for the planning, implementation, monitoring,and evaluation of inclusive policies is often not available. Thispaper reviews what is meant by disability and puts forth a wayof measuring disability suitable for internationally comparableprevalence rates. It clarifies good standards in collecting dataon disability and makes recommendations for prevalencemeasures of disability suitable for censuses. Since a singledisability prevalence rate can be highly problematic, a betterpractice would be to report at least two prevalence rates —one representing a moderate threshold for functional limitationsand one with a more severe threshold.
HUMAN DEVELOPMENT NETWORK
NO. 0706
Measuring DisabilityPrevalence
Daniel Mont
Measuring Disability Prevalence
By
Daniel Mont Disability & Development Team
HDNSP The World Bank
March 2007
JEL: C8 - Data Collection and Data Estimation Methodology; Computer Programs, I10 – Health General, J14 - Economics of the Elderly; Economics of the Handicapped Acknowledgements: I would like to thank Barbara Altman, Jeanine Braithwaite, Jed Friedman, Mitch Loeb, Jose Molinas Vega, Pia Rockhold, and Sándor Sipos for comments on an earlier version of this paper.
The findings, interpretations, and conclusions expressed herein are those of the author, and do not necessarily reflect the views of the International Bank for Reconstruction and Development / The World Bank and its affiliated organizations, or those of the Executive Directors of The World Bank or the governments they represent.

Table of Contents I. Introduction................................................................................................................ 1
II. Defining Disability..................................................................................................... 2
III. Different Approaches to Measurement...................................................................... 5
IV. Purpose of Measurement.......................................................................................... 14
V. Census Questions for Disability Prevalence ............................................................ 18
General Prevalence Measures ............................................................................ 20
Pre-Testing of Washington Group Questions .................................................... 21
VI. Case Studies: Disability in Brazil, Ecuador and Nicaragua..................................... 30
VII. Conclusions.............................................................................................................. 35
VIII. References................................................................................................................ 37
Annex 1: ACTIVITY AND PARTICIPATION MATRIX .............................................. 39
Annex 2: INSTRUMENTAL ACTIVITIES OF DAILY LIVING SCALE (IADL) ....... 41

1
I Introduction
1.1 Disability and poverty are intricately interlinked. Poverty can cause disability with its
associated malnutrition, poor health services and sanitation, and unsafe living and working
conditions. Conversely, the presence of a disability can trap people in a life of poverty because
of the barriers disabled people face to taking part in education, employment, social activities, and
indeed all aspects of life.
1.2 Recognizing the crucial link between equity, disability, and poverty, in 2002, the World
Bank embarked on mainstreaming disability into Bank operations and analysis. In 2006, the UN
adopted the International Convention on Rights of Disabled People, and many governments and
international development agencies are turning their attention to the goal of including disabled
people in development.
1.3 Unfortunately, the availability of high quality, internationally comparable data on
disability that is important for the planning, implementation, monitoring, and evaluation of
inclusive policies is often not available. This paper is an attempt to clarify some good standards
in collecting data on disability and make recommendations for prevalence measures of disability
suitable for censuses.
1.4 Reported disability prevalence rates from around the world vary dramatically, for
example from under 1% in Kenya and Bangladesh to 20% in New Zealand1. This variation is
caused by several factors: differing definitions of disability, different methodologies of data
collection, and variation in the quality of study design. The result is that generating disability
prevalence rates that are understandable and internationally comparable is a difficult enterprise.
This situation is complicated further by the idea that there is no single correct definition of
disability, that the nature and severity of disabilities vary greatly, and that how one measures
disability differs depending on the purpose for measuring it.
1 Bangladesh Bureau of Statistics, Disabled population of Bangladesh, Evidence from Demographic Sample Survey (1987), Central Bureau of Statistics, Kenya Population Census, 1989, Analytical Report, Vol. IX - Labour force (1996), and Statistics New Zealand, Disability Counts (1998).
2
1.5 This paper reviews what is meant by disability and puts forth a way of measuring
disability suitable for internationally comparable prevalence rates.2 The basic trend in this regard
is to measure functional limitations, rather than disability, and then use different severity
thresholds for defining disability based on the purpose of measurement After explaining this
approach, the paper then goes on to summarize recent studies that use this methodology.
1.6 Overall, as generally defined, disabled people represent a significant proportion of the
world's population. Data from developed countries and some recent studies in developing
countries over several regions (namely, Brazil, Ecuador, India, Nicaragua, Vietnam, and Zambia)
suggest that an estimate of 10-12 percent is not unreasonable. This estimate is in line with the
United Nations’ often cited figure of 10 percent, which in fact was an informed guess based on
data available from developed countries.
1.7 This paper will argue, however, that a single disability prevalence rate can be highly
problematic. Better practice would be to report at least two prevalence rates, one representing a
moderate threshold for functional limitations and one with a more severe threshold.
II Defining Disability
2.1 Disability has often been defined as a physical, mental, or psychological condition that
limits a person’s activities. In the past, this was interpreted according to a medical model. That
is, disability was linked to various medical conditions, and was viewed as a problem residing
solely in the affected individual. Disability was seen solely as the result of an individual’s
inability to function. Interventions usually included medical rehabilitation and the provision of
social assistance.
2.2 This medical model has recently been replaced by the social model of disability, which
conceptualizes disability as arising from the interaction of a person’s functional status with the
2 The general approach for defining such prevalence follows closely the UN Washington Group on Disability Statistics. Their website can be found at http://www.cdc.gov/nchs/citygroup.htm
3
physical, cultural, and policy environments.3 If the environment is designed for the full range of
human functioning and incorporates appropriate accommodations and supports, then people with
functional limitations would not be “disabled” in the sense that they would be able to fully
participate in society. Interventions are thus not only at the individual level (e.g., medical
rehabilitation) but also at the societal level, for example the introduction of universal design to
make infrastructure more accessible, inclusive education systems, and community awareness
programs to combat stigma.
2.3 According to the social model, disability is the outcome of the interaction of person and
their environment and thus is neither person nor environment specific. The International
Classification of Functioning, Disability and Health (ICF) developed by the World Health
Organization is the starting point for recent developments in measuring functional capacity.4
2.4 Based on a theoretical model that draws upon the social model of disability, disability in
the ICF is not an “all or nothing” concept. People are not identified as having a disability based
upon a medical condition, but rather are classified according to a detailed description of their
functioning within various domains. The first of these domains – body structure and function –
is the most closely related to the medical model as it refers to the physiological and
psychological functions of body systems. Body structures are defined by the ICF as “anatomic
parts of the body such as organs, limbs and their components.” This domain relates to very
specific capabilities, for example being able to lift one’s arm over one’s head or produce
articulate speech sounds. Thus, it is not a “whole” person classification, as are the other domains
-- activities and participation.
2.5 Activities pertain to a wide range of deliberate actions performed by an individual, as
opposed to particular body functions or structures. Activities are basic deliberate actions
undertaken in order to accomplish a task, such as getting dressed or feeding oneself.
Participation refers to activities that are integral to economic and social life and the social roles
3 See, for example, Shakespeare, T. and N. Watson, “Defending the Social Model,” Disability and Society, 12(2):293-300, April (1997) and Hughes, B. and K. Paterson, “The Social Model of Disability and the Disappearing Body: towards a sociology of impairment,” Disability and Society 12(3):325-340, June (1997) 4 See the ICF homepage at www3.who.int/icf/icftemplate.cfm

4
that accomplish that life, such as being able to attend school or hold a job. Moreover, the ICF
incorporates the social model by including information on how a person’s ability to function is
affected by the environment they face. For example, a given level of impairment in the body
function domain will not necessarily translate into an activity or participation limitation if the
environment accommodates a person’s different functional status.
2.6 Disability in the ICF arises out of Activity limitations and restrictions placed upon
Participation that grow out of the interaction between Body Structure and Function limitations
and an unaccommodating environment. These interactions are summarized in Figure 1.
2.7 If disability arises out of a complex model such as this, how can it be captured in a single
measure? In fact, each domain represents a different area of measurement and each category or
element of classification within each domain represents a different area of operationalization of
the broader domain concept. To generate a meaningful general prevalence measure one must
determine which component best reflects the information needed to address the purpose of the
data collection. To determine that, one needs to settle on the question behind having such a
statistic.
Health Condition (disorder/disease)
Environmental Factors
Personal Factors
Body Function & Structure (Impairment)
Activities (Limitation)
Participation (Restriction)
Figure 1: The ICF Model

5
2.8 After reviewing various approaches to measuring disability, this paper will summarize
various purposes for measurement, and then recommend which purpose is best suited for general
prevalence, and how to go about estimating it.
III Different Approaches to Measurement
3.1 Censuses and surveys from around the world take very different approaches to measuring
disability. In fact, different instruments within the same country often report very different rates
of disability. For example, in Canada, the reported rate of disability in 2001 ranged from 13.7%
to 31.3% (see Table 1). In the Participation and Activity Limitations Survey disability was
defined as having limitations in undertaking various activities. The reported prevalence rate was
about 14%. The Canadian Community Health Survey reports a much higher rate of disability
because it considers any condition that affects one’s health, even those that do not necessarily
have an impact on the range of activities a person could perform in daily life.
Table 1: Adult Disability Rates for Major Canadian Surveys, 2001 Instrument Percent Participation and Activity Limitations Survey – Filters 13.7 Participation and Activity Limitations Survey – All 14.8 Census 18.5 Survey of Labor and Income Dynamics 20.5 Canadian Community Health Survey 31.3 Source: Rietschlin and MacKenzie, 2004
3.2 Across countries the variation is even greater, as observed in Table 2. Generally
speaking, developing countries tend to report the lowest rates of disability. While some factors
would lead to higher rates of disability in richer countries – namely, more elderly people and
higher survival rates for people with disabling conditions – the wide range of factors operating in
the opposite direction – for example, poor health care, poor nutrition, and unsafe living
conditions – makes the breadth of this gap highly questionable. In fact, when similar approaches
are taken to measuring disability in developed and developing countries, prevalence rates fall
within a narrower band, as shown later in this paper.
6
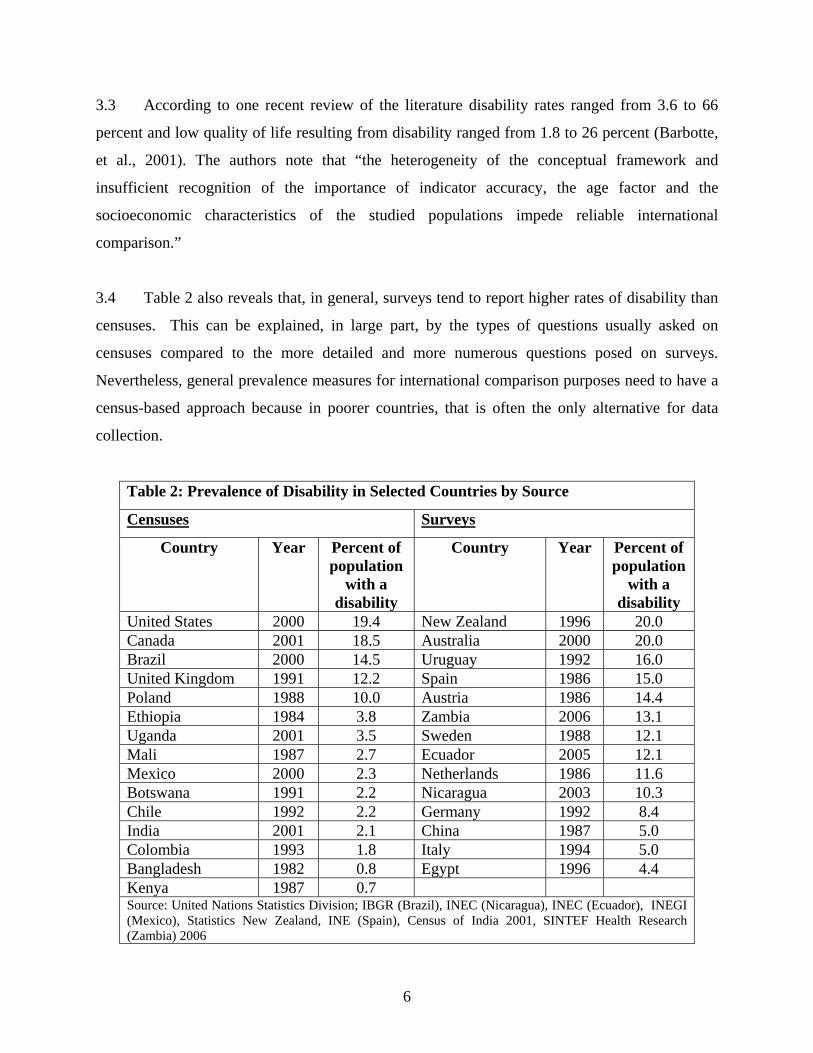
3.3 According to one recent review of the literature disability rates ranged from 3.6 to 66
percent and low quality of life resulting from disability ranged from 1.8 to 26 percent (Barbotte,
et al., 2001). The authors note that “the heterogeneity of the conceptual framework and
insufficient recognition of the importance of indicator accuracy, the age factor and the
socioeconomic characteristics of the studied populations impede reliable international
comparison.”
3.4 Table 2 also reveals that, in general, surveys tend to report higher rates of disability than
censuses. This can be explained, in large part, by the types of questions usually asked on
censuses compared to the more detailed and more numerous questions posed on surveys.
Nevertheless, general prevalence measures for international comparison purposes need to have a
census-based approach because in poorer countries, that is often the only alternative for data
collection.
Table 2: Prevalence of Disability in Selected Countries by Source
Censuses Surveys
Country Year Percent of population
with a disability
Country Year Percent of population
with a disability
United States 2000 19.4 New Zealand 1996 20.0 Canada 2001 18.5 Australia 2000 20.0 Brazil 2000 14.5 Uruguay 1992 16.0 United Kingdom 1991 12.2 Spain 1986 15.0 Poland 1988 10.0 Austria 1986 14.4 Ethiopia 1984 3.8 Zambia 2006 13.1 Uganda 2001 3.5 Sweden 1988 12.1 Mali 1987 2.7 Ecuador 2005 12.1 Mexico 2000 2.3 Netherlands 1986 11.6 Botswana 1991 2.2 Nicaragua 2003 10.3 Chile 1992 2.2 Germany 1992 8.4 India 2001 2.1 China 1987 5.0 Colombia 1993 1.8 Italy 1994 5.0 Bangladesh 1982 0.8 Egypt 1996 4.4 Kenya 1987 0.7 Source: United Nations Statistics Division; IBGR (Brazil), INEC (Nicaragua), INEC (Ecuador), INEGI (Mexico), Statistics New Zealand, INE (Spain), Census of India 2001, SINTEF Health Research (Zambia) 2006
7
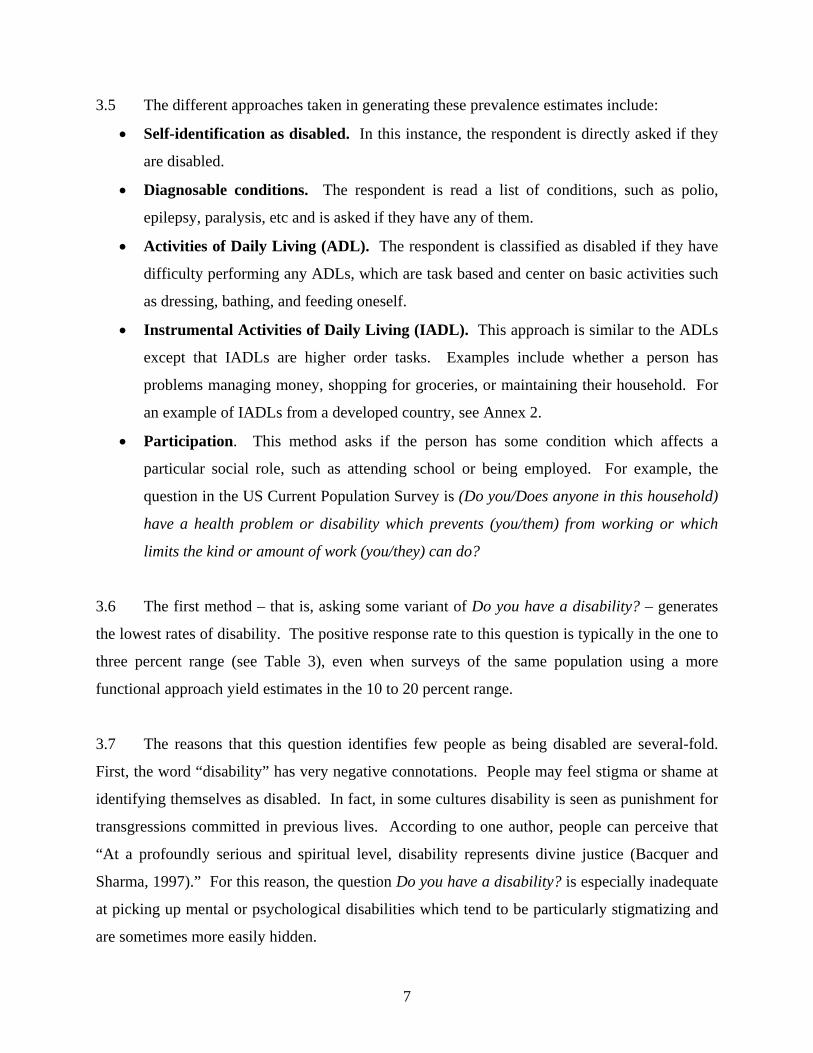
3.5 The different approaches taken in generating these prevalence estimates include:
• Self-identification as disabled. In this instance, the respondent is directly asked if they
are disabled.
• Diagnosable conditions. The respondent is read a list of conditions, such as polio,
epilepsy, paralysis, etc and is asked if they have any of them.
• Activities of Daily Living (ADL). The respondent is classified as disabled if they have
difficulty performing any ADLs, which are task based and center on basic activities such
as dressing, bathing, and feeding oneself.
• Instrumental Activities of Daily Living (IADL). This approach is similar to the ADLs
except that IADLs are higher order tasks. Examples include whether a person has
problems managing money, shopping for groceries, or maintaining their household. For
an example of IADLs from a developed country, see Annex 2.
• Participation. This method asks if the person has some condition which affects a
particular social role, such as attending school or being employed. For example, the
question in the US Current Population Survey is (Do you/Does anyone in this household)
have a health problem or disability which prevents (you/them) from working or which
limits the kind or amount of work (you/they) can do?
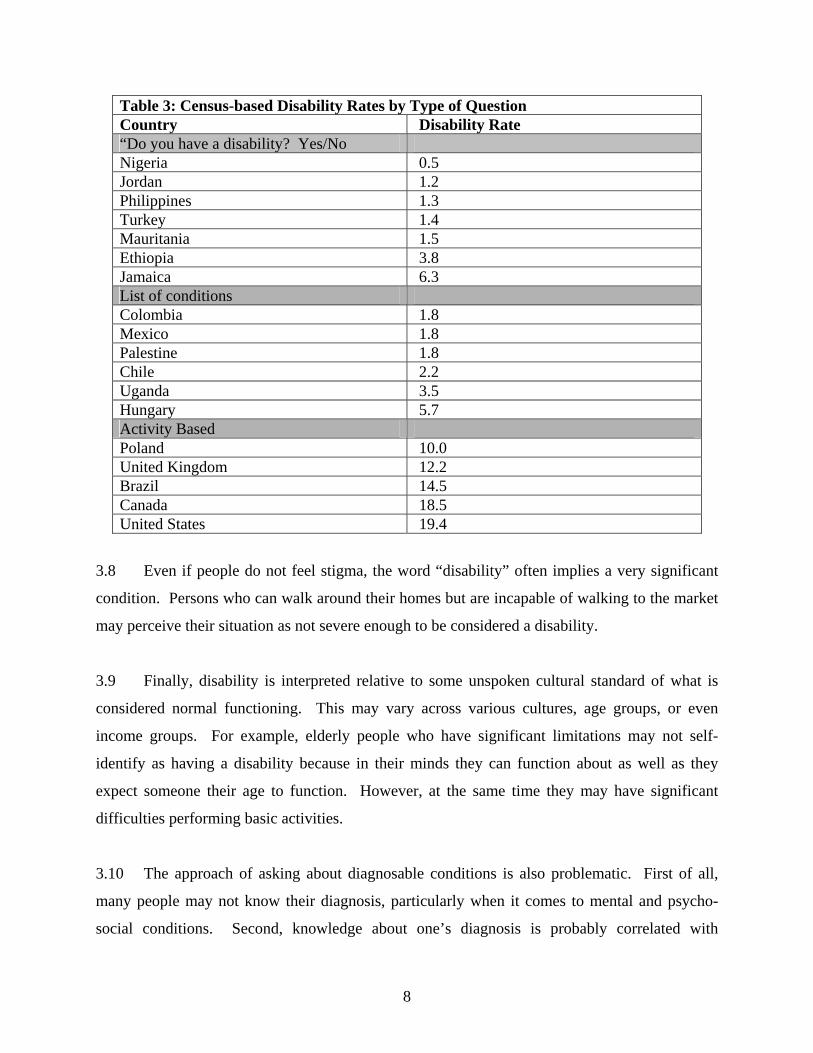
3.6 The first method – that is, asking some variant of Do you have a disability? – generates
the lowest rates of disability. The positive response rate to this question is typically in the one to
three percent range (see Table 3), even when surveys of the same population using a more
functional approach yield estimates in the 10 to 20 percent range.
3.7 The reasons that this question identifies few people as being disabled are several-fold.
First, the word “disability” has very negative connotations. People may feel stigma or shame at
identifying themselves as disabled. In fact, in some cultures disability is seen as punishment for
transgressions committed in previous lives. According to one author, people can perceive that
“At a profoundly serious and spiritual level, disability represents divine justice (Bacquer and
Sharma, 1997).” For this reason, the question Do you have a disability? is especially inadequate
at picking up mental or psychological disabilities which tend to be particularly stigmatizing and
are sometimes more easily hidden.
8
Table 3: Census-based Disability Rates by Type of Question Country Disability Rate “Do you have a disability? Yes/No Nigeria 0.5 Jordan 1.2 Philippines 1.3 Turkey 1.4 Mauritania 1.5 Ethiopia 3.8 Jamaica 6.3 List of conditions Colombia 1.8 Mexico 1.8 Palestine 1.8 Chile 2.2 Uganda 3.5 Hungary 5.7 Activity Based Poland 10.0 United Kingdom 12.2 Brazil 14.5 Canada 18.5 United States 19.4
3.8 Even if people do not feel stigma, the word “disability” often implies a very significant
condition. Persons who can walk around their homes but are incapable of walking to the market
may perceive their situation as not severe enough to be considered a disability.
3.9 Finally, disability is interpreted relative to some unspoken cultural standard of what is
considered normal functioning. This may vary across various cultures, age groups, or even
income groups. For example, elderly people who have significant limitations may not self-
identify as having a disability because in their minds they can function about as well as they
expect someone their age to function. However, at the same time they may have significant
difficulties performing basic activities.
3.10 The approach of asking about diagnosable conditions is also problematic. First of all,
many people may not know their diagnosis, particularly when it comes to mental and psycho-
social conditions. Second, knowledge about one’s diagnosis is probably correlated with

9
variables such as education, socio-economic status, and access to health services, thus
introducing a potential bias in the collected data. And finally, the functional effects of a
particular condition can vary widely. For example, untreated diabetes can lead to profound
functional limitations such as blindness or the loss of limbs. Diabetes that is properly managed
can have a relatively minor impact on someone’s life. The same thing is true for something like
the amputation of a leg. With proper medical treatment and a prosthetic, a person may have few
limitations when it comes to daily life. Poor treatment, on the other hand, can lead to a series of
painful and dangerous infections. (For examples of countries that use a list of conditions in their
census questions, see Table 3.)
3.11 Questions that focus on basic activities or major body functions serve as better screens.
In fact, a question such as Do you have difficulty walking? can pick up mobility limitations
resulting not only from paralysis and amputation, but also serious heart problems or other
medical conditions. (For examples of countries taking a more activity based approach, see Table
3). A question such as Do you have difficulty holding a conversation with others? can pick up
stuttering, loss of speech due to stroke, autism, or a number of other conditions. And for most
purposes, it is the functional status which is of interest – and how that impacts someone’s life –
and not necessarily the cause (medical or otherwise). Of course, for a study designed to uncover
the best approaches towards preventing disabilities, the cause and age of onset could be
important data to collect.
3.12 For purposes of promoting inclusive economic development, it is more appropriate to
view disability as a reduced ability to undertake “activities” and “participation” resulting from
functional limitations, rather than as a diagnosis of a medical condition.
3.13 The notion of a functionally based view of disability is captured well in Figure 2, which
shows the distribution of activity limitations in a selected sample of the population of Zambia.
In the Zambian census (1990) a simple “Do you have a disability?” type question yielded a
disability prevalence rate of only about 1 percent. However, a functional based approach using
the UN Washington Group Questions (to be described later) in conjunction with a much more
detailed survey, yielded a disability prevalence rate of over 13 percent.

10
3.14 The activity limitation score represented in the diagram is based on the responses to
questions on 44 activities across nine different functional domains (see Annex 1). Scores are a
function of the degree of difficulty respondents had with these activities. Respondents received
zero points for each of the 44 activities they reported having no difficulty with, one point for
those with which they had a little difficulty, two points for some difficulty, 3 points for a lot of
difficulty, and four points for activities they were unable to do. Activity limitation scores thus
range from zero to 176.
3.15 Figure 2 shows a wide and skewed distribution of activity limitation scores. Most
disabled people – identified by a set of screening questions – have low or moderate limitation
Figure 2: Activity Limitation Scores for Zambia
Activity limitation Score
Source: Eide, A.H. and M. Loeb. (eds), Living Conditions among People with Activity Limitations in Zambia: A National
Representative Study. SINTEF Health Research, August 2006
0
20
40
60
80
100
120
140
160
180
1 5 9 13 17 21 25 29 33 37 41 45 49 53 57 61 65 69 73 77 82 86 90 94 98 102 108 112 119 126 143 161
Num
ber d
isab
led
0
2
4
6
8
10
12
14
16
18
20
Num
ber N
on-d
isab
led
Disabled
Non-disabled
11
scores. A small sub-sample of people identified as not having disabilities by the screening
questions were also asked the extended set of activity questions. Interestingly, a number of them
report some activity limitations (as recorded by the black bars). The screening questions asked
about general difficulties in doing day to day activities stemming from a physical, mental or
emotional (or other health) condition. However, when asked more specific, functional questions
these people identified as not having a disability did report some functional limitations.
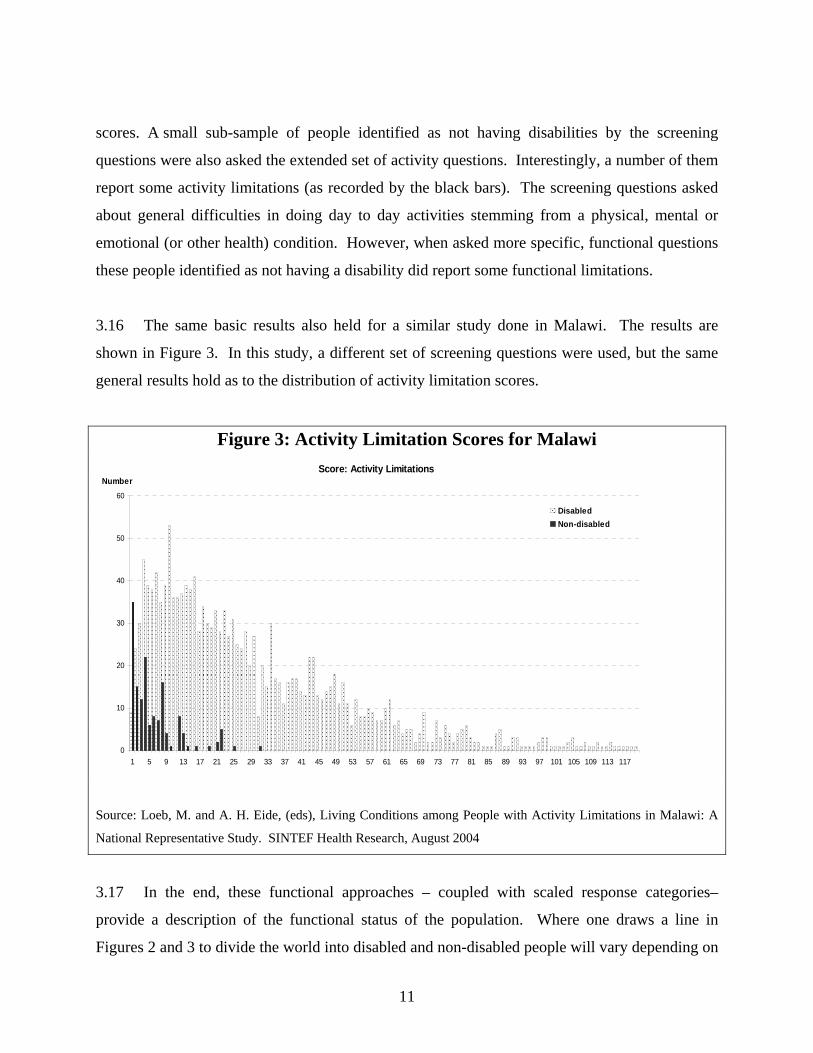
3.16 The same basic results also held for a similar study done in Malawi. The results are
shown in Figure 3. In this study, a different set of screening questions were used, but the same
general results hold as to the distribution of activity limitation scores.
Figure 3: Activity Limitation Scores for Malawi
Source: Loeb, M. and A. H. Eide, (eds), Living Conditions among People with Activity Limitations in Malawi: A
National Representative Study. SINTEF Health Research, August 2004
3.17 In the end, these functional approaches – coupled with scaled response categories–
provide a description of the functional status of the population. Where one draws a line in
Figures 2 and 3 to divide the world into disabled and non-disabled people will vary depending on
Score: Activity Limitations
0
10
20
30
40
50
60
1 5 9 13 17 21 25 29 33 37 41 45 49 53 57 61 65 69 73 77 81 85 89 93 97 101 105 109 113 117
Number
DisabledNon-disabled
12
the reason the data is being collected. For example, setting the criteria for a disability pension
system will most likely have a pretty severe cut-off for disability. On the other hand, when
considering infrastructure design – such as a transportation system – the need for identifying
people as “disabled” may not even be appropriate. What is important is that the transportation
system suits the functional status of the population.
3.18 These diagrams also point out the limitations in defining people based upon medical
diagnoses. The authors ask to consider two blind women, both aged 20 years old. One has been
blind since birth. The other was recently blinded in an accident. Although both might have the
same medical condition or impairment – that is, blindness – they will fall on very different parts
of the functional continuums shown in the above figures. The woman who has never been able
to see has spent her whole life accommodating herself to the world. She will be much further to
the left of the functional scale than the recently blinded woman. And as time goes on, the
woman who has only a short experience of living with blindness will surely migrate in that
direction as she learns new skills that meet her new condition and hopefully begins to modify her
environment to better suit her needs.
3.19 The choice of which activities to use for identifying people as having a disability is
complicated if the desire is to have a measure that is internationally comparable. Even
seemingly basic activities can create problems in making international comparisons. For
example, “dressing oneself” can take on very different connotations in a society where one
ordinarily slips into pants and a loose fitting shirt, compared to dressing in something as
complicated as a sari. The ability to tie shoelaces or button shirts – often used as metrics for
assessing hand functioning – are more or less relevant depending not only on culture but
economic status. Even “bathing oneself” is very different for someone who can turn on a spigot
as opposed to needing to travel to a community water source. This is not to say, of course, that
such questions should not be asked. But care should be taken in making international
comparisons and in writing questions to make responses from different countries as comparable
as possible.

13
3.20 International comparability becomes even more difficult with participation questions,
such as the one cited earlier from the US Current Population Survey relating to work disability.
Clearly the conditions that affect the amount or type of work someone can do differ significantly
across countries. In fact, they can even differ significantly within a country during different
economic conditions. For example, evidence suggests that disability (as measured by such a
question) and unemployment are correlated. As jobs are harder to find, the effect (real or
perceived) of having a functional limitation on securing employment can be more intense
(Stapleton and Burkhauser, 2003). Evidence from the US, UK, and the Netherlands suggests that
the rates of self-reported work disability are affected by respondents justifying the receipt of
disability benefits by overstating their work limiting disabilities (Banks, et. al 2004).
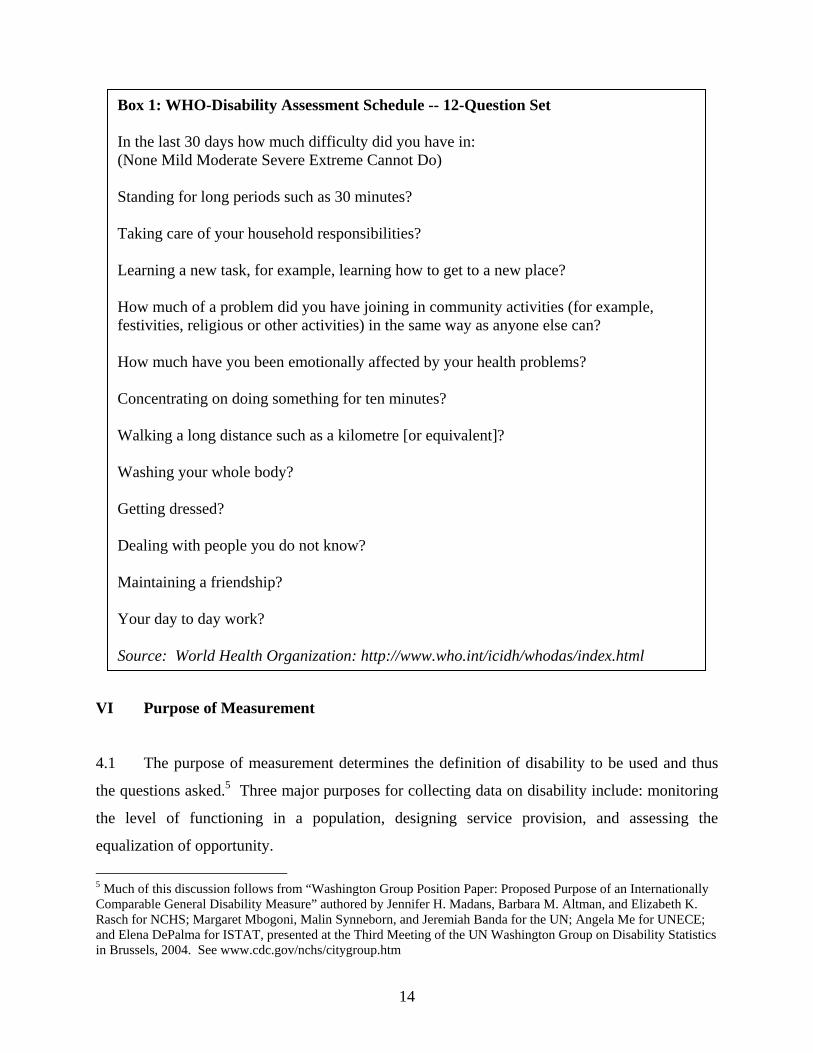
3.21 The World Health Organization has designed a set of Disability Assessment Schedules
(known as the WHO-DAS) which have a long series of activity and participation based
questions. Their 12-question set can be found in Box 1.
3.22 While some of these questions are internationally comparable (e.g., standing for long
periods), some are less so (e.g., conducting household responsibilities). Furthermore, even the
12-question WHO-DAS set is too long to be of use for a census, which many countries must rely
on due to limited resources for fielding household surveys.
3.23 Another source of questions comes from the UN Washington Group on Disability
Statistics (WG) created by the United Nations Statistical Commission created with the charge of
designing census questions that could be used to make meaningful comparisons of disability
prevalence between nations.. Before turning to their approach, however, it is important to
address the purpose behind estimating an internationally comparable measure of disability.
14
VI Purpose of Measurement
4.1 The purpose of measurement determines the definition of disability to be used and thus
the questions asked.5 Three major purposes for collecting data on disability include: monitoring
the level of functioning in a population, designing service provision, and assessing the
equalization of opportunity.
5 Much of this discussion follows from “Washington Group Position Paper: Proposed Purpose of an Internationally Comparable General Disability Measure” authored by Jennifer H. Madans, Barbara M. Altman, and Elizabeth K. Rasch for NCHS; Margaret Mbogoni, Malin Synneborn, and Jeremiah Banda for the UN; Angela Me for UNECE; and Elena DePalma for ISTAT, presented at the Third Meeting of the UN Washington Group on Disability Statistics in Brussels, 2004. See www.cdc.gov/nchs/citygroup.htm
Box 1: WHO-Disability Assessment Schedule -- 12-Question Set In the last 30 days how much difficulty did you have in: (None Mild Moderate Severe Extreme Cannot Do) Standing for long periods such as 30 minutes? Taking care of your household responsibilities? Learning a new task, for example, learning how to get to a new place? How much of a problem did you have joining in community activities (for example, festivities, religious or other activities) in the same way as anyone else can? How much have you been emotionally affected by your health problems? Concentrating on doing something for ten minutes? Walking a long distance such as a kilometre [or equivalent]? Washing your whole body? Getting dressed? Dealing with people you do not know? Maintaining a friendship? Your day to day work? Source: World Health Organization: http://www.who.int/icidh/whodas/index.html
15
4.2 Monitoring the Level of Functioning in Population – Monitoring functioning levels is
important for two purposes: 1) Understanding the scope of potential concerns relating to
disability, and 2) Evaluating interventions designed to prevent or minimize physical and
cognitive limitations, activity limitation , and participation restrictions.
4.3 In regards to the first point, the question is how high a priority should disability issues
receive? The more people who are living with particular functional limitations, the more
important the issue will be. Collecting such data also allows us to measure how many children
could benefit from a nutritional program aimed at preventing stunting, or a mental health
intervention designed to limit depression, or the removal of landmines. Measuring the impact of
preventive programs requires a description of the functional capacity of individuals.
4.4 Functional capacity, however, can be conceptualized according to all three functional
domains: Body Functioning and Structure, Activities, and Participation.. Many indicators of
functioning rely on Participation. For example, a question such as Are you limited in the kind or
amount of work you can do because of a physical, mental, or emotional problem? As a higher
order functional domain, Participation encompasses the other domains. However, the problem is
that arises from the interaction between the limitations a person has at the Body Function (or
even Activity) level with the effects of the environment. For example, maybe a mobility
limitation only limits work ability because transportation and work places are not accessible. As
environments become accessible, fewer people will answer positively to this question. So, for
example, if the goal were to determine how well the health care system is impacting the long
term effects of polio, this measured reduction in the employment of “disabled people” would be
spurious.
4.5 Nevertheless, an affirmative response to: Are you limited in the kind or amount of work
you can do because of a physical, mental, or emotional problem? does identify persons with
limitations in Participation. Persons with impairments who have successfully adapted to their
condition may be fully participating in the world of work, and would thus not be identified as
having a disability, making them indistinguishable from people without functional limitations at
the body functioning or activity levels.. If one is only interested in monitoring participatory
16
effects of disability this may not be a problem. However, this question can not address the
objective of identifying how many people with functional limitations are benefiting from
supports and accommodations.
4.6 Whether one wants to monitor functioning at the Participation level also depends on
concerns about international comparability. Body Functioning is very comparable across
cultures. Activities (like the example of bathing mentioned earlier) are less so. Participation is
quite often not at all comparable. Take for example, mild to moderate vision problems
correctable by glasses. In countries like the United States or Australia, this type of body function
limitation would have no effect on a child’s ability to attend school. In a developing country
with large classes, limited reading material, and no access to glasses or vision screening, such a
problem could very well lead to higher drop-out rates or an increased tendency to have to repeat
a grade. In fact, 40 percent of disabled children not attending school in Brazil were found to be
not attending because of vision problems correctable by glasses. A minor problem at the Body
Function level was thus being translated into a significant problem at the Participation level.
4.7 Provision of Services – Another important purpose for collecting data on disability is to
design and implement programs aimed at providing services to disabled people. Sometimes
these might be general services that are being made more inclusive. Sometimes they may be
specific services targeted at disabled people, or even targeted at a particular subset of disabled
people (e.g., providing prosthetic devices and the associated rehabilitation services). This
purpose requires more extensive information than simply monitoring the functioning of the
population. For that reason census questions, which are generally limited in number and
specificity, are inappropriate. Someone designing a service delivery program would need
detailed information on peoples’ functioning levels, the supports that people have available to
them within their family and within their community, and environmental characteristics.
4.8 For example, suppose you were designing a program for people with vision problems.
You would need to know how many people were blind as opposed to how many people had
some limited vision they could utilize, and how many had problems that were correctable by
glasses. If the plan was to design an on-site program, you would need to know their ability to
17
travel to the center to receive services. Their ability to travel, of course, would be a function of
the extent of their vision problems, the presence of other functional limitations, the accessibility
of transportation systems, and the resources (monetary and non-monetary) that they could
employ.
4.9 For this reason, disability information gathered from censuses is not appropriate. For
designing services, it is much better to have an extensive household survey or administrative
database that is designed with an idea in mind of what services are going to be delivered.
4.10 Equalization of Opportunities – Another reason for collecting disability data is to assess
the impact of having a limitation on individuals and their families. The goal of inclusive
development is to enable all people to have equal opportunities when it comes to partaking in the
economic and social lives of their communities. How can we measure this equalization of
opportunity? Since the goal is for everyone to participate equally in society, it is tempting to use
questions that address the domain of Participation directly. This approach, however, can be quite
problematic for the reasons stated earlier.
4.11 For example, consider again the question, Are you limited in the kind or amount of work
you can do because of a physical, mental, or emotional problem? Suppose a young deaf woman
is having difficulty finding work and thus feels limited in her employment. She answers this
question “yes” and is classified as disabled, and thus contributes to a negative correlation
between employment and disability. Now, say that she finds an accommodating employer that
values her services and she becomes fully employed. When asked this same question, she could
quite easily answer “no” and thus be classified as non-disabled. Being “non-disabled”, she will
not contribute to a positive correlation between employment and disability. In fact, as
accommodations and supports expand and more disabled people get jobs, fewer of them will say
they are limited in the amount or kind of work they can do. That will mean that the people
remaining in the disabled category will, on average, be more limited in their functioning level.
So you could get the perverse result that as a society becomes more inclusive, the wellbeing of
its (measured) disabled population will decrease!

18
4.12 Therefore, the appropriate approach for looking at the equalization of opportunities and
well-being is to focus on basic action/activity questions. Disability thus defined could be
correlated with outcomes such as employment or education. If there is no correlation then
disabled people have equal opportunities. If there is a negative correlation, then they are worse
off. In essence, this would be a way of measuring the inclusiveness of the society. If people
with various limitations are identified as not having equivalent outcomes, more detailed surveys
could uncover the most damaging barriers that need to be addressed.
V Census Questions for Disability Prevalence
5.1 When considering what questions to put on a census, the WG had to consider the purpose
for including disability questions. It is impossible in a census to capture the full richness of
human functioning -- either by type of disability (physical, mental, sensory, psychological) or by
functional domain (body structure/function, activities, and participation). Even more difficult
would be to capture that all within the social model of disability where disability arises from the
interaction between functional status and the environment. And as stated above, the goal was to
produce general prevalence measures that were internationally comparable.
5.2 The WG membership agreed that a general prevalence rate that could be captured in a
census should address the "Equalization of Opportunities" purpose. The questions thus focus on
4-6 basic core activities designed to capture the great bulk of disabled adults. People identified as
disabled and non-disabled according to these questions can be compared to see if differences
exist in employment levels, income, education, marital status, home ownership, etc since all
those other data are already collected on most censuses. If people identified as having
disabilities, when compared to those without disabilities, experience worse outcomes, that would
be evidence of the extent to which disabled people do not have the same opportunities to be
included in social and economic life as non-disabled people. This information can be used by
policy officials and program managers to design mechanisms so that persons with disabilities
will be included and participation levels will become equal for those with and without disability.
19
5.3 Box 2 contains a series of six questions recently endorsed by the WG for use as census
questions. While they are not adequate to be used as screening questions - since they miss
certain subpopulations, such as a fair number of those with mental health conditions – they do
generate a recognizable group that encompasses a majority of people with disabilities6. The first
three questions – on vision, hearing, and walking – tend to pick up a large majority of people
with sensory or physical disabilities. The self-care question identifies many people who have
upper-body mobility issues. And the cognition, communication and self-care questions were
shown in pre-tests to capture at least some of those with psychological problems.
5.4 Screening questions for mental disabilities tend to focus on four components: learning,
making decisions, remembering, and concentrating. The WG chose to focus on the latter two
because the concepts of learning and decision making vary more across different cultures and
economic situations. Moreover, listing all four components in a single question is problematic
because respondents often get confused as to whether they must have problems with all four
concepts in order to answer positively. A preferred way of identifying mental disabilities would
be to ask each of these questions individually – learning, remembering, concentrating, making
6 Many people with mental health disabilities will be picked up, however. Those with conditions that are serious enough to limit the ability to care for oneself, for example. The questions on remembering, concentrating, and communicating will also pick up some people with mental health conditions.
Box 2: Census Questions on Disability Designed by UN Washington Group on Disability Statistics Because of a physical, mental, or emotional health condition… 1. Do you have difficulty seeing even if wearing glasses? 2. Do you have difficulty hearing even if using hearing aid/s or are you deaf? 3. Do you have difficulty walking or climbing stairs? 4. Do you have difficulty remembering or concentrating? 5. Do you have difficulty (with self-care such as) washing all over or dressing? 6. Do you have difficulty communicating (for example, understanding or being understood by others)? Question response categories: No, Some, A lot, and Unable. Source: http://www.cdc.gov/nchs/citygroup.htm
20
decisions, and communicating. Unfortunately, space limitations often require combining or
eliminating concepts.
5.5 Another possible screen for significant limitations in mental functioning is difficulty
communicating, which also overlaps with other types of functional limitations such as deafness –
The concept of “communication” refers to being able to understand and be understood by others.
5.6 Another approach to identifying people as having a disability, and that is incorporated in
the fifth WG question, deals with self-care, and is thus related to ADLs. In truth, the self-care
question is somewhat different in nature from the other questions, in that it focuses on a higher
activity level. It was included in the WG questions because of the strong desire of countries to
identify that subset of the population at risk for needing safety net services. However, as stated
above, these questions must be interpreted carefully when making international comparisons
5.7 Even questions that focus on more basic activities, such as do you have difficulty seeing?
can miss people with important functional limitations if not worded carefully. The National
Center for Health Statistics in the United States found in their cognitive testing of proposed
disability questions that blind people often answered “no” to such a question. Their reasoning
was, “how can I have difficulties doing something when I cannot do it in the first place?” That is
why the clause “or are you blind” is often incorporated into vision questions, although it is not in
the WG question since “Unable” is included as a response category.
General Prevalence Measures
5.8 Drawing upon the previous discussion, a person should be categorized as having a
disability for the purpose of a general disability prevalence measure based on:
1) Having some difficulty in a core, basic action/activity, such as seeing, hearing,
walking, and some measure of mental functioning. Self care can be included if there
is a desire to identify the most significantly limited group.
21
2) If international comparability is a priority, it would be best if the mental functioning
question centered on remembering and concentrating The activity of learning
involves expectations and standards that are more culturally defined.
3) Functioning should be recorded without the use of assistive devices, except for
glasses or possibly hearing aids. The appropriate purpose for a census based prevalence
measure is “equalization of opportunities.” Asking for functioning with the presence of
assistive devices undermines this purpose. Such devices can serve to equalize
opportunities, so we want to capture their effect, not exclude people from the population
of disabled people who are functioning well because they have them. Glasses, however,
are so readily available that respondents will automatically factor them into their answers.
4) Multiple prevalence measures should be used to capture different severity levels.
Due to the wide range in the degree of functional limitations, in addition to a general
disability rate, a rate of severe or significant disability should also be reported. This will
not only highlight the heterogeneity of this population, but serve as a useful breakdown
for policymakers trying to identify populations that have different needs.
Pre-Testing of Washington Group Questions
5.9 Recently the WG cognitively tested its census questions in 16 countries, field tested them
in Vietnam and South Africa. The WG questions were also field-tested by WHO and UNESCAP
in The Philippines, Fiji, India, Indonesia, and Mongolia.
5.10 The cognitive testing undertaken by the WG involved interviewing a selected sample of
diverse respondents to obtain a better understanding of what respondents thought the questions
were asking and how respondents formulated their answers. These interviews included asking an
extended set of more detailed questions about each functional domain, and then compared those
responses to the response to the WG question to see if the population identified as having a
disability with the WG question was actually the targeted population. For example, for the self-
care question a series of questions were asked about dressing, feeding, fine motor skills, etc. The
22
results from these cognitive tests were very promising and lead to the WG endorsing their
questions at their most recent annual meeting in Uganda in 2006.7
5.11 The results of the WHO/UNESCAP-tests show the wide variation in disability rates that
can be generated depending on what is considered the cut-off for disability. They also highlight
the difficulty of coming up with questions that are internationally comparable and still suited for
a census.
5.12 In reviewing these data it is important to note that the samples drawn were not nationally
representative. Therefore, these test results should not be interpreted as national prevalence
rates. However, they are probably indicative of the variation that exits in these populations and
they are similar to results reported later in the paper that are drawn from representative samples.
The number of respondents for the six questions in each of the five study countries can be found
in Table 4.
5.13 The WHO/UNESCAP testing was to get a sense of how the questions worked, rather than
on reporting prevalence rates. The purpose of examining these data is to obtain a sense of the
complexity of asking about disability, and the effect of employing different approaches –
especially in regards to severity cut-offs.
5.14 Table 4 shows the responses to the question, Do you have difficulty seeing even if
wearing glasses or are you blind? Mild refers to people who reported some difficulty, severe
corresponds to a lot of difficulty, and complete corresponds to a respondent being unable to see.
7 The results from these tests are currently being written up into a report. Presentations of the cognitive tests can be found at the WG website: http://www.cdc.gov/nchs/citygroup.htm
23
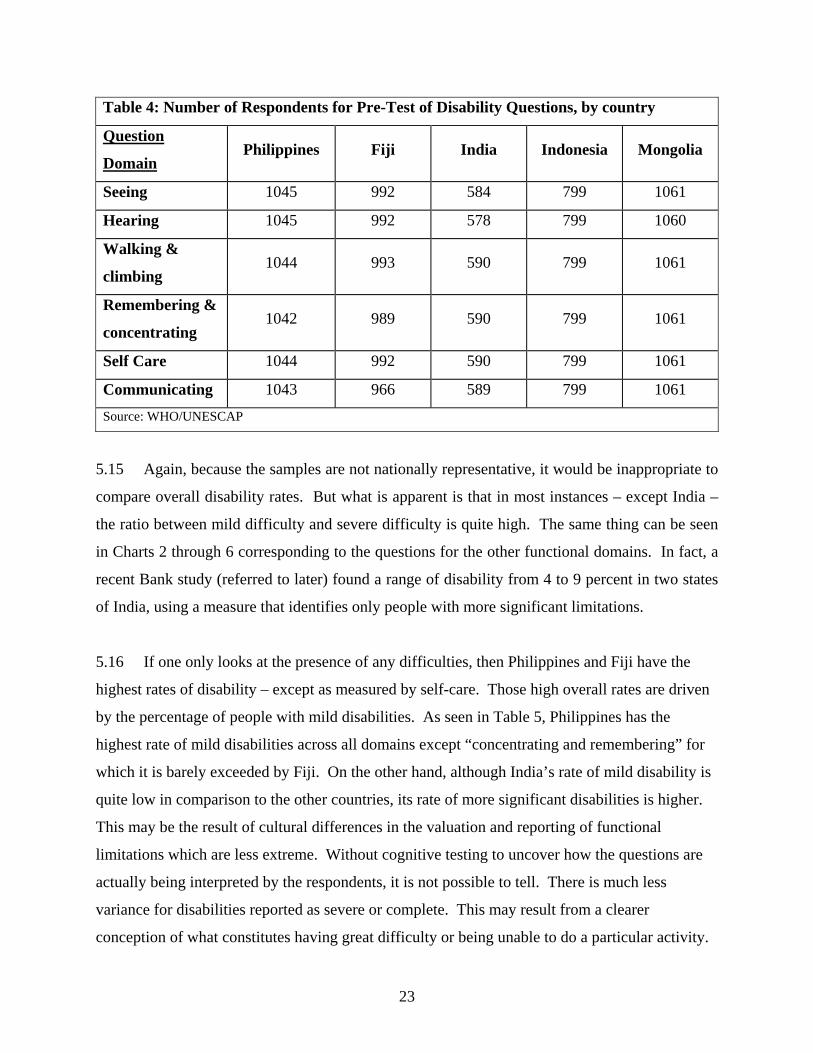
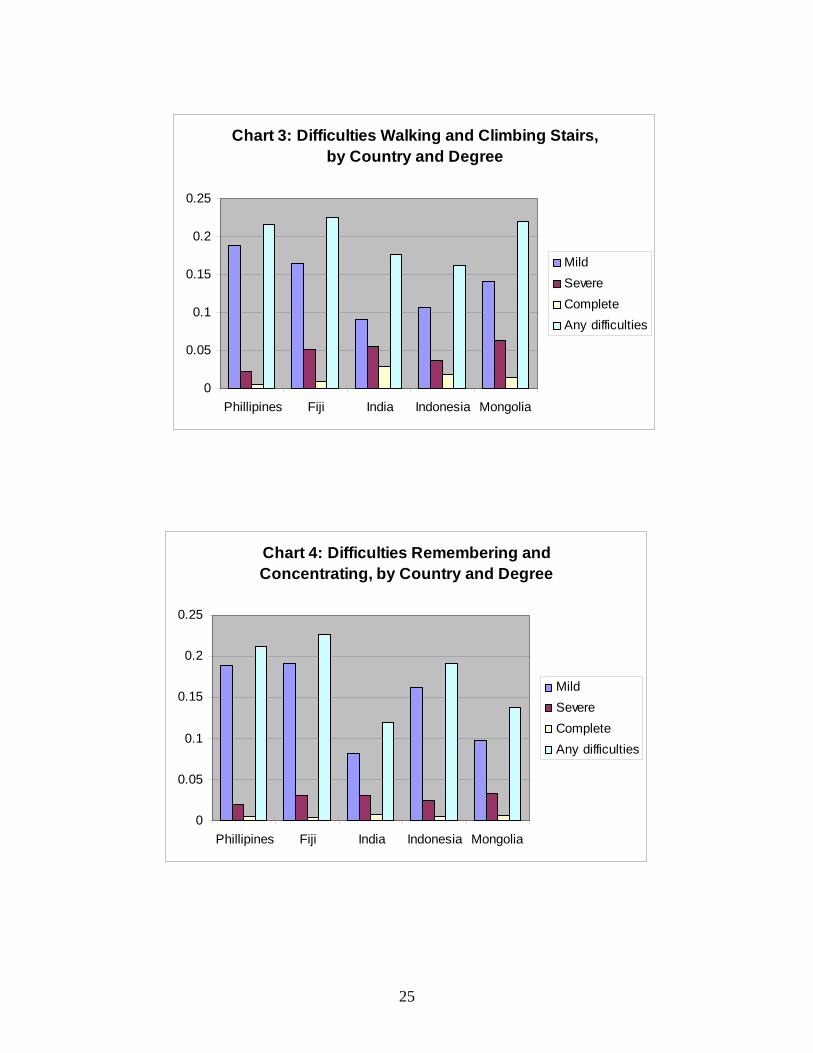
5.15 Again, because the samples are not nationally representative, it would be inappropriate to
compare overall disability rates. But what is apparent is that in most instances – except India –
the ratio between mild difficulty and severe difficulty is quite high. The same thing can be seen
in Charts 2 through 6 corresponding to the questions for the other functional domains. In fact, a
recent Bank study (referred to later) found a range of disability from 4 to 9 percent in two states
of India, using a measure that identifies only people with more significant limitations.
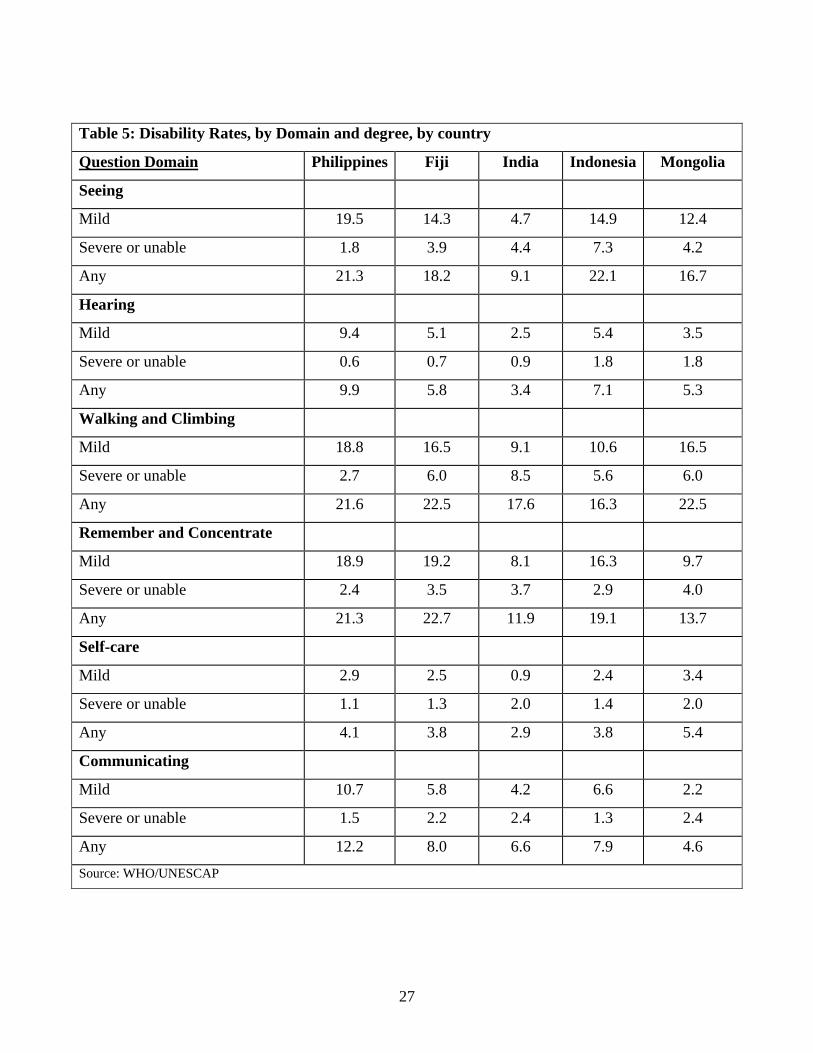
5.16 If one only looks at the presence of any difficulties, then Philippines and Fiji have the
highest rates of disability – except as measured by self-care. Those high overall rates are driven
by the percentage of people with mild disabilities. As seen in Table 5, Philippines has the
highest rate of mild disabilities across all domains except “concentrating and remembering” for
which it is barely exceeded by Fiji. On the other hand, although India’s rate of mild disability is
quite low in comparison to the other countries, its rate of more significant disabilities is higher.
This may be the result of cultural differences in the valuation and reporting of functional
limitations which are less extreme. Without cognitive testing to uncover how the questions are
actually being interpreted by the respondents, it is not possible to tell. There is much less
variance for disabilities reported as severe or complete. This may result from a clearer
conception of what constitutes having great difficulty or being unable to do a particular activity.
Table 4: Number of Respondents for Pre-Test of Disability Questions, by country
Question
Domain Philippines Fiji India Indonesia Mongolia
Seeing 1045 992 584 799 1061
Hearing 1045 992 578 799 1060
Walking &
climbing 1044 993 590 799 1061
Remembering &
concentrating 1042 989 590 799 1061
Self Care 1044 992 590 799 1061
Communicating 1043 966 589 799 1061 Source: WHO/UNESCAP

24
Chart 1: Difficulties Seeing, by Country and Degree
0
0.05
0.1
0.15
0.2
0.25
Phillipines Fiji India Indonesia Mongolia
MildSevereCompleteAny difficulties
Chart 2: Difficulties Hearing, by Country and Degree
0
0.02
0.04
0.06
0.08
0.1
0.12
Phillipines Fiji India Indonesia Mongolia
MildSevereCompleteAny difficulties
25
Chart 3: Difficulties Walking and Climbing Stairs, by Country and Degree
0
0.05
0.1
0.15
0.2
0.25
Phillipines Fiji India Indonesia Mongolia
MildSevereCompleteAny difficulties
Chart 4: Difficulties Remembering and Concentrating, by Country and Degree
0
0.05
0.1
0.15
0.2
0.25
Phillipines Fiji India Indonesia Mongolia
MildSevereCompleteAny difficulties

26
Chart 5: Difficulties with Self Care, by Country and Degree
0
0.01
0.02
0.03
0.04
0.05
0.06
Phillipines Fiji India Indonesia Mongolia
MildSevereCompleteAny difficulties
Chart 6: Difficulties Communicating, by Country and Degree
0
0.02
0.04
0.06
0.08
0.1
0.12
0.14
Phillipines Fiji India Indonesia Mongolia
MildSevereCompleteAny difficulties
27
Table 5: Disability Rates, by Domain and degree, by country
Question Domain Philippines Fiji India Indonesia Mongolia
Seeing
Mild 19.5 14.3 4.7 14.9 12.4
Severe or unable 1.8 3.9 4.4 7.3 4.2
Any 21.3 18.2 9.1 22.1 16.7
Hearing
Mild 9.4 5.1 2.5 5.4 3.5
Severe or unable 0.6 0.7 0.9 1.8 1.8
Any 9.9 5.8 3.4 7.1 5.3
Walking and Climbing
Mild 18.8 16.5 9.1 10.6 16.5
Severe or unable 2.7 6.0 8.5 5.6 6.0
Any 21.6 22.5 17.6 16.3 22.5
Remember and Concentrate
Mild 18.9 19.2 8.1 16.3 9.7
Severe or unable 2.4 3.5 3.7 2.9 4.0
Any 21.3 22.7 11.9 19.1 13.7
Self-care
Mild 2.9 2.5 0.9 2.4 3.4
Severe or unable 1.1 1.3 2.0 1.4 2.0
Any 4.1 3.8 2.9 3.8 5.4
Communicating
Mild 10.7 5.8 4.2 6.6 2.2
Severe or unable 1.5 2.2 2.4 1.3 2.4
Any 12.2 8.0 6.6 7.9 4.6 Source: WHO/UNESCAP
28
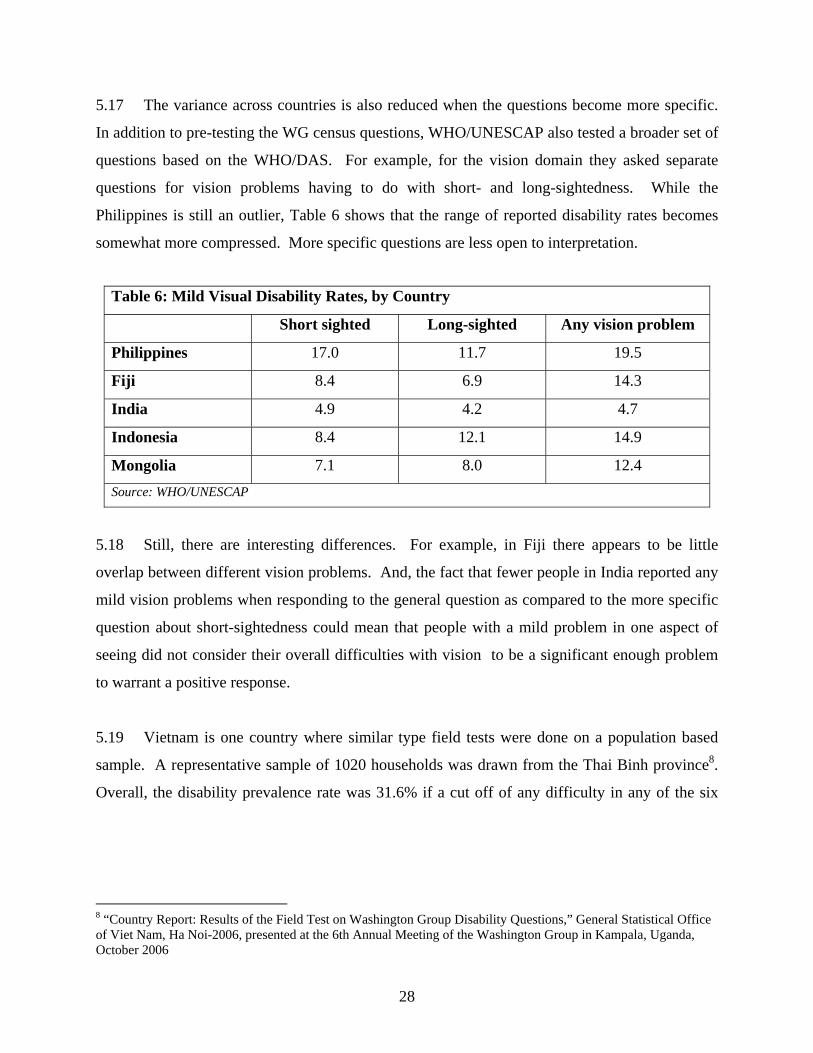
5.17 The variance across countries is also reduced when the questions become more specific.
In addition to pre-testing the WG census questions, WHO/UNESCAP also tested a broader set of
questions based on the WHO/DAS. For example, for the vision domain they asked separate
questions for vision problems having to do with short- and long-sightedness. While the
Philippines is still an outlier, Table 6 shows that the range of reported disability rates becomes
somewhat more compressed. More specific questions are less open to interpretation.
5.18 Still, there are interesting differences. For example, in Fiji there appears to be little
overlap between different vision problems. And, the fact that fewer people in India reported any
mild vision problems when responding to the general question as compared to the more specific
question about short-sightedness could mean that people with a mild problem in one aspect of
seeing did not consider their overall difficulties with vision to be a significant enough problem
to warrant a positive response.
5.19 Vietnam is one country where similar type field tests were done on a population based
sample. A representative sample of 1020 households was drawn from the Thai Binh province8.
Overall, the disability prevalence rate was 31.6% if a cut off of any difficulty in any of the six
8 “Country Report: Results of the Field Test on Washington Group Disability Questions,” General Statistical Office of Viet Nam, Ha Noi-2006, presented at the 6th Annual Meeting of the Washington Group in Kampala, Uganda, October 2006
Table 6: Mild Visual Disability Rates, by Country
Short sighted Long-sighted Any vision problem
Philippines 17.0 11.7 19.5
Fiji 8.4 6.9 14.3
India 4.9 4.2 4.7
Indonesia 8.4 12.1 14.9
Mongolia 7.1 8.0 12.4 Source: WHO/UNESCAP
29
domains was used, 10.0% if the “a lot of difficulty” cut-off was used, and 2.6% if the “unable”
cutoff was used.9
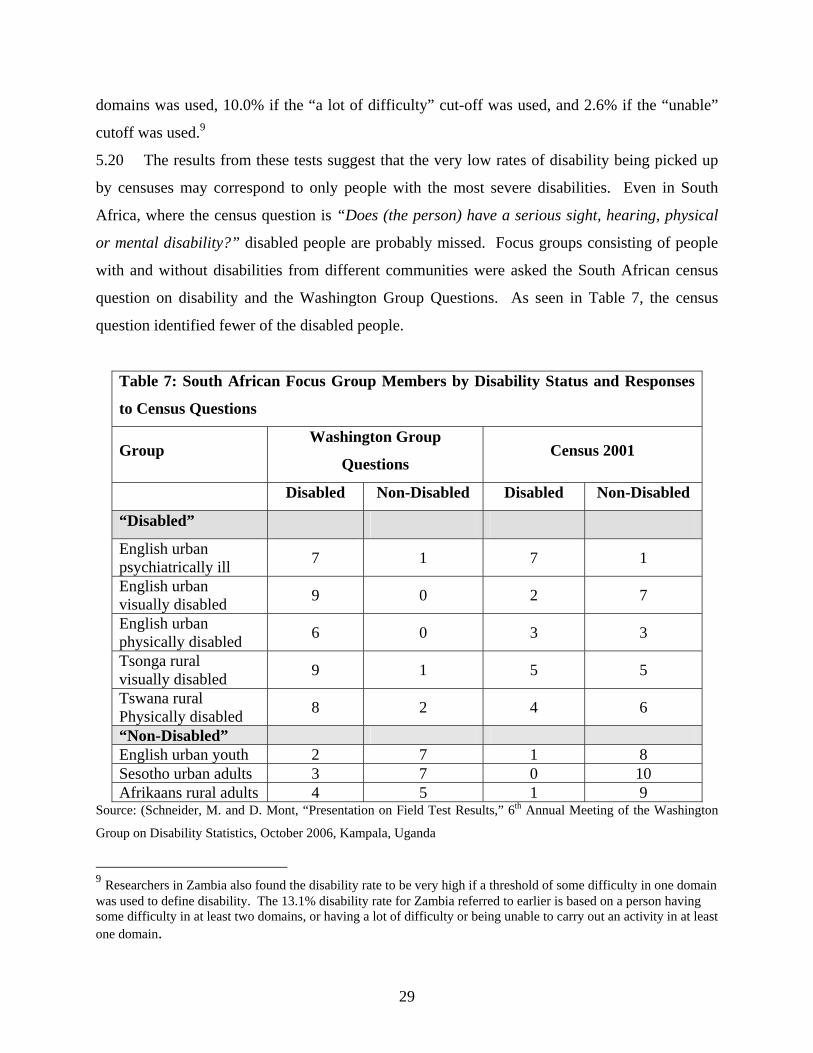
5.20 The results from these tests suggest that the very low rates of disability being picked up
by censuses may correspond to only people with the most severe disabilities. Even in South
Africa, where the census question is “Does (the person) have a serious sight, hearing, physical
or mental disability?” disabled people are probably missed. Focus groups consisting of people
with and without disabilities from different communities were asked the South African census
question on disability and the Washington Group Questions. As seen in Table 7, the census
question identified fewer of the disabled people.
Table 7: South African Focus Group Members by Disability Status and Responses
to Census Questions
Group Washington Group
Questions Census 2001
Disabled Non-Disabled Disabled Non-Disabled
“Disabled”
English urban psychiatrically ill 7 1 7 1
English urban visually disabled 9 0 2 7
English urban physically disabled 6 0 3 3
Tsonga rural visually disabled 9 1 5 5
Tswana rural Physically disabled 8 2 4 6
“Non-Disabled” English urban youth 2 7 1 8 Sesotho urban adults 3 7 0 10 Afrikaans rural adults 4 5 1 9
Source: (Schneider, M. and D. Mont, “Presentation on Field Test Results,” 6th Annual Meeting of the Washington
Group on Disability Statistics, October 2006, Kampala, Uganda
9 Researchers in Zambia also found the disability rate to be very high if a threshold of some difficulty in one domain was used to define disability. The 13.1% disability rate for Zambia referred to earlier is based on a person having some difficulty in at least two domains, or having a lot of difficulty or being unable to carry out an activity in at least one domain.
30
5.21 The next section summarizes the results from three nationally representative studies in
Latin America that use a functional (body function, activity or participation) based approach in
keeping with the spirit of the ICF and the WG.
VI Case Studies: Disability in Brazil, Ecuador and Nicaragua
6.1 Recently, Brazil, Ecuador, and Nicaragua collected data on disability based on a
functional approach consistent with the ICF. Brazil incorporated questions on disability into
their last national census, and experienced a dramatic rise in the measured prevalence of
disability as compared to their last census -- 14.5% as opposed to 0.9%.10 Ecuador and
Nicaragua implemented disability surveys which recorded prevalence rates of 12.1% and 10.3%,
respectively (Flores, et. al. 2005, INEC, 2003)
6.2 The Brazilian census questions from 1991 and 2000 are shown in Box 3. The question
generating the very low rate of disability prevalence asks the respondent to respond to whether or
not they have a very specific set of conditions. The more recent questions expand to cover the
difficulty to do particular activities, and to record various degrees of difficulty.11
6.3 Questions from Ecuador and Nicaragua are much more detailed because they come from
surveys dedicated to the disability issue, but they follow the same basic philosophy and draw
heavily from the WHO-DAS. Questions attempt to gauge how much difficulty respondents have
doing basic activities. If a person has difficulty in any of the functional domains examined
(physical, sensory, cognitive, or psychosocial), then they are considered to have a disability.
Box 4, for example, shows the Nicaraguan questions on comprehension and communication.
10 Bercovich (2004) and Fundacao Instituto Brasileiro de Geografia e Estastistica - IBGE, Censo Demografico, 1991, Caracteristicas Gerais da Populacao e Instrucao, No. 1 (1996). 11 Note that mental disabilities relating to cognition and psycho-social disabilities relating to mental health are still excluded.

31
Box 3: Brazilian Census Questions on Disability 1991 Do you have any of the following physical or mental disabilities?
1. Blindness 2. Deafness 3. Paralysis of one side of the body 4. Paralysis of the legs 5. Total paralysis 6. Loss of a leg, hand, foot, or thumb 7. Mental disability 8. Other 9. None of the above
2000 1. Do you have any permanent mental disability that restricts your daily activities? (such as working, attending school, playing, etc.) -Yes/ No 2. How do you evaluate your capacity to see? (With glasses or contact lenses, if used) - Unable - Severe permanent difficulty - Some permanent difficulty - No difficulty 3. How do you evaluate your capacity to hear? (With hearing aid, if used) - Unable - Severe permanent difficulty - Some permanent difficulty - No difficulty 4. How do you evaluate your capacity to walk / climb stairs? (With prosthesis, walking stick or an auxiliary devise, if used) - Unable - Severe permanent difficulty - Some permanent difficulty - No difficulty 5. Do you have any of the following impairments? (Choose only the first that applies based on the order of the list below) - Permanent total paralysis - Permanent paralysis of the legs - Permanent paralysis of one side of the body - Loss of a leg, arm, hand, foot or thumb - None of the above
Source: UN Statistics Division website at http://unstats.un.org/unsd/demographic/sconcerns/disability/disabmethods.aspx?id=United%20States%20of%20America

32
6.4 The overall rates of disability in the three countries are similar. Also, males have a
slightly lower rate of disability than females (Table 8). This gender difference is at least in part
due to the fact that women live longer, since disability is strongly correlated with age. In Brazil,
Table 8: Disability Rates, by Gender by Country
Total Male Female
Brazil 14.5 13.7 15.3
Ecuador 12.1 11.8 12.4
Nicaragua 10.3 9.1 11.3
for example, the rate of disability for people over the age of 65 is 54%. However, it does not tell
the whole story. In Nicaragua the rates of disability are very similar for men and women up until
Box 4: Questions on Comprehension and Communication from Nicaragua Do you have difficulty learning a new skill, for example learning how to get to a new place or to play a new game? Do you have difficulty concentrating on an activity for longer than 10 minutes? Do you have difficulty remembering important things that you have to do on a daily basis? Do you have difficulty finding solutions to problems of daily life? Do you have difficulty understanding or being understood by others? Do you have difficulty starting or maintaining a conversation? For every positive response, the following questions are then asked: How much difficulty do you have? A little, Some, A lot, A great deal (or are unable to do it)? How much has this difficulty affected our life? Not at all, a little, A lot, A great deal, Completely? Source: INEC
33
Chart 7: Mobility Difficulties in Nicaragua, by age and gender, 2003
0
5
10
15
20
25
30
35
6 to 19 20 to 39 40 to 49 50 to 59 60 to 69 70 and up
Age Groups
Perc
enta
ge Men
Women
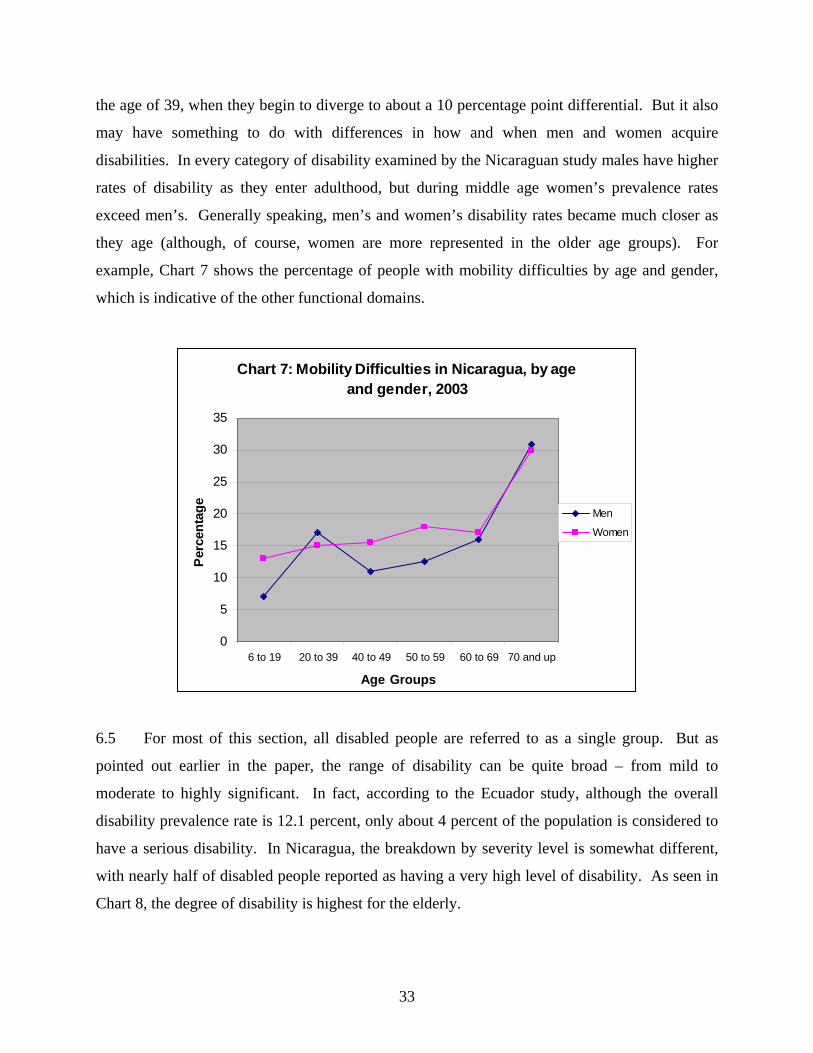
the age of 39, when they begin to diverge to about a 10 percentage point differential. But it also
may have something to do with differences in how and when men and women acquire
disabilities. In every category of disability examined by the Nicaraguan study males have higher
rates of disability as they enter adulthood, but during middle age women’s prevalence rates
exceed men’s. Generally speaking, men’s and women’s disability rates became much closer as
they age (although, of course, women are more represented in the older age groups). For
example, Chart 7 shows the percentage of people with mobility difficulties by age and gender,
which is indicative of the other functional domains.
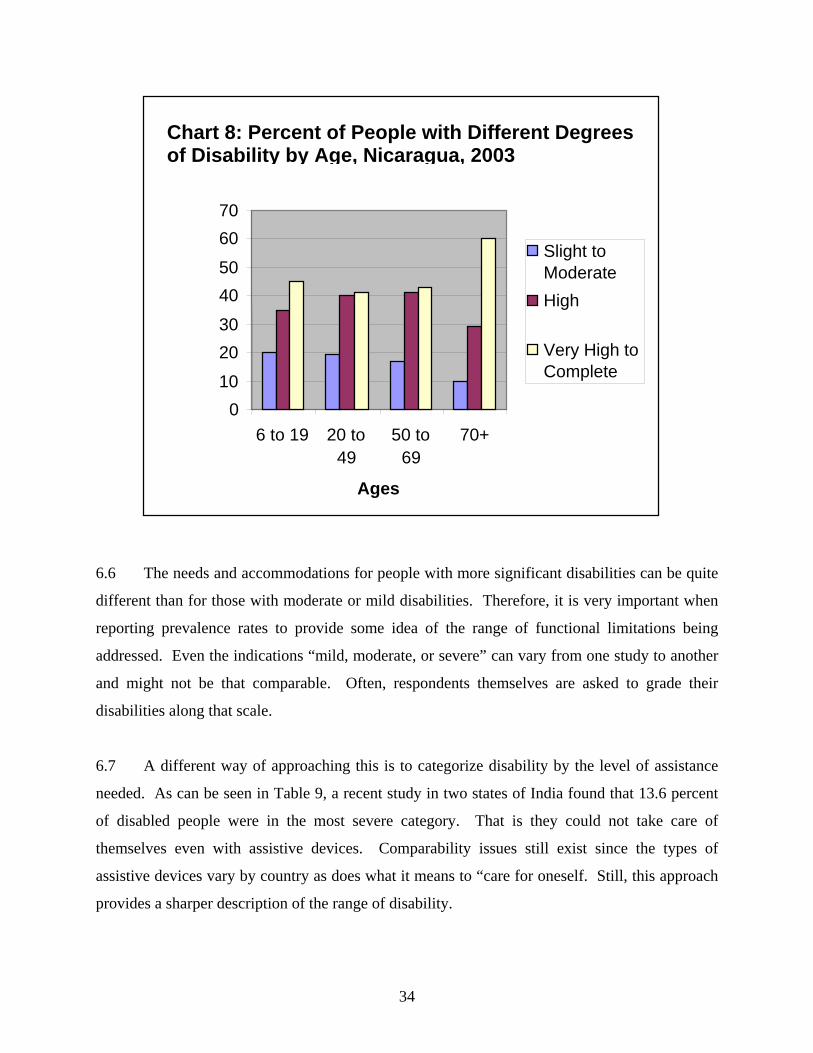
6.5 For most of this section, all disabled people are referred to as a single group. But as
pointed out earlier in the paper, the range of disability can be quite broad – from mild to
moderate to highly significant. In fact, according to the Ecuador study, although the overall
disability prevalence rate is 12.1 percent, only about 4 percent of the population is considered to
have a serious disability. In Nicaragua, the breakdown by severity level is somewhat different,
with nearly half of disabled people reported as having a very high level of disability. As seen in
Chart 8, the degree of disability is highest for the elderly.
34
6.6 The needs and accommodations for people with more significant disabilities can be quite
different than for those with moderate or mild disabilities. Therefore, it is very important when
reporting prevalence rates to provide some idea of the range of functional limitations being
addressed. Even the indications “mild, moderate, or severe” can vary from one study to another
and might not be that comparable. Often, respondents themselves are asked to grade their
disabilities along that scale.
6.7 A different way of approaching this is to categorize disability by the level of assistance
needed. As can be seen in Table 9, a recent study in two states of India found that 13.6 percent
of disabled people were in the most severe category. That is they could not take care of
themselves even with assistive devices. Comparability issues still exist since the types of
assistive devices vary by country as does what it means to “care for oneself. Still, this approach
provides a sharper description of the range of disability.
Chart 8: Percent of People with Different Degrees of Disability by Age, Nicaragua, 2003
0
10
20
30
40
50
60
70
6 to 19 20 to49
50 to69
70+
Ages
Slight toModerate
High
Very High to Complete

35
Table 9: Reported extent of disability among Disabled People in Uttar
Pradesh and Tamil Nadu, India, 2002
Extent of disability Share of all Disabled People
Can not take care of self even with aid-appliance 13.6%
Can take care of self only with aid-appliance 17.2%
Can take care of self without aid-appliance 60.2%
Aid-appliance not tried/available 9.0% Source: World Bank, “People with Disabilities in India: From Commitments to Outcomes, 2006.
VII Conclusions
7.1 This paper reviewed the concept of disability and its measurement and set forth a
standard for defining disability suitable for developing internationally comparable measurement
procedures in order to provide comparable prevalence rates (a checklist of good measurement
practices is provided in Box 4). That is, to report the percentage of people with a limitation in at
least one of the core functional domains, as outlined by the ICF and as implemented by the UN’s
Washington Group on Disability Statistics. This coincides with the basic trend of measuring
functional limitations, rather than disability.
7.2 However, it is important to note that the situation and the threshold at which a functional
limitation is considered to be a disability will be different depending on the purpose of
measurement. Therefore, when reporting general prevalence it is best to provide some notion of
the range of disability. For example, in Ecuador the disability prevalence rate is 12.1 percent,
but the rate of severe disability is about 4 percent.
36
7.3 Overall, as generally defined, disabled people represent a significant proportion of the
world's population. Data from developed countries and some recent studies in developing
countries (Brazil, Ecuador, India, Nicaragua, Vietnam, and Zambia) suggest that an estimate of
10-12 percent is not unreasonable.
7.4 Different countries will report different prevalence rates and that is expected. For a
variety of reasons, a country might want to use a different set of functional domains or would
prefer to use a different severity threshold for classifying people as being disabled. However, it
is highly recommended that countries use similar types of limitations with a range of categories
to allow for a representation of some of the continuum. Furthermore, they should try as much as
possible to use actions and terminologies that allow for comparability across cultural contexts.
By doing so, the prevalence estimates they report will be more understandable, more useful for
benchmarking, and more in line with the social model of disability which is most conducive for
building inclusive development policies to better the lives of the entire population.
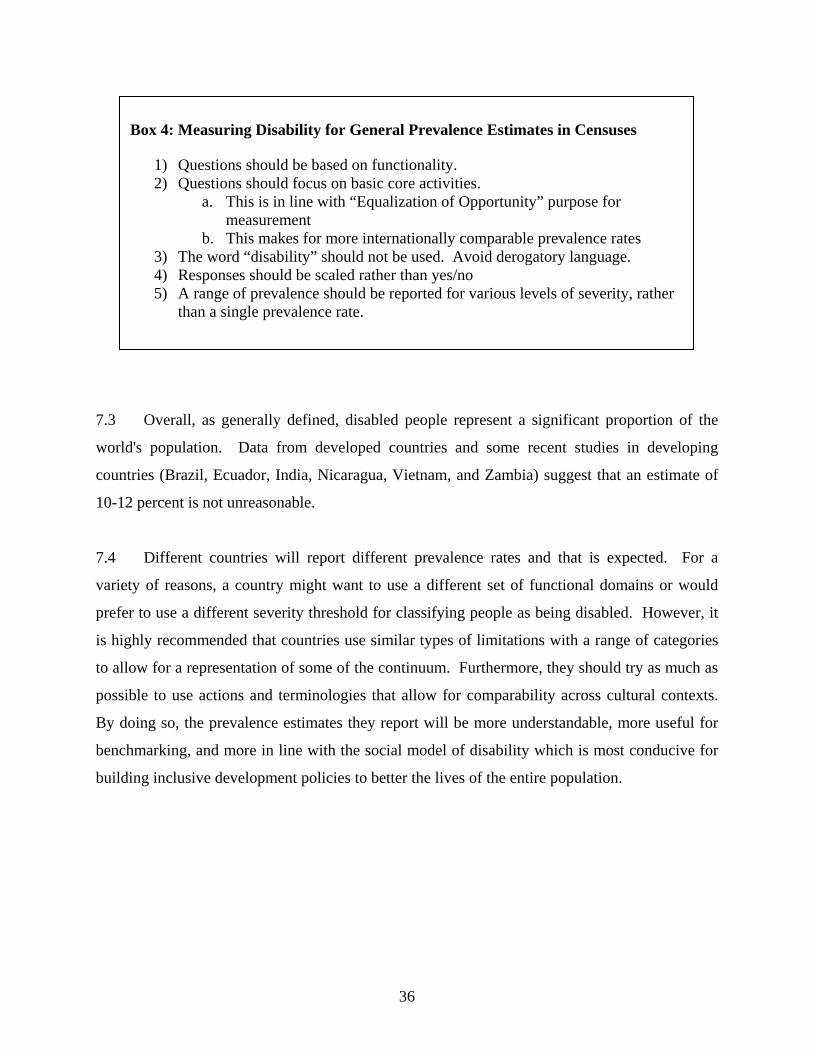
Box 4: Measuring Disability for General Prevalence Estimates in Censuses
1) Questions should be based on functionality. 2) Questions should focus on basic core activities.
a. This is in line with “Equalization of Opportunity” purpose for measurement
b. This makes for more internationally comparable prevalence rates 3) The word “disability” should not be used. Avoid derogatory language. 4) Responses should be scaled rather than yes/no 5) A range of prevalence should be reported for various levels of severity, rather
than a single prevalence rate.

37
VIII References
Banks, J., A. Kapteyn, J. P. Smith, A. Van Soest. “International Comparisons of Work
Disability.” Working Paper WR-155, Rand Corporation, April 2004. Bercovich, A. “People with disability in Brazil: a look at 2000 Census results.” Working Paper
of Instituto Brasileiro de Geografia e Estastistica (IBGE), 2004. Barbotte, E., F. Guillemin, N. Chau, and the Lorhandicap Group. “Prevalence of impairments,
disabilities, handicaps and quality of life in the general population: a review of recent literature.” Bulletin of the World Health Organization, 79(11): 1047-55 2001.
Flores, R., D. Yepez, and M. Pramatarova. “Ecuador: La Discapacidad en Cifras,” INEC
(Ecuador), 2005. General Statistical Office of Viet Nam. “Country Report: Results of the Field Test on
Washington Group Disability Questions.” Ha Noi-2006, presented at the 6th Annual Meeting of the Washington Group in Kampala, Uganda, October 2006.
Hughes, B. and K. Paterson. “The Social Model of Disability and the Disappearing Body:
towards a sociology of impairment.” Disability and Society 12(3):325-340, June 1997. INEC (Nicaragua). “Encuesta Nicaraguense para Personas con Discapacidad.” ENDIS 2003. Loeb, M. and A. H. Eide, (eds). Living Conditions among People with Activity Limitations in
Malawi: A National Representative Study. SINTEF Health Research, August 2004. Eide A.H. and M. Loeb, (eds). Living Conditions among People with Activity Limitations in
Zambia: A National Representative Study. SINTEF Health Research, August 2006. Madans, Jennifer H., Barbara M. Altman, Elizabeth K. Rasch, Margaret Mbogoni, Malin
Synneborn, Jeremiah Banda; Angela Me, and Elena DePalma. “Washington Group Position Paper: Proposed Purpose of an Internationally Comparable General Disability Measure.” February 2004.
Pizzolitto, G. “Informe sobre Personas con Discapacidad en Nicaragua.” Working Paper, IDB,
2006. Rietschlin, J. and A. MacKenzie. “Variation in Disability Rates in Statistics Canada National
Surveys: Building Policy on a Slippery Foundation.” Proceedings of Statistics Canada Symposium, Catalogue no. 11-522-XIE, 2004.
Schneider, M. and D. Mont. “Presentation on Field Test Results.” 6th Annual Meeting of the
Washington Group on Disability Statistics, Kampala, Uganda, October 2006.
38
Shakespeare, T. and N. Watson, “Defending the Social Model.” Disability and Society, 12(2):293-300, April 1997.
Stapleton, D. and R. Burkhauser (eds). The Decline in Employment of People with Disabilities: A
Policy Puzzle. W.E. Upjohn Institute for Employment Research, Kalamazoo, Michigan, 2003.
World Bank. “People with Disabilities in India: From Commitments to Outcomes”, June 2006.
39
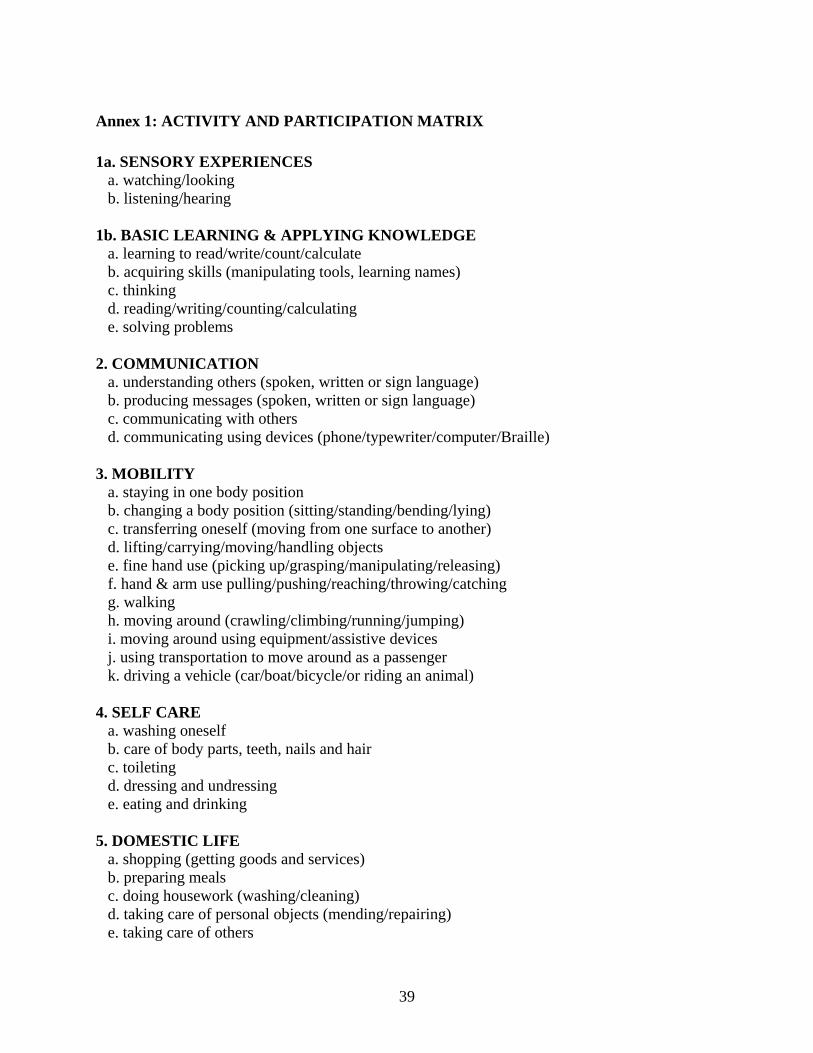
Annex 1: ACTIVITY AND PARTICIPATION MATRIX 1a. SENSORY EXPERIENCES
a. watching/looking b. listening/hearing
1b. BASIC LEARNING & APPLYING KNOWLEDGE
a. learning to read/write/count/calculate b. acquiring skills (manipulating tools, learning names) c. thinking d. reading/writing/counting/calculating e. solving problems
2. COMMUNICATION
a. understanding others (spoken, written or sign language) b. producing messages (spoken, written or sign language) c. communicating with others d. communicating using devices (phone/typewriter/computer/Braille)
3. MOBILITY
a. staying in one body position b. changing a body position (sitting/standing/bending/lying) c. transferring oneself (moving from one surface to another) d. lifting/carrying/moving/handling objects e. fine hand use (picking up/grasping/manipulating/releasing) f. hand & arm use pulling/pushing/reaching/throwing/catching g. walking h. moving around (crawling/climbing/running/jumping) i. moving around using equipment/assistive devices j. using transportation to move around as a passenger k. driving a vehicle (car/boat/bicycle/or riding an animal)
4. SELF CARE
a. washing oneself b. care of body parts, teeth, nails and hair c. toileting d. dressing and undressing e. eating and drinking
5. DOMESTIC LIFE
a. shopping (getting goods and services) b. preparing meals c. doing housework (washing/cleaning) d. taking care of personal objects (mending/repairing) e. taking care of others
40
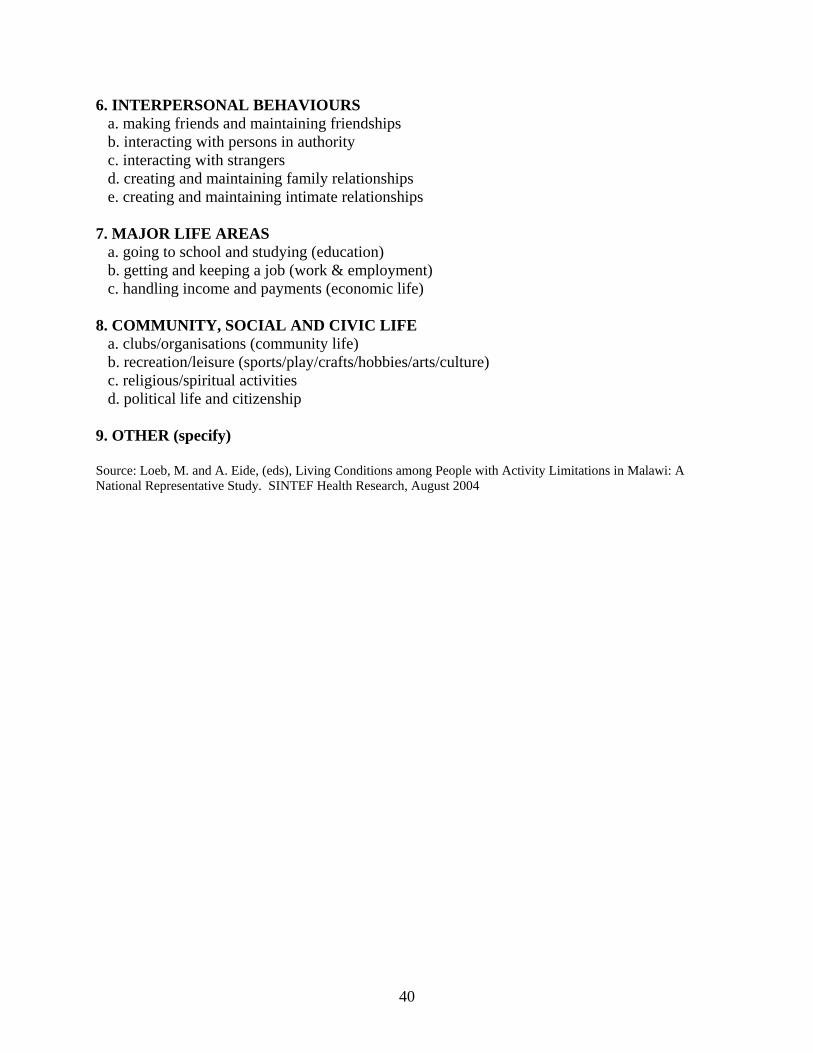
6. INTERPERSONAL BEHAVIOURS a. making friends and maintaining friendships b. interacting with persons in authority c. interacting with strangers d. creating and maintaining family relationships e. creating and maintaining intimate relationships
7. MAJOR LIFE AREAS
a. going to school and studying (education) b. getting and keeping a job (work & employment) c. handling income and payments (economic life)
8. COMMUNITY, SOCIAL AND CIVIC LIFE
a. clubs/organisations (community life) b. recreation/leisure (sports/play/crafts/hobbies/arts/culture) c. religious/spiritual activities d. political life and citizenship
9. OTHER (specify) Source: Loeb, M. and A. Eide, (eds), Living Conditions among People with Activity Limitations in Malawi: A National Representative Study. SINTEF Health Research, August 2004

41
Annex 2: INSTRUMENTAL ACTIVITIES OF DAILY LIVING SCALE (IADL) A. Ability to use telephone
1. Operates telephone on own initiative; looks up and dials numbers, etc. 2. Dials a few well-known numbers 3. Answers telephone but does not dial 4. Does not use telephone at all.
B. Shopping
1. Takes care of all shopping needs independently 2. Shops independently for small purchases 3. Needs to be accompanied on any shopping trip. 4. Completely unable to shop.
C. Food Preparation
1. Plans, prepares and serves adequate meals independently 2. Prepares adequate meals if supplied with ingredients 3. Heats, serves and prepares meals or prepares meals but does not maintain adequate diet. 4. Needs to have meals prepared and served.
D. Housekeeping
1. Maintains house alone or with occasional assistance (e.g. “heavy work domestic help”) 2. Performs light daily tasks such as dishwashing, bed making 3. Performs light daily tasks but cannot maintain acceptable level of cleanliness. 4. Needs help with all home maintenance tasks. 5. Does not participate in any housekeeping tasks.
E. Laundry
1. Does personal laundry completely 2. Launders small items; rinses stockings, etc. 3. All laundry must be done by others.
F. Mode of Transportation
1. Travels independently on public transportation or drives own car. 2. Arranges own travel via taxi, but does not otherwise use public transportation. 3. Travels on public transportation when accompanied by another. 4. Travel limited to taxi or automobile with assistance of another. 5. Does not travel at all.
G. Responsibility for own medications
1. Is responsible for taking medication in correct dosages at correct time. 2. Takes responsibility if medication is prepared in advance in separate dosage. 3. Is not capable of dispensing own medication.

42
H. Ability to Handle Finances 1. Manages financial matters independently (budgets, writes checks, pays rent, bills goes to bank), collects and keeps track of income. 2. Manages day-to-day purchases, but needs help with banking, major purchases, etc. 3. Incapable if handling money.
Source: Lawton, M.P., and Brody, E.M. “Assessment of older people: Self-maintaining and instrumental activities of daily living.” Gerontologist 9:179-186, (1969).
Social Protection Discussion Paper Series Titles No. Title 0707 The Kosovo Pension Reform: Achievements and Lessons by John Gubbels, David Snelbecker, Lena Zezulin, April 2007 (online only) 0706 Measuring Disability Prevalence by Daniel Mont, March 2007 0705 Social Safety Nets in World Bank Lending and Analytic Work: FY2002-
2006 compiled by Annamaria Milazzo and Margaret Grosh, March 2007 (online
only) 0704 Child Labor and Youth Employment: Ethiopia Country Study by Lorenzo Guarcello and Furio Rosati, March 2007 0703 Aging and Demographic Change in European Societies: Main Trends and
Alternative Policy Options by Rainer Muenz, March 2007 (online only)
0702 Seasonal Migration and Early Childhood Development
by Karen Macours and Renos Vakis, March 2007 0701 The Social Assimilation of Immigrants by Domenico de Palo, Riccardo Faini and Alessandra Venturini, February
2007 (online only) 0616 Pension Systems in Latin America: Concepts and Measurements of Coverage by Rafael Rofman and Leonardo Lucchetti, November 2006 (online only) 0615 Labor Market Outcomes of Natives and Immigrants: Evidence from the
ECHP by Franco Peracchi and Domenico Depalo, November 2006 (online only) 0614 The Relative Merits of Skilled and Unskilled Migration, Temporary and
Permanent Labor Migration, and Portability of Social Security Benefits by Johannes Koettl under guidance of and with input from Robert Holzmann
and Stefano Scarpetta, November 2006 (online only) 0613 The Limited Job Prospects of Displaced Workers: Evidence from Two Cities
in China by Gordon Betcherman and Niels-Hugo Blunch, October 2006
0612 Unemployment Insurance in Chile: A New Model of Income Support for Unemployed Workers
by Germán Acevedo, Patricio Eskenazi and Carmen Pagés, October 2006 0611 Evaluating Social Fund Impact: A Toolkit for Task Teams and Social Fund
Managers by Sarah Adam, October 2006 0610 Risk and Vulnerability Considerations in Poverty Analysis: Recent Advances
and Future Directions by Carlo Cafiero and Renos Vakis, October 2006 0609 Comparing Individual Retirement Accounts in Asia: Singapore, Thailand,
Hong Kong and PRC by Yasue Pai, September 2006 (online only) 0608 Pension System Reforms by Anita M. Schwarz, September 2006 (online only) 0607 Youth Labor Market in Burkina Faso: Recent Trends by Daniel Parent, July 2006 0606 Youth in the Labor Market and the Transition from School to Work in
Tanzania by Florence Kondylis and Marco Manacorda, July 2006 0605 Redistributing Income to the Poor and the Rich: Public Transfers in Latin
America and the Caribbean by Kathy Lindert, Emmanuel Skoufias and Joseph Shapiro, August 2006
(online only) 0604 Uninsured Risk and Asset Protection: Can Conditional Cash Transfer
Programs Serve as Safety Nets? by Alain de Janvry, Elisabeth Sadoulet, Pantelis Solomon and Renos Vakis,
June 2006 0603 Examining Conditional Cash Transfer Programs: A Role for Increased Social
Inclusion? by Bénédicte de la Brière and Laura B. Rawlings, June 2006 (online only) 0602 Civil-service Pension Schemes Around the World by Robert Palacios and Edward Whitehouse, May 2006 (online only) 0601 Social Pensions Part I: Their Role in the Overall Pension System by Robert Palacios and Oleksiy Sluchynsky, May 2006 (online only)
0543 Complementing Natural Disasters Management: The Role of Social Protection
by Renos Vakis, February 2006 0542 Brazil’s Bolsa Escola Program: The Role of Local Governance in
Decentralized Implementation by Alain de Janvry, Frederico Finan, Elisabeth Sadoulet, Donald Nelson,
Kathy Lindert, Bénédicte de la Brière and Peter Lanjouw, December 2005 (online only)
0541 Japan’s Pension Reform by Junichi Sakamoto, December 2005 (online only) 0540 Demographic Alternatives for Aging Industrial Countries: Increased Total
Fertility Rate, Labor Force Participation, or Immigration by Robert Holzmann, December 2005 (online only)
0539 Disability, Poverty and Schooling in Developing Countries: Results from 11
Household Surveys by Deon Filmer, November 2005 (online only) 0538 Food Aid and Food Security in the Short- and Long Run: Country Experience
from Asia and sub-Saharan Africa by Carlo del Ninno, Paul A. Dorosh and Kalanidhi Subbarao, November
2005 (online only) 0537 The New Pensions in Kazakhstan: Challenges in Making the Transition
by Richard P. Hinz, Asta Zviniene and Anna-Marie Vilamovska September 2005 (online only)
0536 Household’s Vulnerability to Shocks in Zambia by Carlo del Ninno and Alessandra Marini, September 2005 (online only) 0535 Linking Community Empowerment, Decentralized Governance, and Public
Service Provision through a Local Development Framework by Louis Helling, Rodrigo Serrano, David Warren, September 2005 (online
only) 0534 Youth Employment in the MENA Region: A Situational Assessment by Nader Kabbani and Ekta Kothari, September 2005 0533 Measuring Risk Perceptions: Why and How by Joachim De Weerdt, July 2005 0532 Implementing Means-Tested Welfare Systems in the United States by Kathy Lindert, June 2005 (online only)

0531 La Focalización En El Programa De Desarrollo Humano Oportunidades De Mexico by Mónica Orozco y Cecilia Hubert, June 2005 (online only) 0530 Sistema de Identificación de la Población Objetivo: SIPO en Costa Rica by Roxana M. Víquez, June 2005 (online only) 0529 Targeting Social Spending To the Poor with Proxy–Means Testing: Colombia's SISBEN System
by Tarsicio Castañeda, June 2005 (online only) 0528 Focalización De Programas En Chile: El Sistema CAS by Osvaldo Larrañaga, June 2005 (online only) 0527 Reforming Brazil's Cadastro Único to Improve the Targeting of the Bolsa Família Program by Bénédicte de la Brière and Kathy Lindert, June 2005 (online only) 0526 Designing and Implementing Household Targeting Systems: Lessons from Latin American and The United States by Tarsicio Castañeda and Kathy Lindert, with Bénédicte de la Brière, Luisa Fernandez, Celia Hubert, Osvaldo Larrañaga, Mónica Orozco and Roxana Viquez, June 2005 (online only). Also available in Portuguese. 0525 Unequal Prospects: Disparities in the Quantity and Quality of Labour Supply in sub-Saharan Africa
by John Sender, Christopher Cramer and Carlos Oya, June 2005
0524 Pension Supervision: Understanding International Practice and Country Context by Richard P. Hinz and Anca Mataoanu, May 2005 0523 Social Security Coverage in Latin America by Rafael Rofman, May 2005 0522 A Technology White Paper on Improving the Efficiency of Social Safety Net Program Delivery in Low Income Countries: An Introduction to Available and Emerging Mobile Technologies by Mike Gallaher, May 2005 (online only) 0521 Aging and Poverty in Africa and the Role of Social Pensions by Nanak Kakwani and Kalanidhi Subbarao, May 2005 (online only) 0520 Delivery Mechanisms of Cash Transfer Programs to the Poor in Bangladesh
by Shaikh S. Ahmed, May 2005 (online only)

0519 Portability Regimes of Pension and Health Care Benefits for International Migrants: An Analysis of Issues and Good Practices
by Robert Holzmann, Johannes Koettl and Taras Chernetsky, May 2005 (online only)
0518 Who Has the Yam, and Who Has the Knife? Social Action Funds and
Decentralization in Malawi, Tanzania, and Uganda by N. Mungai Lenneiye , May 2005
0517 Household Vulnerability and Children’s Activities: Information Needed from
Household Surveys to Measure their Relationship by Diane Steele, May 2005 (online only)
0516 The Effect of Child Labor on Mathematics and Language Achievement in
Latin America by Mario A. Sanchez, Peter F. Orazem, and Victoria Gunnarsso, May 2005 0515 The Inter-Generational Persistence of Child Labor by Patrick M. Emerson and André Portela Souza, May 2005 0514 How Does Working as a Child affect Wage, Income and Poverty as an
Adult? by Nadeem Ilahi, Peter F. Orazem, and Guilherme Sedlacek, May 2005 0513 Dynamics of Child Labor: Labor Force Entry and Exit in Urban Brazil by Suzanne Duryea, Jasper Hoek, David Lam and Deborah Levison, May 2005 0512 The Responses of Child Labor, School Enrollment, and Grade Repetition to
the Loss of Parental Earnings in Brazil, 1982-1999 by Marcelo Côrtes Neri, Emily Gustafsson-Wright, Guilherme Sedlacek and Peter F. Orazem, May 2005
0511 Child Labor, Schooling, and Poverty in Latin America by Guilherme Sedlacek, Suzanne Duryea, Nadeem Ilahi, and Masaru Sasaki, May 2005 0510 Changing Patterns of Child Labor around the World since 1950: The Roles of
Income Growth, Parental Literacy and Agriculture by Victoria Gunnarsson, Peter F. Orazem, and Guilherme Sedlacek, May 2005 0509 Disability and Social Safety Nets in Developing Countries by Sophie Mitra, May 2005
0508 Social Funds: A Review of Public Sector Management and Institutional Issues
by Mukhmeet Bhatia, May 2005 0507 Pension Reform in El Salvador
by Rodrigo Acuña, April 2005 0506 How Changes in Benefits Entitlement Affect Job- Finding: Lessons from the
Slovenian “Experiment” by Jan van Ours and Milan Vodopivec, April 2005 0505 A Guide to Multisector Labor Market Models
by Gary S. Fields, April 2005 0504 Multinational Enterprises and Training Revisited: Do International Standards
Matter? by Niels-Hugo Blunch and Paula Castro, March 2005
0503 Community-Based Health Insurance & Social Protection Policy
by Steven Tabor, March 2005 (online only) 0502 Towards a Better Understanding of the Nature, Causes and Consequences of
Youth Labor Market Disadvantage: Evidence for South-East Europe by Alexandre Kolev and Catherine Saget, March 2005 (online only)
0501 A Lecture on the Political Economy of Targeted Safety Nets
by Lant Pritchett, January 2005 0420 Can Conditional Cash Transfer Programs Improve Social Risk Management?
Lessons for Education and Child Labor Outcomes by Elisabeth Sadoulet, Frederico Finan, Alain de Janvry and Renos Vakis, December 2004 0419 Measuring Welfare for Small but Vulnerable Groups. Poverty and Disability
in Uganda by Johannes G. Hoogeveen, September 2004 0418 Institutional Analysis Toolkit for Safety Net Interventions
by Inke Mathauer, August 2004 0417 Trade Union Participation in the PRSP Process by Lawrence Egulu, August 2004 0416 A New Approach to Social Assistance: Latin America’s Experience with
Conditional Cash Transfer Programs by Laura B. Rawlings, August 2004

0415 Shocks and Coffee: Lessons from Nicaragua by Renos Vakis, Diana Kruger and Andrew D. Mason, July 2004 0414 Costs of Projects for Orphans and other Vulnerable Children: Case studies in
Eritrea and Benin by Menahem Prywes, Diane Coury, Gebremeskel Fesseha, Gilberte Hounsounou, and Anne Kielland, July 2004
0413 Disability Employment Policy
by Daniel Mont, July 2004 0412 Child Labor, Education, and Children’s Rights
by Gordon Betcherman, Jean Fares, Amy Luinstra, and Robert Prouty, July 2004
0411 Challenges and Opportunities of International Migration for the EU, Its
Member States, Neighboring Countries and Regions: A Policy Note by Robert Holzmann and Rainer Münz, June 2004
0410 Evaluating Different Approaches to Estimating Vulnerability by Ethan Ligon and Laura Schechter, June 2004
0409 Transferring Cash Benefits Through the Banking Sector in Colombia
by Maria Teresa Lafaurie V. and Claudia A. Velasquez Leiva, May 2004 0408 Mitigating Social Risks in Kyrgyz Republic by Emil Tesliuc, April 2004 0407 Toward a Reformed and Coordinated Pension System in Europe: Rationale
and Potential Structure by Robert Holzmann, April, 2004 0406 Boosting Productivity Via Innovation and Adoption of New Technologies:
Any Role for Labor Market Institutions? by Stefano Scarpetta and Thierry Tressel, March 2004 0405 Mitigating the Social Impact of Privatization and Enterprise Restructuring by David H. Fretwell, March 2004 0404 Risk and Vulnerability in Guatemala: A Quantitative and Qualitative
Assessment by Emil D. Tesliuc and Kathy Lindert, March 2004 0403 Implicit Pension Debt: Issues, Measurement and Scope in International
Perspective by Robert Holzmann, Robert Palacios and Asta Zviniene, March 2004

0402 Impacts of Active Labor Market Programs: New Evidence from Evaluations with Particular Attention to Developing and Transition Countries
by Gordon Betcherman, Karina Olivas and Amit Dar, January 2004 0401 Consumption Insurance and Vulnerability to Poverty: A Synthesis of the
Evidence from Bangladesh, Ethiopia, Mali, Mexico and Russia by Emmanuel Skoufias and Agnes R. Quisumbing, January 2004
To view Social Protection Discussion papers published prior to 2004, please visit www.worldbank.org/sp.
S P D I S C U S S I O N P A P E R
About this series...Social Protection Discussion Papers are published to communicate the results of The World Bank'swork to the development community with the least possible delay. The typescript manuscript of thispaper therefore has not been prepared in accordance with the procedures appropriate to formallyedited texts. The findings, interpretations, and conclusions expressed herein are those of the author(s),and do not necessarily reflect the views of the International Bank for Reconstruction and Development/ The World Bank and its affiliated organizations, or those of the Executive Directors of The World Bankor the governments they represent.
The World Bank does not guarantee the accuracy of the data included in this work. For free copiesof this paper, please contact the Social Protection Advisory Service, The World Bank, 1818 H Street,N.W., Room G7-703, Washington, D.C. 20433-0001. Telephone: (202) 458-5267, Fax: (202) 614-0471, E-mail: [email protected] or visit the Social Protection website atwww.worldbank.org/sp.
March 2007
Summary Findings
Disability and poverty are intricately interlinked. Unfortunately,high quality, internationally comparable data on disability thatis important for the planning, implementation, monitoring,and evaluation of inclusive policies is often not available. Thispaper reviews what is meant by disability and puts forth a wayof measuring disability suitable for internationally comparableprevalence rates. It clarifies good standards in collecting dataon disability and makes recommendations for prevalencemeasures of disability suitable for censuses. Since a singledisability prevalence rate can be highly problematic, a betterpractice would be to report at least two prevalence rates —one representing a moderate threshold for functional limitationsand one with a more severe threshold.
HUMAN DEVELOPMENT NETWORK
NO. 0706
Measuring DisabilityPrevalence
Daniel Mont