measuring economic growth and development based on cypher and dietz the process of economic...
TRANSCRIPT

Measuring Economic Growth and Development
based on Cypher and Dietz
The Process of Economic Development
Ch. 2
Is Development synonymous simply with Economic Growth?
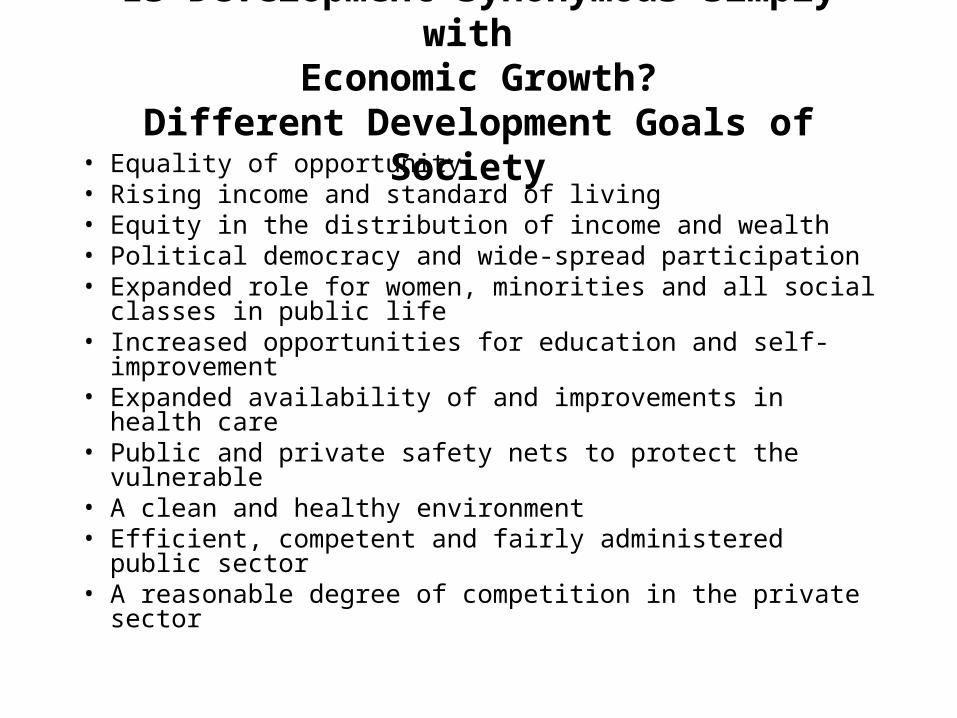
Different Development Goals of Society • Equality of opportunity• Rising income and standard of living• Equity in the distribution of income and wealth• Political democracy and wide-spread participation• Expanded role for women, minorities and all social classes
in public life• Increased opportunities for education and self-
improvement• Expanded availability of and improvements in health care• Public and private safety nets to protect the vulnerable• A clean and healthy environment• Efficient, competent and fairly administered public sector• A reasonable degree of competition in the private sector

High-quality growth • Over the 1990s, the IMF seemed slowly to be learning from
the criticisms of its policies • Now, the IMF sees itself as promoting so-called `high-quality
growth’, • “defined as growth that is sustainable, brings lasting gains in employment
and living standards and reduces poverty. High-quality growth should promote greater equity and equality of opportunity. It should respect human freedom and protect the environment. Obviously, growth cannot be high quality ... if it does not benefit fully, tangibly, and equitably a group that constitutes more than one half the population of the world and still bears the primary responsibility for the care, nutrition, and education of the world’s children. Achieving high-quality growth depends, therefore, not only on pursuing sound economic policies, but also on implementing a broad range of social policies.”
• IMF(1995)
Measuring Economic Growth and Development
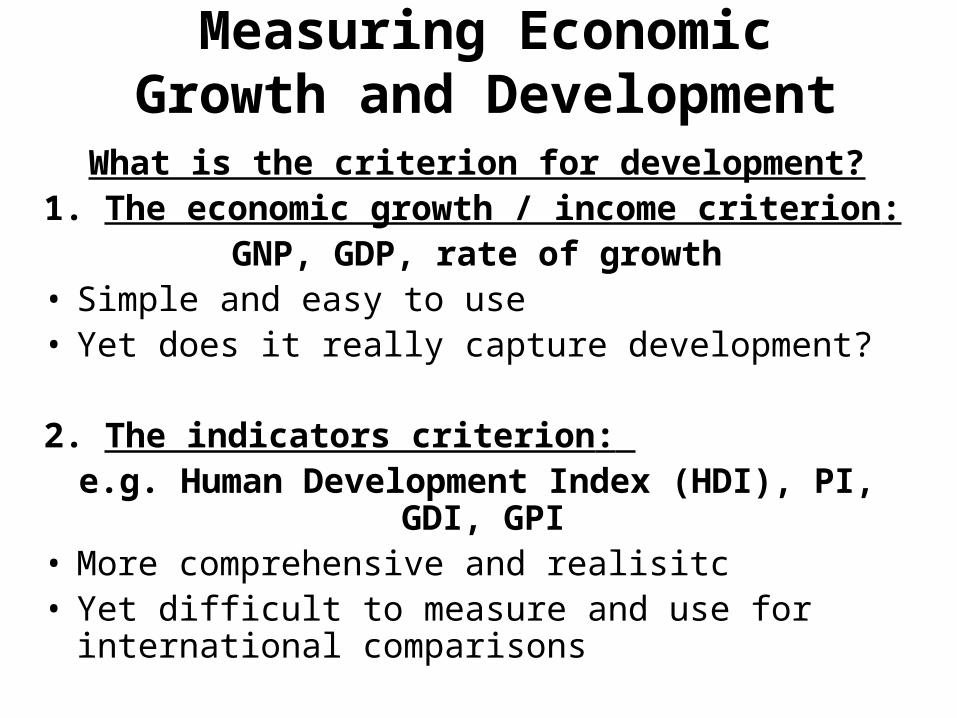
What is the criterion for development?1. The economic growth / income criterion:
GNP, GDP, rate of growth• Simple and easy to use• Yet does it really capture development?
2. The indicators criterion: e.g. Human Development Index (HDI), PI, GDI, GPI
• More comprehensive and realisitc• Yet difficult to measure and use for international
comparisons
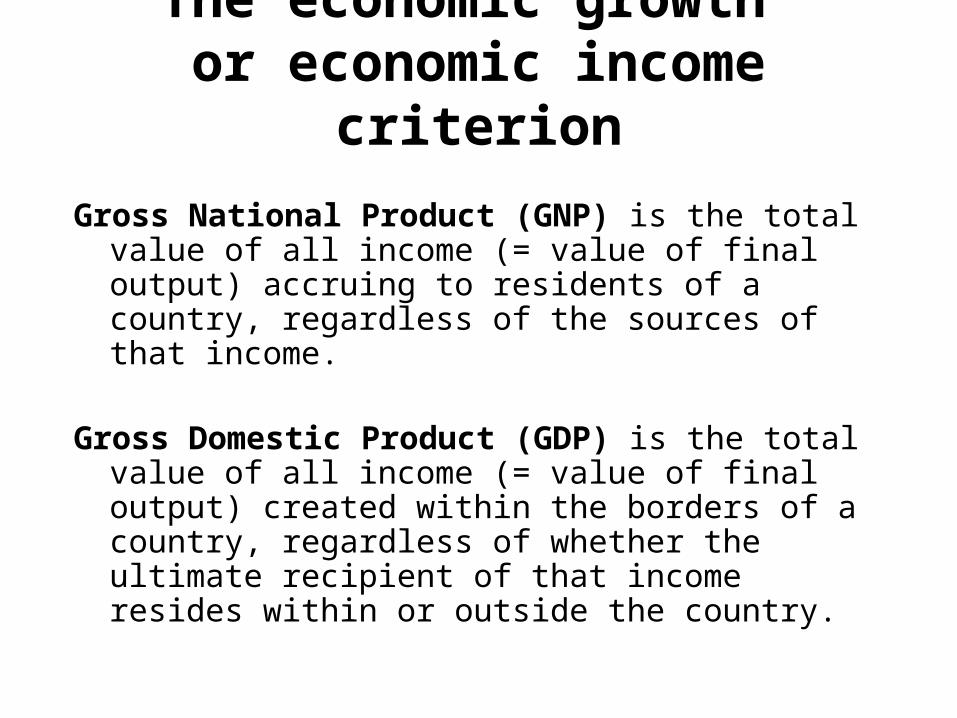
The economic growth or economic income criterion
Gross National Product (GNP) is the total value of all income (= value of final output) accruing to residents of a country, regardless of the sources of that income.
Gross Domestic Product (GDP) is the total value of all income (= value of final output) created within the borders of a country, regardless of whether the ultimate recipient of that income resides within or outside the country.
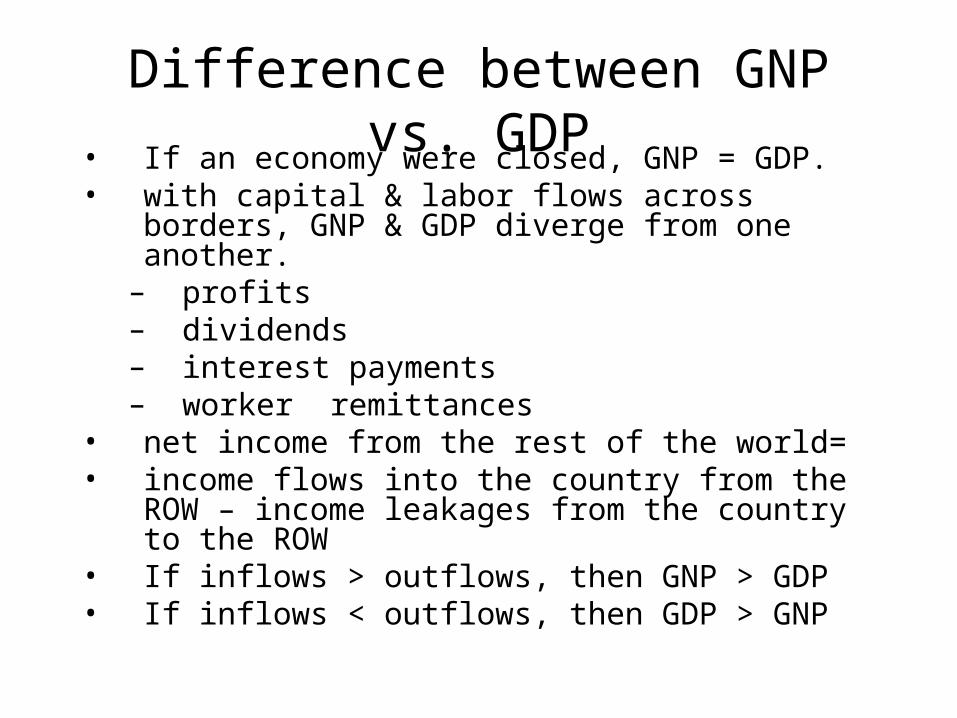
Difference between GNP vs. GDP• If an economy were closed, GNP = GDP.• with capital & labor flows across borders, GNP & GDP
diverge from one another. – profits– dividends– interest payments– worker remittances
• net income from the rest of the world=• income flows into the country from the ROW – income
leakages from the country to the ROW• If inflows > outflows, then GNP > GDP• If inflows < outflows, then GDP > GNP
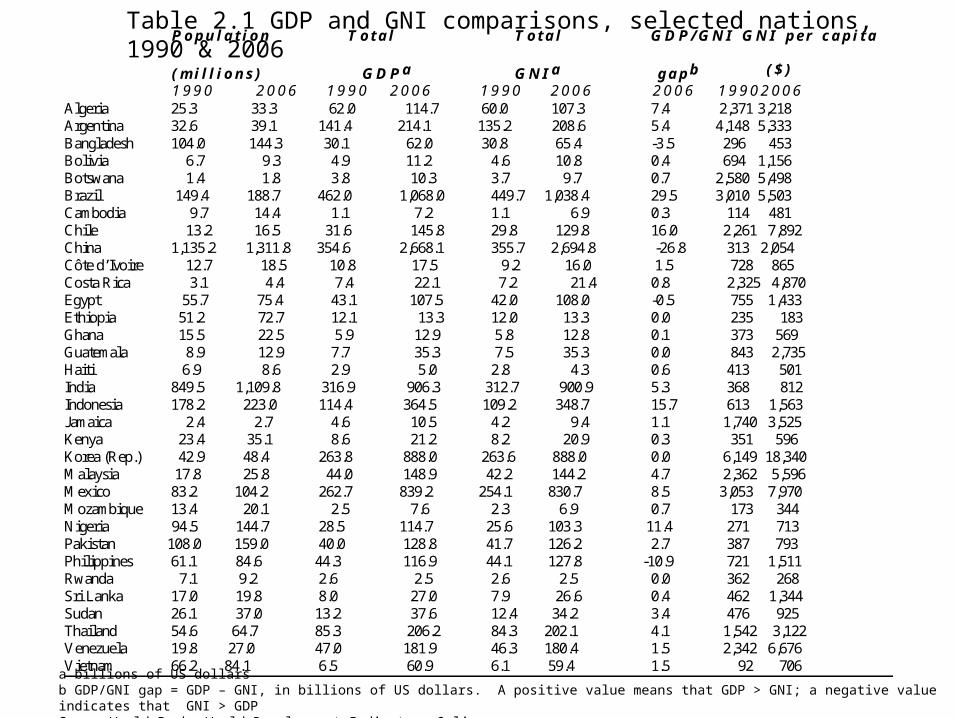
Population Total Total GDP/GNI GNI per capi ta (mi l l i ons) GDPa GNI a gapb ($) 1990 2006 1990 2006 1990 2006 2006 19902006 Algeria 25.3 33.3 62.0 114.7 60.0 107.3 7.4 2,371 3,218 Argentina 32.6 39.1 141.4 214.1 135.2 208.6 5.4 4,148 5,333 Bangladesh 104.0 144.3 30.1 62.0 30.8 65.4 -3.5 296 453 Bolivia 6.7 9.3 4.9 11.2 4.6 10.8 0.4 694 1,156 Botswana 1.4 1.8 3.8 10.3 3.7 9.7 0.7 2,580 5,498 Brazil 149.4 188.7 462.0 1,068.0 449.7 1,038.4 29.5 3,010 5,503 Cambodia 9.7 14.4 1.1 7.2 1.1 6.9 0.3 114 481 Chile 13.2 16.5 31.6 145.8 29.8 129.8 16.0 2,261 7,892 China 1,135.2 1,311.8 354.6 2,668.1 355.7 2,694.8 -26.8 313 2,054 Côte d’Ivoire 12.7 18.5 10.8 17.5 9.2 16.0 1.5 728 865 Costa Rica 3.1 4.4 7.4 22.1 7.2 21.4 0.8 2,325 4,870 Egypt 55.7 75.4 43.1 107.5 42.0 108.0 -0.5 755 1,433 Ethiopia 51.2 72.7 12.1 13.3 12.0 13.3 0.0 235 183 Ghana 15.5 22.5 5.9 12.9 5.8 12.8 0.1 373 569 Guatemala 8.9 12.9 7.7 35.3 7.5 35.3 0.0 843 2,735 Haiti 6.9 8.6 2.9 5.0 2.8 4.3 0.6 413 501 India 849.5 1,109.8 316.9 906.3 312.7 900.9 5.3 368 812 Indonesia 178.2 223.0 114.4 364.5 109.2 348.7 15.7 613 1,563 Jamaica 2.4 2.7 4.6 10.5 4.2 9.4 1.1 1,740 3,525 Kenya 23.4 35.1 8.6 21.2 8.2 20.9 0.3 351 596 Korea (Rep.) 42.9 48.4 263.8 888.0 263.6 888.0 0.0 6,149 18,340 Malaysia 17.8 25.8 44.0 148.9 42.2 144.2 4.7 2,362 5,596 Mexico 83.2 104.2 262.7 839.2 254.1 830.7 8.5 3,053 7,970 Mozambique 13.4 20.1 2.5 7.6 2.3 6.9 0.7 173 344 Nigeria 94.5 144.7 28.5 114.7 25.6 103.3 11.4 271 713 Pakistan 108.0 159.0 40.0 128.8 41.7 126.2 2.7 387 793 Philippines 61.1 84.6 44.3 116.9 44.1 127.8 -10.9 721 1,511 Rwanda 7.1 9.2 2.6 2.5 2.6 2.5 0.0 362 268 Sri Lanka 17.0 19.8 8.0 27.0 7.9 26.6 0.4 462 1,344 Sudan 26.1 37.0 13.2 37.6 12.4 34.2 3.4 476 925 Thailand 54.6 64.7 85.3 206.2 84.3 202.1 4.1 1,542 3,122 Venezuela 19.8 27.0 47.0 181.9 46.3 180.4 1.5 2,342 6,676 Vietnam 66.2 84.1 6.5 60.9 6.1 59.4 1.5 92 706
Table 2.1 GDP and GNI comparisons, selected nations, 1990 & 2006
a billions of US dollarsb GDP/GNI gap = GDP – GNI, in billions of US dollars. A positive value means that GDP > GNI; a negative value indicates that GNI > GDPSource: World Bank, World Development Indicators Online.
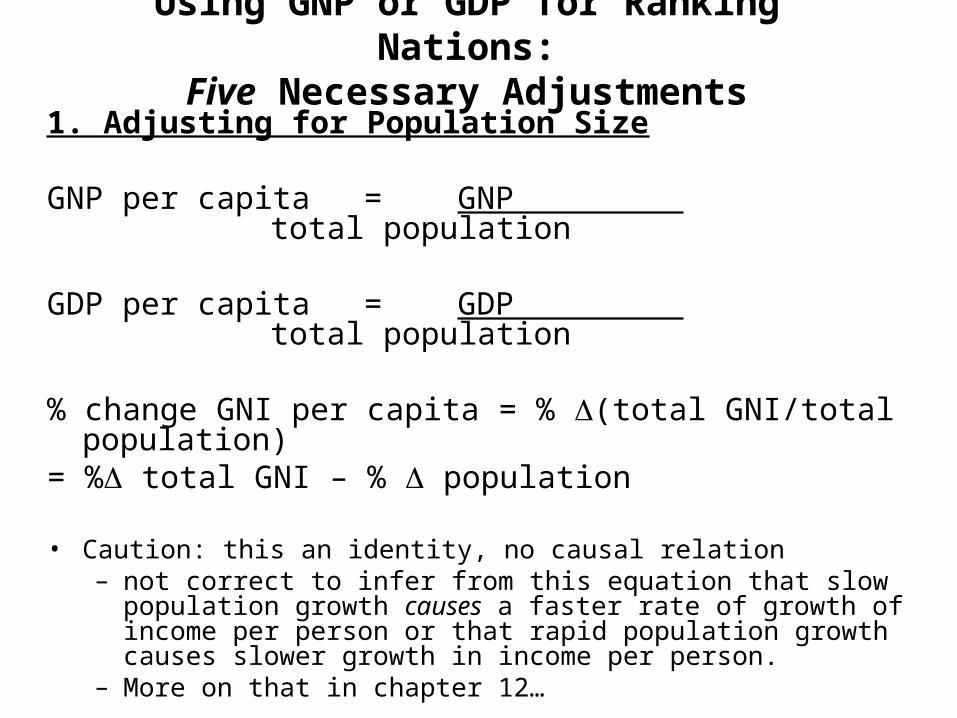
Using GNP or GDP for Ranking Nations:Five Necessary Adjustments
1. Adjusting for Population Size
GNP per capita = GNP total population
GDP per capita = GDP total population
% change GNI per capita = % (total GNI/total population) = % total GNI – % population
• Caution: this an identity, no causal relation– not correct to infer from this equation that slow population growth
causes a faster rate of growth of income per person or that rapid population growth causes slower growth in income per person.
– More on that in chapter 12…
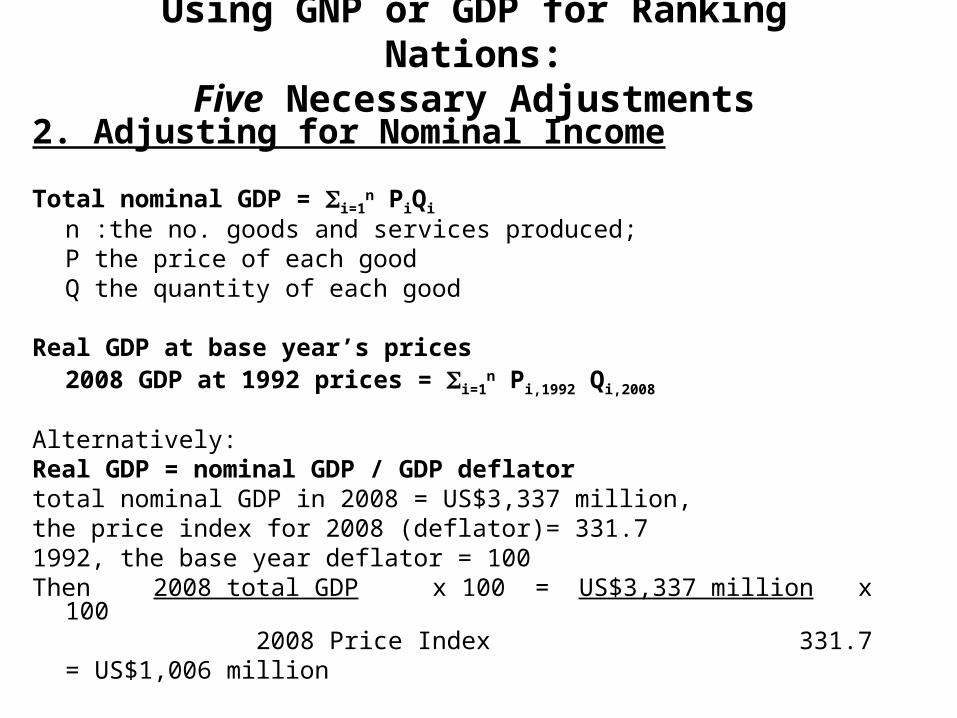
Using GNP or GDP for Ranking Nations:Five Necessary Adjustments
2. Adjusting for Nominal Income
Total nominal GDP = i=1n PiQi
n :the no. goods and services produced; P the price of each goodQ the quantity of each good
Real GDP at base year’s prices2008 GDP at 1992 prices = i=1
n Pi,1992 Qi,2008
Alternatively:Real GDP = nominal GDP / GDP deflatortotal nominal GDP in 2008 = US$3,337 million, the price index for 2008 (deflator)= 331.7 1992, the base year deflator = 100 Then 2008 total GDP x 100 = US$3,337 million x 100 2008 Price Index 331.7
= US$1,006 million
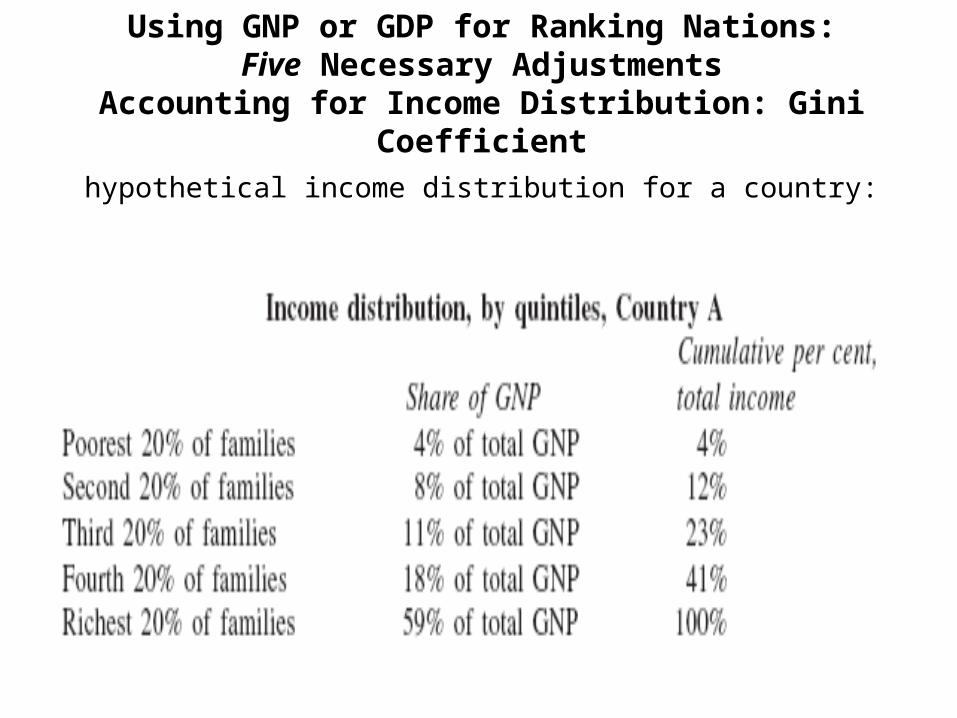
Using GNP or GDP for Ranking Nations:Five Necessary Adjustments
Accounting for Income Distribution: Gini Coefficient
hypothetical income distribution for a country:
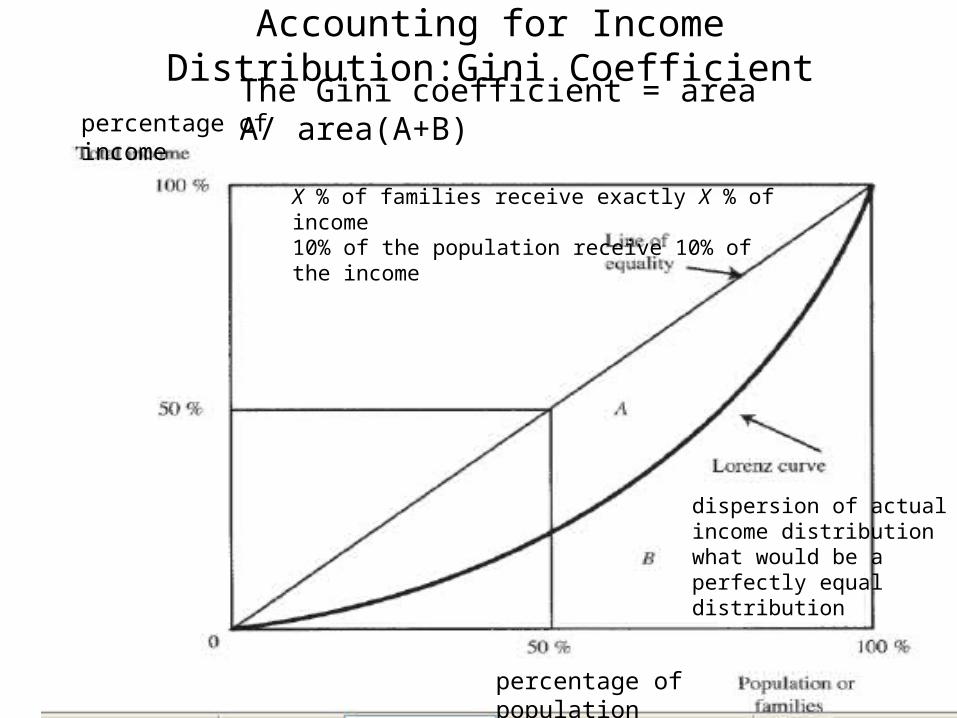
Accounting for Income Distribution:Gini Coefficient
percentage of population
percentage of income
X % of families receive exactly X % of income 10% of the population receive 10% of the income
dispersion of actual income distribution what would be a perfectly equal distribution
The Gini coefficient = area A/ area(A+B)
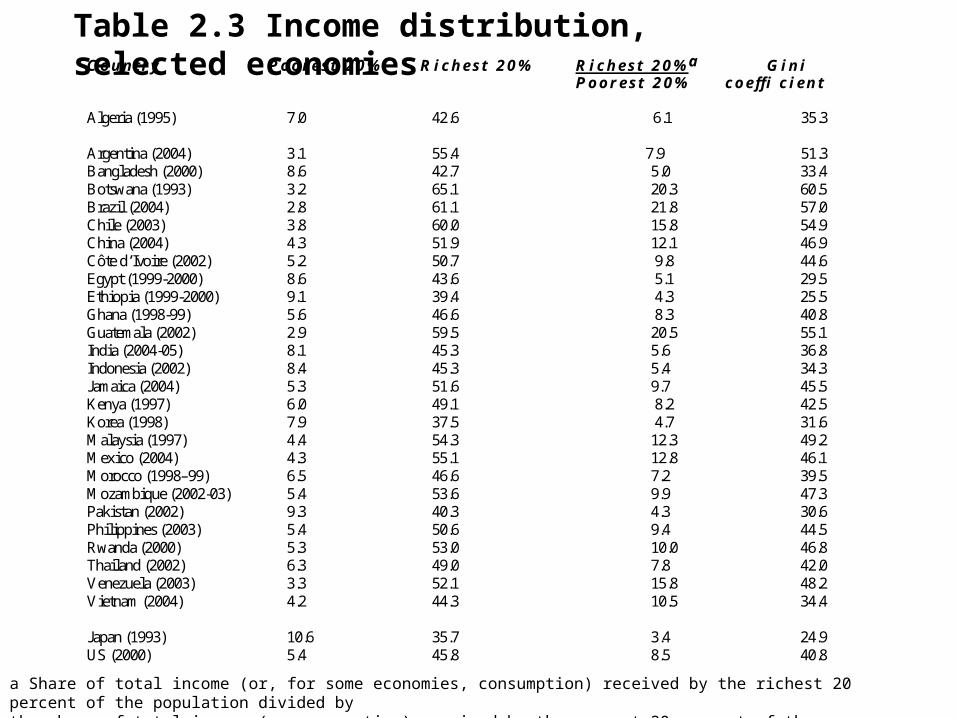
Country Poorest 20% Richest 20% Richest 20%a Gini Poorest 20% coeffi cient Algeria (1995) 7.0 42.6 6.1 35.3 Argentina (2004) 3.1 55.4 7.9 51.3 Bangladesh (2000) 8.6 42.7 5.0 33.4 Botswana (1993) 3.2 65.1 20.3 60.5 Brazil (2004) 2.8 61.1 21.8 57.0 Chile (2003) 3.8 60.0 15.8 54.9 China (2004) 4.3 51.9 12.1 46.9 Côte d’Ivoire (2002) 5.2 50.7 9.8 44.6 Egypt (1999-2000) 8.6 43.6 5.1 29.5 Ethiopia (1999-2000) 9.1 39.4 4.3 25.5 Ghana (1998-99) 5.6 46.6 8.3 40.8 Guatemala (2002) 2.9 59.5 20.5 55.1 India (2004-05) 8.1 45.3 5.6 36.8 Indonesia (2002) 8.4 45.3 5.4 34.3 Jamaica (2004) 5.3 51.6 9.7 45.5 Kenya (1997) 6.0 49.1 8.2 42.5 Korea (1998) 7.9 37.5 4.7 31.6 Malaysia (1997) 4.4 54.3 12.3 49.2 Mexico (2004) 4.3 55.1 12.8 46.1 Morocco (1998–99) 6.5 46.6 7.2 39.5 Mozambique (2002-03) 5.4 53.6 9.9 47.3 Pakistan (2002) 9.3 40.3 4.3 30.6 Philippines (2003) 5.4 50.6 9.4 44.5 Rwanda (2000) 5.3 53.0 10.0 46.8 Thailand (2002) 6.3 49.0 7.8 42.0 Venezuela (2003) 3.3 52.1 15.8 48.2 Vietnam (2004) 4.2 44.3 10.5 34.4 Japan (1993) 10.6 35.7 3.4 24.9 US (2000) 5.4 45.8 8.5 40.8
Table 2.3 Income distribution, selected economies
a Share of total income (or, for some economies, consumption) received by the richest 20 percent of the population divided by the share of total income (or consumption) received by the poorest 20 percent of the population.Source: World Bank, World Development Indicators 2007: Table 2.7, pp. 66-68.
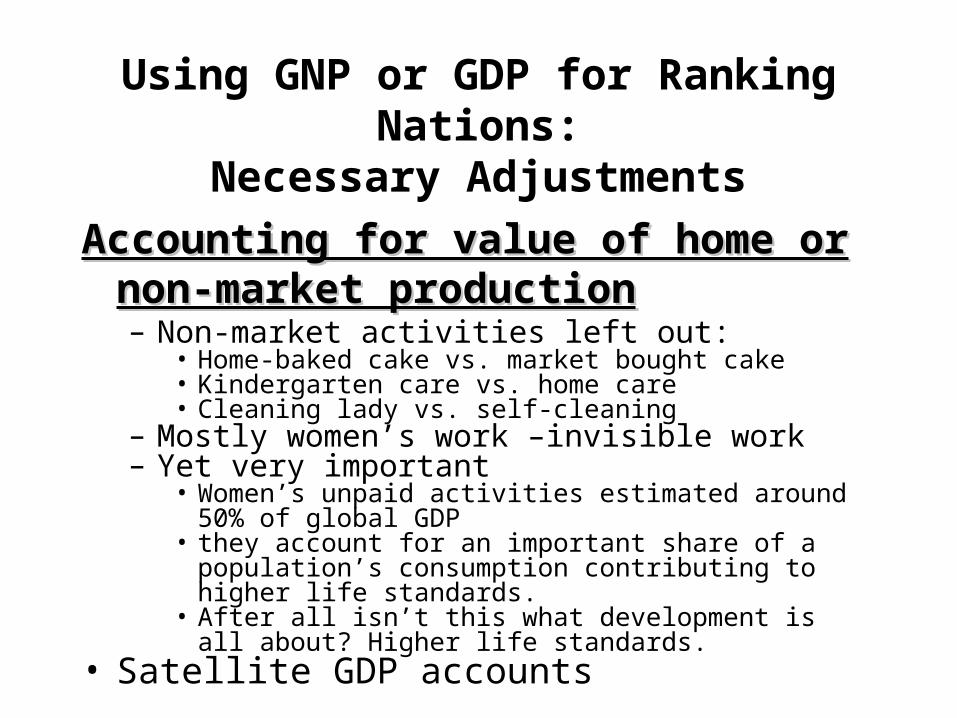
Accounting for value of home or non-Accounting for value of home or non-market productionmarket production– Non-market activities left out:
• Home-baked cake vs. market bought cake• Kindergarten care vs. home care• Cleaning lady vs. self-cleaning
– Mostly women’s work –invisible work– Yet very important
• Women’s unpaid activities estimated around 50% of global GDP
• they account for an important share of a population’s consumption contributing to higher life standards.
• After all isn’t this what development is all about? Higher life standards.
• Satellite GDP accounts
Using GNP or GDP for Ranking Nations:Necessary Adjustments
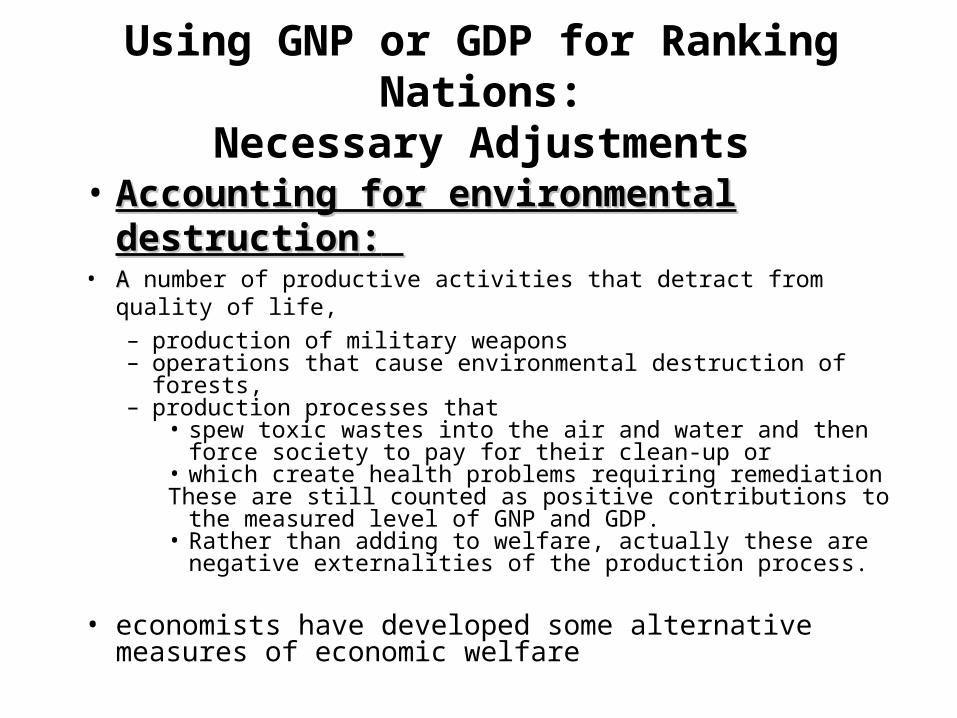
• Accounting for environmental destructionAccounting for environmental destruction:: • AA number of productive activities that detract from quality of life,
– production of military weapons– operations that cause environmental destruction of forests, – production processes that
• spew toxic wastes into the air and water and then force society to pay for their clean-up or
• which create health problems requiring remediation These are still counted as positive contributions to the measured
level of GNP and GDP.• Rather than adding to welfare, actually these are negative
externalities of the production process.
• economists have developed some alternative measures of economic welfare
Using GNP or GDP for Ranking Nations:Necessary Adjustments
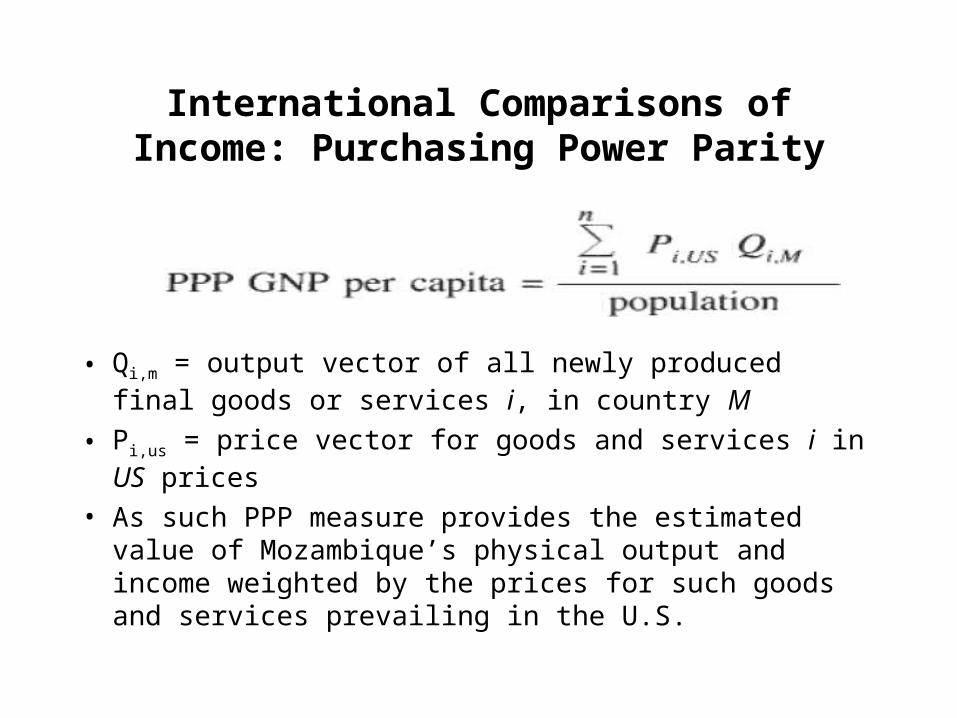
International Comparisons of Income: Purchasing Power Parity
• Qi,m = output vector of all newly produced final goods or services i, in country M
• Pi,us = price vector for goods and services i in US prices
• As such PPP measure provides the estimated value of Mozambique’s physical output and income weighted by the prices for such goods and services prevailing in the U.S.

GNI per capita at official exchange rate, 2005 PPP GNI per capita, 2005
Algeria 2,730 6,770 Argentina 4,470 13,920 Bangladesh 470 2,090 Botswana 5,590 10,250 Brazil 3,550 8,230 Chile 5,870 11,470 China 1,740 6,600 Côte d’Ivoire 870 1,490 Egypt 1,260 4,440 Ethiopia 160 1,000 Ghana 450 2,370 Guatemala 2,400 4,410 Haiti 450 1,840 India 730 3,460 Indonesia 1,280 3,720 Jamaica 3,390 4,110 Kenya 540 1,170 Korea 15,840 21,850 Malaysia 4,970 10,320 Mexico 7,310 10,030 Morocco 1,740 4,360 Mozambique 310 1,270 Pakistan 690 2,350 Philippines 1,320 5,300 Thailand 2,720 8,440 Rwanda 230 1,320 Venezuela 4,820 6,440 Vietnam 620 3,010 Ireland 41,140 34,720 Japan 38,950 31,410
Table 2.4 The purchasing power parity (PPP) measure of GNI per capita
Source: World Bank, World Development Indicators 2007: Table 1.1, pp. 14-16..
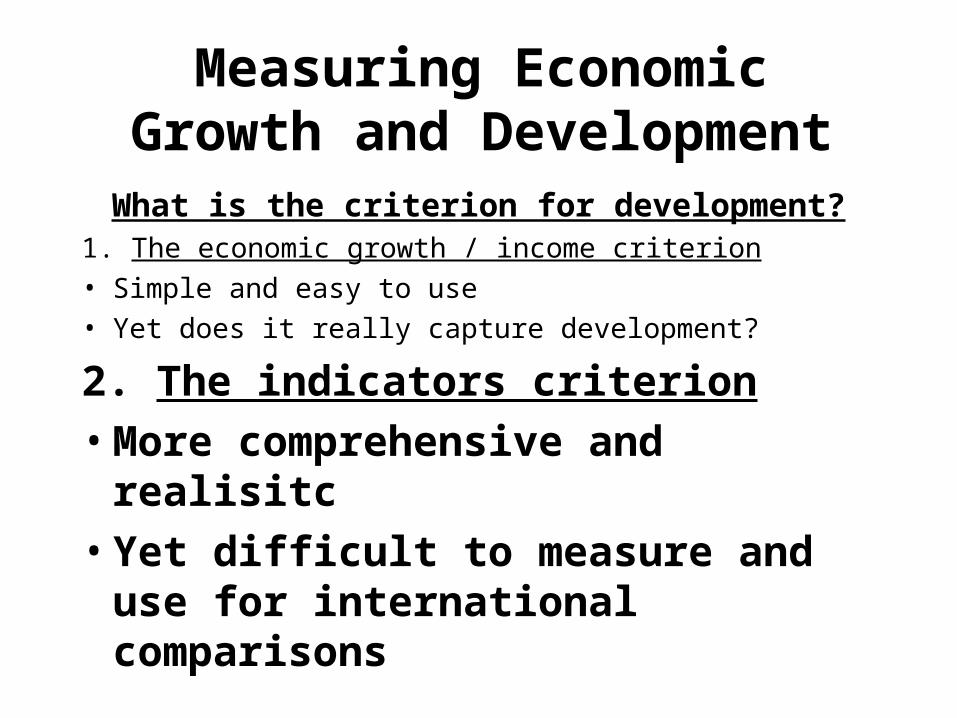
Measuring Economic Growth and Development
What is the criterion for development?1. The economic growth / income criterion
• Simple and easy to use
• Yet does it really capture development?
2. The indicators criterion
• More comprehensive and realisitc
• Yet difficult to measure and use for international comparisons
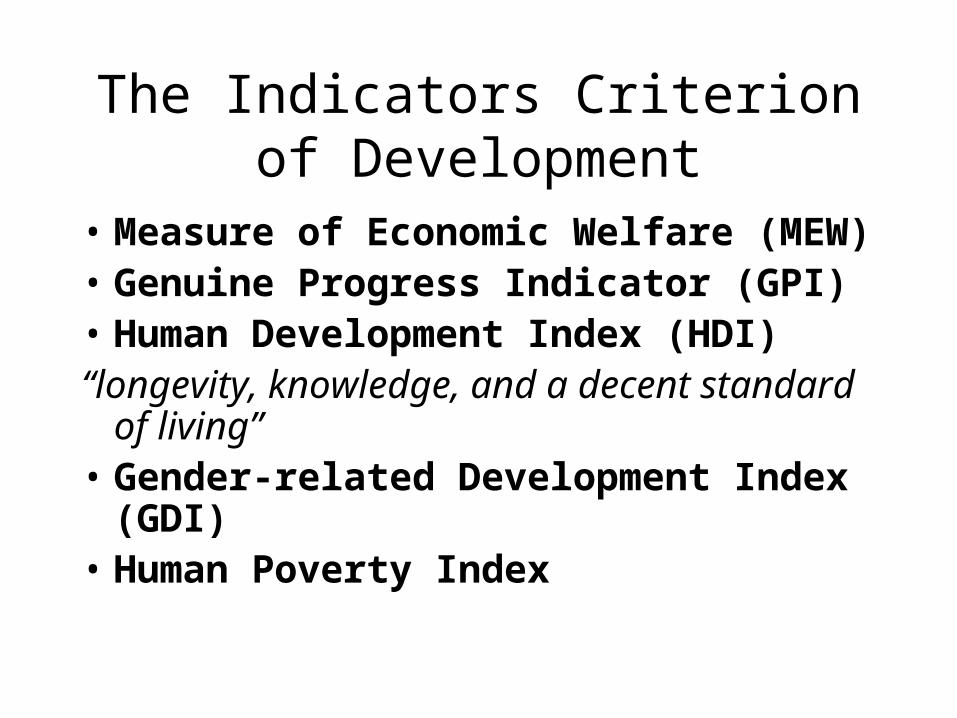
The Indicators Criterion of Development
• Measure of Economic Welfare (MEW)• Genuine Progress Indicator (GPI)• Human Development Index (HDI)“longevity, knowledge, and a decent standard
of living”• Gender-related Development Index
(GDI)• Human Poverty Index

Human Development IndexHDI = 1/3 L + 1/3 E + 1/3 Y
E = Educational attainment
L = Life Expectancy
Y = Income
xi = E, L, Y
xi = actual value of xi – minimum value of xi
maximum value of xi – minimum value of xi
E = 2/3 adult literacy rate (A) + 1/3 combined enrollment ratio (C)
max E = 100%; min E = 0%
min L= 25 yrs; max L = 85 yrs
Y = log (PPP measure of GDP per capita) – log (100)
log (40,000) – log (100)
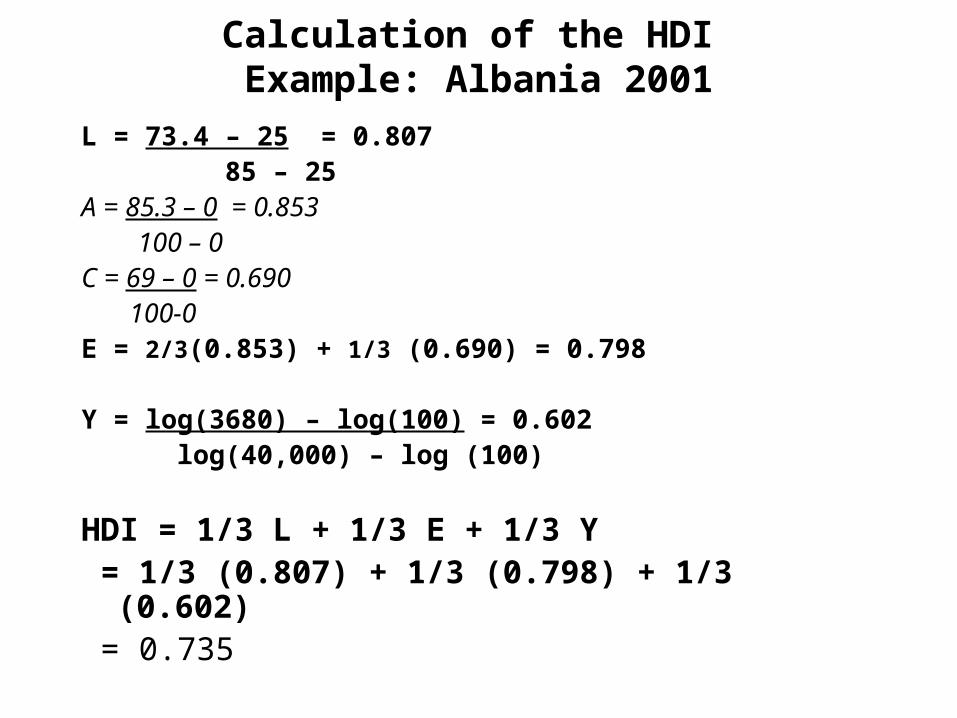
Calculation of the HDI Example: Albania 2001
L = 73.4 – 25 = 0.807 85 – 25A = 85.3 – 0 = 0.853
100 – 0C = 69 – 0 = 0.690 100-0E = 2/3(0.853) + 1/3 (0.690) = 0.798
Y = log(3680) – log(100) = 0.602 log(40,000) – log (100)
HDI = 1/3 L + 1/3 E + 1/3 Y = 1/3 (0.807) + 1/3 (0.798) + 1/3 (0.602) = 0.735

Adjustments to the HDI
• The gender-related development index: GDI – takes into account the differences between women and
men on the values of the indicators that enter the HDI. – All countries do worse as reflected in the deterioration
of their HDI as converted into GDI.• The human poverty index: HPI
– corrects for another weakness of HDI in that it does not show what’s happening to the poorest members of society.
– slightly different variables in the index – e.g. % of people not using improved water sources; % of children under five who are underweight, etc.
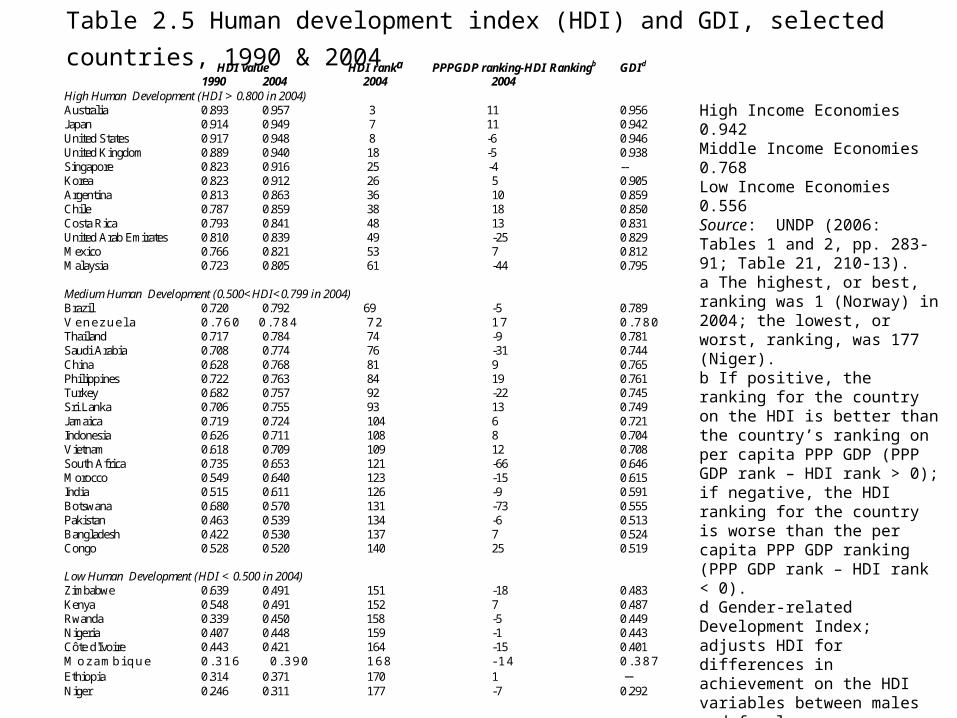
HDI value HDI ranka PPPGDP ranking-HDI Rankingb GDId 1990 2004 2004 2004
High Human Development (HDI > 0.800 in 2004) Australia 0.893 0.957 3 11 0.956 Japan 0.914 0.949 7 11 0.942 United States 0.917 0.948 8 -6 0.946 United Kingdom 0.889 0.940 18 -5 0.938 Singapore 0.823 0.916 25 -4 -- Korea 0.823 0.912 26 5 0.905 Argentina 0.813 0.863 36 10 0.859 Chile 0.787 0.859 38 18 0.850 Costa Rica 0.793 0.841 48 13 0.831 United Arab Emirates 0.810 0.839 49 -25 0.829 Mexico 0.766 0.821 53 7 0.812 Malaysia 0.723 0.805 61 -44 0.795 Medium Human Development (0.500<HDI<0.799 in 2004) Brazil 0.720 0.792 69 -5 0.789 V enezuel a 0.760 0.784 72 17 0.780 Thailand 0.717 0.784 74 -9 0.781 Saudi Arabia 0.708 0.774 76 -31 0.744 China 0.628 0.768 81 9 0.765 Philippines 0.722 0.763 84 19 0.761 Turkey 0.682 0.757 92 -22 0.745 Sri Lanka 0.706 0.755 93 13 0.749 Jamaica 0.719 0.724 104 6 0.721 Indonesia 0.626 0.711 108 8 0.704 Vietnam 0.618 0.709 109 12 0.708 South Africa 0.735 0.653 121 -66 0.646 Morocco 0.549 0.640 123 -15 0.615 India 0.515 0.611 126 -9 0.591 Botswana 0.680 0.570 131 -73 0.555 Pakistan 0.463 0.539 134 -6 0.513 Bangladesh 0.422 0.530 137 7 0.524 Congo 0.528 0.520 140 25 0.519 Low Human Development (HDI < 0.500 in 2004) Zimbabwe 0.639 0.491 151 -18 0.483 Kenya 0.548 0.491 152 7 0.487 Rwanda 0.339 0.450 158 -5 0.449 Nigeria 0.407 0.448 159 -1 0.443 Côte d'Ivoire 0.443 0.421 164 -15 0.401 M ozambi que 0.316 0.390 168 - 14 0.387 Ethiopia 0.314 0.371 170 1 -- Niger 0.246 0.311 177 -7 0.292
Table 2.5 Human development index (HDI) and GDI, selected countries, 1990 & 2004
High Income Economies 0.942Middle Income Economies 0.768Low Income Economies 0.556
Source: UNDP (2006: Tables 1 and 2, pp. 283-91; Table 21, 210-13).a The highest, or best, ranking was 1 (Norway) in 2004; the lowest, or worst, ranking, was 177 (Niger).b If positive, the ranking for the country on the HDI is better than the country’s ranking on per capita PPP GDP (PPP GDP rank – HDI rank > 0); if negative, the HDI ranking for the country is worse than the per capita PPP GDP ranking (PPP GDP rank – HDI rank < 0).d Gender-related Development Index; adjusts HDI for differences in achievement on the HDI variables between males and females.
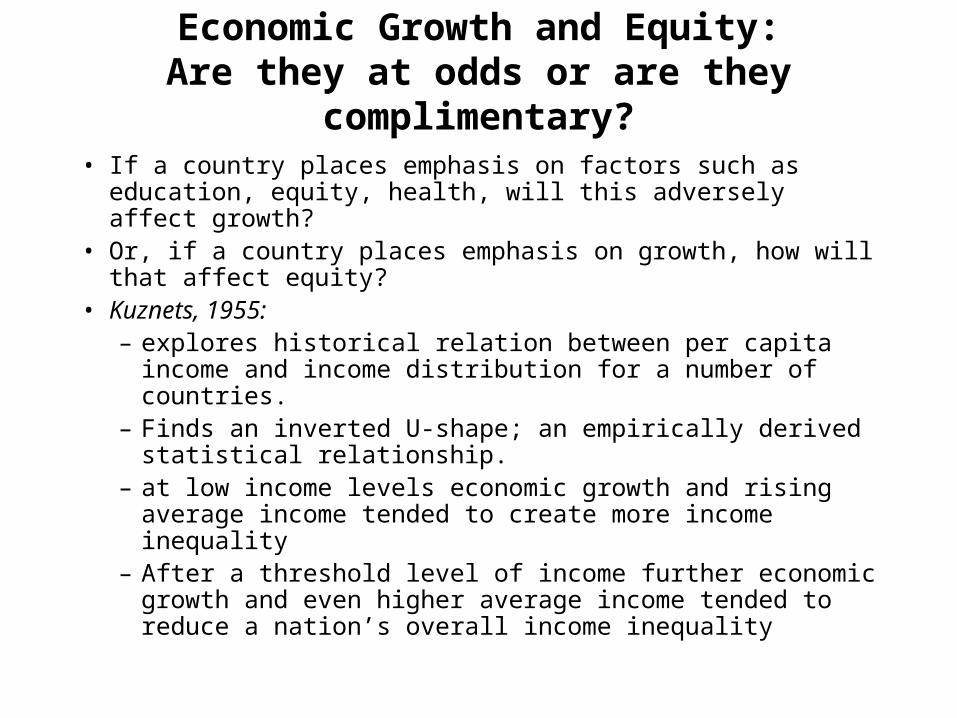
Economic Growth and Equity:Are they at odds or are they complimentary?
• If a country places emphasis on factors such as education, equity, health, will this adversely affect growth?
• Or, if a country places emphasis on growth, how will that affect equity?
• Kuznets, 1955: – explores historical relation between per capita income and
income distribution for a number of countries. – Finds an inverted U-shape; an empirically derived statistical
relationship.– at low income levels economic growth and rising average
income tended to create more income inequality – After a threshold level of income further economic growth
and even higher average income tended to reduce a nation’s overall income inequality
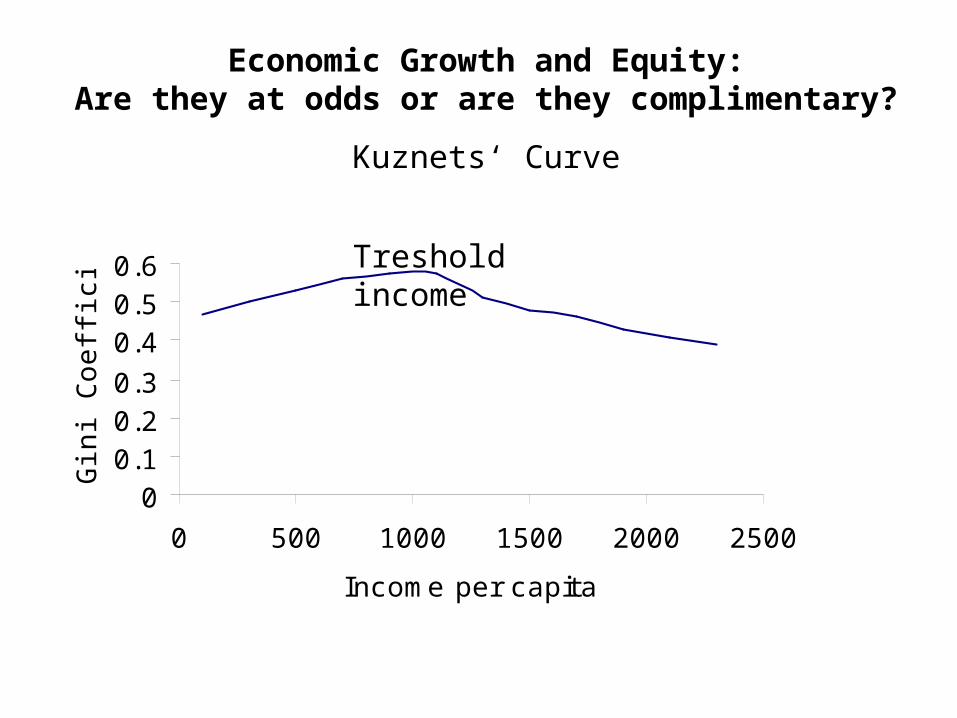
00.10.20.3
0.40.50.6
0 500 1000 1500 2000 2500
Income per capita
Gin
i C
oeffi
cient Treshold income
Economic Growth and Equity:Are they at odds or are they complimentary?
Kuznets‘ Curve