measuring environmental compliance assistance...
TRANSCRIPT

Measuring Environmental Compliance Assistance Outcomes: A Benefit Cost Analysis of the Kentucky Business Environmental Assistance Program
Kenya K. Stump
MPA CAPSTONE 2005 University of Kentucky
Running Head: ENVIRONMENTAL COMPLIANCE ASSISTANCE

ENVIRONMENTAL COMPLIANCE ASSISTANCE
2
TABLE OF CONTENTS
EXECUTIVE SUMMARY------------------------------------------------------ 3 INTRODUCTION---------------------------------------------------------------- 4 STATEMENT OF PROBLEM------------------------------------------------- 12 LITERATURE REVIEW-------------------------------------------------------- 15 METHODS------------------------------------------------------------------------ 18 LIMITATIONS------------------------------------------------------------------- 29 RESULTS-------------------------------------------------------------------------- 31 CONCLUSIONS/RECOMMENDATIONS---------------------------------- 39 WORKS CITED------------------------------------------------------------------ 47 APPENDIX A-------------------------------------------------------------------- 50

ENVIRONMENTAL COMPLIANCE ASSISTANCE
3
EXECUTIVE SUMMARY
The 1990 Clean Air Act Amendments (CAAA) established, in section 507, the Small Business Stationary Source Technical and Environmental Compliance Assistance Program (SBTCP). SBTCPs under the CAAA are designed to provide small stationary air pollution sources with technical and compliance assistance, develop tools and disseminate information, communicate requirements under the Act, and assist small businesses with pollution prevention. In Kentucky, the compliance and technical assistance program is known as the Kentucky Business Environmental Assistance Program (KBEAP). Since the program’s inception, measures of performance have primarily focused on outputs. With the establishment of Goal 5 of the 2003-2008 Environmental Protection Agency Strategic Plan, the focus on a federal level has shifted to measuring compliance assistance outcomes rather than outputs. To date, no programmatic outcome evaluation of a SBTCP has been conducted. Nationally, measuring outcomes of a SBTCP is an even greater concern because currently there is no mechanism in place whereby to measure programmatic A summative evaluation of KBEAP using Benefit-Cost Analysis establishes a standardized set of outcomes in terms of their dollar costs and benefits from fiscal year 1995-2004 as well as provides insights and recommendations for further study and programmatic improvements. From the model, KBEAP exhibits positive net benefits as well as benefit to cost ratios greater than one. In fact, B/C ratios on average approximate 3:1 with net-benefits on average approximating $3,000,000 per fiscal year. The model does exhibit considerably more sensitivity to variations in variable assumption than discount rates and is limited from the standpoint that serious data gaps are observed and is only externally valid to those programs programmatically similar to KBEAP. In conclusion, compliance assistance programs such as KBEAP have the opportunity to provide significant benefits to small businesses but the effort required to track these outcomes is still in its infancy both on a national and state level. It is hoped that this analysis will provide the impetus for other programs to explore outcome evaluation as well as lead to a national initiative to better understand the outcomes relating to environmental compliance assistance program and small businesses.

ENVIRONMENTAL COMPLIANCE ASSISTANCE
4
INTRODUCTION
The State of Small Business
In 2000, federal regulations cost an estimated $843 billion with small businesses
bearing a disproportionately large share of the burden. With Kentucky small
businesses comprising 97% of all businesses in the state (SBA Profiles, 2004), the
potential impact of regulatory burdens on the economy is significant. In fact,
environmental regulations on a cost per employee basis are $1,213 and
disproportionately higher ($3,328) for firms with less than 20 employees (Crain,
p.3). Also, the manufacturing sector bears the highest total regulatory burden
compared to other sectors with environmental regulations accounting for
approximately 50-65% of the total costs per firm (Crain, Table 9A and B). With
statistics like these, it is not surprising that traditional “command and control”
enforcement techniques have yielded to more proactive mechanisms such as
compliance assistance programs and market based incentives, but how do these
new programs influence business operations and compliance rates from a cost
benefit perspective? To answer this question, it is important to first understand the
profile of Kentucky’s manufacturing sector as well as that of an environmental
compliance assistance program.
Kentucky’s small manufacturing sector has remained relatively stable since 2000,
according to profiles from the Small Business Administration’s Office of
Advocacy. This is illustrated in Figure 1. From the data, approximately 4-5% of

ENVIRONMENTAL COMPLIANCE ASSISTANCE
5
Kentucky Small Manufacturing Firms
0500
10001500200025003000350040004500
2000 2001 2002 2003 2004
Year
# of
Fir
ms
# of Manufacturing(less than 500)
# Manufacturing(less than 100)
Total # ofManufacturing Firms
total businesses are manufacturing. Ninety percent (90%) of manufacturers with
less than 500 employees employ less than 100 employees which exemplifies the
importance of small businesses within the manufacturing sector.
As far as the make up of Kentucky’s small manufacturing sector (<100
employees), there are approximately 5 dominant sectors: Lumber Products,
Printing and Publishing, Fabricated Metal Products, Industrial and Commercial
Machinery & Computers, and Miscellaneous Manufacturing. Figure 2 gives the
breakdown by Standard Industrial Classification Code. This is in comparison to
Figure 3 which gives the breakdown of the entire manufacturing sector in
Kentucky. Similarities of major industrial sectors exist in both figures.
Figure 1: Source: SBA Profiles

ENVIRONMENTAL COMPLIANCE ASSISTANCE
6
Industry Sectors of KY Small Manufacturers
050
100150200250
Foo
d P
rod.
Tob
acco
Tex
tile
App
arel
Lum
ber
and
Woo
dF
urni
ture
Pap
er
Prin
ting
Che
mic
al
Pet
role
umR
ubbe
r an
dP
last
icLe
athe
r P
rod.
Min
eral
Pro
d.
1o M
etal
s
Fab
. Met
al
Mac
hine
ry &
Com
pute
rsE
lect
roni
cs
Tra
nspo
rtat
ion
Ana
lysi
sE
quip
.M
isc.
Mfg
.
20 21 22 23 24 25 26 27 28 29 30 31 32 33 34 35 36 37 38 39
SIC
# o
f F
irm
s
Industry Sector of Kentucky Mfg
0100200300400500600700800
Food
mfg
Bev
erag
e &
Text
ile m
illsTe
xtile
pro
d.
App
arel
Leat
her
Woo
d pr
oduc
tP
aper
Prin
ting
Pet
role
um &
Che
mic
al
Pla
stic
s &
Non
met
allic
Prim
ary
met
alFa
b. m
etal
Mac
hine
ryC
ompu
ter &
Ele
ctric
alTr
ansp
orta
tion
Furn
iture
M
isc.
Mfg
NAICS
# of
Fir
ms
Figure 2: Source: Kentucky Cabinet for Economic Development (www.thinkkentucky.com)
Figure 3: Source: Harris InfoSource (www.harrisinfosource.com)

ENVIRONMENTAL COMPLIANCE ASSISTANCE
7
Even though Kentucky’s manufacturing sector comprises only a small percentage
of total employer firms, the value added to Kentucky economy by this sector is
estimated to be $38,377,622,000 according to the Kentucky Economic
Development Cabinet (1997). In all, the manufacturing sector provides 288,405
Kentucky jobs. Accordingly, this translates to approximately twenty-seven
percent (27%) of Kentucky’s Gross Domestic Product.
Small Business Environmental Assistance
Given the impact of environmental regulations on small manufacturing firms and
the composition of Kentucky manufacturing sector, Congress in 1990 had the
foresight to understand that small businesses may not be equipped to comply with
the requirements of the new Clean Air Act Amendments (CAAA). Section 507,
established the Small Business Stationary Source Technical and Environmental
Compliance Assistance Programs (SBTCP) (CAAA, Section 507). These SBTCP
were mandated to contain three key components, located in various entities within
each state.
Key Components:
• Small Business Ombudsman • Compliance Assistance Program • Compliance Advisory Panel
o Two members selected by the Governor o Two members selected by the State Legislature o One member selected to represent the State Air Pollution Agency
or equivalent
Location of Programs:
• Economic Development Agencies • Commerce Departments

ENVIRONMENTAL COMPLIANCE ASSISTANCE
8
• Small Business Development Centers • Universities • Regulatory Agencies
Section 507 programs under the CAAA are designed to provide stationary sources
with technical and compliance assistance, develop tools and disseminate
information, communicate requirements under the Act, and assist small
businesses with pollution prevention. To be eligible for the services of a section
507 program, a small business must meet certain eligibility criteria.
Eligibility Criteria:
� Employs fewer than 100 individuals � Is a small business concern as defined in the Small Business Act � Is not a major source � Does not emit 50 tons or more per year of any regulated pollutant � Emits less than 75 tons per year of all regulated pollutants.
Section 507 programs are funded primarily through Title V emission fees and
most services are free to small businesses. In fact, states may reduce any fee
required by the Act to take into account the financial resources of small business
stationary sources.
Nationally, the state 507 programs coordinate with Environmental Protection
Agency’s Small Business Ombudsman to submit the SBTCP annual reports to
Congress. Nationally, 507 programs on average have a budget of $145,000 with
approximately 2.5 employees. The latest of these reports indicate that nationally,
over 850,000 businesses have been assisted through various compliance

ENVIRONMENTAL COMPLIANCE ASSISTANCE
9
assistance media including: seminars/workshops, publications, on-site visits, web
page development, and hotline calls (SBAP, 2000).
In Kentucky, the compliance assistance arm of the 507 Program or SBTCP is
known as the Kentucky Business Environmental Assistance Program (KBEAP)
and is housed with the Kentucky Small Business Development Center in the
Gatton College of Business and Economics at the University of Kentucky.
KBEAP has been in operation since 1994 and has operated under a Memorandum
of Understanding with the Kentucky Division for Air Quality.
Since KBEAP’s inception, the program has assisted over 500 small businesses in
various manufacturing sectors as illustrated by Figures 4 and 5.
20
8392
79
132
7083
96
87 89
0
20
40
6080
100
120
140
Fiscal Year
Total # Small Businesses Assisted
FY95FY96FY97FY98FY99FY00FY01FY02FY03FY 04
Figure 4 ( Source: KBEAP Database)

ENVIRONMENTAL COMPLIANCE ASSISTANCE
10
Industry sectors served by KBEAP parallel the demographics of KY
manufacturers outlined in figures 2 and 3. The average employment of a KBEAP
client is 28 employees with a statewide distribution across most of the 120
counties as seen in Figure 6. KBEAP does not serve Jefferson county due to it’s
designation as an air quality management district separate from the rest of the
state of Kentucky. KBEAP clients are primarily (45%) referred by Kentucky
Division for Air Quality inspectors with the remaining referrals coming from
various partner groups as well as small businesses themselves (KBEAP
Database).
Client Industry Sectors
21%
3%
3%
4%
4%
4%
5%
6%8%
9%
15%
15%
3%
Other
ChemicalsPersonal servicesPrinting and Publishing
Rubber and PlasticTransportationPetroleum
Wholesale tradeFurniture and FixturesMachinery and Computers
Fabricated MetalWood ProductsStone Clay and Glass
Figure 5 (Source: KBEAP Database)

ENVIRONMENTAL COMPLIANCE ASSISTANCE
11
Figure 6: KBEAP Clients By County and DAQ Region (KBEAP Database,Feb. 2004)
PaducahBowling Green
Owensboro
London
Hazard
Ashland
Florence
Frankfort
BOONECAMPBELL
KENTON
GALLATIN
CARROLLTRIMBLE
OWEN
HENRY
GRANT
HARRISON
PENDLETONBRACKEN
MASONROBERTSON
NICHOLASFLEMING
LEWIS GREENUP
ROWAN
CARTER BOYD
ELLIOTTLAWRENCE
MORGANMENIFEE
MONTGOMERY
BATH
WOLFE MAGOFFIN
JOHNSONMARTIN
FLOYDPIKE
KNOTT
LETCHER
BREATHIT
LEE
OWSLEY
PERRY
LESLIE
HARLAN
BELL
KNOX
CLAYLAUREL
WHITLEY
JACKSON
ROCKCASTLE
LINCOLN
BOYLE
CASEY
POLASKI
MCCREARY
WAYNE
RUSSELL
CLINTON
CUMBERLAND
MONROE
METCALFE
ADAIR
TAYLOR
MARION
GREEN
LARUE
HART
BARREN
ALLENSIMPSON
WARRENLOGAN
TODD
EDMONSONBUTLER
ESTILL
POWELL
MADISON
GARRARD
FAYETTE
BOURBONSCOTT
FRANKLINSHELBY
WOODFORDANDERSON
SPENCER
JESSAMINE
MERCERWASHINGTON
NELSON
OLDHAM
JEFFERSON
BULLITT
HARDIN
GRAYSON
MEADE
BRENCKINRIDGE
HANCOCK
OHIO
UNION
HENDERSONDAVIESS
MCLEANWEBSTER
HOPKINS
MUHLENBERG
CHRISTIAN
TRIGG
CALDWELL
LYON
CRITTENDEN
LIVINGSTON
MARSHALL
CALLOWAY
GRAVES
FULTON
HICKMAN
CARLISLE
BALLARDMCCRACKEN
CLARK42
21 22
13
1314
1115
11
11
13
10
12
1410
11
13
11
9
2 1
32
24
1
1
1
16
2
34
6
4 5
3
2
4
2
31
5
4
5 48
2
17
510
2
6
87
33
21 2
44
3
41
24
2
41
5
4
10
4
1
2
61
2
5
2
1
11
4
3
4
5
78
3
3
3
3
17
1

ENVIRONMENTAL COMPLIANCE ASSISTANCE
12
STATEMENT OF PROBLEM
To date, KBEAP has focused on reporting outputs of the program; however, with
the development of Goal 5 of the Environmental Protection Agency’s 2003-2008
Strategic Plan, KBEAP’s focus has shifted to outcomes rather than outputs as
seen in Figure 7 (OECA, 2002).
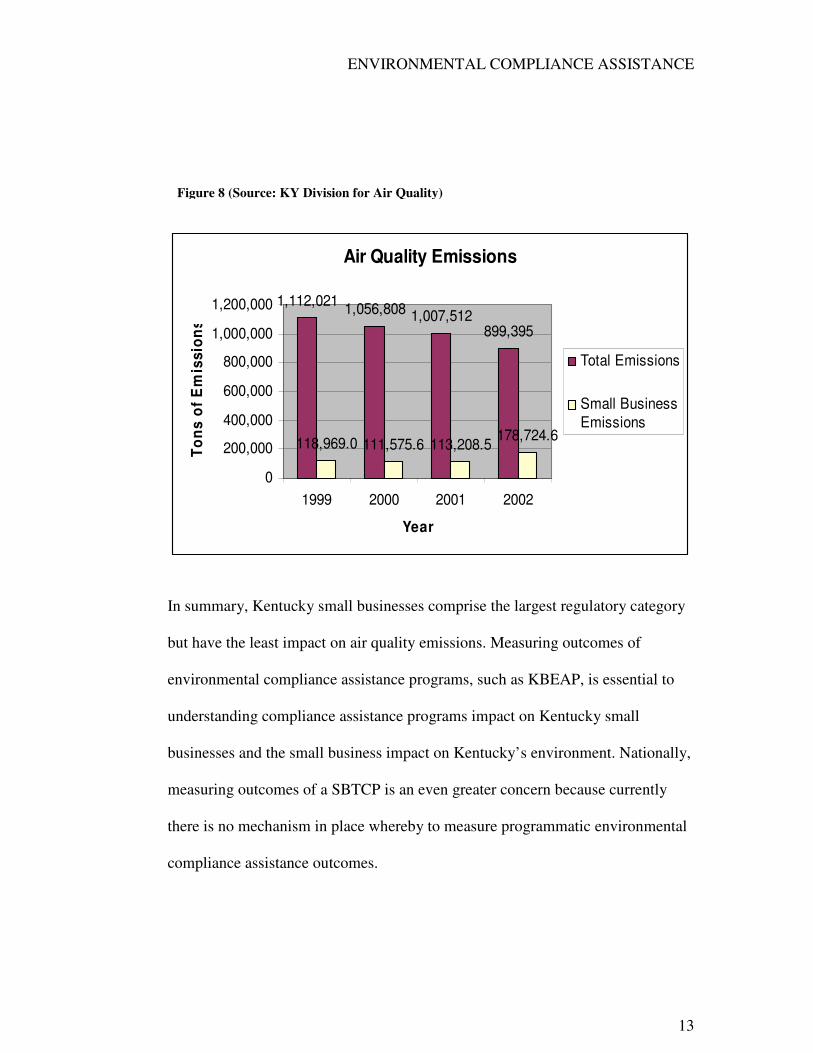
With 77% of air quality permitted sources being small businesses and 87% of
Division for Air Quality minor source registrations being small businesses, it is
not surprising that outcomes of compliance assistance activities are becoming a
primary focus. However, small business from 1999-2002 accounted for <20% of
the total air quality emissions (Figure 8).
Figure 7: Outcomes versus Outputs (OECA)
ENVIRONMENTAL COMPLIANCE ASSISTANCE
13
In summary, Kentucky small businesses comprise the largest regulatory category
but have the least impact on air quality emissions. Measuring outcomes of
environmental compliance assistance programs, such as KBEAP, is essential to
understanding compliance assistance programs impact on Kentucky small
businesses and the small business impact on Kentucky’s environment. Nationally,
measuring outcomes of a SBTCP is an even greater concern because currently
there is no mechanism in place whereby to measure programmatic environmental
compliance assistance outcomes.
Figure 8 (Source: KY Division for Air Quality)
Air Quality Emissions
1,112,021 1,056,808 1,007,512899,395
118,969.0 111,575.6 113,208.5 178,724.6
0
200,000
400,000
600,000
800,000
1,000,000
1,200,000
1999 2000 2001 2002
Year
Tons
of E
mis
sion
s
Total Emissions
Small BusinessEmissions

ENVIRONMENTAL COMPLIANCE ASSISTANCE
14
Therefore, a summative evaluation using benefit cost analysis is proposed to
establish standardized outcome measures in terms of the dollar value costs and
benefits. The purpose is to determine if the:
1) Net benefits of environmental compliance assistance program, such as
KBEAP, will be positive
2) Benefit to cost ratio will be greater than 1:1.
3) Benefit Cost Model will identify areas of concern and lead to internal as
well as external recommendations for programmatic improvements.

ENVIRONMENTAL COMPLIANCE ASSISTANCE
15
LITERATURE REVIEW
Outcome Measurement
The primary source of information regarding measurement of environmental
compliance assistance program is from the Office of Enforcement and
Compliance Assurance (OECA) which outlines survey methods and measures to
use for measuring compliance assistance outcomes. The Guide for Measuring
Compliance Assistance Outcomes outlines how program move from measuring
outputs to outcomes using survey methodology. The guide does not speak to
benefit cost analysis of compliance assistance program but does help frame the
outcome measures.
The National Center for Environmental Innovation (NCEI) is comprised of an
Evaluation of Environmental Programs (http://www.epa.gov/evaluate/) program
that uses the Logic Model approach in its evaluation of environmental programs.
More specifically, “This web site is designed as a web-based "gateway", linking
to environmental program evaluation information within EPA and information
resources beyond the Agency. It examines how EPA is using evaluation to
reinforce and enhance many of the performance activities required under the
Government Performance and Results Act (GPRA).” (NCEI, 2005)
The Compliance Assistance Advisory Committee (CAAC) of the National
Advisory Council for Environmental Policy and Technology reviews EPA’s

ENVIRONMENTAL COMPLIANCE ASSISTANCE
16
compliance assistance programs and makes recommendation for improvement.
One of the key recommendations from the CAAC to EPA relates to the
measurement of the effectiveness of compliance assistance and enforcement at
EPA. CAAC encourages the development of an effective way to track and report
compliance trends and rates nationally.
Environmental Benefit Cost Analysis
While there has been much written about cost benefit analysis relating to the
environment, one of the most accessible and interactive resources for using cost
benefit for environmental decision-making comes from the Nation Center for
Environmental Decision-Making Research
(http://www.ncedr.org/tools/othertools/costbenefit/overview.htm ). The
interactive web site presents seven modules whereby the practitioner can learn the
basic principles of cost benefit analysis and how they are applied to
environmental decision-making.
Also of interest is the National Center for Environmental Economics
(http://yosemite1.epa.gov/ee/epa/eed.nsf/Webpages/AboutNCEE.html) which
provides benefit-cost research and techniques, economic impact models and
measures, as well as economic incentive mechanisms.
Finally, Richard D. Morgenstern’s Economics Analysis at EPA: Assessing
Regulatory Impact provides a review of 12 case studies of regulatory impact

ENVIRONMENTAL COMPLIANCE ASSISTANCE
17
assessments prepared by EPA and other agencies.
(http://yosemite.epa.gov/ee/epalib/riaepa.nsf/ed707b14c8d6325e852565a500501e
d4/4249439b57fc474185256757006e1841!OpenDocument) Specifically,
Morgenstern identifies three deficiencies
(1) "The underlying scientific and risk information was so uncertain that it provided an insufficient basis on which to conduct an economic analysis. (2) The economic analysis itself was technically flawed in one or more critical ways. (3) The economic analysis was not designed to address a sufficiently rich array of policy options and was thus rendered irrelevant to actual policy and regulatory decisions." (p. 472)

ENVIRONMENTAL COMPLIANCE ASSISTANCE
18
METHODS
Research Question The purpose is to determine if the:
4) Net benefits of environmental compliance assistance program, such as
KBEAP, will be positive
5) Benefit to cost ratio will be greater than 1:1.
6) Benefit Cost Model will identify areas of concern and lead to internal as
well as external recommendations for programmatic improvements.
Population The sample of interest is KBEAP clients from fiscal year 1995-2004 and is the
entire KBEAP client population from Fiscal year 1995-2004, totaling 831
separate assistance activities. Currently, KBEAP client data is housed in a
Microsoft Access database. The data includes client contact information,
geographic information, compliance activities, and client survey and evaluation
information. Only the outputs of those firms assisted by KBEAP will be
evaluated and included in the analysis.
Measures
Measures of environmental compliance assistance outcomes for this evaluation
include the cost and benefits in dollar values. Costs and benefits under
consideration in the Benefit Cost Model include those outlined in the KBEAP
Logic Model presented in Figure 9. Outcomes beyond the firm or societal benefits
and costs, such as reduction in healthcare costs due to pollution reductions,

ENVIRONMENTAL COMPLIANCE ASSISTANCE
19
aesthetic environmental improvements due to pollution reductions, less school or
work absentees due to pollution reductions, and a possible decrease in economic
development due to higher regional compliance costs, are not considered in this
evaluation; however, for further readings on these types of costs and benefits see
Environmental Economics: An Introduction by Barry C. Field and Martha K.
Field and Economics of the Environment by Robert N. Stavins.
Figure 9: KBEAP Logic Model

ENVIRONMENTAL COMPLIANCE ASSISTANCE
20
Measures considered for the Benefit Cost Model are outlined below:
Benefit Measures:
(1) Value of Permitting Assistance = # of permit applications prepared *
market cost ($) of application preparation by consultant
(2) Value of Non-permitting assistance = # of non-permitting clients* hours
of assistance * $ consultant hourly rate.
(3) Value of non-client assistance = # of hours spent on non-client activities *
hourly consultant rate. Non-clients include those businesses that do not
meet KBEAP eligibility requirements for technical assistance but are
eligible for information and office consultations and training.
(4) Air Quality Violations Avoided = # of permitting clients * # of permitting
clients eligible for KBEAP “Protection” * Cost of violation. Clients not
referred to KBEAP by Division for Air Quality Inspectors are eligible for
reduced or eliminated fines when compliance problems are resolved
through KBEAP. Therefore, businesses that work with KBEAP on
compliance problems before a DAQ inspector finds the violation avoid
potential fines.
(5) Value of KBEAP training programs = # of training programs * market
value of training program * # of attendees

ENVIRONMENTAL COMPLIANCE ASSISTANCE
21
(6) Pollution prevention (P2) savings = # of KBEAP clients participating in P2
*tons of pollution reduced at each facility (air, water, hazardous waste,
solid waste) * disposal fee/emission fee
(7) Energy efficiency (E2) savings = (# of KBEAP clients participating in E2
*Cost of energy at facility Pre-E2) – (Cost of energy at facility Post-E2 * #
of KBEAP clients participating in E2). Benefits due to energy efficiency
are not realized until year 2000 due to KBEAP primary program focus not
being on E2 during startup. Full E2 benefits are realized over the 5 year
period from FY 2000 due to technology improvements in the E2 area.
(8) Green productivity = Value per production man hour *# of KBEAP clients
indicating productivity improvements * # of employees * # of hours
worked * % increase in value per production man hour due to green
practices resulting in less absenteeism, safer work environment, improved
morale. Productivity benefits are not realized until FY 2000 when
KBEAP’s program focus began to shift to other compliance assistance
areas.
Green Productivity (GP) is a concept illustrated by the Asian Productivity
Organization (2005). In simplest terms Green Productivity (GP) is a strategy for
enhancing productivity and environmental performance simultaneously for
overall socio-economic development (http://www.apo-
tokyo.org/gp/01about_gp.htm).

ENVIRONMENTAL COMPLIANCE ASSISTANCE
22
Sara A. Morris (1997) in “Environmental Pollution Prevention and Competitive
Advantage: An Exploratory Study of U.S Industrial Goods Manufacturing”
provides theoretical justification for the link between a firm’s environmental
performance and competitive advantage. Findings suggest a strong negative
correlation between the pollution that a firm releases and the firm’s cost
advantage.
Gagnon and Judd (2003) (http://www.sfr.cas.psu.edu/FACULTY/michael.htm) in
“Employee Strategic Alignment at a Wood Manufacturer: An Exploratory
Analysis Using Lean Manufacturing” indicate that the inclusion of employees in
the implementation of a new strategic initiatives such as lean manufacturing can
result in employees exhibiting increased levels of commitment, job satisfaction,
and trust.
Javier and Oscar Gonzalez-Benito (2005) illustrate in their work on
environmental productivity and business performance that there is no single
response for whether environmental performance has a positive effect on business
performance but rather that disaggregation is necessary for more concrete
relationships.

ENVIRONMENTAL COMPLIANCE ASSISTANCE
23
(9) Value of green image to marketing = % increase in profit of KBEAP
clients offering green marketing of product or increase in market share
due to green product branding. Jacquelyn Ottman (2005) is a pioneer in
the concept of green marketing. The website www.greenmarketing.com
offers insights into the link between environmental image and consumer
behavior.
(10) Good Corporate Citizen Value = % change in shareholder value of those
KBEAP clients who value corporate social responsibility. Harvey Meyer
in “The Greening of Corporate America” illustrates through case studies
that the “green bandwagon” can increase customer base, market share, add
shareholder value, and increase employee motivation and pride resulting
in productivity improvements. Meyer indicates a positive correlation
between environmental performance and stock market performance.
(11) Reduction in insurance premiums due to green practices = insurance
cost (workers compensation, fire, environmental liability) * # of KBEAP
clients participating in green practices * % reductions in insurance
premiums due to safer work environments.
Roelofs et al. (2000), in “Pollution Prevention and the Work Environment:
The Massachusetts Experience” seek to understand to what extent worker
health and safety issues have been integrated into toxic use reduction
activities.

ENVIRONMENTAL COMPLIANCE ASSISTANCE
24
Washington State Department of Ecology (2005) explores the relationship
between insurance costs and pollution prevention. By reducing environmental
risk case studies show that insurance costs can be reduced. Specifically, “the
use and generation of hazardous materials creates significant risks to the
environment. It also creates major potential costs and liabilities for business.
Insurance provides a means to protect business from some of these costs and
liabilities. Most importantly, it can create strong incentives to implement
pollution prevention.” (http://www.ecy.wa.gov/biblio/99434.html)
Cost Measures:
(1) Program Budget
(2) Production Value lost due to environmental compliance activities = Value
Added per production man hour * Time spent on compliance activities * #
of employees * # of KBEAP clients with compliance responsibilities.
Production value losses are not seen in the Benefit cost model until FY
2000 due to Title V permitting requirements. In other words, regulatory
requirements due to Title V permitting became more constraining to small
businesses beginning in FY 2000.
(3) Capital expenditures of compliance equipment such as add on control
devices or equipment upgrades.
(4) Capital expenditures for pollution prevention equipment such as grinders,
cardboard compactors, water flow regulators, motion sensors, etc.

ENVIRONMENTAL COMPLIANCE ASSISTANCE
25
(5) Production Value lost due to pollution prevention activities = Value
Added per production man hour * Time spent on P2 * # of employees * #
of KBEAP clients participating in P2.
Procedures Information sources for the estimation of the benefits and costs outlined above for
fiscal year 1995-2004 are outlined below.
• Bureau of Labor Statistics Data • U.S Census Data • Kentucky Economic Research Statistics • Small Business Administration Data, Office of Advocacy • State Data from the Energy Information Administration • Kentucky State of the Environment Reports • KBEAP Client Database • KBEAP Compliance Assistance Outcome Survey Results • KBEAP Client Evaluations
Once calculated, each benefit and cost for each fiscal year is converted to future
values.
FV = PV (1 +i)t
FV= future value from FY 95 PV = Present Value at time 2005 i = discount rate t = time
Total benefits and costs are calculated for each fiscal year. Finally, benefit to cost
(B/C) ratios and net benefits (total benefits-total costs) are calculated for each
fiscal year and for the nine (9) year review period.

ENVIRONMENTAL COMPLIANCE ASSISTANCE
26
Equations:
Benefit Cost Ratio (For each fiscal year) =
(Total Benefits Calculated in present day values)/ (Total Costs Calculated in
present day values)
Benefit Cost Ratio (Total FY 95-05) =
� (Total Benefits Calculated, present day values)/ � (Total Costs Calculated, present day values) Net Benefits (For each fiscal year) = (Total Benefits Calculated in present day
values)-(Total Costs Calculated in present day values)
Net Benefits (Total FY 95-05) =
� (Total Benefits Calculated, present day values)-� (Total Costs Calculated, present day values)
Sensitivity Analysis In order to evaluate the Benefit Cost Model, a sensitivity analysis is performed.
The model is evaluated at discount rates of 5%, 7%, and 9%. A discount of 7% is
recommended by the Federal Office of Management and Budget (OMB). Also,
the model will be evaluated at the lower limit, moderate values, and upper limit
for those instances where assumptions are made in calculating the benefits and
costs for the various categories. The range of values is shown in Table 1.
Table 1: Variable Ranges
Variable Lower Limit Moderate Upper Limit Source % KBEAP clients requesting permit
55% 75% 95% KBEAP Database

ENVIRONMENTAL COMPLIANCE ASSISTANCE
27
assistance Permit Application Cost
$3,000 $7,500 $10,000 KBEAP Staff
Hourly Consultant Rate $75 $100 $125 KBEAP
Staff % KBEAP client not referred by DAQ
35% 55% 75% KBEAP Database
Operating without a permit fine
$2,500 $10,000 $32,500
Kentucky State of the Environment Reports & Civil Penalty Fines
% Outreach (Training) 5% 10% 25% KBEAP
Database Cost of Training 75$ $120 $240 KBEAP
Staff # of attendees 5 10 25 KBEAP
Database % KBEAP clients participating in P2
20%
31%
41%
KBEAP Measuring CA Outcomes Survey
% KBEAP clients participating E2
5%
12%
25%
KBEAP Measuring CA Outcomes Survey
% E2 reduction 1% 2.5% 5%
EPA Energy Star & KBEAP
% P2 Solid Waste Reductions
15% 30% 50% KBEAP Staff & KPPC
% P2 Hazardous Waste Reductions
5%
10%
15%
KBEAP Staff
% KBEAP 25% 49% 70% KBEAP

ENVIRONMENTAL COMPLIANCE ASSISTANCE
28
clients who are hazardous waste generators
Measuring CA Outcomes Survey
$ Increase in productivity 0.5% 1.0% 1.5% KBEAP
Staff % KBEAP clients realizing work environment improvements
10% 22% 50%
KBEAP Measuring CA Outcomes Survey
Employee time spent on compliance activities
8 hours 33 hours 50 hours
KBEAP Measuring CA Outcomes Survey
Production down time for compliance activities
8 hours 20 hours 40 hours KBEAP Staff
Time client spends working with KBEAP 5 hours 15.56 hours 25 hours
KBEAP Measuring CA Outcomes Survey
% KBEAP clients making compliance improvements
20% 39% 60%
KBEAP Measuring CA Outcomes Survey
% workforce off due to compliance improvements
5% 25% 50% KBEAP Staff
CA = compliance assistance

ENVIRONMENTAL COMPLIANCE ASSISTANCE
29
LIMITATIONS
The major limitation with the benefit cost model and the measures outlined above
is the lack of appropriate data. KBEAP’s current evaluation and measurement
metrics do not include several of the measures outlined above. Nationally, there
has been no comprehensive study on compliance assistance outcomes of the
SBTCPs and there is no known outcome metrics established for the SBTCPs.
Based on this data gap, the following measures were unable to be calculated due
to lack of appropriate baseline data statewide as well as nationally.
Benefits (not calculated):
• Pollution prevention benefits due to air and water pollution reductions
• Good Corporate Citizen Value
• Value of Green Image to Marketing
• Insurance Reductions due to safer work environments
Costs (not calculated):
• Capital expenditures due to pollution prevention and compliance
equipment
• Production value lost due to P2 activities
The second limitation is one of external validity. The benefit cost model outline
above is only valid to other SBTCPs that are programmatically similar in structure
and services offered. Those SBTCPs include Nevada, Idaho, Pennsylvania, and
Iowa in that these SBTCPs are located at a non-regulatory unit such as a

ENVIRONMENTAL COMPLIANCE ASSISTANCE
30
University or Small Business Development Center and conduct onsite technical
and compliance assistance. For the other SBTCPs nationwide, the benefit cost
model provides a good foundation for development but should not be duplicated
without careful consideration of the outcomes and how those outcomes relate to
the structure and function of the SBTCP.

ENVIRONMENTAL COMPLIANCE ASSISTANCE
31
RESULTS
B/C ratios and Net Benefits
Table 2 and Table 3 illustrate the sensitivity of the model with respect to discount
rates using the moderate model values. From the standard deviations, it is
apparent that the model is not sensitive to discount rate when looking at B/C ratio
and net benefits; however the variability does appear to decrease through time for
both B/C ratio and net benefits. This indicates that discount rates are not
significant variables in the model due to the relatively short period of time over
which the model runs.
Table 2: B/C ratios at Various Discount Rates by Fiscal Year
i FY 95
FY 96
FY 97
FY 98
FY 99
FY 00
FY 01
FY 02
FY 03
FY 04
Total 95-05
SD AVE
0.05 2.25 3.82 3.62 3.00 3.55 2.33 2.68 2.62 2.57 2.69 2.84 0.56 2.91 0.07 2.11 3.64 3.48 2.9 3.46 2.28 2.64 2.59 2.54 2.68 2.79 0.53 2.83 0.09 1.99 3.48 3.35 2.81 3.38 2.23 2.6 2.56 2.52 2.67 2.74 0.5 2.76 SD 0.13 0.17 0.14 0.10 0.09 0.05 0.04 0.03 0.03 0.01 0.05 0.05 0.08 AVE 2.12 3.65 3.48 2.9 3.46 2.28 2.64 2.59 2.54 2.68 2.79 0.53 2.83 See APPENDIX A for sample data representing moderate values at 7% discount rate. Table 3: Net benefits at Various Discount Rates by Fiscal year ($000)
i FY 95
FY 96
FY 97
FY 98
FY 99
FY 00
FY 01
FY 02
FY 03
FY 04
Total 95-05
SD AVE
0.05 390 1,907 2,055 1,604 2,985 1,897 2,513 2,728 2,592 2,693 21,364 759 2,136 0.07 415 2,072 2,202 1,694 3,131 1,948 2,576 2,774 2,615 2,706 22,134 766 2,213 0.09 443 2,263 2,370 1,796 3,292 2,002 2,643 2,821 2,639 2,719 22,990 779 2,299 SD 26.5 178.2 157.6 96.1 153.6 52.5 65.0 46.5 23.5 13.0 813.4 61.4 81.2 AVE 416 2,081 2,209 1,698 3,136 1,949 2,577 2,774 2,615 2,706 22,163 766 2,216 See APPENDIX A for sample data representing moderate values at 7% discount rate.

ENVIRONMENTAL COMPLIANCE ASSISTANCE
32
Table 4 and Table 5 demonstrate the sensitivity of the benefit cost model to the
lower, moderate, and upper limits of the model assumptions using a discount rate
of 0.07.
Table 4: B/C Ratio at Various Limits by Fiscal Year
Limit FY 95
FY 96
FY 97
FY 98
FY 99
FY 00
FY 01
FY 02
FY 03
FY 04
Total 95-05
SD AVE
Low 0.69 1.19 1.23 1.08 1.51 1.83 2.19 2.25 2.26 2.33 1.68 0.59 1.66 Mod 2.11 3.64 3.48 2.9 3.46 2.28 2.64 2.59 2.54 2.68 2.79 0.53 2.83 High 5.86 9.32 8.2 6.72 7.03 2.17 2.62 2.63 2.49 2.79 3.41 2.73 4.98 SD 2.67 4.17 3.56 2.88 2.8 0.23 0.25 0.21 0.15 0.24 0.88 1.64 1.72 AVE 2.83 4.58 4.12 3.39 3.7 1.63 1.93 1.92 1.86 2.01 2.19 0.92 3.16
Table 5: Net benefits at Various Limits by Fiscal year ($000)
Limit FY 95
FY 96
FY 97
FY 98
FY 99
FY 00
FY 01
FY 02
FY 03
FY 04
Total 95-05
SD AVE
Low 110 114 145 50 343 483 697 749 708 732 3,909 326 391 Mod 415 2,072 2,202 1,694 3,131 1,948 2,576 2,774 2,615 2,706 22,134 766 2,213 High 1,893 7,604 7,861 6,374 10,365 5,746 7,651 8,528 7,776 8,152 71,951 2,231 7,195 SD 1,038 3,885 3,996 3,281 5,173 2,716 3,597 4,036 3,657 3,843 35,222 1,072 3,522 AVE 733 3,263 3,403 2,706 4,613 2,726 3,641 4,017 3,700 3,863 32,665 1,060 3,266
Figure 10: Summary Benefitt Cost Ratio
0.001.002.003.004.005.006.007.008.009.00
10.00
FY95FY96
FY97FY98
FY99FY00
FY01FY02
FY03FY04
Total 9
5-04
Year
Rat
io
Low
Moderate
High

ENVIRONMENTAL COMPLIANCE ASSISTANCE
33
Based on Tables 4 and 5 and Figures 10 and 11, the benefit cost model is
considerably more sensitive to the variation in assumption used within the model.
Standard deviations of the B/C ratios vary considerable early on (Pre FY2000)
and then become stable in the later years (post 2000). This indicates that as
KBEAP developed programmatically, estimates of benefits and costs as well as
realized benefits and costs were uncertain but as the program became more
established so to did the ability to realize benefits and costs as well as estimate
those benefits and costs. In other words, as KBEAP’s services developed so did
the benefits, which is evident by the net benefits in Table 5. Early net benefits are
less than later net benefits.
Secondly, when the lower limits are used in the model, costs early on (pre FY
2000) are a more substantial influence than post FY 2000 when benefits become
Figure 11: Summary of Net Benefits
($2,000,000.00)$0.00
$2,000,000.00$4,000,000.00$6,000,000.00$8,000,000.00
$10,000,000.00$12,000,000.00
FY95FY96
FY97FY98
FY99FY00
FY01FY02
FY03FY04
Net
Ben
efits
Low
Moderate
High

ENVIRONMENTAL COMPLIANCE ASSISTANCE
34
more prominent. The opposite is true when using the higher limits of the
variables.
In summary, Table 6 and Table 7 show the average B/C ratios and standard
deviations for the variation in discount rates and variable limits per fiscal year as
well as the overall program B/C ratio and net benefits.
Table 6: Summary of Results (per fiscal year)
Variation Discount Rate
Variation Limits
B/C Ratio per fiscal year
2.83 ± 0.53 3.16 ± 0.92
Net benefit per fiscal year ($000)
2,216 ± 766 3,266 ± 1,060
Table 7: Overall Results
Variation Discount Rate
Variation Limits
Overall B/C ratio
2.79 ± 0.05 2.19 ± 0.88
Overall Net benefit ($000)
22,163 ± 813 32,665 ± 35,222
From the tables, the original proposition is supported that KBEAP does have a
benefit to cost ratio great than one (>1) and that the net benefits of the program
are positive.

ENVIRONMENTAL COMPLIANCE ASSISTANCE
35
Benefits and Costs Examined
For a greater understanding of programmatic changes as the variables change
within the benefit cost model, it is worth examining the overall benefits and costs
by category. Figures 12 a, b, and c illustrate the changes in benefits as the
variables range to low to high.
Figure 12 a:Benefits FY 95-04 (Lower Limits)
35.6%
6.1%
7.0%10.4%
20.5%
0.3%0.8%
8.0%
11.4%
Permitting Assistance
Non-Permitting Assistance
Non-client Assistance
Fines Avoided
Training
$ Saved from P2 (SolidWaste)
P2 (Hazardous Waste)
E2
Green Productivity

ENVIRONMENTAL COMPLIANCE ASSISTANCE
36
Figure 12 b:Benefits FY 95-04 (Moderate Limits)
35.3%
1.3%
2.7%
12.1%
7.4%
0.4% 0.4%
14.5%
25.9%
Permitting Assistance
Non-PermittingAssistance
Non-client Assistance
Fines Avoided
Training
$ Saved from P2 (SolidWaste)
P2 (Hazardous Waste)
E2
Green Productivity
Figure 12 C: Benefits 95-04 (Upper Limits)
19.3%
0.1%
1.1%
16.1%
4.7%
0.2%
1.6%
9.9%
47.0%
Permitting Assistance
Non-Permitting Assistance
Non-client Assistance
Fines Avoided
Training
$ Saved from P2 (Solid Waste)
P2 (Hazardous Waste)
E2
Green Productivity

ENVIRONMENTAL COMPLIANCE ASSISTANCE
37
Interesting enough, is the visual representation that with lowing limits permitting
assistance and energy efficiency dominate the benefits but with moderate values
one sees that permitting assistance remains dominant however fines avoided
becomes the second dominate benefit. With the upper limits in place, the measure
fines avoided becomes the overall dominant benefit. Making the transition from
lower to upper limits with the model variables one also sees that energy efficiency
benefits decrease but productivity benefits increase. These observations are
important from a programmatic perspective because given the environment in
which the program develops; services can be tailored in an efficient manner to
maximize benefits to the consumer (small businesses). Often, energy efficiency
and productivity improvements from a service provider’s perspective yield the
greatest benefits with the least amount of input (resource allocation).
In examining the costs, it is not surprising that as one moves from lower to upper
limits of the model variables, the dominant cost moves from budget to production
value losses due to
compliance down time
(Figures 13 a b c).
Figure 13 a: Costs 95-04 (Lower Limits)
83%
16% 1%Budget
Production ValueLoss (CA)
Production ValueLoss (CADownTime)

ENVIRONMENTAL COMPLIANCE ASSISTANCE
38
Figure 13 b:Costs 95-04 (Moderate Limits)
47%
35%
18%
Budget
Production ValueLoss (CA)
Production ValueLoss (CADownTime)
Figure 13 c:Costs 95-04 (Upper Limits)
23%
25%
52%
Budget
Production ValueLoss (CA)
Production ValueLoss (CADownTime)
This is important from a service provider’s perspective in that as regulatory
requirements develop and become more labor intensive for the small business,
compliance assistance providers should develop services that enable the small
business to minimize down time and compliance activities which inhibits
production time.

ENVIRONMENTAL COMPLIANCE ASSISTANCE
39
CONCLUSION/RECOMMENDATIONS
Based on the benefit cost model developed and the results, the original research
question that KBEAP has a benefit to cost ratio greater than 1 and that the net
benefits are positive is supported by the analysis and the analysis has lead to the
development of several recommendations.
Internal Recommendations
1) Based on the information from the benefit cost analysis, KBEAP should
develop a standardized set of metrics in the outcomes areas of (a)
Increased Awareness (b) Increased Understanding and (c) Behavior
Change: Environmental Change, Process Change, Management Change
2) KBEAP should incorporate those metrics identified into a standardized
client evaluation form in order to track outcomes and report outcomes in
the future
3) From previous evaluations, approximately 65% of KBEAP clients do not
understand the value of the compliance assistance services offered by
KBEAP. With the benefit cost analysis showing that overall client net
benefits of ~ $3,000,0000 per fiscal year and a benefit to cost ratio of ~3/1,
KBEAP should look into service changes that incorporate educating the
client on the monetary benefits of compliance assistance.
Those KBEAP clients that are proactive and whose working environment is
conducive to change will exhibit the largest net benefits. Typically, these
clients seek out KBEAP’s services rather than being referred. They request

ENVIRONMENTAL COMPLIANCE ASSISTANCE
40
information beyond basic compliance, take an active role in their facility’s
environmental compliance, train employees on the importance of
environmental compliance, place environmental compliance as a business
priority, and are willing to make changes based on KBEAP recommendations.
Those KBEAP clients who exhibit the lowest net benefits will be those who
are referred by an inspector and who are reactive rather than proactive based
on that referral. These clients want the “bare minimum” and want to fix the
immediate problem rather than fix the systemic issues. They are resistive to
change and are not engaged in nor do they prioritize their facility’s
environmental compliance status.
In all, client’s who are receptive to compliance assistance programs will reap
the highest net benefits. Those clients who do not may be better served by
traditional command and control approaches to environmental compliance.
4) KBEAP’s marketing plan should incorporate the use of the benefit cost
information in order to educate potential clients and draw potential clients
to KBEAP.
5) As KBEAP develops programmatically, services should include the
development of compliance tools to minimize small business activities
that reduce production time. Often small businesses do not have a

ENVIRONMENTAL COMPLIANCE ASSISTANCE
41
dedicated environmental compliance staff; therefore it is often the case
that production foremen, accountants, office assistants, human resource
personnel, others must take time to do environmental compliance work.
These individuals are not focusing on their primary job function and
productivity could suffer as a result.
6) KBEAP should also reevaluate its services offered and focus on promoting
those that yield the highest benefits. Traditionally, permitting services and
fines avoided have been the largest selling point of the program; however,
E2 and Green Productivity initiatives can yield large benefits with limited
program resource inputs. Partnerships/referral networks on these
initiatives have the potential to yield results in the least amount of time.
Potential partners could include the Kentucky Pollution Prevention Center
and the UK Center for Manufacturing’s Lean Manufacturing Program.
7) In order to address data gaps presented during the benefit cost analysis, an
experimental design is proposed for KBEAP.

ENVIRONMENTAL COMPLIANCE ASSISTANCE
42
INTERNAL RECOMMENDATION #7: EXPERIMENTAL DESIGN
Population
The population under evaluation for the Environmental Compliance Assistance
Experiment are (1) small businesses with less than 100 employees, (2)who have
no previous working relationship with KBEAP, (3) who fall into standard
industrial classification codes (SIC) for Division D and Major Groups 20-39, and
(4) who are willing to participate in the study.
Sample
A total of 30 businesses should be evaluated. The 30 business should be divided
into two groups of 15 businesses with each group of 15 businesses being
randomly distributed among the top 5 standard industrial classification codes of
Kentucky Small Manufacturers. Those codes represent Major groups 24 (Wood
Products), 27 (printing and Publishing), 34 (Fabricated Metal Products), 35
(Industrial Machinery), and 39 (Miscellaneous Manufacturing). Also, each group
of 15 businesses should also be randomly distributed throughout the three main
regions of Kentucky (West, Central, and East).
Measures
Three measurement tools have been developed by KBEAP to be used during the
experiment to measure compliance rates, benefit/costs, and pollution prevention
implementation. The three tools are the KBEAP Environmental Compliance
Checklist, KBEAP Benefit Cost Questionnaire, and Standards and Measurements
outlined in the proposed Kentucky Green Certified Small Business Program.

ENVIRONMENTAL COMPLIANCE ASSISTANCE
43
Also, interviewers will include KBEAP environmental consultants who have
professional knowledge of environmental compliance assistance and who have
been trained on the use of the three tools outlines above as well as the
experimental design of the project.
Design and Procedures The design of the experiment is best illustrated by the following matrix. Group Baseline
Evaluation Hands-on Compliance Assistance Intervention
Midterm Follow Up
Hands-on Compliance Assistance Intervention
Final Follow-up
A Yes No Yes Yes Yes B Yes Yes Yes No Yes The total experimental timeframe should be 2 years. At the beginning of year 1,
evaluators/interviewers will be sent to both group participants and the
Environmental Compliance Checklist, Benefit Cost Questionnaire as well as the
Pollution Prevention Checklist will be administered (in person) on site. Following
the evaluation, Group A will receive information and resources from the
Kentucky Department of Environmental Protection on Permitting Programs.
Group B will receive an onsite environmental compliance audit from a KBEAP
environmental consultant, an environmental audit report stating compliance
findings and recommendations, KBEAP Environmental Basics for Small Business
training to all employees, application preparation from KBEAP, as well as a
Pollution Prevention/Energy Efficiency Audit from the Kentucky Pollution
Prevention Center.

ENVIRONMENTAL COMPLIANCE ASSISTANCE
44
A midterm follow-up will be conducted by an evaluator/interviewer at the end of
year 1 using the measurement tools outlined above. At the beginning of year 2,
Group B will receive no additional assistance; however, Group A will receive the
onsite environmental audit, KBEAP Environmental Basics for Small Business
training to all employees, application preparation from KBEAP, as well as a
Pollution Prevention/Energy Efficiency Audit from the Kentucky Pollution
Prevention Center. Finally, at the end of year 2, a final follow up will be
conducted by an evaluator/interviewer with the measurement tools outlined above
and any non-compliance situations will be resolved following the close of the
experiment.
External Recommendations
1) Nationally, through the SBTCP's Steering Committee
(http://www.smallbiz-enviroweb.org/sba/steering_committee.html) and
the Environmental Protection Agency’s (EPA) Small Business
Ombudsman (SBO) (http://www.epa.gov/sbo/ ), environmental
compliance outcomes should be discussed and prioritized as an agenda
item in the overall development of the SBTCPs.
2) If prioritized, nationally, the SBTCPs should develop a standardized set of
environmental compliance outcome metrics whereby each individual
program could establish protocols for measurement. Metrics reported back
to the national steering committee and the SBO should be reported

ENVIRONMENTAL COMPLIANCE ASSISTANCE
45
annually. These metrics once translated into benefit cost terms have the
potential to be used for national educational campaigns, developing
program support, and as a tool for national program development and
organizational change.
3) As an alternative to external recommendation #2, EPA’s SBO could
develop a national SBTCP environmental compliance outcome survey
whereby each state would be responsible for administering the survey to
their clients. The survey could be administered every 5 years and would be
based on the metrics developed in external recommendation #2.
4) The benefit cost model has the potential to be used as a learning tool for
other compliance assistance programs in their development phase such as
the new Kentucky Division for Compliance Assistance (DCA) located in
the Kentucky Department for Environmental Protection. The model has
the potential to help identify metrics and also how to best allocate
resources given programmatic design. The model however is not
externally valid to DCA so any use of the model results should be
cautioned.
5) The benefit cost model should be transferred to other SBTCPs that are
programmatically similar to KBEAP such as Nevada, Pennsylvania,
Idaho, and Iowa in an effort to replicate the model and test for validity.
6) The benefit cost model also presents an opportunity for research into the
relationships between small business environmental responsibility and

ENVIRONMENTAL COMPLIANCE ASSISTANCE
46
financial performance as well as how the “green image” is valued among
the small manufacturing firm. While studies on large firms have been
conducted (See Literature Review), there appears to be gaps in the
understanding of environmental performance and financial performance
among the small business owner as well as how “green images” are valued
from a marketing perspective as well as from a community perspective.
In summary, compliance assistance programs such as KBEAP have the
opportunity to provide significant benefits to small businesses but the effort
required to track these outcomes is still in its infancy both on a national and
state level. It is hoped that this analysis will provide the impetus for other
programs to explore outcome evaluation as well as lead to a national initiative
to better understand the outcomes relating to environmental compliance
assistance program and small businesses.

ENVIRONMENTAL COMPLIANCE ASSISTANCE
47
WORKS CITED
Anonymous. “Improving EPA’s Compliance Assistance Program”. Air Pollution Consultant. Volume 15 (1) 2005. p1.12-1.14. Asian Productivity Organization. Green Productivity. http://www.apo-tokyo.org/gp/. Retrieved on 3/30/2005 from source. Clean Air Act Section 507. 42 USC Chapter 42 Subchapter V § 7661f. http://assembler.law.cornell.edu/uscode/html/uscode42/usc_sec_42_00007661---f000-.html Retrieved on 4/14/05 from source. Crain, Mark W., and Thomas D. Hopkins. SBA, Office of Advocacy. “The Impact of Regulatory Costs on Small Firms”. http://www.sbaonline.sba.gov/advo/research/rs207tot.pdf. Retrieved on 4/14/05 from source. Compliance Assistance Advisory Committee (CAAC). http://www.epa.gov/ocem/nacept/caac/caac_6_14_2004_final_report.pdf#search='compliance%20assistance%20advisory%20committee' Accessed on 4/14/2005 Energy Information Administration. Kentucky State Data. http://www.eia.doe.gov/emeu/states/main_ky.html Retrieved on 4/14/05 from source. Environmental Protection Agency (EPA). 2003-2208 Strategic Plan. http://www.epa.gov/ocfopage/plan/plan.htm Retrieved on 4/14/05 from source. Field, Barry C. and Martha K. Field. Environmental Economics: An Introduction. Third Edition. McGraw-Hill/Irwin. 2002 Gagnon, M. and J. Michael. 2003. Employee strategic alignment at a wood manufacturer: an exploratory analysis using lean manufacturing. Forest Products Journal, 53(10): 24-29. Gonzalez-Benito, Javier, and Oscar Gonzalez-Benito. “Environmental Proactivity and Business Performance: An Empirical Analysis.” OMEGA: The International Journal of Management Science. Omega 33 (2005). p. 1-15. Kentucky Business Environmental Assistance Program (KBEAP). “Measuring Compliance Assistance Outcomes: A Survey of KBEAP Clients”. June 2004.

ENVIRONMENTAL COMPLIANCE ASSISTANCE
48
Kentucky Cabinet for Economic Development. Kentucky Desktop of Economic Statistics. http://www.thinkkentucky.com/edis/deskbook/ Retrieved on 4/13/05 from source. Kentucky Department for Environmental Protection. Permitting Programs. http://www.dep.ky.gov/NR/rdonlyres/506BE56A-D862-4971-AB55-780B0E666258/0/EnvironmentalPermittingPrograms.pdf Retrieved on 4/14/05 from source. Meyer, Harvey. “The Greening of Corporate America”. Journal of Business Strategy. January/February 2000. p. 38-43. Morgenstern, Richard D. Economic Analysis at EPA: Assessing Regulatory Impact. RFF Press. 1997. Morris, Sara A. “Environmental Pollution and Competitive Advantage: An Exploratory Study of U.S. Industrial Manufacturers.” Academy of Management Proceedings. 1997. National Center for Environmental Decision-Making Research (NCDER). http://www.ncedr.org/tools/othertools/costbenefit/overview.htm Accessed on 4/14/05 National Center for Environmental Economics. http://yosemite1.epa.gov/ee/epa/eed.nsf/Webpages/AboutNCEE.html Accessed on 4/14/05 National Center for Environmental Innovation (NCEI). http://www.epa.gov/evaluate/. Accessed 4/13/05 Roelofs, Cora R., Rafael Moure-Eraso, and Michael J. Ellenbecker. “ Pollution Prevention and the Work Environment: The Massachusetts Experience.” Applied Occupation and Environmental Hygiene. Volume 15(11) 2000. p.843-850. SBA, Office of Advocacy. Small Business State Profiles. http://www.sbaonline.sba.gov/advo/stats/profiles/ Retrieved on 4/13/05 from Source. Small Business Assistance Program’s 2000 Annual Report. http://www.smallbiz-enviroweb.org/sba/programs_report.html Retrieved on 4/14/05 from source.

ENVIRONMENTAL COMPLIANCE ASSISTANCE
49
State of Kentucky Environment Reports http://www.eqc.ky.gov/pubs/soke/ Retrieved on 4/14/05 from source. Stavins, Robert N. Economics of the Environment. Fourth Edition. W.W. Norton & Company. 2000 Office of Enforcement and Compliance Assurance (OECA). “Guide for Measuring Compliance Assistance Outcomes”. http://www.epa.gov/compliance/resources/reports/planning/results/came asuring.pdf Retrieved on 4/13/05 from source. Ottman, Jacquelyn. Greenmarketing. www.greenmarketing.com. Retrieved on 3/30/2005 from source. U.S. Department of Labor, Bureau of Labor Statistics. http://stats.bls.gov/ Retrieved on 4/14/05 from source. Washing State Department of Ecology. http://www.ecy.wa.gov/biblio/99434.html. December 1999. Retrieved on 3/30/2005 from source.

ENVIRONMENTAL COMPLIANCE ASSISTANCE
50
APPENDIX A: SAMPLE DATA

ENVIRONMENTAL COMPLIANCE ASSISTANCE
51

ENVIRONMENTAL COMPLIANCE ASSISTANCE
52