measuring for success - · pdf filemeasuring for success. 73 % 69 %. 51 % 77 %. ... alignment...
TRANSCRIPT

“A Truly Valued Nova Scotia”
PVSC Annual Report
March 31, 2011
Measuring for Success

73 %69 %
51 %
77 %80 %
2007 2008 2009 2010 2011
PVSC Trending Call Centre Satisfaction
A call centre and assessor review survey has been conducted every year since 1997. The PVSC continued this annual measure of customer service after the transition into an independent organization. The above graph outlines the trending overall customer service satisfaction since the inception of the PVSC in 2007.
More details on the 2011 survey can be found on page 20.

This annual report reflects the Property Valuation Services Corporation fiscal year ending March 31, 2011.
The information on programs and operations reflect activities that occurred in the calendar year 2010 relating to the filing of the 2011 assessment roll. This includes activity related to appeals filed against the 2010 roll.
TABLE OF CONTENTS
MESSAGE FROM THE PVSC BOARD CHAIRMESSAGE FROM THE CHIEF EXECUTIVE OFFICERPVSC BOARD OF DIRECTORS2010 ACTIVITY RELATING TO THE 2011 ASSESSMENT ROLL
PVSC AWARDSACHIEVING A TRULY VALUED NOVA SCOTIAPROCESS IMPROVEMENTSENGAGEMENT AND PARTNERSHIPTECHNOLOGY INNOVATION
PERFORMANCE MEASURESMANAGEMENT DISCUSSION AND ANALYSISAUDITED FINANCIAL STATEMENTS
2368
1011121416
182226

2
On behalf of the Board, I would like to thank outgoing Chair Mayor Carroll Publicover of Bridgewater for his leadership, guidance and spirit of cooperation over the last three years. His term as chair was a wonderful fit for the need to bring our strategic planning to maturity and put the focus firmly on quality.
The efficiency and effectiveness of the Board continues to be enhanced by the three standing committees con-centrating on their respective mandates of Governance, Audit and Finance, and Quality and Client Service.
Support for the pursuit of innovation in operations and technology was exemplified through participation in the Property Innovation Council in 2010. Partnership with the municipalities and SNSMR helped to formalize mea-surement of compliance with legislative business. As well, the PVSC was a participant in both the municipal and SNSMR CAP reviews.
The positive response in call centre and assessment staff survey, public communications and enhancements in the appeal processes are all proof of the measurable improvement in operations. We have completed our inaugural external quality audit and we practice fiscal responsibility in these difficult times.
The Board of the PVSC continues to pursue best practice in Board governance through education and by ex-panding membership to include two independent members, Amanda Whitewood from Capital Health and Doug Sabean from Medavie EMS.
On a sad note, the Board also suffered a great loss with the passing of Union of Nova Scotia Municipalities (UNSM) Executive Director Ken Simpson. He will be truly missed.
In closing, many thanks are due to the staff and management here at the PVSC as they have completed an-other successful year of measurable growth in quality, innovation and partnership.
Jimmy MacAlpineDeputy Warden, Municipality of the District of DigbyPVSC Board Chair
MESSAGE FROM THE PVSC BOARD CHAIR

3
After three full years operating as the Property Valuation Services Corporation (PVSC), I am pleased to report the progress we have made as an organization. The initial PVSC annual report was focused on letting our clients know who we are; in this report we want to tell our clients about how we measure the quality in our operations.
Our municipal partners understand that we deliver quality products, we are financially responsible and we are a change-based organization willing to work with them to provide creative solutions to common issues. Property owners and other clients are getting to know us as a professional organization with quality products, strong accountability and excellent customer service.
In 2011, the PVSC undertook its first external quality audit as the final step in its accountability strategy. This pro-cess was developed to ensure that the PVSC could report on its legislated mandate, Memorandum of Understand-ing requirements with the Province of Nova Scotia, industry standards and measures of operational efficiency.
We have championed the creation of the Property Innovation Council with our municipal and provincial partners, showed marked improvements in our customer services, expanded the potential of technology using the power of Pictometry, created efficiencies in, and increased public understanding of, our appeal process and continued to look at operations under the lens of quality improvement.
At this time, I would like to thank the Board of Directors for their support and staff for their commitment as we take the next steps in our pursuit of engagement, partnership and innovation.
Kathy GillisChief Executive Officer
MESSAGE FROM THE CHIEF EXECUTIVE OFFICER

4
OUR ROLE
Property Valuation Services Corporation (PVSC) is a not-for-profit organization that is responsible for the market value of approxi-matly 585,000 properties in Nova Scotia.
PVSC, formally known as Assessment Services within Service Nova Scotia and Municipal Relations, came into existence at the request of the Union of Nova Scotia Municipalities in 2007.
MISSIONWe provide market valuation and other property related services to municipalities, clients, and the Province of Nova Scotia.
VISIONOur clients and partners recognize us as the best provider of market valuation and property related services.
PVSC employees engage in a roundtable discussion at the 2011 staff event.

5
STRATEGIC GOALSBest Product and Service QualityThe PVSC will ensure it has the best quality of products and services in the market valuation industry.
Deliver Best Value for MoneyThe PVSC will structure production and service to deliver the most with the Corporation’s resources. Improve Access to InformationThe PVSC will enable clients to have convenient choices about where, when and how to conduct business with us.
Build a High Performance Culture The PVSC will get and keep the right human, financial and technical resources to do its job effectively and economically.
Improve and Expand Products and ServicesThe PVSC will develop the right products to support clients’ property related decisions.
Implement Best Practice GovernanceThe PVSC Board will follow best practice governance on behalf of stakeholders.
PVSC employees strategize about the role they play in determining external influences for the organization.

6
The PVSC Board of Directors governs the Corporation on behalf of the 55 municipal units in Nova Scotia.
The Board has many roles and responsibilities within the organization, which include:• establishing a long term strategic plan• creating multi-year and capital budgets• appointing a Chief Executive Officer• encouraging partnership opportunities with stakeholders and others• reporting to the UNSM at its annual meeting• ensuring external financial and quality audits are completed • filing an annual report
COMMITTEESThree committees established by the Board complete detailed work in their areas of concentration and report to the Board at their scheduled meetings. The committees are: Audit and Finance Committee, Quality and Client Service Committee and Governance Committee. The Board Chair is a member of each com-mittee.
GOVERNANCE REVIEWIn an effort to explore a number of issues relative to the governance of the PVSC Board of Directors, a governance review project was undertaken.The project’s intent was to gather information relative to several central objectives: determine ideal qualifications for new board members; clarify and explore board member roles; determine the educational requirements for board members; examine recruitment and selection methods for new board members; determine a process to identify and select the two independent members; and, clearly articulate the roles and responsibilities in and among the PVSC Board, Union of Nova Scotia Municipalities (UNSM), Association of Municipal Administrators (AMA) and Service Nova Scotia and Municipal Relations (SNSMR).
The Governance Committee has worked diligently to develop strategies to meet these recommendations. Highlights of their activity to date include: clarification of roles and accountabilities, alignment with the Board of the UNSM to incorporate a PVSC skills matrix and gap analysis summary when selecting new PVSC Board members, placement of two independent members utilizing a search firm and completion of a Board education plan.
PVSC BOARD OF DIRECTORSFrom left to right; PVSC Board Chair Jimmy MacAlpine, Deputy Warden of the District of Digby; Amanda Whitewood, VP Sustainability and Chief Financial Officer, Capital Health; Doug Sabean, VP Finance and Chief Financial Officer, Medavie EMS; PVSC Board Vice Chair Russell Walker, Councillor, HRM; Cathie O’Toole, Director of Finance, HRM; Darren Bruckschwaiger, Deputy Mayor, CBRM; Carroll Publicover, Mayor, Town of Bridgewater; Lloyd Hines, Warden, Municipality of Guysborough; Kevin Malloy, Deputy Minister, SNSMR; Billy Joe MacLean, Mayor, Town of Port Hawkesbury; Sandy Hudson, CAO, Victoria County. Missing from photo: Roy Brideau, CAO, Town of Wolfville; Mervin Hartlen, Councillor, Region of Queens Municipality; Gloria McCluskey, Councillor, HRM; and Rick Farmer, Acting Executive Director, UNSM.

7
PVSC BOARD COMPOSITIONThe Board is comprised of elected and administrative representatives from rural, town and regional caucuses who are appointed by the Union of Nova Scotia Municipalities (UNSM). In addition, the Board includes the Deputy Minister of Service Nova Scotia and Municipal Relations (non-voting) and the Executive Di-rector of the UNSM. The CEO of the PVSC reports to the Board and attends all meetings. In December 2010, two new members were appointed, two members returned for their second term and two independent members were selected.
The Board thanks Roy Brideau, Cathie O’Toole, Rick Farmer, Gloria McCluskey and Mervin Hartlen who completed their service with the PVSC Board of Direc-tors this year.
12 FOUNDATION FOR SUCCESS
CEOResponsible for the administration of the
Corporation and reports directly to the Board and respective Board committees
PROPERTY VALUATION SERVICES CORPORATION
(PVSC)Provides property assessment
information and services to property owners, the Province,
and municipalities
Operations / QualityIT/Information ManagementCorporate Services
COMMITTEES OF THE BOARD OF DIRECTORS
Audit and Finance
Governance
Quality and Client Services
The committees provide advice and recommendation to the Board
PVSC BOARD OF DIRECTORSAppoints the PVSC CEO
(s.25, PVSC Act)
6 Members of Council 2 Rural, 2 Regional, 2 Town Municipalities
3 Municipal Administrators 1 Rural, 1 Regional, 1 Town Municipality
2 Independent Members
Executive Director of UNSM
Deputy Minister of SNSMR (non–voting)
PROPERTY OWNERS
PROVINCE OF NOVA SCOTIAAppoints the Deputy Minister of SNSMR to the Board
55 MUNICIPALITIES— MEMBERS OF THE CORPORATION(s.9, PVSC Act)
UNION OF MUNICIPALITIESAppoints the PVSC Board of Directors on
behalf of 55 Municipal Members

8
DELIVERING MORE THAN MARKET VALUE
As required under the Assessment Act, on an annual basis the PVSC provides an assessment roll to its fifty-five municipal partners and assessment notices to approximately 585,000 Nova Scotia property owners.
Other legislated requirements include the operation of an appeal process and programs mandated by the Province including the Capped Assessment Pro-gram (CAP), the Business Occupancy Phase Out and Seasonal Adjusted Tourist Business Designation. In 2010, the PVSC added approximately 7,500 new accounts and completed nearly 24,500 building permit and work order reviews.
Across Nova Scotia, assessments increased by approximately 6 per cent from 2010; residential assessments increased by approximately 7 per cent and commercial assessments increased by just over 5 per cent (see page 9).
APPEAL FIGURES
During the 2011 appeal period, the PVSC received 11,568 appeals. This is an increase of approximately 1,100 from 2010. Of the 11,568 appeals, 2,225 were commercial and the remainder were primarily residential.
The call centre answered just over 9,000 calls, which is an increase of approximately 200 more calls than those answered last year during the 21-day as-sessment notification period.
SEASONAL ADJUSTED TOURIST BUSINESS DESIGNATION
Under the Seasonal Tourist Business Designation legislation, a business that is closed for at least four months in the taxation year and is a restaurant, a roofed accommodation or a camping establishment may be eligible for a reduced com-mercial tax rate. The owner of the business is required to submit an application to the PVSC and demonstrate that they meet specific criteria.
In 2010, 336 tourist businesses were deemed to be eligible across Nova Scotia. We directly notified the participants from the previous year and worked with the Tourism Industry Association of Nova Scotia, the Department of Communities, Culture and Heritage and Service Nova Scotia and Municipal Relations to deliver the message out to their interested clients.
2010 ACTIVITY RELATED TO THE 2011 ASSESSMENT ROLL

9
PROVINCIAL ASSESSMENT INSPECTION PROGRAM (PAIP)
The Provincial Assessment Inspection Pro-gram (PAIP) began its thirteenth year of sea-sonal data verification in 2010. PAIP acts as a supplement to the standard inspection pro-gram. In addition to being a highly valued com-ponent of the PVSC work plan, PAIP also has proven to be a great tool for the recruitment of new assessment staff and an excellent testing area for our training program.
PAIP included the review of over 8,500 as-sessment accounts and the addition of $50 million on the 2011 assessment roll. This re-sulted in more current data on file and addi-tional tax dollars for municipalities.
BUSINESS OCCUPANCY
In 2006, the Provincial Government in consul-tation with the UNSM initiated the phase out of Business Occupancy Tax. Of the original three classes of Business Occupancy Assessments, only the 75 per cent class remained in effect for the 2011 assessment roll. Year over year, the phase out represented a reduction of about $9.9 million from 2010 or about 4.5 per cent. The 75 per cent category includes financial in-stitutions such as banks, trust companies, credit unions and loan or investment companies. This category will be eliminated in 2013. There were 557 accounts in this category included on the roll for 2011.
CAPPED ASSESSMENT PROGRAM (CAP)
The Capped Assessment Program (CAP) rate is tied to the increase in the Nova Scotia Consumer Price Index (NSCPI). For the 2011 assessment roll, the change in NSCPI and, therefore the CAP rate, was set at 2.9 per cent.
Nearly 376,000 accounts were eligible for the program. There was a difference of $7.65 billion between the market value and capped residential and resource por-tion of the 2011 assessment roll.
There were no changes made to the CAP legislation in 2010. Both the UNSM and Service Nova Scotia & Mu-nicipal Relations undertook reviews of the program dur-ing 2010. The PVSC worked with both organizations in their research, information gathering and public forums.
Residential*
Commercial**PROVINCIAL TOTALNumber of Accounts
Property Assessment Values - Province of Nova Scotia
2010$ 60,982,707,300$ 18,831,495,300$79,814,202,600
584,713
($628,850,700)
2011$ 65,126,292,300$ 19,565,841,600$ 84,692,133,900
590,878
($ 9,934,400)
*Residential Includes Resource**Commercial Includes Business Occupancy
Business Occupancy Reduction
The PVSC call centre received record-breaking results this year as reported in its annual call centre and assessor review survey. Featured above are the employees responsible for call centre operations: (from left to right) Krista McNair and Serena Bell, Client Centre Representatives; Pat Burns and Donna Rushton, Operations Support Assistants; and Aseneth McGrath, Manager Inquiries and Appeals. More information on the survey can be found on page 20.

10
Following its official launch in April, 2008, the PVSC chose to honour a selected employee, team and corporate partner annually by presenting them with a special award at staff gatherings.
PVSC AWARDS
The Vision Award is presented to an employee who is chosen by their peers for demonstrating leadership qualities and outstanding commitment to the organization’s mission, vision, values and goals.
This year the award went to Dan McNeil (centre), Senior Specialist, Legal. PVSC Board member Darren Bruck-schwaiger (left), was present at the all-staff event to assist with awarding the recipients, and Joe McEvoy (right), nomi-nated Dan to receive this award.
In 2010 a new form of recognition was created, the CEO’s Award for Excellence. Much of the success of the PVSC is a result of our ability to work together in teams: proj-ect teams, pilot teams, test teams, cross functional teams, volunteer teams and focus groups. In 2010 the award was presented to the Tele-work team from the Kentville office for their dedication and hard work while engaging in a new way of working (page 12). The 2011 award was presented to the Sales Review Process Improvement Project Team.
Award recipients from left to right (back row): Todd Gratto, Jeff Caddell, Ross Fenerty, Holly Cas-sibo, Cheryl Pellerin, Mark Fielden, Eileen Fewer, Steve Croft and Kathy Gillis, CEO. (front row): Brian George, Tim Cadegan, Shelley Welsh, and Project Manager, Ashley Wu.
The Brenda V. Cowie Partner-ship Award is given to a partner who has built a strong relation-ship with the PVSC over the past year and has provided as-sistance for the organization to live out its vision of being the best provider of market valua-tion. Brenda Cowie was the origi-nal recipient and the person for whom the award was named. The 2011 award was shared between Donna Davis, Manager, ICT Planning & CRM, Business Planning & Informa-tion Management, for Halifax Regional Municipality (HRM) and Bob McNeil, Director of Technology for Cape Breton Regional Municipality (CBRM). HRM and CBRM are two of the municipalities involved with the PVSC’s Pictometry pilot and are also involved with the Single Address Initiative. They have shown dedication and support towards these projects on behalf of their municipalities.
11
PROCESS IMPROVEMENTS
The PVSC constantly strives to improve its processes and ensure that it is delivering the best value while delivering consistent reliable
quality.
TECHNOLOGY INNOVATION
In an effort to ensure the best quality and value to clients, the PVSC is seeking in-novative means of completing work and
adding value to the organization.
ENGAGEMENT & PARTNERSHIP
The PVSC has engaged in several ini-tiatives with external parties in order to
provide excellent service to its clients and stakeholders.
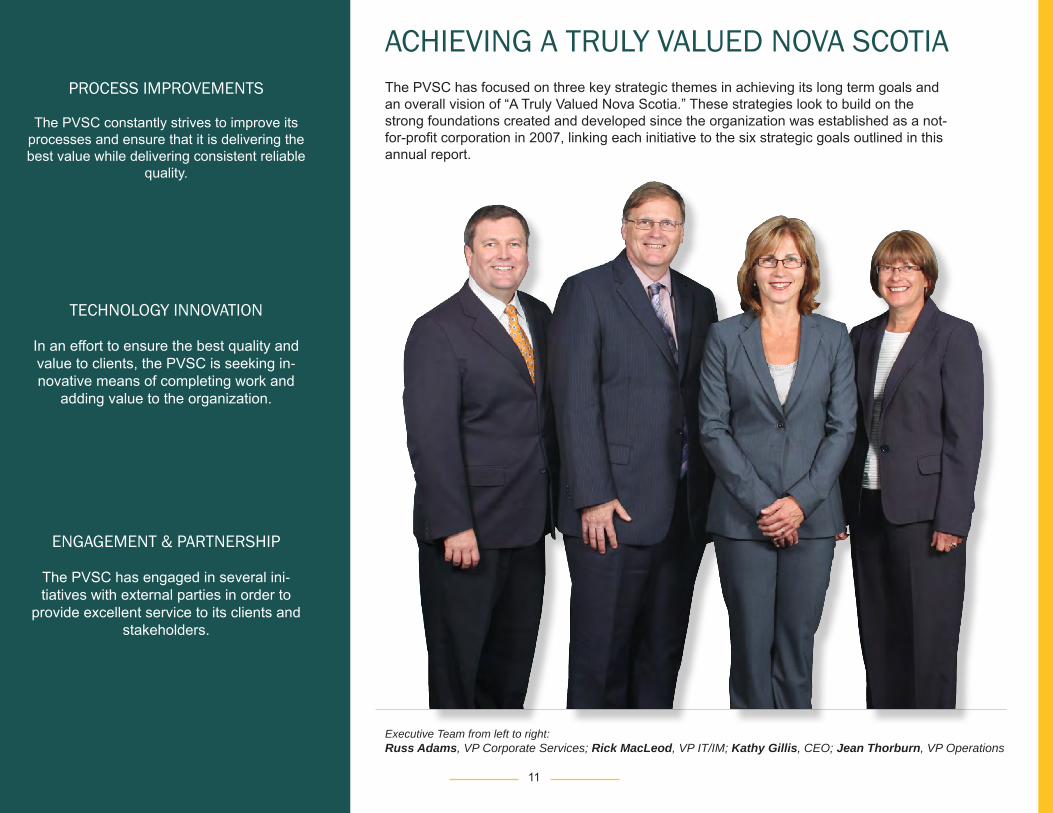
ACHIEVING A TRULY VALUED NOVA SCOTIAThe PVSC has focused on three key strategic themes in achieving its long term goals and an overall vision of “A Truly Valued Nova Scotia.” These strategies look to build on the strong foundations created and developed since the organization was established as a not-for-profit corporation in 2007, linking each initiative to the six strategic goals outlined in this annual report.
Executive Team from left to right:Russ Adams, VP Corporate Services; Rick MacLeod, VP IT/IM; Kathy Gillis, CEO; Jean Thorburn, VP Operations

12
PROCESS IMPROVEMENTS“Doing what we do, better”
COMMERCIAL ASSESSMENT REVIEW
In the winter of 2010, the PVSC undertook a review of the com-mercial valuation unit within the organization. The objectives of the review were:
• To ensure the commercial function is aligned with and man-aged to meet the overall strategic objectives of the organiza-tion.
• To ensure the commercial leadership and team foster a client-focused culture, have the optimal capacity and capabilities, and use processes and systems which enable a strong and mutually valuable relationship with its key stakeholders.
• To ensure the commercial function operates to optimize ef-ficiency and effectiveness for the organization.
The review was completed in July, 2010 by Bonavista Business Solutions and several recommendations were made for both short and long term goals.
Some of the short term goals that have been completed are: ac-cess to COGNOS (a tool enabling assessors to generate sales in-ventory reports), the redesign and streamlining of the sales review process (see page 18), Pictometry implementation (see page 18), the commercial Personal Identification Number (PIN) report (com-mercial property owners will be able to view their account details online for the 2012 assessment roll), and enhanced training in-cluding sales validation procedures and International Association of Assessing Officers (IAAO) standards.
The PVSC is building its foundation for completion of the longer term goals, which include a succession planning strategy, im-proved access to information, and upgrading iasWorld to make new processes more effective.
TELE-WORK PILOT
As presented in the 2009 – 2010 PVSC annual report, a tele-work pilot was initiated in 2010. The original pilot included staff in the Kentville office working from their homes. The office still remained open for office inquiries. The pilot was extended until December, 2010 to include all processes in the assessment cycle, at which point an evaluation was done.
In 2011 the evaluation from the Kentville office pilot was completed. The results from this pilot encouraged management to increase the pilot size to include staff from the Bridgewater office, which took place in January, 2011. Kentville staff are still included in the pilot and an overall evaluation will take place closer to the end of 2011.
The Kentville office was awarded the CEO’s Award for Excellence in 2010 for their dedica-tion and commitment to excellence throughout the Pilot.
Employees present at the 2010 staff event (left to right back row): Dave DeNuke, Geoff Churchill, Sean Lonar, Darren Marsh, Pat Bonner and Phil Schofield. (front row) Kathy Gillis, CEO, Andrew Willsey, Eirin Rhodes, Emily Wrobleski and Anne Crocker. Missing from photo: Tanis Seewald, Area Manager, Judy Clayton, Scarlett Orr, Austin Coolen and Wanda Smith.

13
ALTERNATE DISPUTE RESOLUTION
Alternative Dispute Resolution (ADR) is a methodology used to facilitate discussion and attempt to resolve issues between parties before proceeding to a formal hearing, such as the assess-ment hearings that take place before the Nova Scotia Utility and Review Board (URB). In an effort to introduce principles underlying ADR to the PVSC’s approach to appeals, the legal team was re-organized and expanded in 2010 to incorporate dedicated valuation specialists to work with legal counsel and increase communication with appellants at earlier stages. Further exploration regarding ways that ADR can assist property owners and the PVSC has been ongo-ing. ADR is part of a systemic process to find a solution. From the initial contact with the property owner to the Regional Assessment Appeal Court (RAAC) and even ultimately going before the URB, there has been an attempt to change the focus from “winning or losing” to “getting it right”. The PVSC provides more information to people and groups, does so earlier in the process, has made appeal navigation tools available to those appealing and does a complete pre-hearing review for appeals potentially proceeding to the URB. Since embracing ADR principles, the number of appeals heard before the URB has been sub-stantially reduced. This in turn has reduced financial costs and allowed for better utilization of resources on operational matters.
A form of ADR, where a URB member acts as a non-binding arbitrator, was tested on two major appeals. Benefits and indications of success include: significant cost savings, intact relation-ships and at least one resolved matter. The success of the initiative has encouraged continued exploration of ADR within the property assessment mandate.
The Legal Team from left to right: Valerie Paul & Robert Andrews, Legal Counsel; David MacDonald, Mass Appraisal Review Officer; Dan McNeil, Senior Specialist Legal and Linda Richardson, Legal Secretary.
REGIONAL ASSESSMENT APPEAL COURT STANDARDIZATION
The PVSC has been diligently working to improve methods and procedures that will add value to the appeal process while emphasizing the focus on client ser-vice and transparency. In 2008, a re-design of the appeal process was conducted and in 2010 a re-design of the inquiry management process took place. As a continuation of these improvements the Regional Assessment Appeal Court (RAAC) process has recently been reviewed.
Based on the feedback from the review, a project has been initiated to create increased efficiency and consistency in the court recorder’s function; increase awareness and understanding of the RAAC process; improve the overall client experience; and, continue to provide excellent customer service to clients.
This project will be implemented in three phases over the next two years,with completion set for January, 2013. Phase I took place in early 2011. In this phase the PVSC has:
• Implemented an arm’s length hearing location outside of PVSC offices• Defined and re-designed the RAAC correspondence• Centralized all Court Recorders in the Truro office• Standardized Court evidence for assessors

14
Part of the PVSC’s strategic focus for 2010/11 was to form partnerships to bet-ter engage its key stakeholders in forming working relationships. This will benefit the organization, its stakeholders and further the vision of being recognized as the best provider of market valuation and property related services. One of these key relationships was formed in 2010 with the creation of the Property Innovation Council.
The Property Innovation Council formed in January, 2010 through a Memoran-dum of Understanding (MOU) between the Union of Nova Scotia Municipalities (UNSM), The Province of Nova Scotia through Service Nova Scotia and Municipal Relations (SNSMR) and the PVSC. The Council has representation from each organization as well as other interested stakeholders. The mandate of the Property Innovation Council is to “address challenges and opportunities that affect the delivery of property related services.”
The first challenge the Council focused on was “the Single Address Initiative” with the goal of streamlining the current address process to ensure that all stake-holders access one source for accurate and timely addressing information in Nova Scotia.
The project has been very successful thus far and is currently moving into the pilot stages with some of the new processes being developed. The PVSC is anticipating great success with this project and looks forward to future participation in other property related services.
ENGAGEMENT AND PARTNERSHIP“Coming together to work with others for the common good”
Members of the Civic Address Group, a subset of the Single Address Initiative team (from left to right) John MacKinnon, Cape Breton Regional Municipality GIS Coordinator; Steve Scanlan, Canada Post Delivery Planner; Dave Smith, Nova Scotia Civic Address File (NSCAF) Delivery Planner; and Darlene Purdy, PVSC Senior Technical Analyst, review a map of postal areas in Nova Scotia.
PROPERTY INNOVATION COUNCIL AND THE SINGLE ADDRESS INITIATIVE
“The Single Address Initiative was conceived just over a year and a half ago and to date the progress has been an outstanding achievement in coopera-tion.”
Kevin Malloy, Deputy Minister, Service Nova Scotia & Municipal RelationsChair, Property Innovation Council

15
HOME SHOWS
PVSC representatives have participated in several home shows in Halifax Regional Municipality as well as Colchester County, providing property own-ers with a better understanding of the PVSC’s man-date and property assessments.
MUNICIPAL BUDGET AND STRATEGIC PLANNING PRESENTATIONS
In an effort to enhance municipal awareness and understanding of the planning and bud-get process of the PVSC, staff and Board members met with municipalities in February 2011.
The presentations provided a brief background of the PVSC, an overview of the current assessment activity, the 2011 – 2015 strategic direction of the organization, the 2011 stra-tegic initiatives, the 2011/12 budget including the projected 3 year operating and 5 year capital budgets and dates for the 2011 billing schedule.
The PVSC received very positive feedback from those who attended the presentations. Municipal administration and elected officials were very appreciative of the practical expla-nation of the strategic plan and budget details. Support was also shared for the current and future initiatives including Pictometry implementation and involvement with the Property Innovation Council.
PVSC Board Chair, Jimmy MacAlpine and CEO, Kathy Gillis discuss the Corporation’s strategic plan outline prior to the Truro municipal strategic plan and budget presentation.
Rae MacDonald, Residential Assessor and Sean Fewer, Field Assessor, represent PVSC at the Ideal Home Show in Exhibition Park, Halifax.

16
In 2010, PVSC developed a business case to measure the effectiveness of using oblique aerial photography, called Pictometry, for business purposes. The business case demonstrated efficien-cies within operations with the use of Pictometry.
As a result PVSC has organizationally changed the way in which it does business by integrating Pictometry into its business cycle. Pictometry provides assessors with the capability to perform exterior property inspections and comparisons from their desk.
Pictometry implementation began with a re-design of the sales review process in 2010. A project team comprised of management, commercial and residential assessors and quality analysts re-viewed the current state for both residential and commercial assessment processes, and integrat-ed it into one consistent process utilizing Pictometry. All assessors were trained on the changes. Due to their excellent work completing this project, this team was awarded the CEO’s Award for Excellence at the June all-staff event (see page 10).
In January 2011, the data was used when reviewing accounts during the 21-day assessment no-tification period. The PVSC will be building Pictometry into other business activities in conjunction with the assessment cycle.
TECHNOLOGY INNOVATION“Utilizing the most efficient tools to get the job done”
While Pictometry is an essential business tool for the PVSC, it also provides an opportunity for municipalities. When sign-ing the contract with Pictometry Canada, the PVSC provided each municipality with a Pictometry license. The PVSC is cur-rently collaborating with Halifax Regional Municipality and Cape Breton Regional Municipality in a pilot to determine the effective uses this data has for municipalities.
It is anticipated that this data can be used by municipalities for planning purposes, emergency services and permits. The Pictometry data will include a portion of every municipality in Nova Scotia.
Below PVSC presents a Pictometry demo to municipalities at the 2010 UNSM conference.
Teth Cleveland, PVSC GIS Analyst (right) stands with Andrew Norwood, Survey Pilot - First Base Solutions (left) in front of a CESSNA 206, one of the planes used to capture the Pictometry imagery.

17
PICTOMETRY & iasWorld INTEGRATION
Pictometry is used in the above photos to measure the area of a commercial property and demonstrate pre and post construc-tion states.
On the far right Steve Croft, Commercial Assessor, performs a sales review on a property account using Pictometry while Ross Fenerty, Residential Assessor, (left) and Tim Cadegan, Field Assessor, (right) discuss property comparisons.

18
PERFORMANCE MEASURES
LEGISLATIVE REQUIREMENTS
As a part of the PVSC’s obligation as outlined in its Memorandum of Understanding (MOU) with the province of Nova Scotia and the Nova Scotia Assessment Act, there are two legislated requirements to report:
1. Quality standards by Municipality 2. Audited financial statements of the corporation (see page 26)
FINANCIAL AND SERVICE DELIVERY SCORECARD
In addition to its legislative requirements, and as a part of the organization’s desire to provide quality performance measurement to its stakeholders, the orga-nization has developed its performance scorecard. Preliminary measures include four key areas:
1. Quality Standard Measures2. Customer Measures 3. Organizational Learning Measures4. Financial Measures
In order to select appropriate measures and targets, the PVSC drew upon several sources of comparison including industry standards and benchmarks for not-for-profit organizations, industry standards and benchmarks for other Canadian assessment jurisdictions and established international assessment stan-dards.
1. Quality Standard Measures
The PVSC reports the Level of Assessment (LA) to measure the extent to which assessments reflect the market value standard for each municipality as per Section 42 of the Assessment Act. The PVSC bases the 2011 LA on the Median analysis of assessment to sale ratios. The PVSC uses the International As-sociation of Assessing Officers (IAAO) standard of 90% to 110% for calculating the general level.
The PVSC Internal Audit and Compliance team has conducted a series of statistical and quality tests on the calculation of the 2011 Level of Assessment for each of the 55 municipalities. All calculations were reviewed for accuracy and completeness.
The audit found the resulting 2011 LA for all Nova Scotia municipalities to be within the acceptable range of 90% - 110%.
Section 3.4 of the IAAO Standards states that where a ratio study sample produces fewer than five sales, statistical results have exceptionally poor reliability and are not very useful. For municipalities with fewer than five sales for analysis, the LA has been reported as 100 % following IAAO recommendations.

19
2011 Level of Assessment by Municipality2011 Level of Assessment by Municipality
Municipality Residential Commercial Municipality Residential CommercialLevel of Assessment Level of Assessment Level of Assessment Level of Assessment
CAPE BRETON REGIONAL MUNICIPALITY 97% 101% TOWN OF BRIDGETOWN 100% 100%HALIFAX REGIONAL MUNICIPALITY 98% 98% TOWN OF BRIDGEWATER 95% 100%MUNICIPALITY OF THE COUNTY OF ANNAPOLIS 98% 100% TOWN OF CANSO 99% 100%MUNICIPALITY OF THE COUNTY OF ANTIGONISH 96% 100% TOWN OF CLARK'S HARBOUR 102% 100%MUNICIPALITY OF THE COUNTY OF COLCHESTER 95% 100% TOWN OF DIGBY 99% 100%MUNICIPALITY OF THE COUNTY OF CUMBERLAND 98% 100% TOWN OF HANTSPORT 100% 100%MUNICIPALITY OF THE COUNTY OF INVERNESS 96% 103% TOWN OF KENTVILLE 100% 100%MUNICIPALITY OF THE COUNTY OF KINGS 99% 99% TOWN OF LOCKEPORT 96% 100%MUNICIPALITY OF THE COUNTY OF PICTOU 97% 100% TOWN OF LUNENBURG 100% 100%MUNICIPALITY OF THE COUNTY OF RICHMOND 100% 100% TOWN OF MAHONE BAY 98% 100%MUNICIPALITY OF THE COUNTY OF VICTORIA 98% 100% TOWN OF MIDDLETON 96% 100%MUNICIPALITY OF THE DISTRICT OF ARGYLE 101% 100% TOWN OF MULGRAVE 98% 100%MUNICIPALITY OF THE DISTRICT OF BARRINGTON 101% 100% TOWN OF NEW GLASGOW 100% 100%MUNICIPALITY OF THE DISTRICT OF CHESTER 96% 100% TOWN OF OXFORD 96% 100%MUNICIPALITY OF THE DISTRICT OF CLARE 97% 100% TOWN OF PARRSBORO 98% 100%MUNICIPALITY OF THE DISTRICT OF DIGBY 103% 100% TOWN OF PICTOU 97% 100%MUNICIPALITY OF THE DISTRICT OF EAST HANTS 95% 100% TOWN OF PORT HAWKESBURY 98% 100%MUNICIPALITY OF THE DISTRICT OF GUYSBOROUGH 102% 100% TOWN OF SHELBURNE 100% 100%MUNICIPALITY OF THE DISTRICT OF LUNENBURG 98% 100% TOWN OF SPRINGHILL 100% 100%MUNICIPALITY OF THE DISTRICT OF SHELBURNE 102% 100% TOWN OF STELLARTON 98% 100%MUNICIPALITY OF THE DISTRICT OF ST. MARY'S 99% 100% TOWN OF STEWIACKE 96% 100%MUNICIPALITY OF THE DISTRICT OF WEST HANTS 96% 100% TOWN OF TRENTON 98% 100%MUNICIPALITY OF THE DISTRICT OF YARMOUTH 101% 100% TOWN OF TRURO 98% 103%REGION OF QUEENS MUNICIPALITY 99% 100% TOWN OF WESTVILLE 95% 100%TOWN OF AMHERST 95% 99% TOWN OF WINDSOR 100% 100%TOWN OF ANNAPOLIS ROYAL 100% 100% TOWN OF WOLFVILLE 100% 100%TOWN OF ANTIGONISH 101% 100% TOWN OF YARMOUTH 97% 100%TOWN OF BERWICK 96% 100%

20
2. Customer Measures
The PVSC undertakes several surveys with the general public throughout the year to assess performance of the organization and its staff.
Call Centre and Assessor Satisfaction Review - These surveys assess the effectiveness and efficiency of the PVSC call centre and assessment staff in dealing with the public inquires it received.
2010 Appeal Process Survey - This survey evaluated the overall effectiveness of the 2010 appeal process. Client feedback received through this survey is incorporated into the PVSC’s continuous improvement activities.
78 %87 %
70 %
79 %
84 %
92 %
79 %
83 %
1 2 3 4
2011
2010
Call Centre Feedback Satisfaction1. Overall satisfaction with the representative that handles the call.
2. Call was answered promptly.
3. Representatives conducted themselves in a professional and friendly manner.
4. Representative demonstrated a willingness to listen to your concerns.
Assessor Feedback Satisfaction
1. Overall satisfaction with the assessor.
2. Assessor demonstrated a willingness to listen to your concerns.
3. Assessor provided you with answers to your questions.
4. Assessor was fair and objective in handling your concerns.
80 %
91 %93 %
90 %
77 %
84 %
89 %
84 %
1 2 3 4
2011
2010
Since 1997, the PVSC has conducted an an-nual call centre and assessor review survey. This year, the survey took place during the first two weeks of March and included 400 property owners who made an inquiry to the call centre during the 21 day assessment notification period. It does not represent the opinions of property owners in Nova Scotia who did not call.
The improved results in surveys can be attribut-ed to the advancements the PVSC has made to its inquiry management process. An internal call centre has been established and serves as the first point of contact for inquiries. An external call centre was engaged for the assessment notifica-tion period, trained by PVSC staff and had PVSC representation available offering their expertise to assist in answering questions. In addition to the call centre advancements, assessment staff are continuously trained to ensure they are knowledgeable about the assessment process as well as being current on relevant assessment news in Nova Scotia.

21
3. Organizational Learning Measures
The PVSC recognizes staff as one of its most important assets and that by investing in the professional growth and development of staff, the organiza-tion can learn and grow to meet the needs of its stakeholders and continue to provide competent, professional service. The organization has set a target of spending 2 per cent1 of its payroll budget to provide training and development opportunities to staff.
In the 2010/11 fiscal year the PVSC spent 1.74 per cent of its total payroll budget on training and development.
The PVSC also encourages staff to pursue appropriate professional designa-tions from external sources to add to the overall knowledge base of the orga-nization. In 2010/11 the organization sought to establish a baseline of current staff holding such designations, specifically in assessment operations, to help determine future growth opportunities.
As required by the PVSC, all Senior Commercial Assessors have attained Accredited Appraiser Canadian Institute (AACI) designation. In addition, many other assessment staff members hold other professional designa-tions or are actively working towards attaining designation.
4. Financial Measures
In addition to the audited financial statements which provide an overview of the organization’s financial management, the PVSC also measures additional finan-cial aspects to provide a clearer picture of its operations.
Defense Interval - Reflects how many months the organization could operate if no additional funds were received.
Liquidity Ratio - Reflects the organization’s current assets compared to its current liabilities. The PVSC has a strong liquidity position with the value of its short term assets exceeding its short term liabilities.
1. Target is based on the average spending by Canadian Directors of Assessment on Training and Development
Measure Target 2011 ActualDefense Interval Between 1-3 months 2.50 monthsLiquidity Ratio 1 1.36
External Compliance Audit
As part of the PVSC’s Performance Measures and Standards, and as outlined in the Memorandum of Understanding with the Province of Nova Scotia, the PVSC arranged for an External Audit to evaluate its level of compliance with legislative and contractual obligations.
The external audit measured the PVSC’s level of compliance, during the 2010/11 fiscal year, within the following areas: • Property Valuation Services Corporation Act• Assessment Act• The International Association of Assessing Officers (IAAO) Standards• Performance Management goals as outlined in the Memorandum of Under-
standing with the Province of Nova Scotia• General Computer Controls
The audit process also allows the PVSC to identify risks, ensure controls are in place to mitigate those risks, and provide assurance that the assessment pro-cess is being administered in the public interest.
Overall, the PVSC was found to be in compliance with the audit elements, achieving a compliance level of approximately 80%. The process has allowed the PVSC to identify areas for improvement and develop the appropriate action plans as part of its continuous improvement initiatives.
The Corporation’s response to the external audit indicates that some areas identified for enhancement have already been addressed and mitigated through process improvement projects over the past year. As a result, improved findings are expected in these areas in future internal and external audits.

22
MANAGEMENT DISCUSSION AND ANALYSIS
The PVSC is an independent Not-for-Profit corporation created by the Property Valuation Services Corporation Act to establish and maintain property assessments in accordance with the Assessment Act. Nova Sco-tia’s 55 municipalities fund the PVSC proportional to the average of their respective share of the Provincial Uniform Assessment and total number of property accounts in the province. Non-municipal revenue sources for the PVSC include revenue from data access services, contracts with First Nations, interest and investment income.
This year, the PVSC has prepared Consolidated Financial Statements which includes the operating fund and restricted reserve funds estab-lished by the Board of Directors. The supporting non-consolidated state-ments have been included (pages 34 - 35) for comparative and informa-tion purposes. The 2011 Budget was prepared as an operating budget for purposes of billing the municipalities for current year operations. It does not include estimates for interest from operating funds nor the investment income and unrealized gain on investments.
The PVSC constructs its plan and budget with the objectives of funding operations and maintaining service through current year revenues, fund-ing for liabilities of non-pension post retirement benefits, growing reserves for future technology development and maintaining a reserve for contin-gencies for the security of the Corporation in order that member munici-palities do not face unexpected costs. The Corporation has completed its statutory obligation to deliver the assessment roll to required IAAO stan-dards (see Quality Standard Measures). At financial year end, the PVSC has funds in excess of liabilities for the post-retirement non-pension bene-fits, a Technology Advancement fund of $1.443 million available for future
technology innovation, and a contingency reserve of $1.212 million. The Technology Advancement Fund was set up to meet technology changes, system refurbishment and/or replacement requirements for the computer assisted mass appraisal (CAMA) system and other technologies that are critical for the Corporation to carry out its responsibilities cost effectively and efficiently. The contingency reserve relates to internally restricted funds set aside by the Board in case of unforeseen expenditures and/ or revenue interruptions. This fund is capped at 30 days operating expense.
The following discussion and analysis should be read in conjunction with the audited financial statements and related notes for the fiscal year ended March 31, 2011. All financial information in Table 1 was prepared based on current Canadian Generally Accepted Accounting Principles.
Financial Summary for the Two Years: 2010 to 2011 Table 1 (page 25) is a summary of the financial results relating to the Property Valuation Services Corporation’s Consolidated Statement of Op-erations for the fiscal years 2010 - 2011. Comparison of 2011 Actual Results with 2011 Budget Revenues and expenses related to program delivery and administrative activities are reported in the Corporation’s Operating Fund. The Corpo-ration billed $16.983 million to Municipalities in 2011. The billed Budget was developed and approved by the Board on a break-even basis for the Operating Fund. Budgeted expenses that relate to the provision of as-sessment and related property information services to Municipalities in the Province of Nova Scotia were billed using the cost recovery formula stated in the Property Valuation Services Corporation Act.
The Consolidated Statement of Operations is a consolidation of the rev-enues and expenses that relate to the Corporation’s Operating Fund, the

23
Restricted Capital Asset Fund, the Restricted Investment Fund and the Inter-nally Restricted Reserve Funds. The 2011 Budget did not include estimates for investment income and unrealized gains on investments. The main rea-son for this exclusion is that income that relates to restricted investments for post retirement benefits is reinvested in the investment accounts and is not used for ongoing operations. The shortfall of revenue over expenses on the Consolidated Statement of Operations for the 2011 Budget of $140,000 is a result of investment income and unrealized gains that were not included on the 2011 Budget.
As part of the annual planning and budgeting process, management will be reviewing the budget presentation for consolidated purposes in future years. The PVSC budgets are prepared and recommended by staff to the PVSC Board of Directors for approval.
The Corporation implemented cost control measures that resulted in signifi-cant reductions in cost levels in several areas and contributed to budget sav-ings on operating expenses in 2011 of $679,429 which is almost 4% below the budgeted levels. In 2011 the Corporation continued to work towards the attainment of its strategic goals while minimizing the impact of funding pres-sures within its budget. The main expense categories whose actual expendi-tures were lower than expected are:
• Salaries and Benefits for 2011 were $332,820 lower than budget. The primary cause for the budget savings was a reduction in vacation liabili-ties due to improved tracking of vacation balances and encouraging em-ployees to reduce vacation balances carried over to the next fiscal year. The Organization saved $95,000 on budgeted vacation accruals for the year and wrote down the accumulated vacation liability on its books by $ 78,269 (from $350,000 in 2010 to $271,731 in 2011). Salaries and ben-efits were also lower than expected due to staff adjustments and retire-ments during the year that resulted in savings of $140,000.
• Employee travel for 2011 was $198,787 below budget. The Corporation increased its use of conference calls and virtual meeting technology to reduce travel related to meetings and a decrease in monthly travel allow-ance requirements. The 2011 mileage rates decreased in accordance with the provincial travel index for the year. Another contributing factor was the implementation of the Pictometry project which resulted in improvements in business processes and reductions in travel expenses during the year.
• The Corporation saved $68,921 in 2011 on its professional services bud-get due mainly to increased use of internal resources for Process Im-provement Initiatives, changes in payroll processing and early completion of collective bargaining.
• Printing and postage for 2011 was $98,882 lower than budget due to the reduction in the number of appeals and appeal related priority mail and printing, the phasing out of business occupancy accounts and set up of an Electronic File Transfer (EFT) site for municipalities.
• The savings on employee future benefits in 2011 of $153,501 are a re-sult of the revision of annual service costs and actuarial estimates by the Corporation’s consultants. The actuarial valuation report was issued on June 3, 2010 and there was an actuarial revaluation gain on post retire-ment Health Benefits reflecting the methodology of valuating the premi-ums paid by the Corporation rather than the claims experienced prior to the Corporation becoming independent.
IT operating expenses were $145,247 higher than the 2011 budgeted levels. This was due to implementation of the Pictometry project. Pictometry uses aerial oblique photography to provide multiple views of properties and the technology allows users to take accurate measurements of distances and dimensions. The project costs for Pictometry include annual flying, integra-tion into iasWorld, maintenance and support services. A business case was conducted by the Corporation which looked at the benefits of incorporating Pictometry into the PVSC’s business processes and the cost savings that will be realized by the Corporation over a five year period.

24
Cost Recovery Revenue was $64,315 lower than budgeted due to a late start of the Automated Valuation Model project, less cost recoveries for time taken off for Union business due to an early settlement of the HR negotiations and a reduction in the amount relating to other cost recover-ies from the Province.
Comparison of 2011 Actual Results with 2010 Actual Results
A net excess of revenues over expenses of $875,368 was reported on the Consolidated Statement of Operations for 2011 compared to $62,188 for 2010.
The Corporation managed to control costs and cut back on its operating expenses compared to the prior year. Total operating expenses for 2011 were $99,085 lower than the prior year. The main areas that experienced a significant decline in expenditures compared to the prior year were as follows:
• Employee travel was $209,943 lower in 2011 than in 2010, a reduc-tion of 23.92%. This reflects the Corporation’s efforts to reduce travel related to meetings, review entitlements for monthly travel allowanc-es and incorporate Pictometry into its business processes.
• Professional services were $250,135 lower in 2011 compared to 2010 mainly because during prior years the Corporation utilized profes-sional services and temp staff while determining the long term needs of the Corporation for call centre and other service requirements. There was also a change in 2011 towards increased use of internal resources in several areas such as, payroll processing, annual report production and business process improvements.
• There was a decrease of $29,078 in 2011 in Telecommunication charges due to efforts to rationalize existing land lines and reduce
the number of lines used by the Corporation.• Printing and postage was $82,197 lower in 2011 than 2010, a reduc-
tion of 11.79%. This was due to a combination of several operating efficiencies that include lower levels of appeals, introduction of an EFT site for municipalities and reduction in other office printing and mail outs.
• Rentals and leases in 2011 were $41,436 lower than prior year be-cause of reductions in office leased space for the Kentville office and other lease adjustments. A Tele-work project was introduced in the Kentville PVSC office to allow selected assessment staff to work from home.
• Employee future benefits were $68,408 lower in 2011 than prior year due to a revision of annual service costs and actuarial estimates by the PVSC’s actuarial consultants.
The Corporation has a three year term Collective Agreement with its Em-ployees Union that covers the period April 1, 2010 to March 31, 2013. The terms of the Agreement include a 2% annual wage increase to be paid to all bargaining unit members as from April 1, 2010. Salaries and benefits increased by $407,807 (i.e. 3.87%) in 2011 compared to 2010 mainly because of the annual negotiated increases and incremental growth in salaries as employees progress within the salary scales stated in the collective agreement.

25
Page 1 07/07/2011
Property Valuation Services CorporationTable 1: Financial Summary for the Two Years: 2010 to 2011
2010 2011 2011 Variance of 2011 Comparison of
Actual Actual Budgeted Actual from Budget2011 Actual to 2010
Actual
REVENUES:Municipal Revenue 16,443,000 16,983,000 16,983,000 - 540,000Interest Revenue 53,646 38,974 - 38,974 (14,672)Cost Recovery Revenue 85,367 35,685 100,000 (64,315) (49,682)Investment Income 66,553 170,910 - 170,910 104,357Unrealized Gains on Investments 56,278 190,370 - 190,370 134,092
Total Revenues 16,704,844 17,418,939 17,083,000 335,939 714,095
EXPENSES
Employee Salaries and Benefits 10,541,073 10,948,880 11,281,700 (332,820) 407,807Employee Travel 877,584 667,641 866,428 (198,787) (209,943)Professional Services 1,200,295 950,160 1,019,081 (68,921) (250,135)Telecommunications 216,148 187,070 166,228 20,842 (29,078)IT Operations 898,521 1,063,137 917,890 145,247 164,616Printing and Postage 697,056 614,859 713,741 (98,882) (82,197)Rentals and Leases 1,019,956 978,520 984,901 (6,381) (41,436)Staff Training 80,738 81,261 101,815 (20,554) 523Membership Dues 61,689 69,069 49,349 19,720 7,380Supplies and Services 154,503 181,237 147,527 33,710 26,734Meeting Expenses 106,401 95,019 128,340 (33,321) (11,382)Employee Future Benefits 181,907 113,499 267,000 (153,501) (68,408)Depreciation 606,784 593,219 579,000 14,219 (13,565)
Total Expenses 16,642,656 16,543,571 17,223,000 (679,429) (99,085)
EXCESS ( OR SHORTFALL) OF REVENUES 62,188 875,368 (140,000) 1,015,368 813,180OVER EXPENSES

26
Grant Thornton LLPSuite 1100
2000 Barrington StreetHalifax, NS
B3J 3K1
T (902) 421-1734F (902) 420-1068
www.GrantThornton.ca
Audit • Tax • AdvisoryGrant Thornton LLP. A Canadian Member of Grant Thornton International Ltd
Independent auditor’s reportTo the Board of Directors of the Property Valuation Services Corporation
We have audited the accompanying consolidated financial statements of Property Valuation Services Corporation, which comprise the consolidated statement of financial position as at March 31, 2011, and the consolidated statement of operations, changes in net assets and cash flows for the year then ended, and a summary of significant accounting policies and other explanatory information.
Management’s responsibility for the financial statementsManagement is responsible for the preparation and fair presentation of these consolidated financial statements in accordance with Canadian generally ac-cepted accounting principles, and for such internal control as management determines is necessary to enable the preparation of consolidated financial state-ments that are free from material misstatement, whether due to fraud or error.
Auditor’s responsibilityOur responsibility is to express an opinion on these consolidated financial statements based on our audit. We conducted our audit in accordance with Canadi-an generally accepted auditing standards. Those standards require that we comply with ethical requirements and plan and perform the audit to obtain reason-able assurance about whether the consolidated financial statements are free from material misstatement.
An audit involves performing procedures to obtain audit evidence about the amounts and disclosures in the consolidated financial statements. The procedures selected depend on the auditor’s judgment, including the assessment of the risks of material misstatement of the consolidated financial statements, whether due to fraud or error. In making those risk assessments, the auditor considers internal control relevant to the entity’s preparation and fair presentation of the consolidated financial statements in order to design audit procedures that are appropriate in the circumstances, but not for the purpose of expressing an opin-ion on the effectiveness of the entity’s internal control. An audit also includes evaluating the appropriateness of accounting policies used and the reasonable-ness of accounting estimates made by management, as well as evaluating the overall presentation of the consolidated financial statements.
We believe that the audit evidence we have obtained is sufficient and appropriate to provide a basis for our audit opinion.
OpinionIn our opinion, the consolidated financial statements present fairly, in all material respects, the financial position of Property Valuation Services Corporation as at March 31, 2011, and the results of its operations and its cash flows for the year then ended in accordance with Canadian generally accepted accounting principles.
Halifax, CanadaJune 23, 2011 Chartered accountants

27
CONSOLIDATED STATEMENT OF OPERATIONS
CONSOLIDATED STATEMENT OF FINANCIAL POSITION
2
Property Valuation Services CorporationConsolidated statement of operations Budget Actual ActualYear ended March 31 2011 2011 2010
RevenuesMunicipal $ 16,983,000 $ 16,983,000 $ 16,443,000Interest - 38,975 53,646Cost recovery 100,000 35,684 85,367Investment income - 170,910 66,553Unrealized gain on investments - 190,370 56,278
17,083,000 17,418,939 16,704,844
ExpensesEmployee future benefits 267,000 113,499 181,907IT operations 917,890 1,063,137 898,581Meeting expenses 128,340 95,019 106,407Membership dues and fees 49,349 69,069 61,701Other supplies and services 147,527 181,237 154,294Printing and postage 713,741 614,859 697,189Professional fees 1,019,081 950,160 1,200,014Rentals and leases 984,901 978,520 1,020,144Salaries and benefits 11,281,700 10,948,880 10,541,073Staff training and development 101,815 81,261 80,754Telecommunications 166,228 187,070 216,189Travel 866,428 667,641 877,619Depreciation 579,000 593,219 606,784
17,223,000 16,543,571 16,642,656
Excess of revenues over expenses $ (140,000) $ 875,368 $ 62,188
See accompanying notes to the consolidated financial statements
3
Property Valuation Services CorporationConsolidated statement of financial positionMarch 31 2011 2010
AssetsCurrent
Cash and cash equivalents $ 2,310,349 $ 2,897,320Restricted cash equivalents 535,406 -Receivables (note 6) 423,964 276,932Prepaids 57,073 60,628
3,326,792 3,234,880Restricted investments
Employee future benefits (note 5) 3,507,167 3,217,734Technology Advancement CAMA Reserve 1,443,140 682,968
Capital assets (note 8) 3,671,180 3,961,175
$ 11,948,279 $ 11,096,757
LiabilitiesCurrent
Payables and accruals (note 7) $ 1,298,965 $ 1,251,195Deferred revenue (note 2) 1,145,669 1,228,817
2,444,634 2,480,012
Employee future benefits obligation (note 5) 3,010,151 2,998,6195,454,785 5,478,631
Fund balancesRestricted Capital Asset Fund 3,671,180 3,996,157Operating Fund - -
Internally restricted reserve fundsTechnology advancement CAMA (note 4) 1,443,140 896,563Special Operating Reserve (note 3) - 190,000Contingency reserve (note 3) 1,211,928 535,406Unrealized post retirement gains reserve 167,246 -
Total fund balances 6,493,494 5,618,126
Total liabilities and fund balances $ 11,948,279 $ 11,096,757
Commitments (note 9)
On Behalf of the Board
Director Director
See accompanying notes to the consolidated financial statements

28
CONSOLIDATED STATEMENT OF CHANGES IN NET ASSETS
See accompanying notes to the financial statements
4
Property Valuation Services CorporationConsolidated statement of changes in net assetsYear ended March 31, 2011
Technology Special UnrealizedOperating Advancement Operating Contingency Post Retirement Capital 2011 2010
Fund CAMA Reserve Reserve Reserve Gains Reserve Asset Fund Total TotalBalance,beginning of year $ - $ 896,563 $ 190,000 $ 535,406 $ - $ 3,996,157 $ 5,618,126 $ 5,555,938
Excess of revenuesover expenses 1,381,542 87,045 - - (593,219) 875,368 62,188
Transfer for capital project 34,983 - - - - (34,983) - -
Additions from (to) capitalassets (303,225) - - - - 303,225 - -
Transfers from (to)Reserves (notes 3 and 4)
Technology advancementCAMA Reserve (459,532) 459,532 - - - - - -
Special Operating Reserve 190,000 - (190,000) - - - - -Contingency reserve (676,522) - - 676,522 - - - -Unrealized post retirement
gains reserve (167,246) - - - 167,246 - - -
Balance, end of year $ - $ 1,443,140 $ - $ 1,211,928 $ 167,246 $ 3,671,180 $ 6,493,494 $ 5,618,126
See accompanying notes to the consolidated financial statements

29
See accompanying notes to the financial statements
CONSOLIDATED STATEMENT OF CASH FLOWS
5
Property Valuation Services CorporationConsolidated statement of cash flowsYear ended March 31 2011 2010
Increase (decrease) in cash and cash equivalents
OperatingExcess of revenues over expenses $ 875,368 $ 62,188Depreciation 593,219 606,784Employee future benefits 11,533 (20,566)Unrealized gain on restricted investments (190,370) (56,278)Investment income on restricted investments (170,370) (97,491)
1,119,380 494,637
Change in non-cash operating working capitalReceivables (147,032) 126,711Prepaids 3,555 20,934Payables and accruals 47,770 226,980Deferred revenue (83,148) 927,525
940,525 1,796,787
InvestingPurchase of restricted investments (1,049,605) (3,900,702)Redemption of investments during the year - 2,778,962Unrealized gain on restricted investments 190,370 56,278Investment income on restricted investments 170,370 97,491Purchase of capital assets:
Computer -IT assets (233,768) (137,639)Furniture and equipment (34,983) (38,327)Leasehold improvements (34,474) (25,043)
(992,090) (1,168,980)
Net increase (decrease) in cash and cash equivalents (51,565) 627,807
Cash and cash equivalents, beginning of year 2,897,320 2,269,513
Cash and cash equivalents, end of year $ 2,845,755 $ 2,897,320
See accompanying notes to the consolidated financial statements

30
Notes to the Financial Statements
1. Nature of operations
Property Valuation Services Corporation was incorporated under the Prop-erty Valuation Services Corporation Act as of April 1, 2007. The purpose of the Corporation is to provide assessment and related property information services to Municipalities in the Province of Nova Scotia. All municipalities in Nova Scotia are members of the Corporation.
2. Summary of significant accounting policies
Basis of presentationThe financial statements have been prepared in accordance with Canadian generally accepted accounting principles for Not-for-Profit organizations using fund accounting. Revenues and expenses related to program deliv-ery and administrative activities are reported in the Operating Fund.
Financial statement presentation is on a Restricted Fund basis, the Re-stricted Capital Asset Fund reports the assets, revenues and expenses relating to the Corporation’s assets. The Restricted Investment Fund reports the revenues and expenses relating to the investments held for future employee benefits. The Operating Fund reports the revenues and expenses related to the Corporation’s program delivery and administrative activities.
Use of estimatesIn preparing the Corporation’s financial statements, in conformity with the Canadian generally accepted accounting principles management is required to make estimates and assumptions that affect the reported amounts of assets and liabilities, and the disclosure of contingent liabilities at the date of the financial statements and the reported amounts of rev-enues and expenses during the reporting period. Some of these estimates and assumptions include depreciation and employee future benefits. Ac-tual results could differ from those reported.
Revenue recognitionThe Corporation follows the deferral method for accounting for municipal revenues. Income from assessment services is recognized as revenue in the year in which the related services are provided.
Capital assetsCapital assets are recorded at cost. The Restricted Capital Asset Fund reports the assets, liabilities, revenues, and expenses relating to these capital assets. Transfers of capital assets from other government entities are recorded at their fair value at the date of transfer.
DepreciationDepreciation is recorded as an expense in the restricted capital asset fund. Rates and bases of depreciation applied to write off the capital assets over their estimated life are as follows:
IT hardware 3 years, straight-line IT software 30%, declining balance Computerized mass appraisal 10 years, straight-line Furniture and equipment 20%, declining balance Leasehold improvements 5 years, straight-line
Deferred revenueDeferred revenue represents payments received from the Municipali-ties prior to April 1 that relate to the next fiscal year and any contributions received or receivable from the Province for the Single Address project that relate to the next fiscal year.
Cash and cash equivalentsCash and cash equivalents include cash on hand and balances with the bank.
Cost recoveryThe Corporation has data sharing agreements with Canada Revenue Agency and Statistics Canada. Cost recovery revenue represents the fees related to data sharing agreements and other cost recoveries from the Province.
Financial instrumentsFinancial instruments include cash and cash equivalents, investments, receivables, deferred revenue and payables and accruals. Unless other-wise noted, it is management’s opinion that the Corporation is not exposed to significant interest, or currency risks arising from financial instruments and the fair value of these financial instruments are at least equal to their carrying values.
31
Pension benefit plansThe Province of Nova Scotia (“Province”) administers the defined benefit pen-sion plan, and the Corporation reimburses the Province for the pension costs related to the Corporation’s proportionate share of the employees covered under the plan. The Corporation’s share of the cost of defined benefit pension plan is accrued based on actuarial valuations, which are determined based on data provided by the Province using the projected benefit method pro-rated on service including the expected long-term rate of return on plan assets, salary, escalation, and retirement age.
The impact of changes in plan amendments is amortized on a straight-line ba-sis over the expected average remaining service life (EARSL) of active mem-bers.
The Corporation will contribute on an annual basis the estimated premium requirements under this defined benefit plan. The total 2011 expenses for the Corporation’s share of the defined pension plan is $644,154 (2010 - $650,275) which is included in salaries and benefits expense.
The Corporation also has a defined contribution plan for specified employees. Contributions for the year total $125,132 (2010 - $84,173).
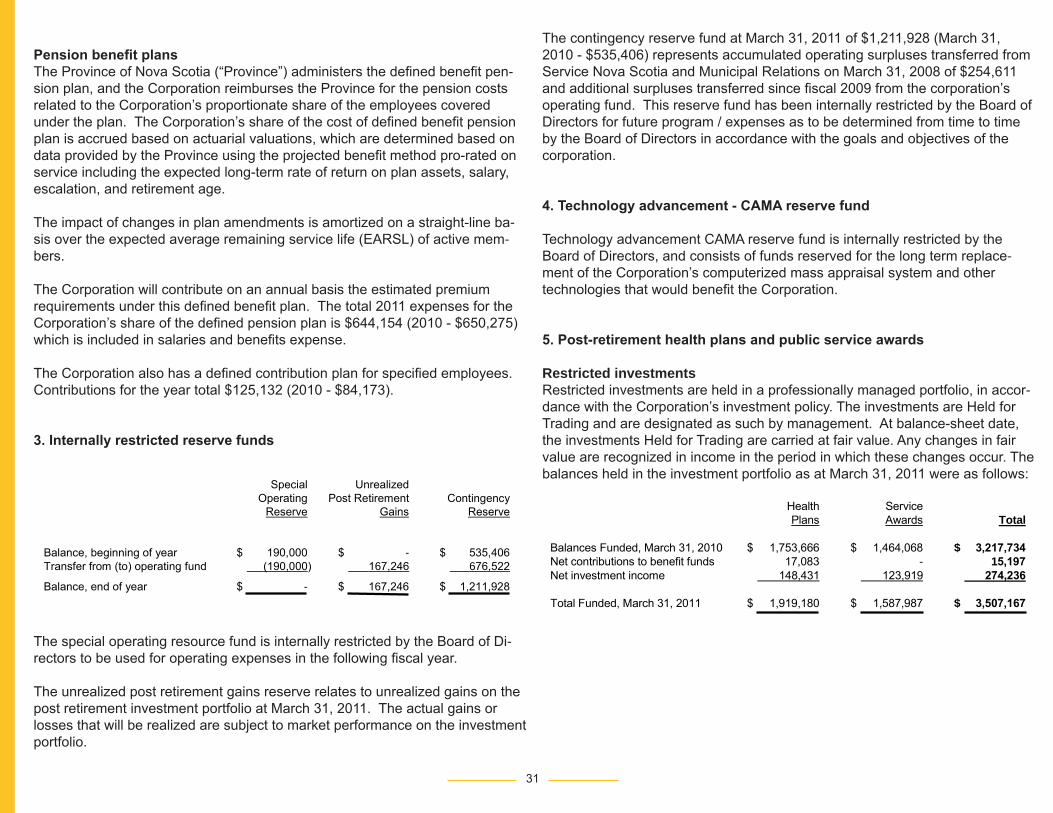
3. Internally restricted reserve funds
The special operating resource fund is internally restricted by the Board of Di-rectors to be used for operating expenses in the following fiscal year.
The unrealized post retirement gains reserve relates to unrealized gains on the post retirement investment portfolio at March 31, 2011. The actual gains or losses that will be realized are subject to market performance on the investment portfolio.
The contingency reserve fund at March 31, 2011 of $1,211,928 (March 31, 2010 - $535,406) represents accumulated operating surpluses transferred from Service Nova Scotia and Municipal Relations on March 31, 2008 of $254,611 and additional surpluses transferred since fiscal 2009 from the corporation’s operating fund. This reserve fund has been internally restricted by the Board of Directors for future program / expenses as to be determined from time to time by the Board of Directors in accordance with the goals and objectives of the corporation.
4. Technology advancement - CAMA reserve fund
Technology advancement CAMA reserve fund is internally restricted by the Board of Directors, and consists of funds reserved for the long term replace-ment of the Corporation’s computerized mass appraisal system and other technologies that would benefit the Corporation.
5. Post-retirement health plans and public service awards
Restricted investmentsRestricted investments are held in a professionally managed portfolio, in accor-dance with the Corporation’s investment policy. The investments are Held for Trading and are designated as such by management. At balance-sheet date, the investments Held for Trading are carried at fair value. Any changes in fair value are recognized in income in the period in which these changes occur. The balances held in the investment portfolio as at March 31, 2011 were as follows:
8
Property Valuation Services CorporationNotes to the consolidated financial statementsMarch 31, 2011
3. Internally restricted reserve funds
Special UnrealizedOperating Post Retirement Contingency
Reserve Gains Reserve
Balance, beginning of year $ 190,000 $ - $ 535,406Transfer from (to) operating fund (190,000) 167,246
The special operating resource fund is internally restricted by the Board of Directors to be used for operating expenses in the following fiscal year.
The unrealized post retirement gains reserve relates to unrealized gains on the post retirement investment portfolio at March 31, 2011. The actual gains or losses that will be realized are subject to market performance on the investment portfolio.
The contingency reserve fund at March 31, 2011 of $1,211,928 (March 31, 2010 - $535,406) represents accumulated operating surpluses transferred from Service Nova Scotia and Municipal Relations on March 31, 2008 of $254,611 and additional surpluses transferred since fiscal 2009 from the corporation’s operating fund. This reserve fund has been internally restricted by the Board of Directors for future program / expenses as to be determined from time to time by the Board of Directors in accordance with the goals and objectives of the corporation.
676,522
Balance, end of year $ - $ 167,246 $ 1,211,928
4. Technology advancement - CAMA reserve fund
Technology advancement CAMA reserve fund is internally restricted by the Board of Directors, and consists of funds reserved for the long term replacement of the Corporation’s computerized mass appraisal system and other technologies that would benefit the Corporation.
5. Post-retirement health plans and public service awards
Restricted investmentsRestricted investments are held in a professionally managed portfolio, in accordance with the Corporation’s investment policy. The investments are Held for Trading and are designated as such by management. At balance-sheet date, the investments Held for Trading are carried at fair value. Any changes in fair value are recognized in income in the period in which these changes occur. The balances held in the investment portfolio as at March 31, 2011 were as follows:
9
Property Valuation Services CorporationNotes to the consolidated financial statementsMarch 31, 2011
5. Post-retirement health plans and public service awards (continued)
Health ServicePlans Awards Total
Balances Funded, March 31, 2010 $ 1,753,666 $ 1,464,068 $ 3,217,734Net contributions to benefit funds 17,083 - 15,197Net investment income 148,431 123,919
Employee future benefitsOn April 1, 2008, the Corporation acquired the employee non-pension future benefits as follows:
274,236
Total Funded, March 31, 2011 $ 1,919,180 $ 1,587,987 $ 3,507,167
(a) Post retirement health plans are to designated employees of the Corporation. The Corporation is responsible for funding the employer portion of the premium payments and any obligations under these health benefit plans. The Corporation developed a long term investment policy with actuarial consultants. In 2009, the Corporation received an estimate of current liability and amortized over five years the estimated actuarial loss due to timing of receipt of funds and rates of return.
(b) Designated employees transferred to the Corporation who upon retirement and who are eligible to receive a pension under the Public Service Superannuation Act shall be granted a Public Service Award based on years of service. The amount of this award is based on one week's pay for each year of full-time service up to a maximum of 26 full years. The Corporation accrues its obligations related to these awards and has adopted a long term investment plan to fund these obligations.
The Corporation accrues its obligations under employees future benefit plans and the related costs when these benefits are earned through current service. The annual service costs and other actuarial estimates adopted by management were reviewed based on the results of an actuarial valuation for the year ended March 31, 2010 conducted by the Corporation’s actuarial consultant. Assumptions for the actuarial valuation reports issued on June 3, 2010are as follows:
Health Serviceplans
Management obtained confirmation from the actuarial consultants that the assumptions for the March 31, 2010 actuarial valuation are valid for the year ended March 31, 2011.
awards
Discount rate 4.95% 4.95%Rate of compensation and inflation 2.5% 2.5%Heath Care Trend: Initial rate: drugs 11%Initial rate: other health 6.5%Ultimate rate: drugs and other health 4.5%Year ultimate reached 2017

32
Employee future benefitsOn April 1, 2008, the Corporation acquired the employee non-pension future benefits as follows:
(a) Post retirement health plans are to designated employees of the Corporation. The Corporation is responsible for funding the employer portion of the premium payments and any obligations under these health benefit plans. The Corporation developed a long term investment policy with actu-arial consultants. In 2009, the Corporation received an estimate of current liability and amortized over five years the estimated actuarial loss due to timing of receipt of funds and rates of return.
(b) Designated employees transferred to the Corporation who upon re-tirement and who are eligible to receive a pension under the Public Service Superannuation Act shall be granted a Public Service Award based on years of service. The amount of this award is based on one week’s pay for each year of full-time service up to a maximum of 26 full years. The Corporation accrues its obligations related to these awards and has adopted a long term investment plan to fund these obligations.
The Corporation accrues its obligations under employees future benefit plans and the related costs when these benefits are earned through current service. The annual service costs and other actuarial estimates adopted by management were reviewed based on the results of an actuarial valuation for the year ended March 31, 2010 conducted by the Corporation’s actuarial consultant. Assumptions for the actuarial valuation reports issued on June 3, 2010 are as follows:
Management obtained confirmation from the actuarial consultants that the assumptions for the March 31, 2010 actuarial valuation are valid for the year ended March 31, 2011.
The Corporation recognizes that fluctuations in actuarial valuation of future employee liabilities will occur over time due to changes in actuarial assump-tions and other factors such as the level of actual claims relating to these liabilities. Therefore Management has adopted a policy to amortize over three years the actuarial gains and losses in excess of 10% of the projected
liabilities in the Corporation’s books as at year-end. Where the fluctuations do not exceed 10% of the year-end liability balances they shall not be amor-tized in the Corporation’s books.
There was an actuarial revaluation gain on Post Retirement Health Benefits reflecting the methodology of valuating the premiums paid by the Corpo-ration rather than claims experience prior to the Corporation becoming independent. The amortization for the actuarial revaluation gain for Post Retirement Health Benefits for the year ended March 31, 2011 is $88,838. Actuarial valuations of Service awards are within 10% of the of the year-end liability balances.
The balances relating to the Corporation’s employee future obligations are as follows:
Based on the actuarial valuations dated June 3, 2010 the annual service costs for the year ended March 31, 2011 for the Health Plans is expected to be $77,492, and the Service Awards plan is expected to be $85,343.
The liabilities for employee future benefits are fully funded by the Corpora-tion. As of March 31, 2010, there was an excess funded amount of $497,016 (2010 - funded excess of $219,115).
6. Receivables
The Canada Revenue Agency (CRA) issued a ruling on February 13, 2009 designating the PVSC a municipality pursuant to subsection 259 (1) of the Excise Tax Act. CRA is now reimbursing the Corporation’s HST claims as per the terms of this ruling. Included in receivables is $146,497 (2010 - $148,946) for an outstanding HST reimbursement claim that is awaiting processing by CRA and $268,805 receivable from Service Nova Scotia and Municipal Relations for their contribution for the single address project.
9
Property Valuation Services CorporationNotes to the consolidated financial statementsMarch 31, 2011
5. Post-retirement health plans and public service awards (continued)
Health ServicePlans Awards Total
Balances Funded, March 31, 2010 $ 1,753,666 $ 1,464,068 $ 3,217,734Net contributions to benefit funds 17,083 - 15,197Net investment income 148,431 123,919
Employee future benefitsOn April 1, 2008, the Corporation acquired the employee non-pension future benefits as follows:
274,236
Total Funded, March 31, 2011 $ 1,919,180 $ 1,587,987 $ 3,507,167
(a) Post retirement health plans are to designated employees of the Corporation. The Corporation is responsible for funding the employer portion of the premium payments and any obligations under these health benefit plans. The Corporation developed a long term investment policy with actuarial consultants. In 2009, the Corporation received an estimate of current liability and amortized over five years the estimated actuarial loss due to timing of receipt of funds and rates of return.
(b) Designated employees transferred to the Corporation who upon retirement and who are eligible to receive a pension under the Public Service Superannuation Act shall be granted a Public Service Award based on years of service. The amount of this award is based on one week's pay for each year of full-time service up to a maximum of 26 full years. The Corporation accrues its obligations related to these awards and has adopted a long term investment plan to fund these obligations.
The Corporation accrues its obligations under employees future benefit plans and the related costs when these benefits are earned through current service. The annual service costs and other actuarial estimates adopted by management were reviewed based on the results of an actuarial valuation for the year ended March 31, 2010 conducted by the Corporation’s actuarial consultant. Assumptions for the actuarial valuation reports issued on June 3, 2010are as follows:
Health Serviceplans
Management obtained confirmation from the actuarial consultants that the assumptions for the March 31, 2010 actuarial valuation are valid for the year ended March 31, 2011.
awards
Discount rate 4.95% 4.95%Rate of compensation and inflation 2.5% 2.5%Heath Care Trend: Initial rate: drugs 11%Initial rate: other health 6.5%Ultimate rate: drugs and other health 4.5%Year ultimate reached 2017
10
Property Valuation Services CorporationNotes to the consolidated financial statementsMarch 31, 2011
5. Post-retirement Health Plans and Public Service Awards (continued)
The Corporation recognizes that fluctuations in actuarial valuation of future employee liabilities will occur over time due to changes in actuarial assumptions and other factors such as the level of actual claims relating to these liabilities. Therefore Management has adopted a policy to amortize over three years the actuarial gains and losses in excess of 10% of the projected liabilities in the Corporation’s books as at year-end. Where the fluctuations do not exceed 10% of the year-end liability balances they shall not be amortized in the Corporation’s books.
There was an actuarial revaluation gain on Post Retirement Health Benefits reflecting themethodology of valuating the premiums paid by the Corporation rather than claims experience prior to the Corporation becoming independent. The amortization for the actuarial revaluation gain for Post Retirement Health Benefits for the year ended March 31, 2011 is $88,838. Actuarial valuations of Service awards are within 10% of the of the year-end liability balances.
The balances relating to the Corporation’s employee future obligations are as follows:
Health ServicePlans Awards Total
Balance, March 31, 2010 $ 1,651,446 $ 1,347,173 $ 2,998,619Payments (14,682) (87,285) (101,967)Annual service cost 77,492 85,343 162,835Amortization of actuarial (88,838) 39,502 (49,336
Balance, March 31, 2011 $ 1,625,418 $ 1,384,733 $ 3,010,151
)
Based on the actuarial valuations dated June 3, 2010 the annual service costs for the year ended March 31, 2011 for the Health Plans is expected to be $77,492, and the Service Awards plan is expected to be $85,343.
The liabilities for employee future benefits are fully funded by the Corporation. As of March 31, 2010, there was an excess funded amount of $497,016 (2010 - funded excess of $219,115).
6. Receivables
The Canada Revenue Agency (CRA) issued a ruling on February 13, 2009 designating the PVSC a municipality pursuant to subsection 259 (1) of the Excise Tax Act. CRA is now reimbursing the Corporation’s HST claims as per the terms of this ruling. Included in receivables is $146,497 (2010 - $148,946) for an outstanding HST reimbursement claim that is awaiting processing by CRA and $268,805 receivable from Service Nova Scotia and Municipal Relations for their contribution for the single address project.

33
7. Payables and accruals
Below is a summary of payables and accruals as at year end:
8. Capital assets
9. Commitments
(a) The Corporation has entered lease agreements for rental of its office premises, expiring in 2013. Minimum annual lease payments for the next two years are as follows:
2012 $ 636,499 2013 $ 57,341
Where required the Corporation will re-negotiate its lease terms and condi-tions as they expire.
(b) The Corporation entered into a three year agreement, expiring March 31, 2013 with a service provider for the provision of annual mainte-nance and support for its Mass Appraisal Computer System. The minimum annually payments under this agreement are as follows:
2012 $ 518,400 2013 $ 544,447
The agreement included optional additional consulting and development services which will be performed by the IT service provider when required.
10. Risk management
Credit riskThe Corporation’s credit risk arises from the recovery of its expenses from the Nova Scotia Municipal units. The Corporation’s credit risk is minimal as a result of its pre-billing and collection policies which are done on a quarterly basis. Also the recoveries are from the Municipal units of the Province who are all stakeholders of the Corporation.
Market riskThe Corporation is exposed to market fluctuations in its restricted in-vestments. The Corporation’s restricted investments allocation totalling $4,950,307 at March 31, 2011 consists of the following:
Equity securities 44.5% Fixed income securities 53.5% Cash 2.0%
The audit and finance committee monitors the investment funds in accor-dance with the Corporation’s investment policies.
Currency riskThe Corporation is not exposed to financial risks that arise from the fluctua-tions in foreign exchange rates and the degree of volatility of these rates.
11. Related party transaction
All revenues are received from the Municipalities throughout the Province of Nova Scotia. These Municipalities are the members of the Corporation.
12. Comparative figures
Certain of the 2010 comparative figures have been reclassified to conform to the financial statement presentation adopted for 2011.
11
Property Valuation Services CorporationNotes to the consolidated financial statementsMarch 31, 2011
7. Payables and accruals
Below is a summary of payables and accruals as at year end:
2011 2010
Vacation liability $ 271,731 $ 350,000Salaries and other benefit accruals 833,039 599,830Trade payables 194,195
8. Capital assets
301,365
$ 1,298,965 $ 1,251,195
2011 2010
Accumulated Net Book Net Book
IT hardware $ 374,447 $ 244,578 $ 129,869 $ 108,809IT software 225,838 49,155 176,683 51,757Computerized mass appraisal 4,585,633 1,363,616 3,222,017 3,645,596Furniture and equipment 139,681 53,330 86,351 73,465Leasehold improvements 111,632 55,372 56,260
9. Commitments
81,548
$ 5,437,231 $ 1,766,051 $ 3,671,180 $ 3,961,175
(a) The Corporation has entered lease agreements for rental of its office premises,expiring in 2013. Minimum annual lease payments for the next two years are as follows:
2012 $636,4992013 $ 57,341
Where required the Corporation will re-negotiate its lease terms and conditions as they expire.
(b) The Corporation entered into a three year agreement, expiring March 31, 2013 with a service provider for the provision of annual maintenance and support for its Mass Appraisal Computer System. The minimum annually payments under this agreement are as follows:
2012 $518,4002013 $544,447
The agreement included optional additional consulting and development services which will be performed by the IT service provider when required.
11
Property Valuation Services CorporationNotes to the consolidated financial statementsMarch 31, 2011
7. Payables and accruals
Below is a summary of payables and accruals as at year end:
2011 2010
Vacation liability $ 271,731 $ 350,000Salaries and other benefit accruals 833,039 599,830Trade payables 194,195 301,365
$ 1,298,965 $ 1,251,195
8. Capital assets 2011 2010
Cost Accumulated Net Book Net BookDepreciation Value Value
IT hardware $ 374,447 $ 244,578 $ 129,869 $ 108,809IT software 225,838 49,155 176,683 51,757Computerized mass appraisal 4,585,633 1,363,616 3,222,017 3,645,596Furniture and equipment 139,681 53,330 86,351 73,465Leasehold improvements 111,632 55,372 56,260 81,548
$ 5,437,231 $ 1,766,051 $ 3,671,180 $ 3,961,175
9. Commitments
(a) The Corporation has entered lease agreements for rental of its office premises,expiring in 2013. Minimum annual lease payments for the next two years are as follows:
2012 $636,4992013 $ 57,341
Where required the Corporation will re-negotiate its lease terms and conditions as they expire.
(b) The Corporation entered into a three year agreement, expiring March 31, 2013 with a service provider for the provision of annual maintenance and support for its Mass Appraisal Computer System. The minimum annually payments under this agreement are as follows:
2012 $518,4002013 $544,447
The agreement included optional additional consulting and development services which will be performed by the IT service provider when required.

34
STATEMENT OF OPERATIONS AND CHANGES IN FUND BALANCE - OPERATING FUND
13
Property Valuation Services CorporationStatement of operations and changes in fund balance - operating fund Budget Actual ActualYear ended March 31 2011 2011 2010
RevenuesMunicipal $ 16,983,000 $ 16,983,000 $ 16,443,000Interest - 38,975 53,646Cost recovery 100,000 35,684 85,367Investment income - 127,426 66,553Unrealized gain on investments - 146,809 56,278
17,083,000 17,331,894 16,704,844
ExpensesEmployee future benefits 267,000 113,499 181,907IT operations 917,890 1,063,137 898,581Meeting expenses 128,340 95,019 106,407Membership dues and fees 49,349 69,069 61,701Other supplies and services 147,527 181,237 154,294Printing and postage 713,741 614,859 697,189Professional fees 1,019,081 950,160 1,200,014Rentals and leases 984,901 978,520 1,020,144Salaries and benefits 11,281,700 10,948,880 10,541,073Staff training and development 101,815 81,261 80,754Telecommunications 166,228 187,070 216,189Travel 866,428 667,641 877,619
16,644,000 15,950,352 16,035,872
Excess of revenues over expenses $ 439,000 $ 1,381,542 $ 668,972
Inter-fund transfers
Special Operating Reserve for2010/11 transfers 190,000 190,000 (190,000)
Special Operating Reserve for 2009/10 transfers - - 332,000
Purchase of capital assets (180,000) (303,225) (201,008)Transfer to capital project - 34,983 -Transfer to Technology Advancement
CAMA Reserve (449,000) (459,532) (448,563)Transfer special surplus reserve - (676,522) (161,401)Unrealized post retirement gains
reserve - (167,246) -
(439,000) (1,381,542) (668,972)
Fund balance, beginning of year - -
Fund balance, end of year $ - $ - $ -
-

35
14
Property Valuation Services CorporationStatement of operations and changes in fundbalance - restricted capital asset fund Budget Actual ActualYear ended March 31 2011 2011 2010
ExpensesAmortization of capital assets $ (579,000) $ (593,219) $ (606,784)
Inter-fund transferInter-fund transfer – purchase of
capital assets 180,000 303,225 201,008
Transfer for future capital project - (34,983) -
Fund balance, beginning of year 3,996,157 3,996,157 4,401,933
Fund balance, end of year $ 3,597,157 $ 3,671,180 $ 3,996,157
15
Property Valuation Services CorporationStatement of operations and changes in fund balance -technology advancement CAMA reserve fund ActualYear ended March 31 2011
RevenuesInvestment income $ 38,540Realized gains on investments 10,522Unrealized gain on investments 43,561
92,623
ExpensesInvestment management fees 4,180Bank and custodial charges 1,398
5,578
Excess of revenues over expenses $ 87,045
Inter-fund transfers
Transfer to Technology AdvancementCAMA Reserve 459,532
Fund balance, beginning of year
Fund balance, end of year $ 1,443,140
896,563
STATEMENT OF OPERATIONS AND CHANGES IN FUND BALANCE - RESTRICTED CAPITAL ASSET FUND
STATEMENT OF OPERATIONS AND CHANGES IN FUND BALANCE - TECHNOLOGY ADVANCEMENT CAMA RESERVE FUND


The PVSC dedicates this annual report to Ken Simpson, former Executive Director of the UNSM, for his keen advice and time spent with the PVSC. Ken passed away April 17, 2011 after a lengthy
battle with cancer and will be truly missed.
In giving advice, seek to help, not please, your friend. Solon (638 BC - 559 BC)

Central OfficePark Place II238A Brownlow Avenue, Suite 200Dartmouth, NS B3B 2B4
Regional Office Locations
Bridgewater270 Logan Rd Bridgewater, NS B4V 3J8
Kentville87 Cornwallis St Kentville, NS B4N 2E5
Port Hawkesbury606 Reeves Street., Unit 3 Port Hawkesbury Civic Centre Port Hawkesbury, NS B9A 2R7
Sydney500 George Pl Sydney, NS B1P 1K6
Truro128 Esplanade St Truro, NS B2N 2K3
Yarmouth10 Starrs Rd Yarmouth, NS B5A 2T1
Phone: 1-800-380-7775Fax: 1-888-339-4555
www.pvsc.ca