measuring health care costs of individuals with employer-sponsored health insurance...
TRANSCRIPT

MEASURING HEALTH CARE COSTS OF INDIVIDUALS
WITH EMPLOYER-SPONSORED HEALTH INSURANCE IN THE U.S.: A COMPARISON OF SURVEY AND CLAIMS DATA
Ana Aizcorbe* Eli Liebman* Sarah Pack *
David M. Cutler*** Michael E. Chernew** Allison B. Rosen****
* Bureau of Economic Analysis, 1441 L Street, NW,Washington, DC 20230. ** Department of Health Care Policy, Harvard Medical School. *** Department of Economics, Harvard University and the National Bureau of Economic Research. **** Departments of Internal Medicine and Health Management & Policy, University of Michigan Schools of Medicine and Public Health and the National Bureau of Economic Research.
1

ABSTRACT
As the core nationally representative health expenditure survey in the United States, the
Medical Expenditure Panel Survey (MEPS) is increasingly being used by statistical
agencies to track expenditures by disease. However, while MEPS provides a wealth of
data, its small sample size precludes examination of spending on all but the most
prevalent health conditions. To overcome this issue, statistical agencies have turned to
other public data sources, such as Medicare and Medicaid claims data, when available.
No comparable publicly available data exist for those with employer-sponsored
insurance. While large proprietary claims databases may be an option, the relative
accuracy of their spending estimates is not known. This study compared MEPS and
MarketScan estimates of annual per person health care spending on individuals with
employer-sponsored insurance coverage. Both total spending and the distribution of
annual per person spending differed across the two data sources, with MEPS estimates 10
percent lower on average than estimates from MarketScan. These differences appeared
to be a function of both underrepresentation of high expenditure cases and
underestimation across the remaining distribution of spending.
2

I. INTRODUCTION
The Bureau of Economic Analysis (BEA) estimates that health care expenditures reached
a share of 16 percent of gross domestic product (GDP) in 2006; the BEA is responding to
this trend by working to develop an understanding of what the increased expenditure
share represents. Existing health measures in the National Income and Product Accounts
(NIPAs) and the National Health Expenditure Accounts (NHEA) provide estimates on
medical care that individuals purchase (i.e. doctor’s office visit or purchase of a drug) and
how these purchases are financed (i.e. private insurance, government assistance, or out of
pocket) (Sensenig and Wilcox (2001); Heffler et al. 2009). While these estimates are
useful for some purposes, they do not provide information on the particular disease being
treated with each purchase. Estimates of spending by disease are required for measuring
the returns to treatment, whether or not the expenditure is beneficial, because that benefit
depends on the particular disease one has. For statistical agencies, spending by disease is
required to properly measure real output, inflation and productivity for this important
sector.
In this light, efforts are now focused on measuring health expenditures, and creating
subsequent health care price indexes, by disease (Rosen and Cutler 2007; Rosen and
Cutler 2009). To take on such a task requires data on the health conditions driving
spending. Initial efforts have turned to the national expenditure surveys for these data –
most notably, the Medical Expenditure Panel Survey, or MEPS (Bradley et. al 2009).
3

While MEPS provides a wealth of data, its small sample size precludes examination of
spending on all but the most prevalent health conditions (Machlin et al. 2009; Mackie
2009). To overcome this issue, statistical agencies have turned to other public data
sources when available. For example, the Bureau of Economic Analysis is considering
commercial claims data as a potential data source to measure medical care spending in
the national accounts (Aizcorbe, Retus and Smith 2007).
Despite the availability of quality data for patients covered by public programs, such as
Medicare, there remains a lack of publicly available health care data on the largest
segment of U.S. healthcare users: commercially insured patients and their families, who
account for an estimated 68% of the total population.1 For the commercially-insured
population, multiple large proprietary databases exist; however, it is not clear how
representative these data truly are. Before we can confidently rely on these datasets for
their sufficient sample size for disease-based pricing, we need to understand more
generally how the heath care expenditures in these commercial databases compare with
expenditures in MEPS. While some differences are to be expected, if we understand
these differences, we may be able to adjust for them.
This paper compares the 2005 MEPS expenditure estimates of people with coverage
through employers to the 2005 Thomson Healthcare MarketScan claims. Our objectives
are to better understand how the MarketScan database compares to MEPS and to identify
areas requiring further investigation.
1 Estimate is current as of 2008 and is for people ages 18-64. http://www.cdc.gov/nchs/fastats/hinsure.htm
4

II. STUDY DATA
The data needed for our disease-based spending estimates must have both expenditures
and information on patients’ illnesses. While data are typically collected from providers
at the encounter level, we need data at the patient level, including information on all the
care received from the different types of providers. For commercially-insured patients,
the Medical Expenditure Panel Survey is the only government source for this type of
information. While the MEPS data are nationally representative, the small sample size
precludes examination of health expenditures for all but the most prevalent health
conditions (Machlin et al. 2009; Mackie 2009).
Commercial claims data, on the other hand, provide much larger sample sizes but at the
cost of representativeness (Mackie 2009; Rosen and Cutler 2009). The claims data may
be adjusted with sampling weights to provide nationally-representative estimates.
A. MEDICAL EXPENDITURE PANEL SURVEY (MEPS)
The Medical Expenditure Panel Survey, which is conducted by the Department of Health
and Human Services’ Agency for Healthcare Research and Quality (AHRQ) is a
nationally representative survey of the health care utilization and expenditures of the
civilian non-institutionalized U.S. population. The survey sample is drawn from the prior
year’s National Health Interview Survey (NHIS) sampling frame. The survey uses an
5
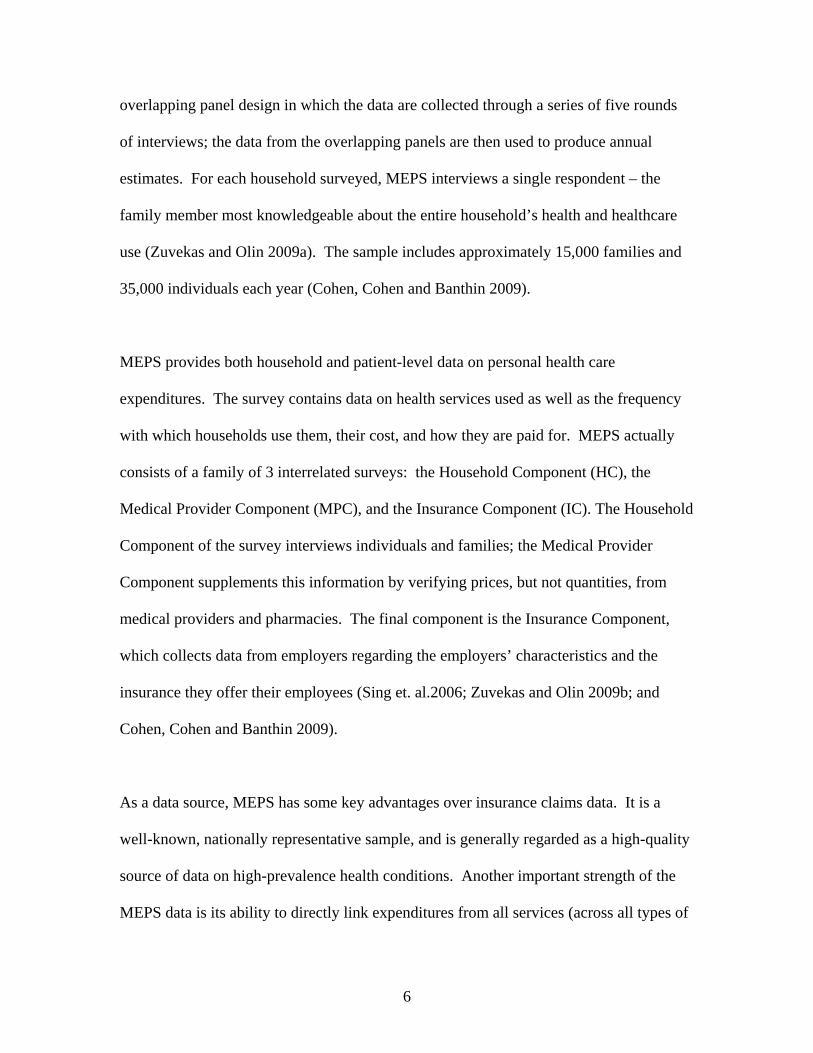
overlapping panel design in which the data are collected through a series of five rounds
of interviews; the data from the overlapping panels are then used to produce annual
estimates. For each household surveyed, MEPS interviews a single respondent – the
family member most knowledgeable about the entire household’s health and healthcare
use (Zuvekas and Olin 2009a). The sample includes approximately 15,000 families and
35,000 individuals each year (Cohen, Cohen and Banthin 2009).
MEPS provides both household and patient-level data on personal health care
expenditures. The survey contains data on health services used as well as the frequency
with which households use them, their cost, and how they are paid for. MEPS actually
consists of a family of 3 interrelated surveys: the Household Component (HC), the
Medical Provider Component (MPC), and the Insurance Component (IC). The Household
Component of the survey interviews individuals and families; the Medical Provider
Component supplements this information by verifying prices, but not quantities, from
medical providers and pharmacies. The final component is the Insurance Component,
which collects data from employers regarding the employers’ characteristics and the
insurance they offer their employees (Sing et. al.2006; Zuvekas and Olin 2009b; and
Cohen, Cohen and Banthin 2009).
As a data source, MEPS has some key advantages over insurance claims data. It is a
well-known, nationally representative sample, and is generally regarded as a high-quality
source of data on high-prevalence health conditions. Another important strength of the
MEPS data is its ability to directly link expenditures from all services (across all types of
6

providers) to patient care events (Mackie 2009; Sing et. al. 2006). Finally, MEPS is the
only data set available to capture the expenditures of the uninsured (Cohen 2009).
B. MARKETSCAN
The Thomson Healthcare MarketScan Research Databases are a nationwide convenience
sample of patients from all providers of care. MarketScan collects data from employers,
health plans, and state-level Medicaid agencies and all claims have been paid and
adjudicated. Each enrollee has a unique identifier and can be identified at the three-digit
zip code level2. This paper uses the Commercial Claims and Encounters Database
portion of the MarketScan Databases, which includes health care utilization and cost
records at the encounter level, with patient identifiers that may be used to sum
expenditures to the patient level.
The Commercial Claims and Encounters Database contains data from employer and
health plan sources concerning medical and drug data for several million employer-
sponsored insurance (ESI)-covered individuals, including employees, their spouses, and
dependents. These enrollees obtain health care under fee-for-service plans, full and
partially capitated plans, preferred and exclusive provider organizations, point of service
plans, indemnity plans, health maintenance organizations, and consumer-directed health
plans (Adamson, Chang and Hansen 2008).
III. METHODS 2 MarketScan User Guide: National Weights (White Paper)
7
We perform a descriptive analysis to evaluate whether MarketScan and MEPS provide
comparable expenditure estimates for individuals with employer-sponsored insurance.
This population makes up 91% of enrollees in private insurance plans.
Our analytic files were constructed from the 2005 MEPS) and data on a similar
population from MarketScan for 2005. We identified individuals with ESI coverage in
the MEPS data as individuals who reported having had coverage at any point in the
calendar year through their current or past job, or through their union. We include all the
enrollees in the MarketScan database, since they all have ESI coverage. For both
datasets, we excluded patients 65 and over, as this population is measured by other
datasets. The final sample sizes included 15,300 MEPS respondents and 24.8 million
individuals in the MarketScan sample, representing 165.05 million individuals with ESI
coverage.
A. ENROLLMENT
For each of the datasets, we created summary measures of enrollment using data from the
enrollment files in the respective databases (the Full Year Consolidated Data File in
MEPS and the Enrollment Summary file in the MarketScan data). We grouped enrollees
into demographic groups for age, gender and region. The age and region variables from
the MEPS are self-reported at various points of the year while those in the MarketScan
data are only from the beginning of the 2005.
8

We also applied statistical weights to each sample to obtain population estimates. The
MEPS data provides sample weights that take into account the complex sampling design
of the survey making adjustments for survey nonresponse rates (Ezzati-Rice, Rohde and
Greenblat 2000). There are similar weights available for the MarketScan data; those
weights are formed by comparing enrollment by age, gender, and region groups in the
MarketScan convenience sample to those in the MEPS. The age groups used in deriving
the MarketScan weights were broader than those used in our study (0-18, 18-44, 45-64).
So, although the weighted datasets should, by construction, give very similar enrollment
counts for gender and region, we do not expect each dataset’s population estimates for
enrollment for very granular age groups to be very similar.
B. EXPENDITURES
We calculated total expenditures by summing expenditures that were reported by
respondents, and then verified with providers (MEPS), or that were associated with
claims submitted by enrollees (MarketScan). We define expenditures as total gross
payments to providers for services (rather than just out-of-pocket spending or the amount
paid by the insurance company). We included service categories that would yield
comparable total spending estimates from the two datasets: care at hospitals (inpatient,
outpatient, and emergency room), office visits, and prescription drugs. Because not all
enrollees had prescription drug coverage, the MarketScan data likely underreports drug
9
spending. Inpatient care is self-reported in MEPS and identified in MarketScan as
hospital care that involved a room and board charge. The inpatient care category is
essentially acute care: the MEPS sampling frame excludes individuals residing in long-
term care and the MarketScan data contain very few claims from long-term facilities.
IV. STUDY FINDINGS
A. ENROLLMENT
Table 1 illustrates that sampling weights can be applied to convenience samples to obtain
better population estimates. The first column of table 1 gives enrollment counts by
demographic groups for the 24.8 million enrollees in the MarketScan sample; the second
column does the same for the 15,300 individuals in the MEPS sample.
The population estimates derived by applying the MarketScan weights are shown in the
third column. The distribution of age groups was similar between the sample and
estimated population (columns 1 and 3), but the gender and region distributions were
quite different. The percent of enrollees that were female is about 50 percent in the
population estimate, or two percent lower than the percent in the sample. The percentage
of enrollees living in the South and West regions was lower in the population estimates (a
combined 56 percent of enrollees) than in the sample (70 percent of the enrollees).
10

The MarketScan estimates for the distribution of enrollees in the population were very
similar to those derived from the MEPS data (columns 3 and 4).
B. EXPENDITURES
Applying weights to these samples did not provide very similar population estimates for
total spending. Estimated total spending according to the MarketScan data was about 10
percent higher than that from the MEPS data ($453 billion and $408 billion,
respectively). As shown in table 2, the differences were not uniform across demographic
groups. For example, the MarketScan estimate of total spending by males was 15 percent
higher than MEPS and 8 percent higher for females. These differences arose from
differences in either the proportion of enrollees that were treated or the average
expenditures for those patients.
The per person spending distributions varied across the two data sources as well. The
MarketScan estimate for mean annual per person spending was higher than that in MEPS:
$2,740 (with a 95% confidence interval of $2735 to $2745) in MarketScan and $2,472
(with a 95% confidence interval of $2314 to $2629) in MEPS. Excluding enrollees with
zero spending magnified the differences in mean spending to about $500 per patient
(from less than $300 for per patient). The distribution of annual per person spending in
each data source shown in Figure 1 demonstrates that these differences existed at most
points in the distribution.
11

Focusing on the right tail of the distribution, in the MEPS data, the maximum annual
spending per patient was around $345,000 dollars while the maximum spending per
patient in the MarketScan data was $4 million dollars. Figure 2 shows the considerable
differences across the two data sources in the distribution of spending in the top 5th
percentile of spenders. The higher spending at the tail end of the distribution in the
MarketScan data came from a relatively small number of patients (20,000, or less than
1% of the total) that had spending higher than the highest spender reported in the MEPS
data: $345,882. When we excluded these high spenders from the claims data, mean per
patient spending remained higher in the MarketScan data than in the MEPS data ($3,465
and $3,045, respectively).
V. DISCUSSION
We compared 2005 MEPS health expenditure estimates for people with employer-
sponsored insurance to the spending estimates from 2005 MarketScan claims data for a
large, convenience sample of individuals with ESI. We found that MEPS underestimated
expenditures in the ESI population, particularly at the high end of the expenditure
distribution. Truncating the MarketScan spending distribution, the differences narrowed
somewhat but MEPS continued to underestimate spending relative to MarketScan,
suggesting that there is also some ‘across the board’ underreporting of service use (and
associated expenditures) in MEPS. This persistent deviation is despite a likely
undercount in the MarketScan data for prescription drugs (since not all enrollees had drug
coverage).
12

Our finding that MEPS underestimates annual expenditures for individuals with ESI is
consistent with past research demonstrating MEPS’ underestimation of spending on other
populations, including non-institutionalized Medicare beneficiaries (Zuvekas and Olin
2009b; Zuvekas and Olin 2009a) and Medicaid enrollees (Mark et. al. 2003). More
broadly, these findings are consistent with MEPS’ known underestimation of NHEA
personal health expenditures (Selden et. al. 2001; Sing et. al. 2006). Further, as in these
past studies, the results of the current study suggest that the underestimation of
expenditures in MEPS is largely a function both of 1) underrepresentation of high
expenditure cases, and 2) underestimation of spending on the remaining covered lives.
The striking underrepresentation of high cost spenders in MEPS is likely due to multiple
factors.3 While the MEPS sampling frame excludes individuals residing in long-term
care facilities, MEPS respondents living in the community can be institutionalized
subsequent to their entry into the MEPS sample. Yet, those MEPS respondents who
leave the community for a health care institution (as well as other institutions) suspend
their medical care utilization and expenditure reporting while institutionalized.
Respondents who eventually return to the community are again eligible for participation
and resume reporting medical utilization and spending (Agency for Healthcare Quality
and Research 2005). Still, a vast gap in these individuals’ spending remains. Hospital
expenditures may also be underestimated because MEPS treats hospitalizations longer
3 A very similar problem arises when forming estimates for wealth, another variable with a highly skewed distribution. Kennickell (2007) showed summary measure of wealth derived from the Survey of Consumer Finances administered by the Federal Reserve Board were significantly improved by their oversampling of wealthy households.
13

than 45 days as an institutional stay, resulting in the exclusion from MEPS of the costs of
these prolonged hospitalizations (Sing 2006). In turn, for high cost individuals who are
included in MEPS, total expenditures may be underestimated due to under-reporting of
spending in the setting of major health changes. For example, the survey may miss some
of the high cost expenditures that occur just before a sampled person dies or is
institutionalized. Finally, there is some evidence that individuals using such services as
renal dialysis clinics, outpatient alcohol treatment, and family planning centers, are not
only underreported by households, but these households are not likely to be surveyed at
all (Selden et al 2001). To the extent these are high cost patients (certainly, dialysis
patients are), this will further reduce the representation of high cost individuals in MEPS.
Even after accounting for the poor capture of very high cost patients, MEPS
underestimates spending relative to MarketScan data.4 These differences could be caused
by several different factors. The accuracy of survey estimates are inseparably linked to
the underlying survey design and response rates; errors may arise from sampling bias,
non-response bias, attrition, and any of a number of other measurement errors (Cohen
2003). Underreporting of health services utilization is also a matter of import. A recent
review of 42 studies identified underreporting as the most common problem affecting the
accuracy of self-reported utilization data (Bhandari and Wagner 2006). While MEPS has
the Medical Provider and Pharmacy Components to verify household reported costs, it
does not use these components to verify the quantity of services utilized; the household
4 A similar problem arises with other expenditure surveys. See Garner, Janini, Passero, Paskiewicz and Vendemia (2006) for a discussion of the issues in the context of the Consumer Expenditure Survey administered by the Bureau of Labor Statistics.
14

reports are the sole source of quantity data, and underreported quantities will miss the
corresponding spending (Zuvekas and Olin 2009b).
MEPS may underestimate spending to a greater degree in some service categories than
others. For example, laboratory studies are one such source of underestimation. MEPS
captures expenditures for laboratory studies billed by physicians offices and outpatient
care centers. However, laboratory services that are billed independently - by the
laboratories themselves – are not captured in MEPS (Selden et. al. 2001). In addition,
due to complex payment structures and third-party payers, household reports are likely to
be inaccurate and surveys of providers and pharmacies do not cover all services,
requiring costs to be imputed for certain services. As with any imputation, this presents
problems of both random and nonrandom error in the expenditure data (Zuvekas and Olin
2009b).
This study had some limitations of note. First, while we attempted to make the MEPS
and MarketScan ESI populations as comparable as possible, some differences may have
remained. MEPS is a relatively small sample, but should be nationally representative
once weights are applied to account for sample design and nonresponse rate. The
enrollee counts in the MarketScan data can also be made representative by applying
weights; however, some notable differences remained in the weighted data. The age
profiles of the MarketScan-based population estimates differed somewhat from those
from the MEPS. Further, a lower proportion of MarketScan enrollees submitted claims
15

than in MEPS (78% versus 81%).5 Our findings beg the question of how best to combine
the power (or sample size) of the MarketScan claims databases with the
representativeness of the MEPS household surveys. If differences between the two data
sources were uniform across the distribution of spending, statistical adjustments could
readily be made to correct the expenditures in both. However, the expenditure
differences are substantially greater at the high end of the spending distribution and more
work will be needed to assess the consistency across the remaining distribution.
VI. CONCLUSION
In conclusion, we found that, for individuals with employer-sponsored insurance, MEPS
underestimates health care expenditures relative to MarketScan. This appears to be a
result of underrepresentation of high cost spenders, as well as a more general
underestimation of spending across the distribution of health care expenditures in MEPS.
With the rapid pace of change in the financing and delivery of health care, the demand
for more clinically-nuanced measures of health care productivity will be critical for
policymaking and planning. To provide these estimates, statistical agencies will
increasingly rely on different sources of national expenditure data. The increased sample
size provided by MarketScan data will allow for more clinically detailed expenditure
estimates, however, the differences between this proprietary claims database and the
comparable population in MEPS suggest the need for additional research focused on
reconciling key differences.
5 Some of this difference might be explained by lack of prescription drug coverage for patients in the MarketScan sample.
16

17

Adamson D.M., Chang S., Hansen L.G. (January 2008) Health Research Data for the
Real World: The MarketScan Databases, Thomson Healthcare. Agency for Healthcare Quality and Research (November 2007) MEPS-HC-097: 2005
Full Year Consolidated File, Center for Financing, Access, and Cost Trends, Rockville, MD.
Aizcorbe A., Nestoriak N. (2007) Changes in Treatment Intensity, Treatment Substitution, and Price Indexes for Health Care Services, National Bureau of Economic Research Productivity Workshop, Cambridge, MA.
Aizcorbe A., Retus B., Smith S. (May 2008) Toward a Health Care Satellite Account. Survey of Current Business 88:24-30.
Bhandari A., Wagner T. (2006) Self-Reported Utilization of Health Care Services: Improving Measurement Accuracey. Medical Care Research and Review 63:217-235.
Bradley R., Cardenas E., Ginsburg D.H., Rozental L., Velez F. (February 2010) Producing disease-based price indexes. Monthly Labor Review:20-28.
Cohen J.W., Cohen S.B., Banthin J.S. (July 2009) The Medical Expenditure Panel Survey: A National Information Resource to Support Healthcare Cost Research and Inform Policy and Practice. Medical Care 47:S44-S50.
Cohen S.B. (2003) Design Strategies and Innovations in the Medical Expenditure Panel Survey. Medical Care 41:III5-III2.
Cohen S.B., Wun L.-M. (2005) A comparison of household and medical provider reported health care utilization and an estimation strategy to correct for response error. Journal of Economic and Social Measurement 30:115-126.
Cutler D.M., Rosen A.B., Vijan S. (2006) Value of Medical Innovation in the United States: 1960-2000. New England Journal of Medicine:920-927.
Evans W.N., Levy H., Simon K.I. (Autumn 2000) Data Watch: Research in Health Economics. The Journal of Economic Perspectives 14:203-216.
Ezzati-Rice T., F. Rohde, Greenblatt J. (March 2008) Sample Design of the Medical Expenditure Panel Survey Household Component, 1998–2007, Agency for Healthcare Research and Quality, Rockville, MD.
Garner T.I., Janini G., Passero W., Paszkiewicz L., Vendemia M. (September 2006) The CE and the PCE: a comparison. Monthly Labor Review:20-46.
Heffler S., Nuccio O., Freeland M. (2009) An Overview of the NHEA With Implications for Cost Analysis Researchers. Medical Care 47:S37-S43.
Kennickell A.B. (2007) The Role of Over-sampling of the Wealthy in the Survey of Consumer Finances, Federal Reserve Board, Washington, DC.
Machlin S., Cohen J., Elixhauser A., Beauregard K., Steiner C. (2009) Sensitivity of Household Reported Medical Conditions in the Medical Expenditure Panel Survey. Medical Care 47:618-625.
Mackie C. (2009) (Ed.)^(Eds.) Strategies for a BEA Satellite Health Care Account: Summary of a Workshop, The National Academies Press, Washington, DC. pp. Pages.
Mark T.L., Levit K.R., Buck J.A., Coffey R.M., Vandivort-Warren R. (August 2007) Mental Health Treatment Expenditure Trends, 1986–2003. Psychiatric Services 58:1041-1048.
18

Rosen A.B., Cutler D.M. (2007) Measuring Medical Care Productivity: A Proposal for the US National Health Account. Survey of Current Business 87:54-88.
Rosen A.B., Cutler D.M. (July 2009) Reconciling National Health Expenditure Accounts and cost-of-illness studies. Medical Care 47:S7-S13.
Rosen A.B., Bondarenko I., Messer K., Raghunathan T., Cutler D.M. Measuring Chronic Disease Prevalence in the U.S. Elderly: A Comparison of Two National Expenditure Surveys.
Selden T.M., Levit K.R., Cohen J.W., Zuvekas S.H., Moeller J.F., McKusick D., Arnett R.H. (Fall 2001) Reconciing Medical Expenditure Estimates from the MEPS and NHA, 1996. Health Care Financing Review 23:161-178.
Sensenig A., Wilcox E. (2001) National Health Accounts/National Income and Product Accounts Reconciliation -- Hospital Care and Physician Services, in: D. M. Cutler and E. R. Berndt (Eds.), Medical Care Output and Productivity, University of Chicago Press for the National Bureau of Economic Research, Chicago. pp. 271-302.
Sing M., Banthin J.S., Seldin T.M., Cowan C.A., Keehan S.P. (Fall 2006) Reconciling Medical Expenditure Estimates from the MEPS and NHEA, 2002. Health Care Financing Review 28:25-40.
Song X., Marder W.D., Houchens R., Conklin J.E., Bradley R. (2009) Can A Disease-Based Price Index Improve the Estimation of the Medical Consumer Price Index?, in: W. E. Diewert, et al. (Eds.), Price Index Concepts and Measurements, The University of Chicago Press for the National Bureau of Economic Research, Chicago.
Stanton M.W. (June 2006) The High Concentration of U.S. Health Care Expenditures, Agency for Healthcare Research and Quality, Rockville, MD.
Zuvekas S.H., Olin G.L. (October 2009a) Validating Household Reports of Health Care Use in the Medical Expenditure Panel Survey. Health Services Research 44:1679-1700.
Zuvekas S.H., Olin G.L. (Spring 2009b) Accuracy of Medicare Expenditures in the Medical Expenditure Panel Survey. Inquiry 46:92-108.
19

Table 1. Distribution of NonElderly Individuals Enrolled in ESI Plans, 2005 (Percent of Total)
Sample
ESI Population Estimates
MarketScan MEPS MarketScan MEPS Number of Enrollees 24.8 mil 15,300 165.1 mil 165.0 mil 0 to 4 years 7.1 6.4 6.9 6.4 5 to 17 years 19.2 20.1 18.6 18.6 18 to 24 years 9.9 8.7 9.4 8.8 25 to 44 years 31.6 33.8 33.5 33.9 45 to 64 years 32.3 30.9 31.5 32.3 Total 100% 100% 100% 100% Male 48.2 49.1 50.1 50.1 Female 51.8 50.9 49.9 49.9 Total 100% 100% 100% 100% Northeast 9.5 17.1 19.9 19.9 Midwest 20.2 21.8 23.8 23.7 South 45.4 36.5 34.0 34.1 West 24.9 24.5 22.3 22.3 Total 100% 100% 100% 100%
20

Table 2. Differences in Spending for NonElderly Individuals Enrolled in ESI Plans, 2005 MarketScan MEPS Ratio (1)/(2) 0 to 4 years $20.8 $14.4 1.44 5 to 17 years $30.3 $33.3 0.91 18 to 24 years $19.8 $17.3 1.14 25 to 44 years $121.6 $122.7 0.99 45 to 64 years $260.4 $220.2 1.18 Total $452.9 $408.0 1.11 Male $251.9 $233.1 1.08 Female $201.0 $174.9 1.15 Total $201.0 $174.9 1.15 Northeast $89.7 $77.4 1.16 Midwest $122.4 $112.2 1.09 South $162.1 $132.5 1.22 West $78.6 $85.9 0.92 Total $452.9 $408.0 1.11 Note: All Estimates are Weighted
21

Table 3. Mean Annual Spending for ESI Enrollees, 2005 MarketScan MEPS Enrollees in Sample 24.8 mil 15,300 Estimated Population 165.1 mil 165.0 mil
Percent with Spending 71.5% 80.8% Mean Annual Spending All Enrollees $2,740 $2,472
(2.4) (80.4) Enrollees with nonzero spending $3,568 $3,045
(3.1) (98.2) Truncated spending* $3,465 $3,045
(2.4) (98.2) Note: Standard errors are in parentheses. * Spending is truncated at highest MEPS expenditure.
22

Figure 1. Distribution of Spending per Patient
$1
$10
$100
$1,000
$10,000
$100,000
$1,000,000
0 10 20 30 40 50 60 70 80 90 100
percentile
dolla
rs
MEPS MarketScanNote: Excludes enrollees with zero spending
23
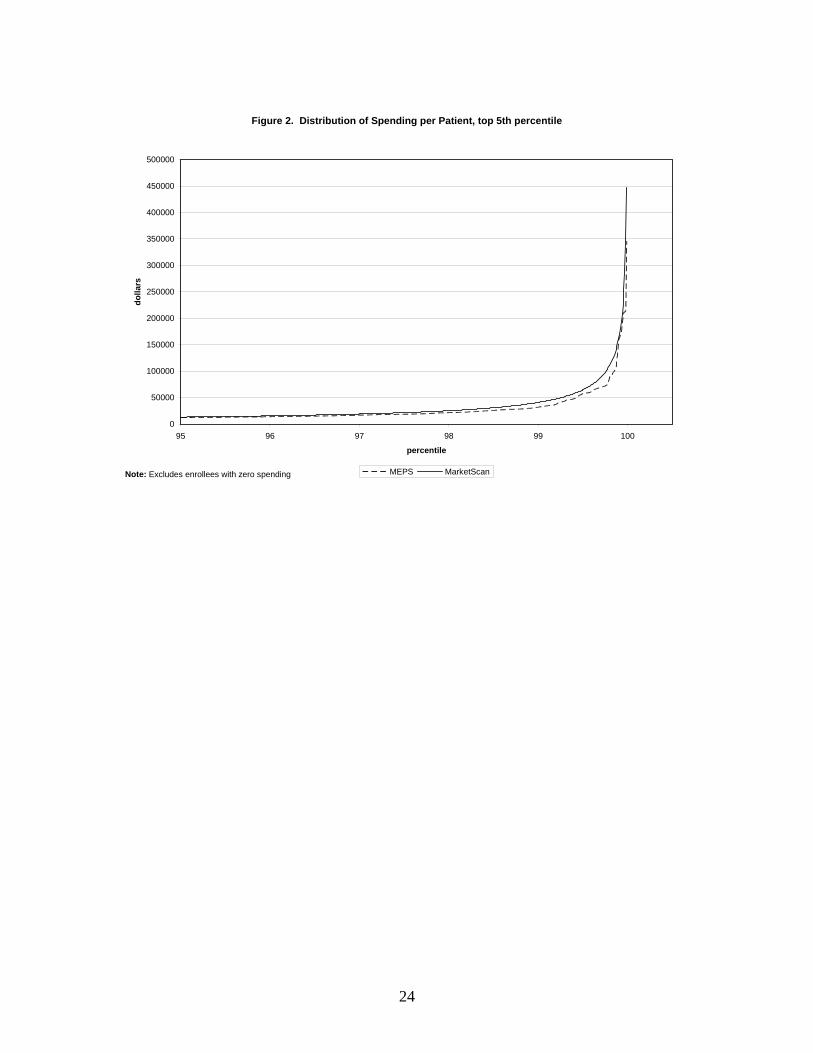
Figure 2. Distribution of Spending per Patient, top 5th percentile
0
50000
100000
150000
200000
250000
300000
350000
400000
450000
500000
95 96 97 98 99 100
percentile
dolla
rs
MEPS MarketScanNote: Excludes enrollees with zero spending
24

25

26