measuring learning quality baice 2016
TRANSCRIPT

Measuring learning quality in Ethiopia, India & Vietnam: from primary to secondary school effectiveness
BAICE Conference, 12th September 2016
Padmini Iyer & Rhiannon MooreYoung Lives, University of Oxford
@yloxford@p_iyer15

YOUNG LIVES OVERVIEW
4 country, dual-cohort study
12,000 children in 4 countries over 15 years
Ethiopia, India (Andhra Pradesh & Telangana), Peru, Vietnam
Two age cohorts in each country:- 2,000 children born in 2001-02- 1,000 children born in 1994-95
From infancy to parenthood
Pro-poor sample: 20 sites in each country selected to reflect country diversity, rural-urban, livelihoods, ethnicity; roughly equal numbers of boys and girls

AGES: 1 5 8 12 15
YOU
NGE
R CO
HORT
Following 2,000 children
OLD
ER C
OHO
RT
Following 1,000 children
AGES: 8 12 15 19 22
Round 1 Round 2 Round 3 Round 4 Round 5 2002 2006 2009 2013 2016
VISUALISING THE HOUSEHOLD DATA
Same age children at different time points
Qualitative nested sample and surveys of children in their schools

SCHOOL EFFECTIVENESS SURVEYS
Primary school effectiveness surveys: implemented in Ethiopia and Vietnam
School effectiveness: ‘Value-added’ of one year of
school Cognitive tests at beginning and
end of school year Background instruments and
psychosocial measures to contextualise learning progress
Secondary school surveys: currently taking place in Ethiopia, India and Vietnam
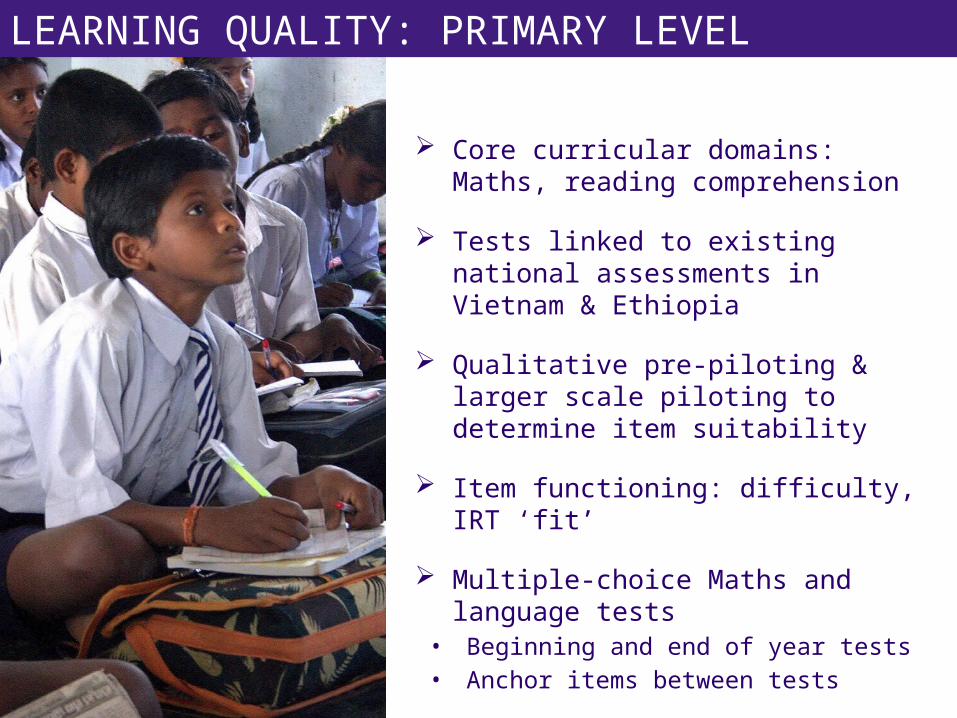
LEARNING QUALITY: PRIMARY LEVEL
Core curricular domains: Maths, reading comprehension
Tests linked to existing national assessments in Vietnam & Ethiopia
Qualitative pre-piloting & larger scale piloting to determine item suitability
Item functioning: difficulty, IRT ‘fit’ Multiple-choice Maths and
language tests• Beginning and end of year tests• Anchor items between tests
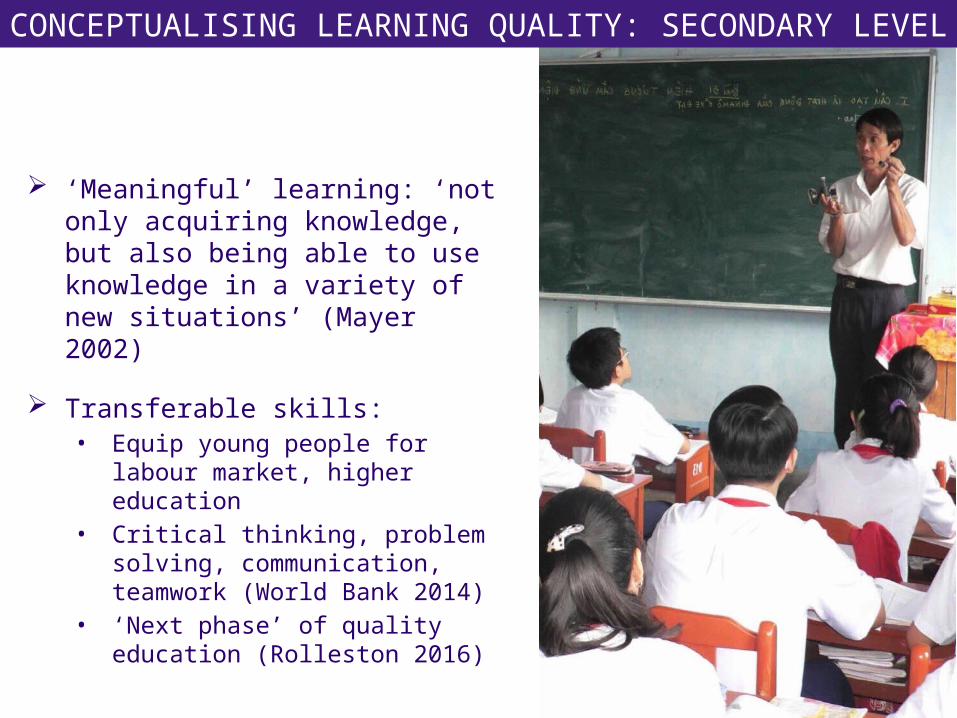
CONCEPTUALISING LEARNING QUALITY: SECONDARY LEVEL
‘Meaningful’ learning: ‘not only acquiring knowledge, but also being able to use knowledge in a variety of new situations’ (Mayer 2002)
Transferable skills: • Equip young people for labour
market, higher education• Critical thinking, problem
solving, communication, teamwork (World Bank 2014)
• ‘Next phase’ of quality education (Rolleston 2016)

MEASURING LEARNING QUALITY: SECONDARY LEVEL
Cognitive domains: • Maths • Functional English• Transferable Skills (problem
solving and critical thinking)
Item selection: • Qualitative pre-pilots• Large-scale pilots to identify ‘floor’
and ‘ceiling’ effects• Classical Test Theory and 2-PL
Item Response Theory (IRT): difficulty, ‘fit’, distractors

COGNITIVE TESTS: MATHS & ENGLISHTests developed following analysis of pilot data using CTT & IRT
Priority for Maths and English tests Finely graded test scores in each country
Balance of domains different to suit each country Ability to compare learning across countries
Common items on a common scale
E.g. English assessment common items, Wave 1

COGNITIVE TESTS: MATHSAssessing Maths knowledge and skills Appropriate content domains for
each country - led by curricula E.g. Ethiopia’s Minimum Learning
Competencies for Grades 5-8
Cross-country cognitive domains TIMSS 2015 framework
• Knowledge• Application• Reasoning
Number sense and basic number competency
Integers and Rational numbers, Powers and Bases
Fractions, Decimals, Ratios and Percentages
Area and Perimeter, Volume and Surface Area
Basic Shapes, Geometry and Visual estimation
Algebra: concepts and applications
Measurement, Data Interpretation, Analysis and Graphs
Problem solving and Applications in daily life

COGNITIVE TESTS: MATHSCross-country Maths items from Wave 1:
0
.5
1
Pro
babi
lity
-4 1.19 4Performance
India Ethiopia Vietnam Grade level: 6
Cognitive domain: Reasoning
Content domain: Area, perimeter, volume, surface area
% correct: Ethiopia 17%, India 33%, Vietnam 46%
Shown here is a triangle with two of its sides as 9 cm and 4 cm and a square of side 5 cm.
Both of the figures have the same perimeter. What would be the length of the third side of the triangle?

Testing ‘functional English’ Context specific application of English skills
What do 15 year old in these three countries need to use English for now and in the future
CEFR grades A1 (basic user) – C2 (proficient user)
COGNITIVE TESTS: ENGLISH
word identification and vocabulary
word meaning and contextual vocabulary
sentence comprehension and construction
reading comprehension
Identifying the meaning of words relating to a range of topics, for example school and employment
For example, questions requiring children to identify the meaning of an unfamiliar word based on the context in which it is used
For example completing a sentence using an appropriate word
Different types of text, for example posters, stories, non-fiction texts

COGNITIVE TESTS: ENGLISHCross-country English items from Wave 1:
0
.5
1
Pro
babi
lity
-4 -.607 4Performance
India Ethiopia Vietnam
Choose the word to complete the sentence correctly for the picture.
The boy is hiding ________ the table.
CEFR Level: A1
Skill: Sentence construction and comprehension
% correct: Ethiopia 62%, India 81%, Vietnam 57%

COGNITIVE TESTS: TRANSFERABLE SKILLS One-off test (end of year)
• Problem solving• Critical thinking
Cross-curricular skills: developed across school subjects, in ‘real-life’ situations
Problem solving: • ‘an individual’s capacity to use
cognitive processes to resolve real, cross-disciplinary situations where the solution path is not immediately obvious’ (OECD 2003)
Critical thinking: • ‘Skills such as inference and
evaluation which are applied to ill-structured problems, for which there are no definitive solutions’ (Kuhn 1991; Thomas & Lok 2015)

COGNITIVE TESTS: TRANSFERABLE SKILLS
Problem-solving: adapted PISA items PISA 2003: analytical problem
solving Adaptation: MCQ, context-relevant Small-scale qualitative piloting:
encouraging in Vietnam & India

COGNITIVE TESTS: TRANSFERABLE SKILLS
Critical thinking: adapted CWRA+ items Developed for use in US with
middle school & high school students (Council for Aid to Education, 2015)
Context-specific adaptation underway (following Schendel & Tolmie 2015)
Pre-pilots and pilots in India and Vietnam over the next few months

PRIMARY SCHOOL SURVEYS: KEY FINDINGS
Ethiopia (James & Rolleston 2015): Pupils make progress in Maths
and reading in Grades 4 and 5 – but learning levels are low
Schools do ‘add value’ High value-added schools:
teachers with high Maths test scores; teachers with university degrees
Rural children, pastoralist children & children from the poorest households make the least progress• Pupils’ backgrounds are still an
important factor in learning quality
PRIMARY SCHOOL SURVEYS: KEY FINDINGS
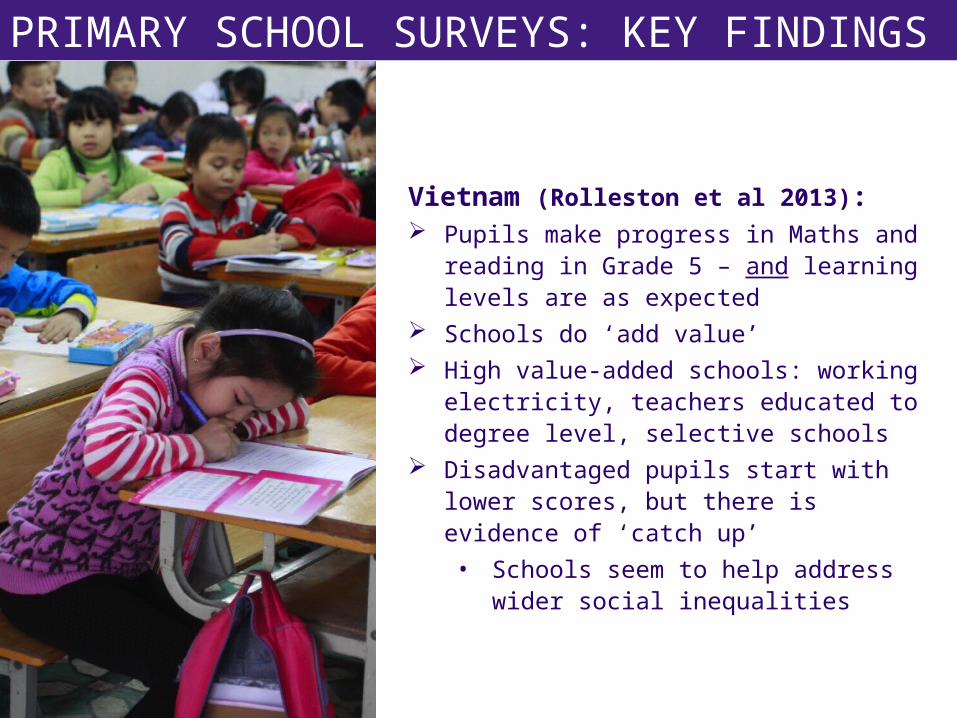
Vietnam (Rolleston et al 2013): Pupils make progress in Maths and
reading in Grade 5 – and learning levels are as expected
Schools do ‘add value’ High value-added schools: working
electricity, teachers educated to degree level, selective schools
Disadvantaged pupils start with lower scores, but there is evidence of ‘catch up’ • Schools seem to help address wider
social inequalities
LOOKING AHEAD: SECONDARY SCHOOL SURVEYS
School effectiveness design will allow us to consider: Progress students make over the course of one academic
year; Factors associated with these levels of progress; The characteristics of schools with high and low ‘value-
added’.
Cognitive tests will support new insights into: ‘Meaningful’ learning: do students have grade-appropriate
knowledge and can they apply it in less familiar contexts? Transferable skills: to what extent do students have
functional English language, problem-solving and critical-thinking skills?
Common items will enable cross-country comparison
Survey will build upon extensive existing Young Lives longitudinal data from household survey and previous school surveys
