measuring lnequality in the middle east 1990-2016: the
TRANSCRIPT

Measuring lnequality in the Middle East 1990-2016: The World’s Most Unequal Region?
Facundo Alvaredo
Lydia Assouad Thomas Piketty
First version: September 2017
This version: April 2018
WID.world WORKING PAPER SERIES N° 2017/15

Measuring lnequality in the Middle East 1990-2016:
The World’s Most Unequal Region? *
Facundo Alvaredo Lydia Assouad Thomas Piketty
First version: September 12th 2017
This version: April 5th 2018
Abstract. In this paper we combine household surveys, national accounts, income
tax data and wealth data in order to estimate income concentration in the Middle East
for the period 1990-2016. According to our benchmark series, the Middle East
appears to be the most unequal region in the world, with a top decile income share
as large as 64%, as compared to 37% in Western Europe, 47% in the USA and 55%
in Brazil. This is due both to enormous inequality between countries (particularly
between oil-rich and population-rich countries) and to large inequality within countries
(which we probably under-estimate, given the limited access to proper fiscal data).
We stress the importance of increasing transparency on income and wealth in the
Middle East, as well as the need to develop mechanisms of regional redistribution
and investment.
Keywords: Inequality, top incomes, Middle East
JEL classification: D3, O53
* Alvaredo: Paris School of Economics, INET at Oxford, Conicet; Assouad: Paris School of
Economics, ENS Paris-Saclay; Piketty: Paris School of Economics. This is a revised and
much extended version of a paper that has previously circulated under the title “Measuring
Top Incomes and Inequality in the Middle East” (Alvaredo and Piketty, 2015). We thank
Suresh Naidu, Glen Weyl and seminar participants at the Applied Lunch Seminar at the Paris
School of Economics and the First WID.world Conference (Paris, December 15-16 2017).
We also thank Ayca Akarcay Gurbuz, Sezgin Polat and Nadia Belhaj Hassine for sharing
with us some of the databases used in this paper. We acknowledge financial support, at
different stages, from the ESRC/DFID (grant ES/I033114/1), the European Research Council
(ERC Grant 340831), and the Economic Research Forum.
2
1. Introduction
2. Literature Review: Inequality Measurement in Middle East countries
3. Data Sources, Concepts and Methodology
4. Main Results: Extreme Concentration of Income in the Middle East
5. Concluding remarks
References

3
1. Introduction
In recent decades, the Middle East has been the scene of dramatic political events:
wars, invasions, revolutions and various attempts to redraw the regional political
map. It is natural to ask whether this high level of political instability is related to the
specific structure and level of socio-economic inequality in this region. Unfortunately,
available evidence on inequality in the Middle East and how it compares to other
world regions is relatively scarce.
In this paper, we attempt to combine available data sources (national accounts,
household surveys, income tax data, and wealth rankings) in a systematic manner in
order to provide novel estimates of the distribution of income in the Middle East
between 1990 and 2016. According to our benchmark series, the Middle East
appears to be the most unequal region in the world, with a top decile income share
as high as 64%, as compared to 37% in Western Europe, 47% in the USA and 55%
in Brazil. This is due both to enormous inequality between countries (particularly
between oil-rich and population-rich countries), and to very large inequality within
countries (which we probably under-estimate, given the limited access to fiscal data).
These estimates are based on two methodological innovations. To our knowledge,
our paper is the first attempt to combine Middle East household surveys with income
tax data. Namely, we use the findings from Lebanese income tax micro-files recently
exploited by Assouad (2017) and apply generalized Pareto interpolation techniques
(Blanchet, Fournier and Piketty, 2017). This leads us to significantly correct upward
standard survey-based, within-country inequality estimates. This upward correction
should still be viewed as a lower bound, but more plausible than usual measures
based solely upon self-reported data. Next, our paper is also the first attempt to
combine within-country inequality measures in order to estimate the distribution of
income for the entire Middle East region. Both innovations play an important role in
accounting for our high inequality findings (they both have impacts that are
comparable in magnitude). We stress that we still face important limitations and
uncertainties regarding the measurement of income distribution in the region, and
that increased transparency on income and wealth is highly needed. However our

4
main conclusion – namely the fact that the Middle East is one of the most unequal
regions in the world, if not the most unequal region – appears to be robust.
Of course, we do not pretend that this high inequality level is the only explanation for
the regional political instability. Other factors – religious, historical, cultural and
political – certainly play an important role as well. But we believe that inequality can
be part of the explanation, or at least that it belongs to a set of background factors
that contribute to generate political upheavals. The 1990 invasion of Kuwait by Iraq –
two countries with vastly different per capita income and wealth – is a clear and
extreme example. More generally, one can plausibly argue that perceptions about
inequality and the fairness or unfairness of the distribution of income are determined
not only by within-country inequality but also by inequality at the regional level, and
even sometime at the global level.
The final outcome of the aggregation of distributions is less straightforward than it
may seem, and it requires empirical examination. To a large extent, this paper can be
viewed as an exercise of aggregation. We show how changing the geographical level
of analysis affects the measurement of inequality. In the case of the Middle East, the
concept of nation-state may not be the most meaningful lens through which we can
analyze the concentration of income. The total population of the region (about 410
million in 2016) is comparable to Western Europe (420 million) or the United States
(320 million), and is characterized by a relatively large degree of cultural, linguistic
and religious homogeneity (at least as compared to these other world regions).
Even more strikingly, when we integrate Eastern European countries to Western
Europe, thereby looking at a total regional population over 570 million, we find that
total inequality rises only moderately. For instance, the top 10% income share rises
from 37% in Western Europe to 39% for total Europe (vs. 64% in the Middle East). In
other words, putting together Bulgaria and Germany does raise inequality levels, as
expected, but it does so in a relatively moderate manner, at least as compared to the
enormous inequality levels observed in the Middle East. How much is due to the
various institutional features of Europe (such as free mobility or regional development
funds), and the lack thereof in the Middle East, is an interesting issue, which falls well
beyond the scope of the present paper.

5
In any case, we feel that such regional comparisons are legitimate and to some
extent informative – at least as much as the usual inequality comparisons between
nation-states. Both types of comparisons seem to capture complementary and
valuable dimensions of individual perceptions about inequality.
This paper is part of a broader project, namely the World Inequality Database
(WID.world), that attempts to produce annual distributional statistics – and possibly
micro data on income and wealth distributions – that are comparable across
countries (Alvaredo et al. 2016). For this, we follow a common methodology that
involves the combination of national accounts, surveys, and fiscal data in a
consistent manner to produce distributional national accounts. The methodology was
already applied for the United States (Saez and Zucman, 2016; Piketty, Saez and
Zucman, 2016), France (Garbinti, Goupille-Lebret and Piketty, 2016, 2017), China
(Piketty, Yang and Zucman, 2017) and Russia (Novokmet, Piketty and Zucman,
2017). Although there are similarities across countries regarding methods, lessons
can be drawn from country-specific cases to help produce new databases for future
works, in a context of scarcity of data.
The rest of this paper is organized as follows. In section 2, we relate our work to the
existing literature on income inequality in the Middle East and at the global level.
Section 3 describes our main data sources, concepts, and methodology. In Section
4, we present our main results on the evolution of income inequality in the Middle
East, and we also compare our series to other countries. Section 5 provides
concluding comments. This paper is supplemented by an extensive online appendix
that includes all the raw data and codes, and also presents additional results and
robustness checks.
Section 2. Relation to literature on Middle East and global inequality
The study of the evolution of income and consumption inequality using household
surveys is a well-established tradition in a number of countries in the Middle East
(see e.g. Wahba (1996, 2009) and Said (2007) in the case of Egypt). In addition,
following the Arab Spring movement, there has been renewed interest in inequality

6
measurement in Middle East countries. A number of papers have argued that income
inequalities within these countries do not seem to be particularly high by international
standards, and therefore that that the source of dissatisfaction might lie elsewhere
(see in particular Halsny and Verne (2013); see also World Bank (2012) and Bibi and
Nabli, 2010). This somewhat surprising fact, coined “the Enigma of Inequality”
(UNDP, 2012) or the “Arab Inequality Puzzle” (World Bank, 2015), has produced a
rising literature on inequality in the region (see Ncube and Anyanwu, 2012; Hassine,
2015, Hlasny and Verme, 2015, Roy van der Weide et al. 2016, or Assaad et al.
2017).
As noted in the introduction, our contribution to this literature is twofold. We combine
household surveys with income tax data in order to correct upwards the top of
survey-based income distributions, and we aggregate within-country distributional
data in order to estimate the distribution of income at the level of the entire Middle
East. This leads us to relatively novel (though not entirely unexpected) conclusions
regarding extreme inequality in the Middle East.
We stress that these results should be viewed as exploratory and suffer from many
limitations. In particular, despite our best efforts, our ability to properly measure
income inequality within individual countries is severely limited by the low quality of
available data sources. The problem is particularly acute in the Gulf countries, for
which there exist very few studies on income distribution (see e.g. El-Katiri, Fattouh
and Segal (2011) on Kuwait), and where the low standard survey-based Gini
coefficients seem to contradict important aspects of their political economy, namely
the growing share of migrant population, a large majority of which is composed by
low-paid workers living in difficult conditions (Human Right Watch, 2013). The flow of
migrant workers in Gulf countries has grown substantially over the period. This sharp
increase contributed to make nationals willing to defend their numerous privileges,
beginning by restraining naturalization.1 But the most striking manifestation of the
restrictions imposed to the migrant population is probably the highly exploitative 1 “Oil wealth, and the practice of dividing some of this among citizens, mean there are very strong economic incentives to limit citizenship to a small pool of people. Gulf nationals typically do not pay income tax, have free health care and education provided by the state, receive subsidies for electricity and fuel, and often receive other benefits (such as land grants). Traditionally they have also expected the state to provide a job – an idea enshrined in some Gulf constitutions and - housing.” (Chatham House, 2015, p. 17).

7
“sponsorship system” of labor or “kafala system” (Human Right Watch, 2013,
Kapiszewski, 2006), resulting in the creation of an extremely polarized social
structure with two different groups in the legal, social and economic dimensions
(Chatham House, 2015). As far as we know, little research has been conducted to
study the two populations in order to measure income inequality in Gulf societies (see
Naidu et al., 2016 on the UAE, using new administrative wage data for foreigners,
and Weyl, 2016). In the context of this paper, we attempt to put together all existing
statistical information that has been published regarding the inequality of income
between nationals and foreign workers in Gulf countries (see section 4 below).
Unfortunately, we still face important limitations in our empirical and quantitative
understanding of these issues.
Finally, our paper is closely related to the literature on the world distribution of income
(Milanovic, 2002; Bourguignon and Morrisson, 2002; Lakner and Milanovic, 2013). In
particular, Lakner and Milanovic (2013) attempts to correct upwards the top income
share estimates constructed on the basis of national household surveys to study how
much this impacts the measurement of the world distribution of income. Our
approach is similar, except that we focus on regional inequality (i.e. inequality
measured at the level of a broad region such as the Middle East) rather than global
inequality. Of course both approaches are highly complementary: before we can
perform a meaningful aggregation at the world level, it is important to ensure that we
are able to do it at a broad regional level.
Section 3. Data sources, Concepts and Methodology
This paper relies on four types of data sources: household surveys, income tax data,
wealth rankings and national accounts. We define the Middle East as the region
going from Egypt to Iran, and from Turkey to the Gulf countries. We start by putting
together a macroeconomic database including annual series on population and
national income between 1990 and 2016. Basic descriptive statistics for 2016 are
reported in Table 1. The region is characterized by very large between-country
inequality (we further discuss this issue in section 4). All details about the data
sources and methods used to construct homogenous national accounts are
described in the online appendix.
8
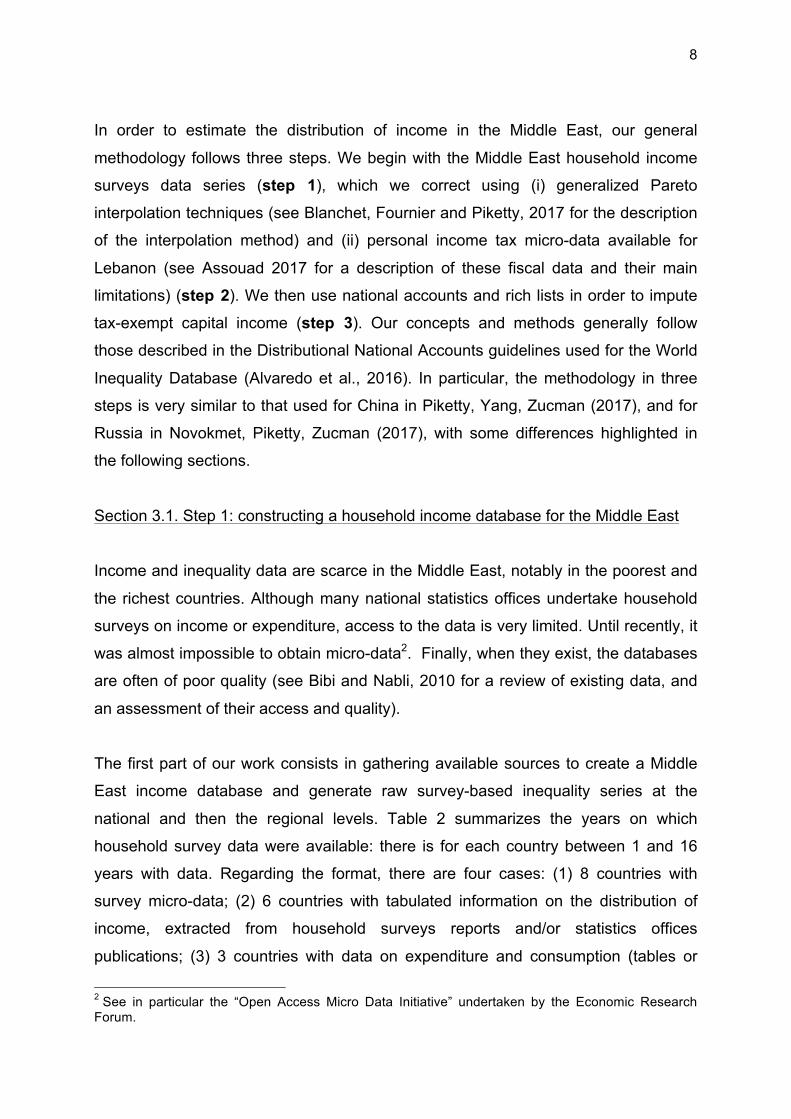
In order to estimate the distribution of income in the Middle East, our general
methodology follows three steps. We begin with the Middle East household income
surveys data series (step 1), which we correct using (i) generalized Pareto
interpolation techniques (see Blanchet, Fournier and Piketty, 2017 for the description
of the interpolation method) and (ii) personal income tax micro-data available for
Lebanon (see Assouad 2017 for a description of these fiscal data and their main
limitations) (step 2). We then use national accounts and rich lists in order to impute
tax-exempt capital income (step 3). Our concepts and methods generally follow
those described in the Distributional National Accounts guidelines used for the World
Inequality Database (Alvaredo et al., 2016). In particular, the methodology in three
steps is very similar to that used for China in Piketty, Yang, Zucman (2017), and for
Russia in Novokmet, Piketty, Zucman (2017), with some differences highlighted in
the following sections.
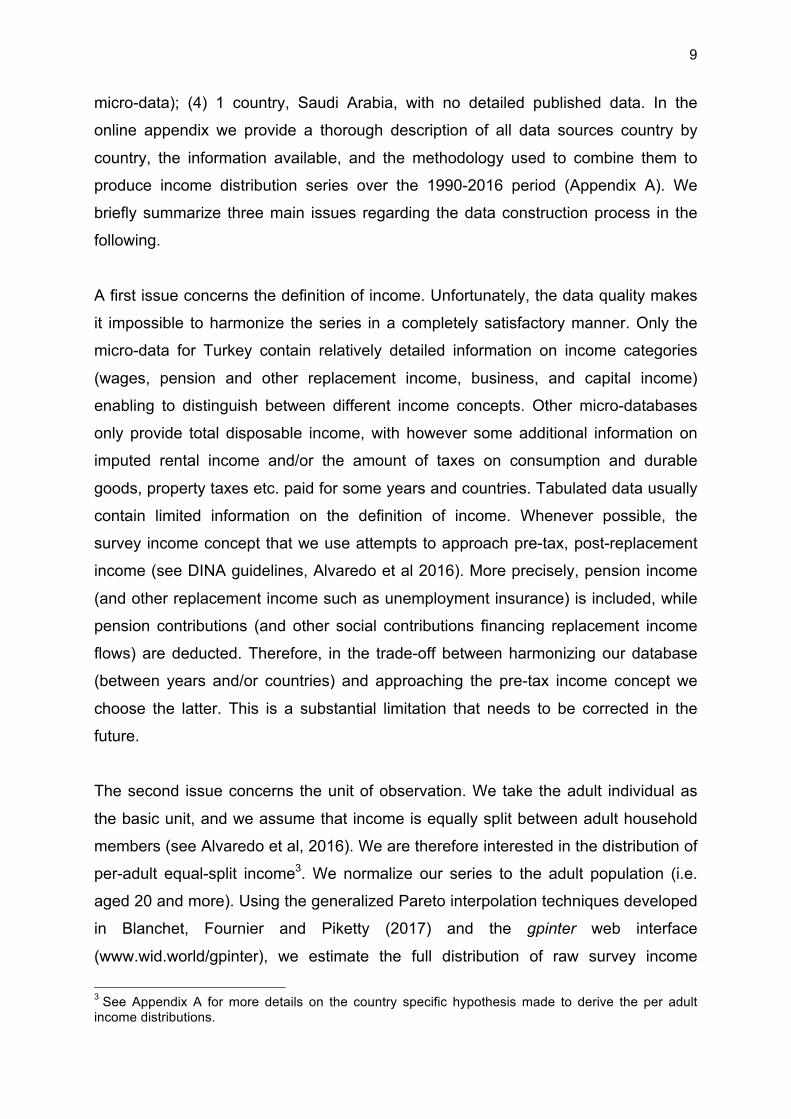
Section 3.1. Step 1: constructing a household income database for the Middle East
Income and inequality data are scarce in the Middle East, notably in the poorest and
the richest countries. Although many national statistics offices undertake household
surveys on income or expenditure, access to the data is very limited. Until recently, it
was almost impossible to obtain micro-data2. Finally, when they exist, the databases
are often of poor quality (see Bibi and Nabli, 2010 for a review of existing data, and
an assessment of their access and quality).
The first part of our work consists in gathering available sources to create a Middle
East income database and generate raw survey-based inequality series at the
national and then the regional levels. Table 2 summarizes the years on which
household survey data were available: there is for each country between 1 and 16
years with data. Regarding the format, there are four cases: (1) 8 countries with
survey micro-data; (2) 6 countries with tabulated information on the distribution of
income, extracted from household surveys reports and/or statistics offices
publications; (3) 3 countries with data on expenditure and consumption (tables or
2 See in particular the “Open Access Micro Data Initiative” undertaken by the Economic Research Forum.
9
micro-data); (4) 1 country, Saudi Arabia, with no detailed published data. In the
online appendix we provide a thorough description of all data sources country by
country, the information available, and the methodology used to combine them to
produce income distribution series over the 1990-2016 period (Appendix A). We
briefly summarize three main issues regarding the data construction process in the
following.
A first issue concerns the definition of income. Unfortunately, the data quality makes
it impossible to harmonize the series in a completely satisfactory manner. Only the
micro-data for Turkey contain relatively detailed information on income categories
(wages, pension and other replacement income, business, and capital income)
enabling to distinguish between different income concepts. Other micro-databases
only provide total disposable income, with however some additional information on
imputed rental income and/or the amount of taxes on consumption and durable
goods, property taxes etc. paid for some years and countries. Tabulated data usually
contain limited information on the definition of income. Whenever possible, the
survey income concept that we use attempts to approach pre-tax, post-replacement
income (see DINA guidelines, Alvaredo et al 2016). More precisely, pension income
(and other replacement income such as unemployment insurance) is included, while
pension contributions (and other social contributions financing replacement income
flows) are deducted. Therefore, in the trade-off between harmonizing our database
(between years and/or countries) and approaching the pre-tax income concept we
choose the latter. This is a substantial limitation that needs to be corrected in the
future.
The second issue concerns the unit of observation. We take the adult individual as
the basic unit, and we assume that income is equally split between adult household
members (see Alvaredo et al, 2016). We are therefore interested in the distribution of
per-adult equal-split income3. We normalize our series to the adult population (i.e.
aged 20 and more). Using the generalized Pareto interpolation techniques developed
in Blanchet, Fournier and Piketty (2017) and the gpinter web interface
(www.wid.world/gpinter), we estimate the full distribution of raw survey income
3 See Appendix A for more details on the country specific hypothesis made to derive the per adult income distributions.

10
separately for all countries and for the region as a whole 4 . We express the
distributions in terms of generalized percentiles (or g-percentiles)5.
The third issue is related to the years without data. As one can see from Table 2,
household surveys are available only for a limited number of years. To infer the
distribution of years with no data, we use the household surveys distribution of the
closest available years6. For a number of countries, we only have one household
survey, which means that by construction we are forced to use the same inequality
level over the entire 1990-2016 period. As we repeatedly stress throughout the
paper, this major limitation implies that we cannot draw robust conclusions about the
evolution of income inequality: the main objective of this paper is to estimate the
overall level of income inequality in the Middle East, not the evolution.
Additionally, in order to ensure maximal comparability across countries and time, we
choose to anchor all country-year-level income distributions to the relevant per adult
national income. That is, for every country-year pair, we proportionally upgrade all
income levels for all percentiles so that per adult average income coincides always
with per adult average national income observed in our macroeconomic database
(therefore keeping the income distribution and shares constant). By doing so, we
certainly do not pretend that available national income series are perfectly
comparable. We simply assume that these are the most comparable income series
we have: national accounts at least attempt to apply the same definition of national
income in all countries (as defined by the SNA Guidelines developed under the
auspices of the UN and other international organizations), which is not the case with
survey income. This issue is further discussed in the DINA Guidelines (Alvaredo et al,
2016).
We also report on Table 2 the ratios between total survey income and national
income. For most Middle East countries, ratios are 40%-50%, which is fairly small, 4 We use the merging option to derive the national distribution of Iran (merging rural and urban distribution) and of the Gulf countries (merging the foreigners and non-foreigners distribution). 5 There are 127 g-percentiles: 99 for the bottom 99 percentiles, 9 for the bottom 9 tenth-of-percentiles of the top percentile, 9 for the bottom 9 one-hundredth-of-percentiles of the top tenth-of- percentile, and 10 for the 10 one-thousandth-of-percentile of the top one-hundredth- of-percentile. 6 We also constructed estimates based on the assumption of linear inequality trends between survey years. This made very little difference in both the level and trend obtained for total Middle East inequality, so in our benchmark series we simply use the closest available year for country-level data.

11
but not unheard of by international standards. Note however that the ratios are
substantially smaller in Gulf countries – as low as 20%-30%. That is, compared to
other countries, a very large fraction of national income of Gulf countries is missing
from self-reported household survey income. To the extent that nationals benefit from
the excluded income components (which typically refer to the undistributed profits of
oil corporations and the capital income from sovereign wealth funds) more than
foreigners, this implies that we are likely to severely underestimate income inequality
in Gulf countries. To correct for this, we proceed as follows: we impute a fraction of
the missing income (the gap between national income and total survey income) to
nationals only, so that the ratio between survey income (augmented by the
imputation) and national income reaches 30, 50, 70, or 100%. We take as
benchmark survey distributions for Gulf countries the series where this ratio equals
50%, except in Qatar where we take the series where the ratio is 30%.7
Section 3.2. Step 2: Fiscal data correction
Self-reported survey data is well-known to underestimate incomes at the top (say,
within the top decile, and particularly within the top percentile). Generally speaking,
the strategy followed in the World Inequality Database (WID.world) in order to correct
for this is to use income tax micro-files (together with national accounts and wealth
data in order to cover tax-exempt income). In case income tax data do not exist or is
limited in scope (e.g. in case one can only access income tax tabulations rather than
micro-files), the DINA Guidelines recommend to supplement existing data with
generalized Pareto interpolation techniques (see Alvaredo et al., 2016, and Blanchet,
Fournier and Piketty 2017).
In the case of Middle East countries, income tax data are unfortunately extremely
limited. Lebanon is the only country for which we were able to access income tax
micro-files. These data are relatively detailed, consisting on yearly quasi-exhaustive
micro-files over the 2005-2014 period (see Assouad 2017 for a detailed analysis of
7 In Qatar, given that foreigners represent a large share of the total population (90%), and that the ratio between survey and national income is particularly low (22%), top income shares are very sensitive to the operation that reattributes part of the missing income to the nationals only (see Figure 9a –Qatar). We therefore only attribute a share of missing income so that the ratio survey/national income equals 30% and not 50% as in other countries.

12
this data source). However, for other countries, despite our best efforts, we do not
have any income tax data (not even income tax tabulations).
This is unfortunate, because household surveys in the Middle East appear to
underestimate top incomes at least as much as in the rest of the world, and possibly
more. In particular, survey-based inverted Pareto coefficient b(p) are implausibly low
for top incomes, generally around 1.5-1.7 (and sometime even less than 1.5) at the
level of the top 10% (i.e. p=0.9).8 In contrast, in all countries in the world with reliable
income tax data, inverted Pareto coefficients b(p) are typically between 2 and 3 (or
even more in high inequality countries), and tend to follow a U-shaped generalized
Pareto curve, with a rising part within the top decile (see Blanchet, Fournier and
Piketty, 2017). The Lebanese income tax micro-files confirm this general finding: top
income levels reported in tax data are much higher than in household surveys (top
1% incomes are typically 2-3 times higher, with large variations across income levels
and over years), and the tax-corrected inverted Pareto coefficients within the top
decile are around 3 or higher (see Assouad 2017).9 The reasons why household
surveys almost systematically lead to excessively low b coefficients typically come
from the fact that surveys suffer from various under-reporting, truncations and top
coding problems (with top coding, or self-censored top incomes, b naturally becomes
very close to 1 at the very top).10 Naturally, surveys have other merits, and include
detailed socio-demographic information that one could never obtain using tax data.
However, for the study of the top decile - and also for the study of the total inequality
level of a country, given the importance of the income share going to the top decile –
it is necessary to supplement surveys with other sources and methods.
In order to construct our benchmark series, we choose to adopt correction factors
that are based upon the income tax data from Lebanon. More precisely, the income
tax micro-files enable us to compute correction coefficients for thresholds and upper
8 See on-line technical appendix, Table A3. 9 See also section 4 and Table 3 below for corrected b(p) coefficients. 10 Hasly and Verme (2013, Figure 10, p.28) use household income surveys for Egypt between 1999 and 2010 and argue that top-decile inverted Pareto coefficients around 1.5-1.7 are not unusual by international standards. However this conclusion comes entirely from the fact that they compare with coefficients coming from household surveys (which are artificially low).

13
average income by g-percentiles.11 We apply no correction below p=0.8, i.e. we
assume correction factors exactly equal to 1 below the top 20%, which is
approximately the case in the Lebanese data (see Assouad, 2017 on the choice of
profiles). These coefficients do not depend on the Lebanese income level, but only
on the percentile. We apply the average correction coefficient per percentile over the
2005-2014 period in Lebanon to all other countries. We have also computed a large
number of variant series based upon alternative assumptions (see on-line
appendix).12 The impact on the overall inequality level in the Middle East and the
comparison with other world regions is relatively limited (as a first approximation). In
order to derive more precise estimates, we would need to have access to income tax
data (at least in the form of income tax tabulations, and ideally in the form of micro
files) for all Middle East countries.
Section 3.3. Step 3: Missing capital income and wealth correction
Finally, we correct our fiscal income series to take into account non-reported and tax-
exempt capital income. Important components of capital income are missing from
fiscal income data, even in the absence of any tax evasion (see the discussion in
Alvaredo et al 2016 and Piketty, Yang and Zucman, 2017). They typically include
corporate retained earnings and imputed housing rental income. We assume these
“non-fiscal” income ynf is equal to 10% of national income in each country, a
reasonable figure given our findings in other countries. For Lebanon however, we
estimate it to be 20% of national income, by using available information from national
accounts and government reports on tax revenues, published by the Ministry of
Finance (see Assouad 2017). Then, to estimate the distribution of personal income
yp = yf + ynf, i.e. the sum of fiscal and non-fiscal income, we need to make an
assumption about the distribution of ynf and the correlation between yf and ynf. We
11 By definition, the coefficients are the ratio of thresholds (resp. averages) between the raw survey and the corrected distributions. 12 In particular, to derive the raw survey distribution of Lebanon, one needs to assume an inverted Pareto coefficient at the top due to the format of available tabulations. This affects the correction coefficients and the levels of inequality in all countries. For other variants on the definition of income and profile of correction, see Assouad, 2017. We have also computed variant series based on the assumption that inverted Pareto coefficients b(p) take average WID.world values (typically within the interval [2,3]) for Middle East countries other than Lebanon. This leads to results for total Middle East inequality that are close in magnitude to those presented here (see on-line technical appendix, Tables A3-A4 for inverted Pareto coefficients for the various countries and years, before and after our benchmark fiscal corrections).

14
assume that ynf follows the same distribution as wealth, which we estimate by
applying generalized Pareto interpolation techniques to wealth rankings (see below).
As for the correlation structure between yf and ynf, on the basis of estimates obtained
in countries with adequate micro-files, we use the family of Gumbel copulas, with
Gumbel parameter θ = 3 (see Piketty, Yang and Zucman, 2017, and Novokmet,
Piketty and Zucman, 2017). We should stress that this wealth-based correction has a
relatively limited impact on our final income inequality estimates (and in particular a
much smaller impact than the fiscal data correction), so that the uncertainty that we
are facing here is unimportant for our main findings (see section 4, Figures 10a-10c).
In order to estimate wealth inequality, we proceed as follows. Most observers tend to
assume – and probably rightly so – that the level of wealth inequality in the region is
high by both international and historical standards. However, there is substantial
uncertainty about the exact level of wealth concentration, due to the almost complete
lack of proper statistical evidence. Here we follow a simple methodology similar to
that applied in Novokmet, Piketty and Zucman (2017) and use rich lists to produce
estimates of top wealth shares for Middle Eastern countries in 2016, which we then
use to allocate tax-exempt capital income.
We use billionaire’s lists published by Forbes and the magazine Arabian Business.
Generally speaking, we find that the share of billionaires’ wealth in national income is
indeed extremely high by international standards. For Saudi Arabia, Qatar, Bahrain
and Lebanon, it is greater than 20% on average, while total billionaire wealth
represents between 5% and 15% of national income in the United States, Germany
and France over 2005-2015. Wealth concentration is particularly high in Lebanon,
where the average income and the average wealth are substantially below Western
levels (Assouad, 2017). We stress however that billionaires’ lists are particularly
fragile and volatile in the Middle East. There are relatively few billionaires and their
number varies substantially from year to year (many years have no data). For
instance, Forbes reports one or two billionaires in Bahrain and Qatar and only in
three years between 1990-2016. However, for some years, billionaires’ wealth can
represent a very high share of national income. Given that the figures are extremely
volatile, using this data source to identify a trend in wealth concentration is
impossible. Several reasons can explain why wealth rankings might be particularly

15
incomplete in the region. First, large amounts of wealth may be missing due to a
pervasive use of tax havens and offshore bank accounts. The data leaked from
HSBC Switzerland and Mossack Fonseca (the so-called “Swiss leaks” and “Panama
Papers”) show that Middle East countries are among the top clients of those offshore
financial institutions. 13 Evidence indeed indicates that hidden wealth is high by
international standards (Zucman, 2015). Andersen et al. (2016) also show that
“petroleum-rich autocracies” in the Arab world tend to hide larger amounts of wealth
and that they would do it more easily than other countries with oil resources. In
addition, rich lists do not include wealth owned by ruling families and heads of states.
This may lead to a substantial downward bias in the region, where the line between
public and private property is often blurred. We attempt to include figures on state
leaders’ wealth when we could find some, but reliable information is very scarce.14
For all these reasons, we did not attempt to derive annual wealth distribution series.
Rather, we compute one average estimate for wealth inequality for each country,
applying the same general method as in Novokmet, Piketty and Zucman (2017) for
Russia. For each country, we compute average billionaire wealth relative to national
income over all available years over 1990-2016. We then compute average
standardized distributions of wealth for the US, France and China from WID.world
series. 15 We note that variations across countries and over time in these
standardized wealth distributions mostly happen above p0=0.99, i.e. below p0=0.99
the ratios of the different percentile thresholds to average wealth are relatively stable
over time and across countries, at least as a first approximation with most of the
variation taking place within the top 1%. Therefore we choose to use the same
normalized distribution for Middle East countries below p0=0.99 as the average US-
France-China normalized distribution. To estimate the average wealth, we compute
an annual average wealth-income ratio over all countries available in WID.world, and
we apply this average to each country average income. The difficult question is to
know how to link the distribution from p0=0.99 to billionaire level, and also to make an 13 In terms of amount of wealth placed in their offshore accounts. See https://projects.icij.org/swiss-leaks/countries/rankings#money. 14 We gathered some figures from various sources (newspapers articles, Forbes’ “Royals” and “Dictators” lists). We could not cover all ruling families and, when we find information, it is only available for some years. For an example, figures on the Assad family’s wealth are only available for two years. We did not find figures on billionaires in Jordan. 15 That is, we divide all thresholds and bracket averages for all 127 generalized percentiles by average wealth, and we compute the arithmetic average for the three countries.

16
assumption about the average number n of adults per billionaire family (sometime
Forbes includes very large family groups in the same billionaire family; sometime it is
just one individual or one married couple). We first re-estimate the 127 generalized
percentile within the top 1% of the normalized distribution in order to reach
billionaires’ level. In our benchmark series we assume n=5 and a linear correction
factor f(p) from p0=0.99 up to billionaire level, as this assumption seems to work
relatively well for the US, France and China. 16 This method gives a first
approximation of the concentration of wealth in the region. In the appendix we
present a number of alternative series based upon explicit assumptions and
generalized Pareto interpolation techniques. We should stress again that even
though the uncertainty about the exact magnitude of wealth concentration is high, it
has relatively limited impact on our final income inequality estimates (see section 4
and Figures 10a-10c below).
Section 4. Main Results: Extreme Concentration of Income in the Middle East
We now present our main results on the level and evolution of income inequality in
the Middle East. We start by describing the general evolution of average incomes
and between-country inequality in the Middle East region over the 1990-2016 period.
We then present what we consider our most robust and interesting finding, i.e. the
extreme level of income concentration in the Middle East as a whole (as compared to
other world regions), taking into account both between-country and within-country
inequality. Finally, we discuss our findings regarding the evolution of income
inequality in the Middle East over the 1990-2016 period (which, as we stressed in the
previous section, should be viewed as more fragile and exploratory than our findings
regarding the level). Complete series and detailed country-level estimates are
available in the online appendix.
Section 4.1. Evolution of average incomes and population in the Middle East
16 We also estimate variant series based upon alternative assumptions: n=2,4,6,8 instead of n=5, as well as a piecewise linear f(p) with a fraction f=0,0.2,0.4,0.6,0.8,1 of the total correction between p0=0.99 and p1=0.999 (and a fraction 1-f between p1=0.999 and billionaire level). For countries without billionaires’ data, namely Iran, Jordan, Palestine, Yemen, we simply upgraded the average standardized distributions of wealth for the US, France and China to the country specific average wealth.
17
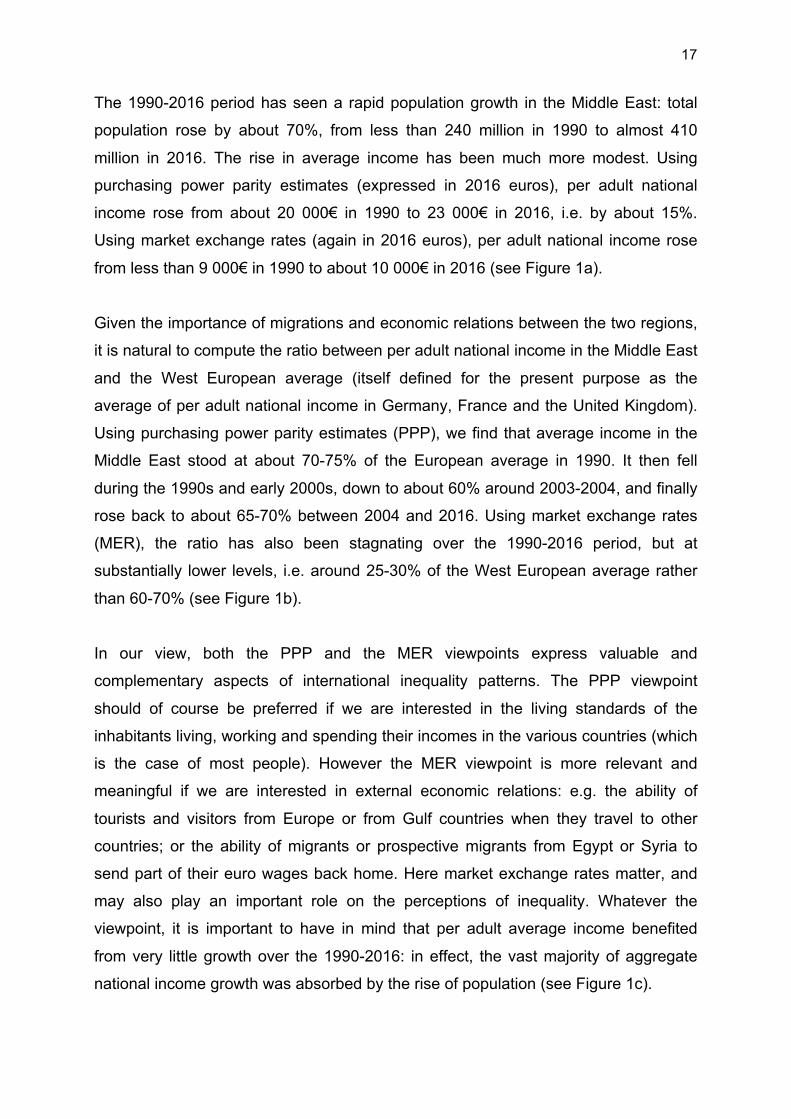
The 1990-2016 period has seen a rapid population growth in the Middle East: total
population rose by about 70%, from less than 240 million in 1990 to almost 410
million in 2016. The rise in average income has been much more modest. Using
purchasing power parity estimates (expressed in 2016 euros), per adult national
income rose from about 20 000€ in 1990 to 23 000€ in 2016, i.e. by about 15%.
Using market exchange rates (again in 2016 euros), per adult national income rose
from less than 9 000€ in 1990 to about 10 000€ in 2016 (see Figure 1a).
Given the importance of migrations and economic relations between the two regions,
it is natural to compute the ratio between per adult national income in the Middle East
and the West European average (itself defined for the present purpose as the
average of per adult national income in Germany, France and the United Kingdom).
Using purchasing power parity estimates (PPP), we find that average income in the
Middle East stood at about 70-75% of the European average in 1990. It then fell
during the 1990s and early 2000s, down to about 60% around 2003-2004, and finally
rose back to about 65-70% between 2004 and 2016. Using market exchange rates
(MER), the ratio has also been stagnating over the 1990-2016 period, but at
substantially lower levels, i.e. around 25-30% of the West European average rather
than 60-70% (see Figure 1b).
In our view, both the PPP and the MER viewpoints express valuable and
complementary aspects of international inequality patterns. The PPP viewpoint
should of course be preferred if we are interested in the living standards of the
inhabitants living, working and spending their incomes in the various countries (which
is the case of most people). However the MER viewpoint is more relevant and
meaningful if we are interested in external economic relations: e.g. the ability of
tourists and visitors from Europe or from Gulf countries when they travel to other
countries; or the ability of migrants or prospective migrants from Egypt or Syria to
send part of their euro wages back home. Here market exchange rates matter, and
may also play an important role on the perceptions of inequality. Whatever the
viewpoint, it is important to have in mind that per adult average income benefited
from very little growth over the 1990-2016: in effect, the vast majority of aggregate
national income growth was absorbed by the rise of population (see Figure 1c).

18
Next, and most importantly, it is critical to stress that there exists enormous and
persistent between-country inequality behind the Middle East average. In order to
summarize the changing population and income structure of the Middle East, it is
helpful to decompose the region into five blocs: (i) Turkey; (ii) Iran; (iii) Egypt; (iv) Iraq
and Syria and other non-Gulf countries: Jordan, Lebanon, Palestine, Yemen); and (v)
Gulf countries (including Saudi Arabia, Oman, Bahrain, UAE, Qatar and Kuwait) (see
Table 1 above). Each of the first four blocs represents about 20-25% of total
population of the Middle East, with relatively little variations over the 1990-2016
period (except for a slight rise in the share of the Iraq-Syria-other bloc). The main
change in the structure of Middle East population over the past quarter of a century is
the rise of the population share of Gulf countries, from about 10% in 1990 to 15% in
1996 (Figure 2). This is almost entirely due to the rise of migrant workers in oil-rich
countries (see below).
If we now look at average income patterns in these five sub-regions, we find that per
adult national income is substantially below average everywhere except in Gulf
countries (see Figure 3a-3b). One can distinguish between two groups: Turkey and
Iran, where average incomes have generally been around 50-60% of the West
European average in PPP terms (with a significant rise of Turkish incomes over the
2001-2015 period, in contrast to Iranian stagnation); and Egypt and Iraq-Syria-other,
where average incomes have always stood at significantly lower levels (around 30-
40% of West European average in PPP terms) (see Figure 3a). Using market
exchange rates, we find that Egypt-Iraq-Syria-other have stagnated around 10-15%
of the West European average (see Figure 3b). It is also worth noting that Turkey
rises slightly above Middle East average when we consider MER series, while Iran
falls toward the levels of Egypt and Iraq-Syria, reflecting the weakness of the Iranian
currency and the relative strength of the Turkish lira.
As compared to the rest of Middle East, Gulf countries clearly belong to a different
category. In PPP terms, their average per adult national income was about three
times that of Western Europe in 1990, and almost two times in 2016; in MER terms,
their income was 40% higher than the West European level in 1990, and is currently
about 10% lower (see Figure 4a). In brief: the enormous gap in average incomes
between Gulf countries and the more populated Middle East countries has been

19
trending downward in the past 25 years. However, two remarks are in order. First, the
income gap is still enormous: Gulf countries represent only 15% of the Middle East
population in 2016, but they receive between 42% (in PPP terms) and 47% (in MER
terms) of total Middle East income (Table 1). Back in 1990, their population share
was 10%, and their income share was between 44% (PPP) and 48% (MER). Next,
the fall in the income gap between Gulf countries and the rest of the Middle East
reflects a number of complex and contradictory forces. It is partly due to the evolution
of oil prices and output levels, as well as to the relative fast output growth in non-Gulf
countries like Turkey. But it is also due to the very large rise of migrant workers, and
the consequently migration-led reduction of per adult national income in Gulf
countries: the massive inflow of foreign workers (especially in the construction sector
and domestic services sector) resulted in a stronger increase in the population
denominator than in the income numerator of Gulf countries. By putting together
census and survey data for the various countries, we find that the overall rise of the
population share of Gulf countries (from 10% to 15% of total Middle East population)
is almost entirely due to the massive rise in foreign workers, which increased from
less than 50% in 1990 to almost 60% of the total population in 2016 (Figure 4b).
From this viewpoint, it is also helpful to distinguish between two groups of Gulf
countries: one group made of Saudi Arabia, Oman and Bahrain, where nationals still
make a (small) majority of the population (the foreign population share has been
relatively stable around 40-45% of total adult population between 1990 and 2016);
and another group made of United Arab Emirates (UAE), Kuwait and Qatar, where
the nationals make a smaller and smaller minority of the resident population (the
foreign share rose from 80% to 90%; see Figure 4b). This second group made about
one quarter of total population of Gulf countries in 1990, up to about one third by
2016.
It is worth stressing that our ability to measure income inequalities in oil-rich countries
is relatively limited. By exploiting available household surveys, we find that the ratio
between average per adult survey income between nationals and foreigners is
particularly large in UAE-Kuwait-Qatar (which is not surprising, given the very small
share of nationals), and most importantly that this ratio has increased over time, from
250% in 1990 to around 350% in 2016 (see Figure 4c). In Gulf countries where the
national-foreigner population structure is closer to 50-50 (i.e. Oman-Bahrain), the

20
average income ratio between nationals and foreigners appears to be less extreme
(but still substantial: around 160%). These estimates are solely based upon self-
reported survey data (with no correction for the under-estimation of top incomes), and
should therefore be considered as a lower bound. Finally, we are not able to include
Saudi Arabia (by far the most populated among Gulf countries) in these computations
due to a lack of access to adequate survey data17.
Section 4.2. Extreme Level of Income Concentration in the Middle East
We now present our main results regarding the level of income concentration in the
Middle East. According to our benchmark estimates, the share of total income going
to top 10% income earners is about 64% in the Middle East, as compared to 37% in
Western Europe and 47% in the USA (Figure 5).
Several remarks are in order. First, these three regions have comparable population
sizes (with a total population of about 410 million in the Middle East, 420 million in
Western Europe, and 320 million in the USA) and a relatively large degree of cultural,
historical and linguistic proximity, so we feel that the comparison is legitimate and
meaningful.
Next, the fact that we find much higher inequality levels in the Middle East appears to
be extremely robust. We obtain the same finding not only in the benchmark series,
but also in all variant series, often with a larger margin. Also, we focus on Figure 5
and subsequent figures on the latest years available (2012-2016), and as we shall
see below, the inequality gap with other regions was if anything even higher in
previous decades (see section 4.3). Most importantly, we stress again that our
inequality estimates for the Middle East are based upon highly conservative
estimates of within-country inequality.
Income inequality also appears to be significantly higher in the Middle East than in
Brazil – a country with population around 210 million that is often described as one of
17 See Appendix for the treatment of Saudi Arabia.

21
the most unequal in the world, and where the top decile income share is about 55%
(according to the recent DINA estimates constructed by Morgan, 2017). The Middle
East also displays slightly higher inequality estimates than South Africa, with about
63% for the top decile income share for the latest available years (Alvaredo and
Atkinson, 2010, and series updated in 2017 in WID.world).
It is worth stressing that the origins of inequality are obviously very different in these
different groups of countries. In the case of the Middle East, they are largely due to
the geography of oil ownership and the transformation of oil revenues into permanent
financial endowments. In contrast, extreme inequality in South Africa is intimately
related to the legacy of the Apartheid system: until the early 1990s, only the white
minority (about 10% of the population, which until today roughly corresponds to the
top 10% income group) had full mobility and ownership rights. In Brazil, the legacy of
racial inequality also plays an important role (it was the last major country to abolish
slavery in 1887, at a time when slaves made up about 30% of the population),
together with huge regional inequalities. It is striking to see that the Middle East, in
spite of its much larger racial and ethno-cultural homogeneity, has reached inequality
levels that are comparable to – or even higher than – those observed in South Africa
or Brazil.
It is also worth stressing that inequality levels in the Middle East appear to be
significantly larger than those observed in giant countries with much bigger
populations such as China and India (see Figures 5-6). Here we use inequality
estimates that were recently constructed for China and India by Piketty, Yang and
Zucman (2017) and Chancel and Piketty (2017). These estimates are obviously far
from perfect, but they probably tend to minimize the gap with the Middle East (in
particular, we have access to more extensive income tax data for China and India
than the for the Middle East).
In brief: according to our estimates, the Middle East appears to be the most unequal
region in the world. This is true for the top decile income share, as well as for other
inequality indicators; e.g. the top percentile income share is about 30% in the Middle
East, vs. 12% in Western Europe, 20% in the USA, 28% in Brazil, 18% in South

22
Africa, 14% in China and 21% in India (see Figure 6). This is also true for synthetic
indicators such as the Gini coefficient (see on-line series at WID.world).
We find it particularly informative to compare the overall levels of the income shares
going to the bottom 50%, the middle 40% and the top 10% and 1% in the Middle East
and other countries (see Figures 7a-7b). For instance, according to our benchmark
estimates, the bottom 50% of the population receives about 9% of total income in the
Middle East (vs. 18% in Europe), as compared to 64% for the top 10% (vs. 37% in
Western Europe). This clearly illustrates that differences in distributions can make an
enormous difference when comparing income and welfare levels across countries.
Section 4.3. Analyzing the evolution of income inequality in the Middle East and other
robustness checks
We now turn to our results regarding the evolution of income inequality in the Middle
East over the 1990-2016 period. We should stress again that the data sources at our
disposal are insufficient to properly analyze trends in inequality. In our benchmark
estimates, we find a declining inequality trend at the regional level between 1990 and
2010, followed by a rising trend between 2010 and 2016. However these are trends
of relatively small magnitude, and it is unclear whether these are robust findings
(more on this below). As a first order approximation, our main finding – and probably
the only robust one – is that income concentration is very high and approximately
constant in the Middle East region taken as a whole). The fact that inequality remains
extreme for all years over the period provides further evidence for the robustness of
this result.
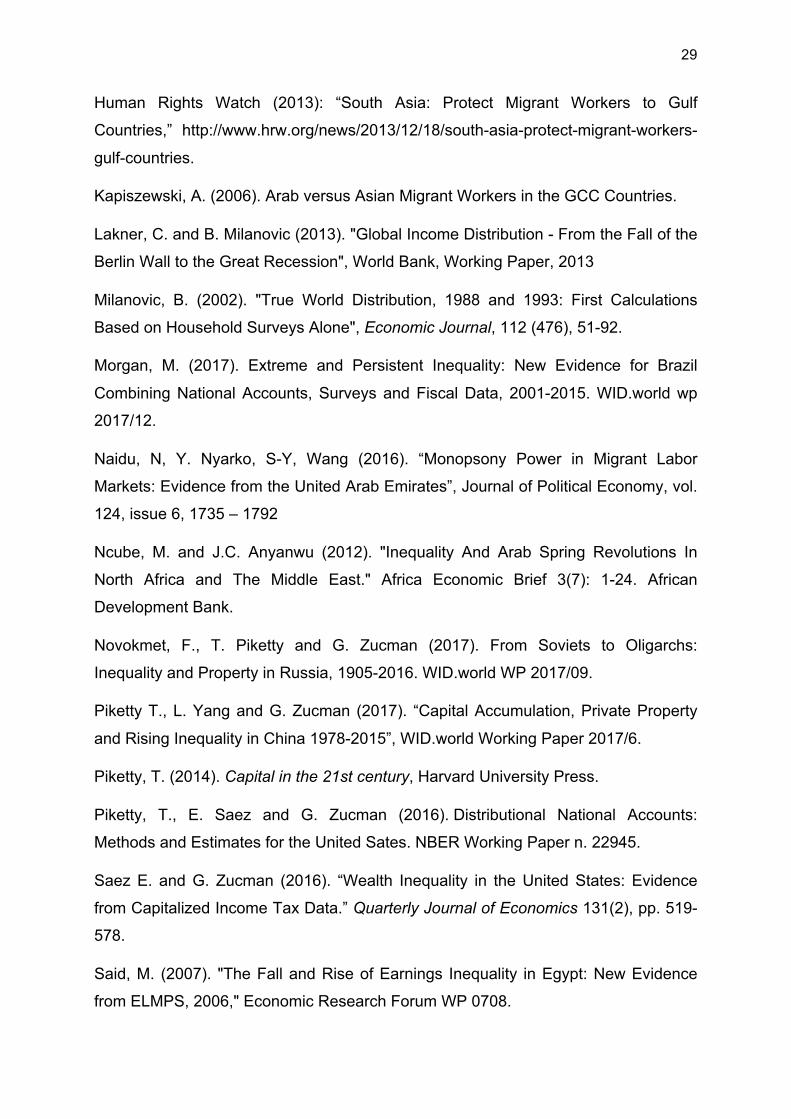
According to our benchmark estimates, the top 10% income share fluctuates around
60%-70% of total income between 1990 and 2016, while the bottom 50% income
share fluctuates around 5%-10% of total income (see Figure 8a). We have
constructed a large number of variant estimates, and these orders of magnitude
appear to be robust. When we move from market-exchange-rate estimates (which we
use as benchmark series) to purchasing-power-parity estimates, inequality levels

23
decline a little bit - as one might expect (see Figure 8b).18 When we change the
geographical definition of the Middle East by excluding Turkey (a country whose
average income is intermediate between the poorest countries – Egypt, Iraq, Syria,
Yemen, etc. – and the oil-rich Gulf countries, and which therefore is likely to
moderate inequality at the regional level), we find somewhat higher inequality levels
(see Figure 8b). Finally, inequality levels remain extremely high, independently from
the fraction of missing income (the gap between national income and total survey
income) that we attribute to nationals in Gulf countries. Figure 9a display top income
shares for each country in 2016, depending on different scenarios (we impute
missing income to nationals so that the average income in the survey (augmented by
the imputation) represents 30, 50, 70 or 100% of the average national income).
Figures 9b-c show how these different variants affect inequality at the regional levels
(even if we attribute proportionally the missing national income to both foreigners and
nationals, and not only to nationals, inequality remains extreme).
As one can see from Figures 10a-10b, where we compare the evolution of the top
10% and top 1% income shares in the Middle East and other world regions between
1990 and 2016, the striking fact is that income inequality has always been much
higher in the Middle East.19 The inequality gap was particularly large in 1990 (in a
way, the Middle East has been a pioneer region in terms of extreme inequality). The
gap decreased during the 1990s-2000s, as other world regions gradually became
more unequal, but remains substantial, and the Middle East continues to lead the
world inequality ranking (with the possible exception of South Africa).20
It is worth noting that, as shown in Figure 10c, when we exclude Gulf countries from
our computations, inequality remains extreme, with a top decile receiving more than
50% of total regional income over the entire period. If inequality mechanically
increases when we merge countries with very different average incomes, the extent
to which it affects top income shares is not straightforward. When we aggregate 18 We tend to prefer MER estimates because they are in a way more comparable to those estimated for other world regions (i.e. we do not use price differentials when estimating income inequality within the USA, Brazil, China or India). But as noted above both perspectives offer valuable and complementary insights. 19 The same conclusion holds true when we look at other inequality indicators such as the bottom 50% income share or the Gini coefficient. 20 Unfortunately available series for the top 10% and top 1% share in South Africa do not cover all years, so it is difficult to make a complete comparison with the Middle East at this stage.

24
series from Eastern and Western European countries for instance, inequality
increases (relative to Western Europe) but to a much lesser extent than in the Middle
East.
In order to better understand the origins of our high inequality estimates, we compare
on Figures 11a-11b-11c the results obtained with our benchmark national income
series (combining survey data, national accounts, income tax and wealth data), the
results obtained with the fiscal income series (ignoring the wealth correction, which
as one can see plays a relatively minor role) and the results obtained with the survey
data alone. Here we distinguish between the survey income series obtained with
different country-level average incomes (anchored on observed country-level per
adult national incomes) and the survey income series simulated by assuming fixed
country-level average incomes (thereby neutralizing the impact of between-country
inequality). As one see, both the within-country inequality effect (fiscal data
correction) and the between-country inequality effect play an important role in
accounting for the very high inequality estimates.
Finally, we have also simulated what would have been the evolution of income
inequality in the Middle East over the 1990-2016 if within-country inequality had
remained fixed at the observed 1990 level. As one can see from Figures 12a-12b,
the evolution of total inequality at the level of the Middle East taken as a whole would
have been virtually the same, with declining inequality between 1990 and 2010 and
rising inequality since 2010. This shows that our estimates are mostly driven by the
evolution of between-country inequality. This is partly due to the fact that we do not
have survey data for all years (see Table 2), so that for some countries our inequality
estimates display very little time variations (and in some cases no time variation at
all). This is also due to the fact that even in countries with several surveys over the
period, we observe limited variations in income inequality, and these variations tend
to compensate each other. For instance, surveys indicate that income inequality
declined somewhat in Turkey between 2003 and 2007, but then rose between 2007
and 2016; inequality increased in Lebanon between 2005 and 2008 and then
stabilized; inequality declined in Egypt between 1999 and 2010, but then rose
between 2010 and 2015; inequality increased in the UAE between 1998 and 2009
according to the top 10% income share (but declined according to the top 1% income

25
share); inequality increased according to both indicators in Qatar between 2007 and
2012; and so on (see Table 3).
Most of these variations are relatively modest in magnitude, so it is not surprising that
most of the evolution of Middle East inequality is driven by the evolution of between-
country inequality and the fact that the gap in average income between oil-rich
countries and other countries has been trending downwards (but is still very large in
level). If we had access to adequate income tax data throughout the 1990-2016
period, we might reach different conclusions and find a strong within-country rising
inequality trend (such as the one found in a large number of very different countries
across the world, e.g. in the USA, Europe, India, China, South Africa, Russia, with
varying magnitudes). It is also possible that Middle East countries – like Brazil –
belong to a different category, i.e. countries where inequality has always been very
large historically (so that it did not rise in recent decades). Given the data sources at
our disposal, we are not able to conclude with a satisfactory degree of precision.
Section 5. Concluding comments
In this paper we have combined household surveys, national accounts, income tax
data and wealth data in order to estimate the level and evolution of income
concentration in the Middle East for the period 1990-2016. According to our
benchmark series, the Middle East appears to be the most unequal region in the
world, with a top decile income share as high as 64%, as compared to 37% in
Western Europe, 47% in the USA, and 55% in Brazil. This is due both to enormous
inequality between countries (particularly between oil-rich and population-rich
countries) and to large inequality within countries (which we probably under-estimate,
given the limited access to proper fiscal data). To our knowledge, this is the first
attempt to measure income inequality at the level of the Middle East taken as a
whole, and also the first attempt to use income tax data and generalized Pareto
interpolation techniques to correct household survey data in the Middle East.
The data at our disposal is highly imperfect, and we still face considerable limitations
in our ability to measure inequality in the Middle East. In particular, there is much
uncertainty about inequality trends in the period under study. However the general

26
conclusion that the overall inequality level is one of the highest in the world – if not
the highest in the world, with the possible exception of South Africa – appears to be
very robust.
In conclusion, we would like to stress the importance of increasing transparency on
income and wealth in the Middle East. In particular, it is critical that Middle East
countries provide access to household surveys micro-files, and even more
importantly that they provide access to income tax data (at least in the form of
income tax tabulations). It is very difficult to have an informed public debate about
inequality trends – and also about a large number of substantial policy issues such
as taxation and public spending – without proper access to such data. While the lack
of transparency on income and wealth is an important issue in many – if not most –
areas of the world, it appears to be particularly extreme in the Middle East, and
arguably raises in itself a problem of democratic accountability, quite independently
from the actual level of inequality.
Finally, our results regarding the enormous level of income inequality in the Middle
East region naturally point toward the need to develop mechanisms of regional
redistribution and investment. In a way, this is already happening, in the sense that
oil-rich countries regularly make loans to poorer countries (e.g. Saudi Arabia to
Egypt), and that these loans sometimes include implicit or explicit subsidies. However
such mechanisms are usually of limited magnitude, and tend to be highly
unpredictable. Given the enormous concentration of gross domestic product and
national income in the region, mechanisms of regional investment funds similar to
those developed in the European Union (with permanent transfers between the
richest and the poorest countries of the order of several percentage points of GDP)
could make a large difference. These issues would deserve more attention in future
research.
References
Alvaredo, F. and A. B. Atkinson (2010). Colonial Rule, Apartheid and Natural
Resources: Top Incomes in South Africa 1903-2007. CEPR DP 8155.

27
Alvaredo. F. and T. Piketty (2015). Measuring Top Incomes and Inequality in the
Middle East. CEPR DP 10068.
Alvaredo, F., A. B. Atkinson, T. Piketty and E. Saez (2011-2015). The World Top
Incomes Database, 2011-2015.
Alvaredo, F., A. B. Atkinson, T. Piketty and E. Saez (2013). "The Top 1% in
International and Historical Pespective", Journal of Economic Perspectives, 27(3): 1-
21.
Alvaredo F., L. Chancel, T. Piketty, E. Saez and G. Zucman (2017). World Inequality
Report 2018. World Inequality Lab. Paris School of Economics.
Alvaredo F., A. B. Atkinson, L. Chancel, T. Piketty, E. Saez and G. Zucman (2016).
“Distributional National Accounts (DINA) Guidelines: Concepts and Methods used in
the World Wealth and Income Database”, WID.world WP 2016/2.
Andersen, J., N. Johannesen, D. Dreyer Lassen and E. Palteva (2016). Petro Rents,
Political Institutions, and Hidden Wealth: Evidence from Offshore Bank Accounts.
Mimeo.
Assaad, R., Kraft, C. Roemer, J. and Salehi-Isfahani, D. (2017). Inequality of
Opportunity in Wages and Consumption in Egypt,” Review of Income and Wealth,
10.1111/roiw.12289.
Assouad, L. (2017). Rethinking the Lebanese Economic Miracle: The Extreme
Concentration of Income and Wealth in Lebanon, 2005-2014. WID.world WP
2016/13.
Atkinson, A. B. and T. Piketty (2010). Top Incomes: a Global Perspective, Oxford
University Press.
Atkinson, A. B., and T. Piketty (2007). Top Incomes over the Twentieth Century. A
Contrast between Continental European and English-speaking Countries, Oxford
University Press.
Atkinson, A. B., T. Piketty and E. Saez (2011). "Top Incomes in the Long Run of
History", Journal of Economic Literature, 49(3), 3-71.

28
Bibi, S. and M. K. Nabli (2010). Equity and Inequality in the Arab Region. ERF Policy
Research Report 33.
Blanchet, T., J. Fournier and T. Piketty. 2017. “Generalized Pareto Curves: Theory
and Applications to Income and Wealth Tax Data for France and the United States,
1800-2014.” WID.world WP 2017/3.
Bourguignon, F. and C. Morrisson, "Inequality Among World Citizens, 1820-1992",
American Economic Review, 2002, 92(4), 727-744
Chancel, L., and T. Piketty (2017). Indian income inequality, 1922-2014: From British
Raj to Billionaire Raj ?, WID.world WP 2017/11.
Chatham House (2015). Future Trends in the Gulf. Report. The Royal Institute of
International Affairs.
El-Katiri, L., B. Fattouh and P. Segal (2011). Anatomy of an oil-based welfare state:
Rent distribution in Kuwait. Kuwait Programme on Development, Governance and
Globalisation in the Gulf States, London School of Economics, number 13.
Garbinti, B., J. Goupille-Lebret, and T. Piketty (2016). “Accounting for Wealth
Inequality Dynamics: Methods, Estimates and Simulations for France (1800-2014).”
WID.world WP 2016/5.
Garbinti, B., J. Goupille-Lebret, and T. Piketty (2017). “Income inequality in France,
1900-2014: Evidence from Distributional National Accounts (DINA)”, WID.world WP
2017/4.
Hassine, N. B. (2015). Economic Inequality in the Arab Region. World Development.
66: 532-556.
Hlasny, V. and P. Verme (2013). "Top Incomes and the Measurement of Inequality in
Egypt." World Bank Working Paper.
Hlasny, V. and P. Verme (2015). Top Incomes and the Measurement of Inequality: A
Comparative Analysis of Correction Methods using Egyptian, EU, and US Survey
Data. Mimeo.
29
Human Rights Watch (2013): “South Asia: Protect Migrant Workers to Gulf
Countries,” http://www.hrw.org/news/2013/12/18/south-asia-protect-migrant-workers-
gulf-countries.
Kapiszewski, A. (2006). Arab versus Asian Migrant Workers in the GCC Countries.
Lakner, C. and B. Milanovic (2013). "Global Income Distribution - From the Fall of the
Berlin Wall to the Great Recession", World Bank, Working Paper, 2013
Milanovic, B. (2002). "True World Distribution, 1988 and 1993: First Calculations
Based on Household Surveys Alone", Economic Journal, 112 (476), 51-92.
Morgan, M. (2017). Extreme and Persistent Inequality: New Evidence for Brazil
Combining National Accounts, Surveys and Fiscal Data, 2001-2015. WID.world wp
2017/12.
Naidu, N, Y. Nyarko, S-Y, Wang (2016). “Monopsony Power in Migrant Labor
Markets: Evidence from the United Arab Emirates”, Journal of Political Economy, vol.
124, issue 6, 1735 – 1792
Ncube, M. and J.C. Anyanwu (2012). "Inequality And Arab Spring Revolutions In
North Africa and The Middle East." Africa Economic Brief 3(7): 1-24. African
Development Bank.
Novokmet, F., T. Piketty and G. Zucman (2017). From Soviets to Oligarchs:
Inequality and Property in Russia, 1905-2016. WID.world WP 2017/09.
Piketty T., L. Yang and G. Zucman (2017). “Capital Accumulation, Private Property
and Rising Inequality in China 1978-2015”, WID.world Working Paper 2017/6.
Piketty, T. (2014). Capital in the 21st century, Harvard University Press.
Piketty, T., E. Saez and G. Zucman (2016). Distributional National Accounts:
Methods and Estimates for the United Sates. NBER Working Paper n. 22945.
Saez E. and G. Zucman (2016). “Wealth Inequality in the United States: Evidence
from Capitalized Income Tax Data.” Quarterly Journal of Economics 131(2), pp. 519-
578.
Said, M. (2007). "The Fall and Rise of Earnings Inequality in Egypt: New Evidence
from ELMPS, 2006," Economic Research Forum WP 0708.

30
UNDP (2012). Arab Development Challenges Report 2011. Towards the
Developmental State in the Arab Region.
van der Weide, Lakner and Ianchovichina, 2016 “Is inequality underestimated in
Egypt? Evidence from house prices”, World Bank Policy Research Working Paper
7727.
Wahba, J. (1996). "Earnings and Regional Inequality in Egypt", Economic Research
Forum WP 9613.
Wahba, J. (2009). "The Impact of Labor Market Reforms on Informality in Egypt."
Population Council Gender and Work in the MENA Region WP number 3.
Weyl, E. G. (2016): “The Openness-Equality Trade-Off in Global Redistribution,” Economic Journal (forthcoming).
World Bank (2012). "Inside Inequality in Egypt. Historical trends, recent facts,
people’s perceptions and the spatial dimension."
World Bank (2015). Inequality, Uprisings, and Conflict in the Arab World. World Bank
and Middle East and North Africa Region; MENA Economic Monitor.
Zucman, G. (2015). The Missing Wealth of Nations. University of Chicago Press.

Population (million)
Adult Population (aged 20 and
more, in million)
Adult population (% of ME
total)
National Income (Billion
PPP Euro 2016)
% ME Total Income (PPP)
National Income (Billion MER Euro 2016)
% ME Total Income (MER)
Turkey 80 53 21% 1,073 19% 548 22%Iran 80 56 22% 896 16% 330 13%
Egypt 93 54 22% 800 14% 234 9%Iraq-Syria-Other (non-Gulf) 102 52 21% 570 10% 243 10%
Iraq 38 18 7% 354 6% 112 4%
Syria 19 10 4% 47 1% 28 1%
Jordan 8 4 2% 57 1% 30 1%
Lebanon 6 4 2% 57 1% 40 2%
Palestine 5 2 1% 16 0% 12 0%
Yemen 27 13 5% 39 1% 21 1%
Gulf Countries 54 37 15% 2,394 42% 1,179 47%
Saudi Arabia 32 20 8% 1313 23% 575 23%
Oman 5 3 1% 118 2% 47 2%
Bahrain 1 1 0% 46 1% 26 1%
UAE 9 8 3% 430 7% 283 11%
Kuwait 4 3 1% 258 5% 122 5%
Qatar 2 2 1% 229 4% 126 5%
Total Middle East 409 252 100% 5,733 100% 2,534 100%
Table 1. Population and income in the Middle East (2016)

Survey years Average ratio (total survey income)/(national income)
Turkey 1994, 2002-2016 43%Iran 2010, 2013 49%
Egypt 1999, 2004, 2008, 2010, 2012, 2015 40%Iraq-Syria-Other non-Gulf 1992-2013 53%
Iraq 2007 60%
Syria 2004 56%
Jordan 1992, 2002, 2006, 2008, 2010, 2013 70%
Lebanon 2007 37%
Palestine 1996-1998, 2004-2008, 2010-2011 65%
Yemen 2006 33%
Gulf Countries 1995-2013 30%
Saudi Arabia 2008 30%
Oman 2010 29%
Bahrain 1995, 2005, 2015 37%
UAE 1998, 2009 39%
Kuwait 2007, 2013 21%
Qatar 2007, 2012 23%
Table 2. Household surveys used in this paper (1990-2016)

5,000 €
10,000 €
15,000 €
20,000 €
25,000 €
30,000 €
35,000 €
1990 1995 2000 2005 2010 2015
Figure 1a. Per adult national income: Middle East vs W. Europe 1990-2016
W. Europe
Middle East (PPP)
Middle East (MER)
Per adult national income in € 2016 PPP (purchasing power parity) vs MER (market exchange rate). Western Europe = Germany-France-Britain. Authors' computations using official national accounts and GDP deflator.

20%
25%
30%
35%
40%
45%
50%
55%
60%
65%
70%
75%
80%
1990 1995 2000 2005 2010 2015
Figure 1b. Per adult national income: ratio Middle East /W.Europe
PPP (purchasing power parity)
MER (market exchange rate)
Per adult national income in € 2016 PPP vs MER. Western Europe = Germany-France-Britain.

-10% 0%
10% 20% 30% 40% 50% 60% 70% 80% 90%
100% 110% 120% 130% 140% 150% 160%
1990 1995 2000 2005 2010 2015
Figure 1c . Cumulated growth in the Middle East: income vs population
National income
Adult population
Per adult income
Cumulated growth since 1990. National income in € 2016 PPP.

8%
10%
12%
14%
16%
18%
20%
22%
24%
26%
1990 1995 2000 2005 2010 2015
Figure 2. Population shares in the Middle East, 1990-2016
Turkey
Iran
Egypt
Iraq-Syria-Other
Gulf countries
Shares in total Middle East adult population (20+). Gulf countries include Saudi Arabia, UAE, Oman, Kuwait, Qatar, Barhein. Other Arab Middle East countries (Jordan, Lebanon, Palestine, Yemen) are included with Iraq-Syria.

20%
25%
30%
35%
40%
45%
50%
55%
60%
65%
70%
75%
80%
1990 1995 2000 2005 2010 2015
Figure 3a. Per adult national income: ratio Middle East /W.Europe (PPP)
Middle East (PPP) Turkey Iran Egypt Iraq-Syria-Other
Per adult national income in € 2016 PPP (purchasing power parity). Other Arab Middle East Countries (Jordan, Lebanon, Palestine, Yemen) are included with Iraq-Syria. Western Europe = Germany-France-Britain.

0%
5%
10%
15%
20%
25%
30%
35%
40%
1990 1995 2000 2005 2010 2015
Figure 3b. Per adult national income: ratio Middle East /W.Europe (MER)
Middle East (MER) Turkey
Iran Egypt
Iraq-Syria-Other
Per adult national income in € 2016 MER (market exchange rate). Other Arab Middle East Countries (Jordan, Lebanon, Palestine, Yemen) are included with Iraq-Syria. Western Europe = Germany-France-Britain.

0% 20% 40% 60% 80%
100% 120% 140% 160% 180% 200% 220% 240% 260% 280% 300% 320% 340%
1990 1995 2000 2005 2010 2015
Figure 4a. Per adult national income: ratio Gulf countries/W. Europe
Gulf Countries (PPP)
Gulf Countries (MER)
Per adult national income in € 2016 PPP and MER. Gulf countries include Saudi Arabia, UAE, Oman, Kuwait, Qatar, Barhein. W. Europe = Germany-France-Britain.

30%
40%
50%
60%
70%
80%
90%
100%
1990 1995 2000 2005 2010 2015
Figure 4b. Shares of foreigners in Gulf Countries, 1990-2016
UAE-Kuwait-Qatar
All Gulf Countries
Saudi Arabia-Oman-Barhain
Shares of foreigners in the adult population (20+) of Gulf countries (as measured by censuses, administrative sources and household surveys).

140%
160%
180%
200%
220%
240%
260%
280%
300%
320%
340%
360%
380%
1990 1995 2000 2005 2010 2015
Figure 4c. Income ratios Nationals/Foreigners in Gulf countries, 1990-2016
UAE-Kuwait-Qatar
All Gulf countries (except Saudi Arabia)
Oman-Barhain
Ratios between average per adult income of nationals and foreigners (as measured by household surveys). These ratios are likely to under-estimate inequality between nationals and foreigners because top incomes are under-reported in surveys (no correction was made here). Detailed survey breakdown not available for Saudi Arabia.

0%
10%
20%
30%
40%
50%
60%
70%
Middle East (pop: 410 million)
W. Europe (420m)
All Europe (570m)
USA (320m)
China (1380m)
India (1330m)
Brazil (210m)
South Africa (55m)
Figure 5. Top 10% income share: Middle East vs other countries
Distribution of national income (before taxes and transfers, except pensions and unempl. insurance) among adults. Corrected estimates combining survey, fiscal, wealth and national accounts data. Equal-split series (income of married couples divided by two). Latest years available (2012-2016). Source: WID.world.

0%
5%
10%
15%
20%
25%
30%
Middle East (pop: 410 million)
W. Europe (420m)
All Europe (570m)
USA (320m)
China (1380m)
India (1330m)
Brazil (210m)
South Africa (55m)
Figure 6. Top 1% income share: Middle East vs other countries
Distribution of national income (before taxes and transfers, except pensions and unempl. insurance) among adults. Corrected estimates combining survey, fiscal, wealth and national accounts data. Equal-split series (income of married couples divided by two). Latest years available (2012-2016). Source: WID.world.

0%
10%
20%
30%
40%
50%
60%
70%
Middle East (pop: 410 million)
W. Europe (420m)
All Europe (570m)
USA (320m)
Figure 7a. Bottom 50% vs Middle 40% vs Top 10% income shares
Distribution of national income (before taxes and transfers, except pensions and unempl. insurance) among adults. Corrected estimates combining survey, fiscal, wealth and national accounts data. Equal-split series (income of married couples divided by two). Latest years available (2012-2016). Source: WID.world.
Bottom 50%
Top 10%
Middle 40%
Bottom 50%
Middle 40%
Top 10%
Bottom 50%
Middle 40%
Top 10%
Top
10%
Middle 40%
Bottom
50%

0%
5%
10%
15%
20%
25%
30%
Middle East (pop: 410 million)
W. Europe (420m)
All Europe (570m)
USA (320m)
Figure 7b. Bottom 50% vs Top 1% income shares
Distribution of national income (before taxes and transfers, except pensions and unempl. insurance) among adults. Corrected estimates combining survey, fiscal, wealth and national accounts data. Equal-split series (income of married couples divided by two). Latest years available (2012-2016). Source: WID.world.
Bottom 50%
Top 1%
Bottom 50%
Top 1%
Bottom 50%
Top 1%
Top 1%
Bottom
50%
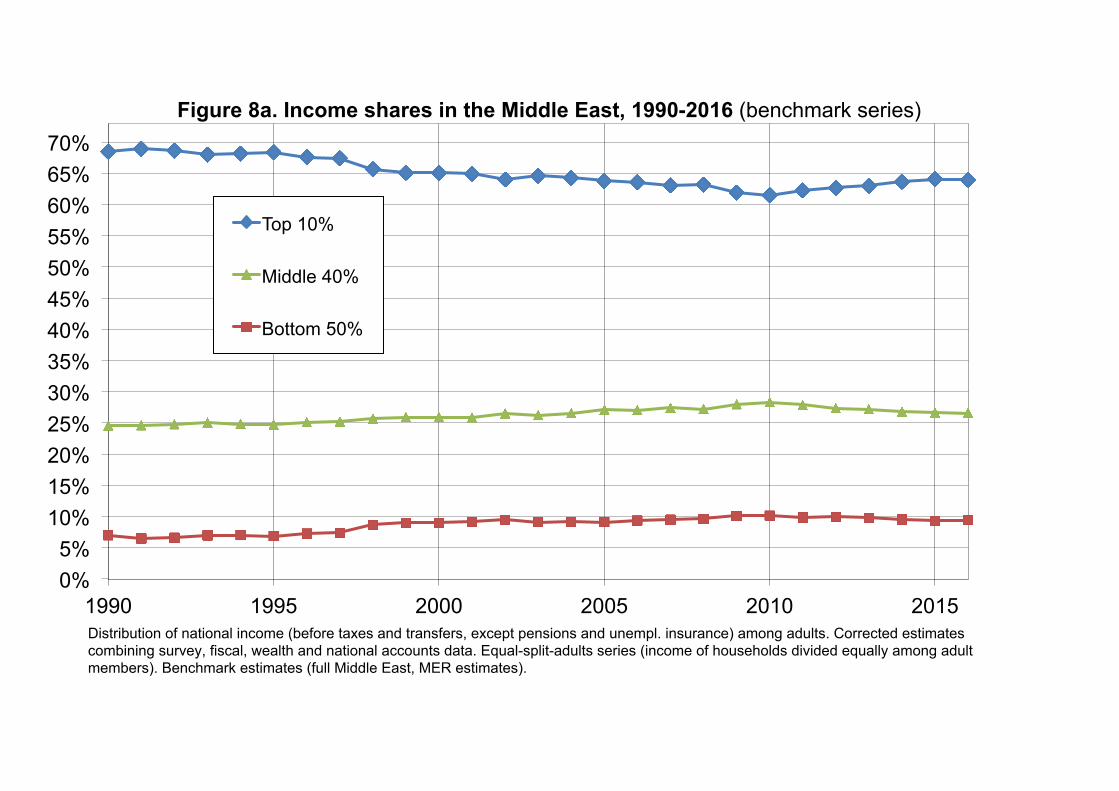
0% 5%
10% 15% 20% 25% 30% 35% 40% 45% 50% 55% 60% 65% 70%
1990 1995 2000 2005 2010 2015
Figure 8a. Income shares in the Middle East, 1990-2016 (benchmark series)
Top 10%
Middle 40%
Bottom 50%
Distribution of national income (before taxes and transfers, except pensions and unempl. insurance) among adults. Corrected estimates combining survey, fiscal, wealth and national accounts data. Equal-split-adults series (income of households divided equally among adult members). Benchmark estimates (full Middle East, MER estimates).
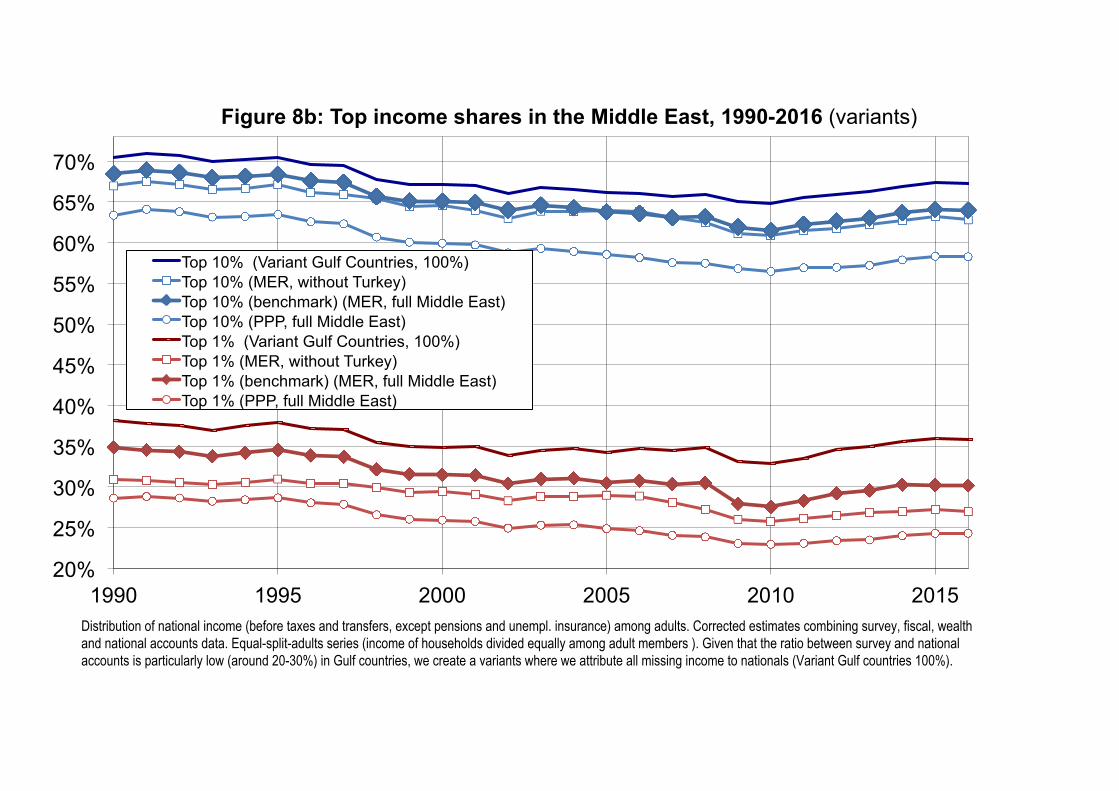
20%
25%
30%
35%
40%
45%
50%
55%
60%
65%
70%
1990 1995 2000 2005 2010 2015
Figure 8b: Top income shares in the Middle East, 1990-2016 (variants)
Top 10% (Variant Gulf Countries, 100%) Top 10% (MER, without Turkey) Top 10% (benchmark) (MER, full Middle East) Top 10% (PPP, full Middle East) Top 1% (Variant Gulf Countries, 100%) Top 1% (MER, without Turkey) Top 1% (benchmark) (MER, full Middle East) Top 1% (PPP, full Middle East)
Distribution of national income (before taxes and transfers, except pensions and unempl. insurance) among adults. Corrected estimates combining survey, fiscal, wealth and national accounts data. Equal-split-adults series (income of households divided equally among adult members ). Given that the ratio between survey and national accounts is particularly low (around 20-30%) in Gulf countries, we create a variants where we attribute all missing income to nationals (Variant Gulf countries 100%).

32%
7%
50%
17%
52%
19%
68%
29%
83%
39%
88%
42%
92%
45%
0%
20%
40%
60%
80%
100% Qatar
Figure 9a: Inequality Statistics in Gulf countries, 2016 (Variants)
Survey distribution
Fiscal distribution
Variant, proportional re-allocation
Variant 30% (benchmark for Qatar)
Variant 50%
Variant 70%
Variant 100%
Distribution of income (before taxes and transfers, except pensions and unempl. insurance) among equals-plit adults (income of households divided equally among adult members ). Survey income series solely use self-reported survey data (but anchors distributions to per adult national income). Fiscal income estimates combine survey and income tax data (but do not use wealth data to allocate tax-exempt capital income). Final estimates (with variants) combine combine survey, fiscal, wealth and national accounts data. Variants estimates are the result of imputing a fraction of missing income (the gap between national income and total survey income) so that the average income in the survey (augmented by the imputation) represents 30, 50, 70 or 100% of the average national income, and combine survey, fiscal, wealth and national accounts data. We also consider a conservative variant where the missing income is proportionally attributed to both foreigners and nationals."
35%
10%
53%
16%
54%
18%
65%
20%
68%
21%
70%
21%
Kuwait
37%
8%
53%
16%
57%
20%
61%
19%
63%
20%
65%
20%
0%
20%
40%
60%
80%
100%
Top 10% income share Top 1% income share
Oman
32%
7%
51%
16%
53%
18%
53%
18%
55%
19%
58%
20%
Top 10% income share Top 1% income share
Bahrain
38%
6%
56%
14%
56%
16%
63%
23%
75%
32%
84%
37%
Top10%incomeshareTop1%incomeshare
UAE

10%
30%
61%
26%
9%
27%
64%
30%
9%
24%
67%
36%
0%
10%
20%
30%
40%
50%
60%
70%
Bottom 50% income share
Middle 40% income share
Top 10% income share
Top 1% income share
Figure 9b: Inequality Statistics in the Middle East, Variants for Gulf countries (2016)
Variant proportional allocation
Benchmark (50%)
Variant 100%: all missing income to nationals
Distribution of income (before taxes and transfers, except pensions and unempl. insurance) among equals-plit adults (income of households divided equally among adult members ). Final estimates (with variants) combine combine survey, fiscal, wealth and national accounts data. Variants estimates are the result of imputing a fraction of missing income (the gap between national income and total survey income) so that the average income in the survey (augmented by the imputation) represents 50, 70 or 100% of the average national income, and combine survey, fiscal, wealth and national accounts data. We also consider a conservative variant where the missing income is proportionally attributed to both foreigners and nationals."

20%
25%
30%
35%
40%
45%
50%
55%
60%
65%
70%
1990 1995 2000 2005 2010 2015
Figure 9c: Top income shares in the Middle East, 1990-2016 (Variants for Gulf countries)
Top 10% (Variant Gulf Countries, 100%) Top 10% (Variant 70%) Top 10% (Benchmark, 50%) Top 10% (proportional allocation) Top 1% (Variant 100%) Top 1% (Variant 70%) Top 1% (Benchmark 50%) Top 1% (proportional allocation)
Distribution of income (before taxes and transfers, except pensions and unempl. insurance) among equals-plit adults (income of households divided equally among adult members ). Final estimates (with variants) combine combine survey, fiscal, wealth and national accounts data. Variants estimates are the result of imputing a fraction of missing income (the gap between national income and total survey income) so that the average income in the survey (augmented by the imputation) represents 50, 70 or 100% of the average national income, and combine survey, fiscal, wealth and national accounts data. We also consider a conservative variant where the missing income is proportionally attributed to both foreigners and nationals."

25%
30%
35%
40%
45%
50%
55%
60%
65%
70%
1990 1995 2000 2005 2010 2015
Figure 10a.Top 10% income share 1990-2016:Middle East vs other countries
Middle East Brazil
USA W. Europe
China India
Distribution of pretax national income (before taxes and transfers, except pensions and unempl. insurance) among equal-split adults (income of households divided equally among adult members ). Sources for USA and France: WID.world.

0%
5%
10%
15%
20%
25%
30%
35%
40%
1990 1995 2000 2005 2010 2015
Figure 10b. Top 1% income share 1990-2016: Middle East vs other countries
Middle East Brazil USA W. Europe China India
Distribution of pretax national income (before taxes and transfers, except pensions and unempl. insurance) among equal-split adults (income of households divided equally among adult members). Sources for USA and France: WID.world.

30%
35%
40%
45%
50%
55%
60%
65%
70%
75%
80%
Figure 10c.Top 10% income share 1990-2016:Middle East vs other countries
Middle East Middle East, without Gulf Countries Europe Western Europe only USA
Distribution of pretax national income (before taxes and transfers, except pensions and unempl. insurance) among equal-split adults (income of households divided equally among adult members ). Sources: WIR, 2018.

25%
30%
35%
40%
45%
50%
55%
60%
65%
70%
1990 1995 2000 2005 2010 2015
Figure 11a. Decomposing the level of Middle East top 10% income share
Top 10% (national income) Top 10% (fiscal income) Top 10% (survey income) Top 10% (survey, fixed-average)
Distribution of income (before taxes and transfers, except pensions and unempl. insurance) among equals-plit adults (income of households divided equally among adult members ). Pretax national income estimates combine survey, fiscal, wealth and national accounts data. Fiscal income estimates combine survey and income tax data (but do not use wealth data to allocate tax-exempt capital income). Survey income series solely use self-reported survey data (but anchors national distributions to per adult national income). Survey income with fixed-average-income series assume same average income for all countries (thereby neutralizing between-country inequality).

5%
10%
15%
20%
25%
30%
35%
1990 1995 2000 2005 2010 2015
Figure 11b. Top 1% income share in the Middle East, 1990-2016
Top 1% (national income)
Top 1% (fiscal income)
Top 1% (survey income)
Top 1% (survey, fixed-average)
Distribution of income (before taxes and transfers, except pensions and unempl. insurance) among equals-plit adults (income of households divided equally among adult members ). Pretax national income estimates combine survey, fiscal, wealth and national accounts data. Fiscal income estimates combine survey and income tax data (but do not use wealth data to allocate tax-exempt capital income). Survey income series solely use self-reported survey data (but anchors national distributions to per adult national income). Survey income with fixed-average-income series assume same average income for all countries (thereby neutralizing between-country inequality).

0.35
0.40
0.45
0.50
0.55
0.60
0.65
0.70
0.75
1990 1995 2000 2005 2010 2015
Figure 11c. Decomposing Gini coefficients in the Middle East, 1990-2016
Gini coef. (national income)
Gini coef. (fiscal income)
Gini coef. (survey income)
Gini coef. (survey, fixed-average)
Distribution of income (before taxes and transfers, except pensions and unempl. insurance) among equals-plit adults (income of households divided equally among adult members). Pretax national income estimates combine survey, fiscal, wealth and national accounts data. Fiscal income estimates combine survey and income tax data (but do not use wealth data to allocate tax-exempt capital income). Survey income series solely use self-reported survey data (but anchors national distributions to per adult national income). Survey income with fixed-average-income series assume same average income for all countries (thereby neutralizing between-country inequality).

57%
58%
59%
60%
61%
62%
63%
64%
65%
66%
67%
68%
69%
70%
1990 1995 2000 2005 2010 2015
Figure 12a. Decomposing the evolution of Mid. East top 10% income share
Top 10% (observed, benchmark)
Top 10% (simulated, within-country inequality fixed at 1990 level)
Distribution of national income (before taxes and transfers, except pensions and unempl. insurance) among equals-plit adults (income of households divided equally among adult members). Corrected estimates combine survey, fiscal, wealth and national accounts data. Simulated series assume within-country inequality fixed at 1990 level (so that evolution is entirely driven by trends in between-country inequality).

25%
26%
27%
28%
29%
30%
31%
32%
33%
34%
35%
36%
1990 1995 2000 2005 2010 2015
Figure 12b. Decomposing the evolution of Mid. East top 1% income share
Top 1% (observed, benchmark)
Top 1% (simulated, within-country inequality fixed at 1990 level)
Distribution of national income (before taxes and transfers, except pensions and unempl. insurance) among equals-plit adults (income of households divided equally among adult members ). Corrected estimates combine survey, fiscal, wealth and national accounts data. Simulated series assume within-country inequality fixed at 1990 level (so that evolution is entirely driven by trends in between-country inequality).

Country Year Bottom 50%
Middle 40% Top 10% Top 1% Gini P10/
averageP50/
averageP90/
averageP99/
averagePareto b(10%)
Pareto b(50%)
Pareto b(90%)
Pareto b(99%)
1995 13% 33% 53% 19% 61% 16% 46% 188% 849% 6.7 3.8 2.7 2.22005 13% 35% 51% 17% 60% 16% 52% 183% 791% 6.9 3.3 2.6 2.22015 12% 36% 53% 18% 62% 14% 48% 190% 803% 7.8 3.7 2.6 2.2
1999 17% 32% 51% 19% 56% 25% 50% 165% 814% 4.3 3.3 2.9 2.42002 18% 33% 49% 18% 55% 26% 53% 169% 783% 4.2 3.1 2.7 2.32014 18% 33% 49% 19% 54% 27% 54% 163% 762% 4.0 3.0 2.8 2.52008 18% 34% 49% 19% 54% 27% 53% 167% 761% 4.1 3.1 2.7 2.42009 19% 35% 46% 17% 52% 28% 56% 170% 719% 3.9 2.9 2.6 2.32015 18% 33% 49% 19% 54% 27% 54% 163% 762% 4.0 3.0 2.8 2.5
2010 14% 35% 51% 18% 59% 17% 51% 183% 779% 6.4 3.4 2.6 2.32013 17% 35% 48% 16% 55% 22% 54% 180% 748% 4.9 3.1 2.5 2.2
Iraq 2007 15% 32% 53% 22% 59% 20% 50% 165% 823% 5.4 3.4 3.0 2.7
1992 15% 33% 51% 20% 58% 21% 50% 170% 780% 5.3 3.4 2.8 2.62002 18% 36% 46% 15% 53% 25% 56% 182% 674% 4.3 2.9 2.4 2.22006 17% 36% 47% 15% 54% 23% 55% 186% 700% 4.8 3.0 2.4 2.22008 18% 35% 47% 16% 54% 25% 56% 178% 707% 4.3 3.0 2.5 2.22010 17% 32% 52% 22% 57% 22% 52% 158% 816% 4.9 3.2 3.1 2.72013 17% 35% 48% 16% 54% 23% 55% 181% 710% 4.8 3.0 2.5 2.3
2007 5% 26% 69% 21% 78% 7% 16% 250% 1030% 15.3 11.8 2.6 2.12013 7% 29% 64% 20% 74% 10% 20% 261% 917% 11.6 9.5 2.3 2.2
2005 13% 35% 52% 22% 62% 15% 48% 180% 760% 7.2 3.6 2.7 2.82006 13% 35% 52% 21% 61% 16% 49% 180% 751% 7.1 3.5 2.7 2.82007 11% 33% 57% 24% 66% 12% 42% 184% 847% 9.5 4.2 2.9 2.82008 11% 32% 57% 24% 66% 11% 42% 184% 856% 9.7 4.3 2.9 2.82009 11% 33% 57% 23% 66% 12% 42% 185% 855% 9.5 4.2 2.9 2.72010 11% 32% 57% 23% 66% 12% 42% 185% 863% 9.6 4.3 2.9 2.72011 11% 32% 57% 23% 66% 11% 41% 185% 867% 9.7 4.3 2.9 2.72012 10% 32% 58% 24% 67% 11% 41% 186% 874% 9.8 4.4 2.9 2.72013 11% 32% 57% 23% 67% 11% 41% 186% 873% 9.7 4.4 2.9 2.72014 11% 32% 57% 23% 66% 12% 42% 185% 861% 9.6 4.3 2.9 2.7
Oman 2010 8% 35% 57% 18% 68% 6% 40% 212% 878% 18.2 4.5 2.5 2.0
1996 15% 37% 48% 14% 57% 17% 54% 201% 701% 6.3 3.2 2.3 2.01997 15% 37% 48% 14% 57% 17% 53% 201% 706% 6.4 3.2 2.3 2.01998 15% 37% 49% 14% 58% 17% 53% 200% 714% 6.6 3.2 2.3 2.02004 15% 36% 49% 15% 58% 16% 53% 191% 751% 6.8 3.2 2.4 2.02005 14% 37% 50% 16% 59% 15% 51% 203% 743% 7.4 3.4 2.3 2.12006 14% 36% 50% 15% 59% 16% 51% 193% 761% 7.0 3.4 2.5 2.02007 13% 35% 52% 17% 62% 14% 47% 198% 790% 8.1 3.7 2.5 2.12008 14% 36% 50% 14% 59% 16% 50% 199% 739% 7.0 3.5 2.4 2.02010 13% 35% 52% 17% 61% 14% 48% 196% 782% 7.6 3.7 2.5 2.22011 13% 36% 51% 16% 60% 15% 49% 198% 745% 7.3 3.5 2.4 2.1
2007 8% 26% 66% 23% 73% 9% 31% 178% 1112% 12.6 6.0 3.5 2.12012 10% 23% 67% 27% 71% 12% 33% 133% 1281% 9.0 5.6 4.7 2.1
SaudiArabia 2008 8% 30% 62% 20% 72% 9% 28% 223% 964% 12.1 6.5 2.6 2.0
Syria 2004 14% 37% 49% 15% 58% 16% 51% 201% 624% 6.7 3.3 2.3 2.4
1994 8% 31% 61% 28% 71% 7% 36% 165% 970% 15.4 5.1 3.5 2.92002 14% 31% 55% 22% 62% 17% 45% 169% 909% 6.3 3.8 3.1 2.52003 14% 31% 55% 22% 61% 18% 46% 167% 910% 6.1 3.8 3.1 2.42004 14% 32% 53% 21% 60% 18% 48% 173% 815% 6.1 3.6 2.9 2.62005 15% 34% 51% 19% 58% 19% 51% 177% 797% 5.9 3.3 2.7 2.42006 16% 34% 50% 18% 57% 21% 52% 176% 793% 5.3 3.2 2.7 2.32007 16% 35% 49% 17% 56% 21% 53% 176% 751% 5.2 3.1 2.6 2.32008 16% 34% 50% 18% 57% 20% 53% 173% 748% 5.4 3.2 2.7 2.42009 15% 33% 52% 19% 58% 20% 51% 171% 858% 5.6 3.3 2.8 2.32010 16% 33% 51% 20% 58% 21% 51% 171% 793% 5.3 3.3 2.8 2.52011 16% 33% 51% 19% 58% 20% 50% 173% 811% 5.4 3.4 2.8 2.42012 16% 33% 51% 20% 58% 21% 50% 172% 772% 5.2 3.3 2.8 2.62013 16% 33% 51% 19% 57% 22% 51% 169% 761% 4.9 3.3 2.8 2.52014 15% 33% 52% 21% 59% 21% 50% 166% 793% 5.3 3.4 2.9 2.62015 15% 33% 53% 22% 59% 20% 50% 165% 802% 5.4 3.4 3.0 2.72016 15% 31% 54% 23% 60% 20% 48% 159% 814% 5.4 3.5 3.2 2.9
1998 9% 30% 61% 20% 69% 11% 32% 210% 953% 9.7 5.7 2.7 2.12009 11% 33% 56% 16% 65% 18% 36% 219% 798% 6.1 5.0 2.4 2.0
Yemen 2006 14% 37% 50% 16% 59% 15% 51% 201% 658% 7.2 3.4 2.3 2.4
Table 3. Country-level Income Inequality Series: Income Shares and Other Indicators
Bahrain
Distribution of national income (before taxes and transfers, except pensions and unemployment insurance) among adults. Corrected estimates combining survey, fiscal, wealth and national accounts data. Equal-split series (income of married couples divided by two). For similar series on the distribution of raw survey income (before any correction) and fiscal income (before wealth correction), see appendix.
UAE
Egypt
Iran
Jordan
Kuwait
Lebanon
Palestine
Qatar
Turkey