measuring local-level religiosity using administrative
TRANSCRIPT

Measuring Local-Level Religiosity Using
Administrative Data and Language Model
Classification∗
Jeffrey L Jensen† Daniel Karell‡ Cole Tanigawa-Lau§
Nizar Habash¶ Mai Oudah‖ Dhia Fairus shofia Fani∗∗
June 2, 2020
∗The first three authors equally share lead authorship and are listed alphabetically. We thank BlaineRobbins and our team of Indonesian research assistants. Upon publication, the data and programmingcode used in this study will be made publicly available for replication purposes.†Division of Social Science, New York University Abu Dhabi, Abu Dhabi, UAE; [email protected]‡Corresponding Author. Department of Sociology, Yale University, USA; [email protected]§Department of Political Science, Stanford University, USA; [email protected]¶Division of Science, New York University Abu Dhabi, Abu Dhabi, UAE; [email protected]‖Division of Science, New York University Abu Dhabi, Abu Dhabi, UAE; [email protected]∗∗Independent Researcher; [email protected]
1

Abstract
Social scientists studying religiosity often want to measure this sensitive and complex at-
tribute discreetly. To aid the measurement of religiosity and similar attitudes and beliefs,
we introduce a methodological approach for using administrative data as an unobtrusive
source of revealed preferences. Probabilistic language models identify signals of religiosity
in individuals’ names, which are then linked to residential addresses to capture geographic
variation across levels of spatial aggregation. We demonstrate our approach by classifying
over 1.3 million Indonesian names as either of Arabic or non-Arabic origin, and measure
the former’s similarity to Quranic names. Arabic names, we posit, indicate religiosity in
this non-Arabic speaking, Muslim-majority country; those evoking the Quran point to
heightened religiosity. The results of criterion validity tests support our methodology.
The approach highlights the utility of administrative data for measuring individuals’ at-
titudes, the rich information conveyed by names, and the potential for language models
to advance sociological methodology.
Keywords
Administrative data; Language model; Personal names; Religiosity; Indonesia
2

1. Introduction
The determinants and consequences of religious attitudes and beliefs are a core area
of social scientific study. Yet our ability to empirically study questions of religion are
limited in part by the difficulty in measuring religious attitudes and beliefs.1 While
the most common approach in previous research has been to directly ask subjects of
interest their attitudes, beliefs, and behaviors using surveys,2 a number of scholars have
advocated the creation and collection of “unobtrusive” measures of religiosity that do not
require direct interaction with the subject of study (e.g., Finke and Bader 2017; Webb
et al. 2000). Fortunately for social scientists studying religion—as well as for scholars
interested in similar kinds of attitudes and beliefs—an opportunity has arisen with the
increasing availability of high-quality administrative data. These kinds of data, we show,
enable the creation of unobtrusive measures of religiosity that can complement standard
survey-based indices. Specifically, we present a method for using information provided by
administrative sources to measure fine-grained geographic variation in religiosity, or the
expression of religious belief and practice. Our method builds on recent research showing
that in particular contexts individuals’ names signal meaningful characteristics of their
family background (e.g., cultural, ethnic, racial identities). These signals allow researchers
to construct measurements of local group compositions (e.g., Enos 2016; Grofman and
Garcia 2014; Harris 2015; Hofstra and de Schipper 2018; Imai and Khanna 2016).3
In brief, our approach discerns the linguistic origins of over a million individuals’
names, and, by linking these names to residential addresses, we calculate the distribution
of religiosity and religious intensity at various levels of geographic aggregation, down to
1As Finke and Bader (2017: 3) put it in their recent review of the large literature on measuringreligiosity: “Religion is a particularly sensitive and intricate domain that packages together religiouspractices with beliefs about the nature of the deity or deities, morality, literalism, visions of the afterlife,ideas about the meaning of life, and a host of other factors. No single measure can hope to capture thetotality of an individual’s belief or provide a single “number” that represents religion.”
2According to Finke and Bader (2017: 4), “Approximately 95 percent of the data files currently heldin the Association of Religion Data Archives (theARDA.com) were generated by surveys.”
3This recent work draws on a rich literature on the importance of names as markers of identity ineconomics (e.g., Bertrand and Mullainathan 2004; Rubinstein and Brenner 2014; Olivetti and Paserman2015), and, especially, in sociology (e.g., Lieberson 2000; Lieberson and Bell 1992; Zelinsky 1970;Lieberson and Mikelson 1995; Sue and Telles 2007; Gerhards and Hans 2009).
3
the residential block level, across a sub-national region. We demonstrate how to do this
using administrative records from the Indonesian regency of Indramayu, an area of West
Java that is home to approximately 1.7 million residents.
The core of this article explains how our approach leverages naming motivations and
meanings, which of course exist across all societies, albeit in unique forms, to create
novel measures of intricate attitudes across space. In Indramayu, nearly all residents are
culturally Muslim, but their names have origins in various languages, such as Arabic,
Javanese, and Indonesian. Hence, the choice of parents to give their child an Arabic
name, rather than a name from the regional Javanese or Indonesian languages, indicates
that the parents held religious beliefs since Arabic is tightly coupled with Islam (Kuipers
and Askuri 2017). Moreover, if the Arabic name invokes a name from the Quran, the
Islamic holy book, it suggests a more intense degree of religiosity. The latter part of the
article presents criterion validity tests of these assumptions about naming motivations—
and, thereby, our measures—using two other databases: another administrative record
capturing residents’ religious behavior and a government registry of enrollment in religious
schools.
Variation in naming conventions is useful for measurement if researchers know the
type of each name in a database, such as whether a name is Arabic or not. Thus, a
central contribution of our study is to help introduce probabilistic language models to
social scientists. Language models (LMs) are well-known in computational linguistics
(Jurafsky and Martin 2019)—and familiar to anyone using tools for speech recognition,
spelling and grammatical correction in word processing applications, and the automatic
completion of email messages—but they remain relatively uncommon in social science
research.4
In this article, we first offer an explanation of LMs that is accessible to a wide range of
social scientists to help readers assess whether LMs can be useful for their own research.
4A search in April 2020 for the bigram term “language model” in articles published in AmericanSociological Review, American Journal of Sociology, Social Forces, American Political Science Review,American Journal of Political Science, Sociological Methods & Research, Sociological Methodology, andPolitical Analysis returned two results. One result in fact did not use the phrase “language model” inthe article text and the other result, Goldberg et al. 2016, used the term “language model” to refer to aconceptual representation of language use rather than to formal LMs.
4

Then, we show the efficacy of LMs in classifying large administrative databases of names,
which can be challenging to categorize because they are sometimes written in varying and
unexpected ways. Yet, we believe LMs’ potential contributions to social scientific research
methods extend beyond classification, especially because of their generative nature. That
is, LMs predict the next chunk of language—a word, phrase, or sentence, for example—
given the preceding linguistic sequence. We briefly discuss how LMs’ generated language
could be of unique use to social scientists in the conclusion.
Our approach has a number of other features worth highlighting. First, it advances the
growing body of research showing how to exploit the increasing availability of voluminous
highly detailed individual-level administrative data, which is driven in part by increasing
digitization efforts and digital record keeping.5 This is particularly important in data-
scarce environments in which few surveys exist and are expensive to administer, and
government-provisioned public data (e.g., church attendance, income) is limited or of
poor quality. Specifically, we provide empirical evidence that administrative databases
can be sources of revealed preferences, and potentially lead to less measurement error
than often occurs when surveys ask subjects questions of a sensitive nature.6
Second, our approach advances the literature analyzing names as signals of attitudes,
beliefs, and non-lineage based identity within and across groups. To our knowledge,
this literature has not yet examined whether individuals’ names signal religiosity, and
whether they can be used to measure the geographic distribution of people with strong
religious attitudes, as we do. Our strategy for doing so rests on two assumptions: (1) the
intergenerational transmission of religiosity from parent-to-child is high; and (2) given
names are an indicator of the religious attitudes of parents. The first assumption is
supported by an extensive literature demonstrating that parents try to pass down their
religious beliefs (e.g., Bisin, Topa and Verdier 2004) and that parental religiosity is a
strong predictor of their children’s religious attitudes (e.g., Bengtson, Harris and Putney
5For a review of social science research using large-scale administrative data, see Salganik 2018.6As Finke and Bader (2017: 3) point out, “[s]ocial surveys, the dominant method for collecting social
data, suffer from a long list of ‘artifacts’ that can alter outcomes, such as question ordering, the responsecategories offered, the interviewers used, and the question wording. Moreover, asking respondents toreveal intimate experiences with the sacred requires a trust seldom established in a ten-minute phoneinterview.” See also Brenner (2014) for issues of using surveys to measure religiosity in Muslim countries.
5

2017).7 Similarly, decades of empirical work in political science have shown a strong
correlation between the political attitudes of parents and their children (e.g., Niemi and
Jennings 1991; Zaller 1992).8
The validity of the second assumption—the extent to which given names reflect a
meaningful revealed preference of the parents’ religious attitudes and the contexts in
which parents may use names for this purpose—is an open question. It is indirectly
supported by research showing how parents use given names to publicly signal or even
obscure their cultural identity (e.g., Abramitzky, Boustan and Eriksson 2020; Fryer
and Levitt 2004). In addition, the popularity of Arabic names is rising in Indonesia
(Kuipers and Askuri 2017) at the same time that religiosity is increasing (Menchik
2016). Our validity criterion tests offer additional support that this second condition is
met and that our names-based measure is capturing religious attitudes. As a result, our
work contributes to the names-as-data literature by providing evidence that given names
capture the persistent lineage of attitudes, beliefs, and identities, such as religiosity.
With the increasing availability of administrative data, our validation analysis should
give confidence to other scholars that the prevalence of given names in a group can reflect
otherwise difficult-to-measure behaviors and attitudes of group members (and not just
“sticky” heritable traits, such as ethnicity).
Third, we show how our approach scales very inexpensively. Surveys with represen-
tative samples are both expensive per observation and difficult to acquire at low levels of
geographic aggregation (e.g., county-level representative surveys in the United States).
Given the increasing availability of administrative data across the world, we provide an
inexpensive method—especially as the number of observations rises—for measuring atti-
tudes and beliefs at various levels of spatial or administrative aggregation. For example,
in Indonesia, there are four distinct sub-regency administrative levels; we show that we
can generate valid continuous measures of religiosity for each one. This is noteworthy be-
7Also see the report from the Pew Research Center, “One-in-Five U.S. Adults Were Raised in Inter-faith Homes (2016).”
8There is a debate in this literature on the extent to which this relationship reflects socialization andother family-level environmental factors versus genetics (e.g., Hibbing, Smith and Alford 2013; Fowlerand Dawes 2013).
6

cause the lowest administrative level—the Rukun Tetangga or RT —has more than 10,000
units and, on average, slightly more than 100 adult residents.
Finally, our method has numerous applications for social science research both gen-
erally and specifically for Indonesia. For instance, it illustrates how Arabic and Quranic
names can be exploited to measure religiosity not only in Indonesia, but also in other
non-Arabic, Muslim populations (e.g., Albania, Bangladesh, Bosnia, Malaysia, Pakistan,
Turkey, the Caucasus, Central Asian countries, and parts of Canada, India, Western
Europe, and the United States). Indeed, our approach could be used when studying
any population in which group members give their children distinctive names to signal
membership.9 Furthermore, the following analysis demonstrates how distinct insights
into names and attitudes, beliefs, and identity can be gleaned from culturally-significant
artifacts containing “dictionaries” of names, such as spiritual texts and canonical works
of literature. For example, the adoption of names from the New Testament or Torah can
convey information not only about religious beliefs, but also the intensity of these beliefs.
Our method is also useful for scholars of Indonesia. As we explain in the next section,
available administrative data has been underutilized, especially for studying key ques-
tions such as the relationship between democracy and Islam. In addition to being the
largest Muslim and fourth most populous country, Indonesia is an extremely diverse, de-
veloping country that has recently transitioned to democracy. It is sharply divided on the
importance of Islam in society, and Islamic political parties and politicians are electorally
successful. The approach we demonstrate here could aid the many scholars studying eco-
nomic, political and social development in this important country (e.g., Banerjee et al.
2018; Bazzi, Koehler-Derrik and Marx 2020; Martinez-Bravo, Mukherjee and Stegmann
2017; Olken 2010; Pepinsky, Liddle and Mujani 2018; De Juan, Pierskalla and Vullers
2015).
In the next section, we describe our data and context. Following this, we explain the
LM that allows us to classify names and present the results of our classification analysis.
We use these values to estimate geographic variation in the incidence of religiosity and
9See, for example, Fryer and Levitt (2004) on names in African-American communities.
7

religious intensity across each of these administrative districts in the Indramayu Regency.
Then, we validate our religiosity measure by analyzing its ability to predict variation in
(1) the proportion of local residents who registered to perform the Hajj and (2) the
proportion of total school-aged students enrolled in Islamic schools. We end with a brief
discussion and conclusion.
2. Names in Indramayu Regency, Indonesia
In this section, we describe the Indonesian context and the specific data we use to
demonstrate the usefulness of administrative data and computational name-classification
methodologies for measuring the local incidence of religiosity. As mentioned earlier, all
of our data come from the Indonesian regency of Indramayu. In this country of more
than 260 million people and 17,000 islands, a regency is the second highest administrative
level (below a province).10 Indramayu, part of West Java, the country’s most populous
province, is less than 200 kilometers from Jakarta (the capital), Bekasi, and Bandung,
three of the four largest cities in Indonesia. Yet, despite its proximity to these major
urban centers, it is poorer and more rural than the average regency in Indonesia.11 It
is nearly entirely Muslim.12As a result, our data on individuals residing in Indramayu
comprises primarily Indonesians identified as Muslims, although, of course, we do not
know about their religiosity.
2.1. Voter registration data
Our data on Indramayu’s residents come from the complete list of registered voters as
of the 2015 elections, procured after a formal request to the Committee of Elections of
10Specifically, each regency is a part of a province. As of 2019, there are 34 provinces and 514 regencies(including municipalities) in Indonesia.
11For example, only 44% of the population are part of formal income-bearing activities, mostlyfarming. In 2009, approximately 35% of its residents were living in poverty. The regency hasthe lowest Human Development Index of all regencies the province of West Java (Bappeda 2016,http://bappeda.jabarprov.go.id/documents/rancangan-rpjmd-kabupaten-indramayu-2016-2021/; BadanPusat Statistik (BPS) [Indonesian Bureau of Statistics]).
12Indramayu is approximately 99% Muslim (BPS).
8

Indramayu Regency.13 In Indonesia, all individuals eligible to vote who have the national
identity card, the Kartu Tanda Penduduk (KTP), are automatically registered to vote.
As a result, the database omits three kinds of people who might be residing in Indramayu.
First, individuals who correctly do not have the KTP, such as children and foreigners.14
Second, individuals who should have the KTP but do not. Comprising primarily elderly
and extremely impoverished residents, this group is estimated to be a very small minor-
ity. Not only is the KTP required for voting, it is critical to access all public services
in Indonesia, including public housing and other anti-povery programs (OECD 2019).
Lastly, adults who live in Indramayu but are registered to vote in a different regency.
While potentially problematic for our analyses, we expect this population to be very
small because Indramayu experiences little in-migration.15 Thus, we are confident that
the registered voter database, containing the full person names for more than 1.3 million
individuals, is a nearly complete record of adult residents of Indramayu.
For the purposes of extending our approach to other research settings, it is impor-
tant to emphasize that, its completeness aside, the voter registry mirrors administrative
databases in other parts of the world, such as social welfare rolls and records of doc-
umented immigrants. Namely, it provides rich data on many individuals but it is not
a probabilistic random sample of a population. As a result, it would not be ideal for
research questions requiring the generalization of results to a broader population, but is
useful for within-sample comparisons (e.g., the variation in religiosity in the sample) and
generating transportable insights (Salganik 2018: 33).
In addition to individuals’ full names, this registered voter database provides each
person’s residential street address. The address information allows us to place each
person within Indramayu’s various sub-regency administrative boundaries (i.e., district
(Kecamatan), village (Desa), sub-village (Rukun Warga, or RW ) and even residential
13Our use of identifiable data was approved by the [anonymized] IRB after we implemented protocolsto protect the data and confirmed that no information about individuals would be disseminated.
14The KTP, which Tipple and Speak (2009: 177) call the “sole defining element of citizenship inIndonesia,” is issued to every Indonesian citizen at the age of 17 or when they are married.
15According to the Indonesian Census, the population of Indramayu changed minimally between 2005and 2015 (over the same period in which Indonesia’s population increased 17%). This aligns with ourknowledge of the regency’s migration patterns: out-migration is common, while in-migration is not.
9

block level (Rukun Tetangga, or RT ). The database includes 30 districts, 298 villages,
2,380 RWs and 10,192 RTs. Our main task is to derive religiosity values for each of these
administrative levels using the names and addresses of the residents.
2.2. Naming conventions in Indonesia
Consistent with the country’s enormous diversity, naming conventions in Indonesia vary
by geography and ethnicity. However, most Indonesian names do not include a family
name. Instead, full names, which commonly contain two to four single names (e.g.,
“Abdul Hamid bin Mustofa” contains four unique single names),16 usually include only
given names, although a single name in a full name might at times be derived from a
name in the person’s father’s full name. Both these “inherited” given single names and
the other given single names typically reflect the cultural, ethnic, and religious identities
or geographic locations of the parents. For example, particular spellings, such as ending
a single name with an “o”, often indicates a Javanese male name (Uhlenbeck 1969).
The small minority of Christians will often give their children names from the Bible
(e.g., John, Paul). Parents with a globalized orientation sometimes opt to give a name
evocative of “Western” culture (Kuipers and Askuri 2017).17
Despite the prevalence of Islam, especially in West Java, and the importance of names
in Islam,18 giving a child an Arabic or Quranic name is far from ubiquitous among Indone-
sian Muslims. Arabic names, however, are associated with Islam. They signal Muslim
piety (Kuipers and Askuri 2017) in a country where ethnic and cultural identities remain
strong and compete with religious identities (Pepinsky, Liddle and Mujani 2018).19 It is
this signal given by Arabic (and Quranic) names that we use to construct a measure of
16While Indonesians’ complete names once typically consisted of only one given name, this namingpractice has been in rapid decline (Kuipers and Askuri 2017). In the Indramayu voter registry, only20% of full names are single terms.
17Parts of Indonesia are attempting to ban the giving of so-called Western names (Llewellyn 2018).18Islam places particular importance on the names bestowed by parents on their children. It is
reported in the Hadith that the Prophet Muhammad said, “You will be called on the Day of Res-urrection by your names and the names of your fathers, so have good names.” See, for example,https://archive.islamonline.net/?p=775.
19For example, Llewellyn (2018), when profiling a religious figure in the Indonesian city of Medan,Mohammad Hamdan, noted that Hamdan’s parents gave him the Arabic name meaning “praiseworthy”rather than “the Indonesian word for ‘praise’ which is puji (also a common Indonesian name) . . . to showtheir belief in Islam.”
10

religiosity among residents.
3. Name classification method
This section introduces probabilistic language models (LMs), and explains how we used
them to identify signals of religiosity in the names of Indramayu’s residents. In brief, we
classified Indramayu residents’ names as having an Arabic origin or an origin in another
language with character n-gram LMs. We additionally determined how evocative each
individual’s full name is of the Quran, or the name’s “Quranic-ness”.
Today, most of us encounter LMs when writing emails—an LM is suggesting likely
next words given what we have already written. However, despite their prevalence in
computational linguistics and email applications, LMs have yet to become part of social
science’s methodology toolkit (see Footnote 4). For this reason, we offer a description of
LMs that is intended to be accessible to a broad range of social scientists.
3.1. Overview of approach
The Indramayu’s voter registry contains over 1.3 million individuals’ full names, ranging
in length from one single name to a sequence of 12 single names (e.g., “Abdul”, “Abdul
Hamid bin Mustofa”), comprising over 149 thousand unique single names. Our classi-
fication goal is to label each full name as having either an Arabic origin (Arabic) or
non-Arabic origin (Other), and associate it with a Quranic name similarity score. Since
manual coding of all these names is not feasible in terms of time and cost, we break the
problem into three parts.
1. Supervised single name classification by manually coding a fraction of the
unique single names and automatically classifying the rest.
2. Full name classification using weighted voting combination of single-name classes.
3. Quranic name similarity calculation using cross-linguistic name matching.
11

3.2. Part 1: Supervised single name classification
3.2.1. Background and related work
Within the substantial computational linguistics literature that undertakes language and
dialect identification in text (Gamallo, Pichel and Alegria 2017; Jauhiainen, Linden and
Jauhiainen 2017; Jauhiainen et al. 2019; Ramisch 2008; Salameh, Bouamor and Habash
2018; Vatanen, Vayrynen and Virpioja 2010; Zaidan and Callison-Burch 2014), a small
portion examines the specific question of name origins (Fu, Xu and Uszkoreit 2010; Chen
et al. 2006). However, these name-origin efforts largely follow the broader computational
linguistics scholarship and rely on supervised machine learning (ML) techniques to learn
from a training dataset how to classify a name. Moreover, they usually use character
n-grams, a representation of words in terms of sequences of sub-word characters, as text
features for ML.
We follow the research using character n-grams in ML and employ character n-gram
LMs to accomplish the first part of our approach, classifying single names. These LMs
estimate the probability of a sequence of characters given the context, which, our case, is a
preceding sequence of characters (Brants et al. 2007; Jurafsky and Martin 2019; Mikolov
et al. 2010). Our use of character-level LMs is specifically motivated by, first, previous
studies showing that LM inferences of probability are very helpful in the task of language
and dialect identification (Gamallo, Pichel and Alegria 2017; Vatanen, Vayrynen and
Virpioja 2010; Ramisch 2008), and, second, Jauhiainen et al.’s (2017) findings that
character-based calculations of probability are best when working with short texts, as we
do when classifying single names (e.g., “Abdul”, “Jawad”).
We are further motivated to use character-level LMs by how they address variation in
naming practices. Indonesians, like any other society, have developed numerous spelling
variations of names. A name of Arabic origin, for instance, may appear in Indramayu
with several different spellings, each differing by only one or two characters. Research in
computational linguistics indicates that because character-level LMs leverage sub-word
information, they are particularly useful at capturing local variations of base word struc-
12

tures (Salameh, Bouamor and Habash 2018).20 For example, character-level LMs, unlike
word-level models, do not face the challenge of out-of-vocabularly tokens—units that do
not appear in the training data—which often occurs when analyzing non-formalized ar-
eas of language, such as naming practices and dialects, at the level or words or phrases
(Habash, Diab and Rambow 2012).
3.2.2. Language model classification
Using an LM to predict whether the name of an Indramayu resident belongs to a certain
class (i.e., Arabic, Other) based on the name’s characters can be generally conceptu-
alized as first learning how Indramayu’s residents use characters to form types of names
and then modeling the transformation of “noisy” output—in this case, an Indonesian
name of Arabic origin spelled in a dozen different ways—back into an initial input, or the
original Arabic name. To have a more detailed understanding of the LM approach, it is
useful to think of a two-step process.
First, like other supervised ML approaches, a training set is used to develop, or train,
an LM for each class of interest. In our case, the training set is a sample of names
from Indramayu’s roster of registered voters that a team of local research assistants have
labeled by class—of Arabic origin (Arabic) or of non-Arabic origin (Other). One of
our LMs uses the Arabic labeled subset to model the probability of an Arabic name
using its sequence of characters; the other LM does the same for the Other subset.
The second step is LM perplexity-based classification. Given an input name of un-
known class, the LM trained for Arabic origin names examines the sequence of characters
in the name and assigns a probability to whether that character sequence is “spelling
out” a name belonging in the Arabic class. Similarly, the LM trained for non-Arabic
origin names examines the sequence of characters in the name and assigns a probability
20A recent study on Arabic dialects, using a corpus containing six (rather than two) classes, foundthat a character-level LM achieves higher accuracy than a Multimonial Naıve Bayes (MNB) classifier,a classification model social scientists have used more frequently than LMs. (The MNB was found tooutperform other classification models, such as Linear Support Vector Machines, Convolutional NeuralNetworks, and bi-directional Long Short-Term Memory models.) Combining the LM with the best-performing MNB increased the percent of correct predictions than the LM alone, albeit from 92.7 to 93.6(Salameh, Bouamor and Habash 2018).
13

to whether that sequence is generating a name in the Other class. Following common
practice, we use the perplexity score, or the inverse probability of the name (in our case),
normalized by the number of characters in the name (since we are using character-based
LM) (Gamallo, Pichel and Alegria 2017; Jauhiainen, Linden and Jauhiainen 2017;
Ramisch 2008; Vatanen, Vayrynen and Virpioja 2010). Since minimizing the perplexity
is the same as maximizing the probability, the LM assigning the lowest perplexity score
is considered superior, and the name is assigned the LM’s class label.21
While the perplexity-based classification can be applied to any name, it is important
to note one efficient shortcut—performing “look-up”. Namely, when classifying a name
from the list of single names, we can simply check if that name appears among the
names in the training data, or whether it is “in-vocabulary” (INV). If it is, we assign its
human-generated label. For names not in the training set—“out-of-vocabulary” (OOV)
names—we use the perplexity-based classification method.
In sum, the LM approach requires researchers to accomplish two tasks to develop the
models and make predictions: (a) compile a list of labeled data, which, in our case, is a
collection of names sampled from the voter registry and annotated by local experts; and
(b) build and refine the models, which involves tuning LM hyperparameters, such as the
n-gram length, or the number of characters in a sequence the LMs should consider to
make the best predictions. We explain how we accomplished these two tasks in the next
two subsections.
3.2.3. Data selection and coding
As explained above, we obtained names of Indramayu’s residents from the complete
database of registered voters in the regency in 2015. The registry contains 1,314,707 full
names (513,527 unique full names). In order to increase the size of the data used to
train and evaluate our models, we supplemented this main list of names with a roster
containing 72,691 full names of expatriate Indramayu migrants provided by the regency’s
21Comparing perplexity scores across models is generally not valid, unless the models share vocabu-laries, as ours do. The vocabulary of the two LM consist of the Roman script characters used to writethe names.
14

ClassDataset Count Unique Arabic Other
All single names 1,381,923 149,283
TrainRand 43,239 3% 9,323 250 3% 9,073 97%TrainFreq 1,035,882 75% 9,962 1,050 11% 8,912 89%Test 27,640 2% 11,446 1,297 11% 10,149 89%
Table 1: The single-name datasets. The table presents the statistics on all the singlenames as well as the three datasets we sampled for manual coding. For each dataset,the table presents the total count of single names (Count) and the number of uniquesingle names (Unique). The percentages next to the counts are derived by comparing thesubsets to the entire collection of single names. For the coded datasets, the table presentsthe proportions of Arabic and Other classes.
Department of Migrant Labor. The total corpus of names contained 568,195 unique
full names comprising 1,381,923 non-unique single names (149,283 unique single names).
The names are written in Roman alphabet, the standard script for administrative and
commercial business in Indonesia.
We manually coded three subsets of single names that differ in how they were selected
from the corpus. The first subset, “TrainRand”, contained a random sample of about
10,000 names from the list of unique single names. The second subset, “TrainFreq”, was
selected to maximize the coverage of the names. It comprised approximately the 10,000
most frequent unique single names, corresponding to 75% of all the non-unique single
names. Finally, we generated a subset for testing our models, “Test”. Since our goal was
to label full names, we randomly selected approximately 10,000 names from the list of
unique full names (about 2%), then converted these names into a list of unique single
names. The second and third columns in Table 1 show how many unique names were in
each dataset and how many (non-unique) times they appear in the corpus.
A team of five Indramayu residents coded the sampled names. All five were recent col-
lege graduates raised in Indramayu; three self-identified as Muslim and two self-identified
as Christian. The annotators assigned each single name to either the class Arabic, if
locals consider the name as having an Arabic origin, or Other, if the name has a non-
Arabic origin, such as Indonesian or Javanese. After an initial round of annotation, the
15
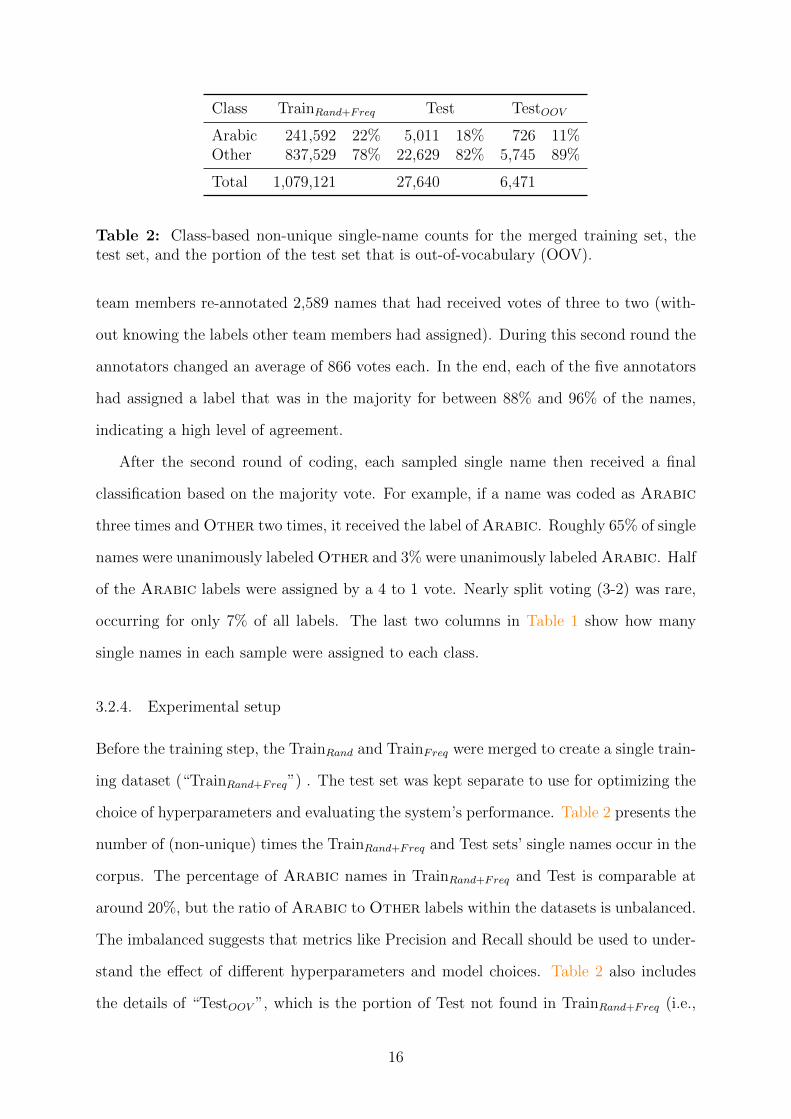
Class TrainRand+Freq Test TestOOV
Arabic 241,592 22% 5,011 18% 726 11%Other 837,529 78% 22,629 82% 5,745 89%
Total 1,079,121 27,640 6,471
Table 2: Class-based non-unique single-name counts for the merged training set, thetest set, and the portion of the test set that is out-of-vocabulary (OOV).
team members re-annotated 2,589 names that had received votes of three to two (with-
out knowing the labels other team members had assigned). During this second round the
annotators changed an average of 866 votes each. In the end, each of the five annotators
had assigned a label that was in the majority for between 88% and 96% of the names,
indicating a high level of agreement.
After the second round of coding, each sampled single name then received a final
classification based on the majority vote. For example, if a name was coded as Arabic
three times and Other two times, it received the label of Arabic. Roughly 65% of single
names were unanimously labeled Other and 3% were unanimously labeled Arabic. Half
of the Arabic labels were assigned by a 4 to 1 vote. Nearly split voting (3-2) was rare,
occurring for only 7% of all labels. The last two columns in Table 1 show how many
single names in each sample were assigned to each class.
3.2.4. Experimental setup
Before the training step, the TrainRand and TrainFreq were merged to create a single train-
ing dataset (“TrainRand+Freq”) . The test set was kept separate to use for optimizing the
choice of hyperparameters and evaluating the system’s performance. Table 2 presents the
number of (non-unique) times the TrainRand+Freq and Test sets’ single names occur in the
corpus. The percentage of Arabic names in TrainRand+Freq and Test is comparable at
around 20%, but the ratio of Arabic to Other labels within the datasets is unbalanced.
The imbalanced suggests that metrics like Precision and Recall should be used to under-
stand the effect of different hyperparameters and model choices. Table 2 also includes
the details of “TestOOV ”, which is the portion of Test not found in TrainRand+Freq (i.e.,
16

out-of-vocabulary). The size of TestOOV is about 23% of Test.
Our baseline model was to label the names in Test by using look-up from TrainRand+Freq
for INV names, and assigning the majority class Other to OOV names. As a result,
none of the Arabic-origin names in TestOOV would be identified. As we show below, this
“majority baseline model” performed rather strongly in terms of evaluation metrics that
ignore the imbalanced nature of the data since the majority class is prevalent.
We built our models using the SRILM Toolkit, a publicly available collection of C++
libraries and programs providing the infrastructure for building LMs (Stolcke 2002).
Then, we focused on determining the optimal number of characters, or n-gram window,
the models should use when making predictions. We began by evaluating the results of
a character window of one and systematically moved up to an n-gram window of 10.22
We also considered a number of discounting techniques provided by the SRILM toolkit
for modeling probability.
We evaluated our models and the various hyperparameter settings using a number of
standard metrics (Power 2011). The first metric was precision, or the ratio of correct
class predictions to the total number of class predictions. We report on Arabic precision,
Other precision, and average precision of the two classes. The second was recall, or the
ratio of correct class predictions to the total number of observed class names. We report
on Arabic recall, Other recall, and average recall of the two classes. Third was F-score,
or the harmonic mean of the precision and recall. We report on Arabic F-score, Other
F-score, and average F-score of the two classes. Finally, we also used accuracy, or the
ratio of correctly predicted classifications to the total number of observed classifications.
3.2.5. Results and final model
Table 3 presents the results of the majority baseline model and the best LM over the test
set and its TestOOV subset. We see that on the full test set, the accuracy and average
F-score of the majority baseline model and our best LM are almost the same. Average
precision is higher for the baseline, while average recall is higher for the LM. These first
22When names had fewer characters than the n-gram window, the model would consider all theircharacters.
17

Test TestOOV
Baseline Best LM Baseline Best LM
Accuracy 97% 97% 89% 86%Average precision 98% 93% 45% 70%Average recall 93% 97% 50% 82%Average F-score 95% 95% 47% 73%
Arabic precision 100% 87% 0% 42%Arabic recall 86% 97% 0% 76%Arabic F-score 92% 91% 0% 54%
Other precision 97% 99% 89% 97%Other recall 100% 97% 100% 87%Other F-score 98% 98% 94% 92%
Table 3: The single-name classification evaluation results. The table presents the resultsof two systems on two datasets. The two systems are the majority baseline and the bestLM determined empirically. The two datasets are the full Test and the out-of-vocabularyportion of the Test. In addition to overall system results in terms of accuracy, and averageprecision, recall and F-score, the table includes the precision, recall and F-score for theArabic and Other classes. The superior result of each comparison is in boldface.
results appear to be a simple trade-off of average precision and average recall. However,
when we examine the LM’s Arabic metrics, we see a major increase in Arabic recall
from 86% to 97% paired with a drop comparable in magnitude for Arabic Precision.
The effect on the majority class Other is less intense. These latter results indicate that
the LM model is successfully identifying the majority of observed Arabic-origin names
at the cost of misclassifying some non-Arabic names as Arabic. The LM results are
significantly better than the majority baseline model results when evaluating with the
TestOOV dataset. The baseline’s Arabic metrics are all zero, and in seven out of the ten
metrics we use, the LM is superior to the baseline.
Based on the results, we selected the best performing n-gram window specification—a
tri-gram model with Witten-Bell discounting—and trained a final LM on all the anno-
tated data (i.e., a merge of TrainRand+Freq and the full test set). We then used this
model to classify the remaining single names as originating from Arabic or not. Of the
1,381,923 (non-unique) single names in our data, we labeled 214,464 (15.5%) as Arabic
and 1,167,459 as Other.
18

3.3. Part 2: Full name classification
Recall that unique single names combine to form full names, both in our data and in
many other contexts. In our approach’s second part, we leverage this fact by using the
relatively small number of manually coded single names, and the automatically labeled
remaining single names, to gain insight into numerous full names. Not only was is strategy
efficient, but it also recognizes the social reality that individuals’ preferences, attitudes,
and identities—whether signaled in names or not—often comprise a mix of cultural el-
ements and practices. In our case, this mixing manifests as full names that might have
some single names representing non-religious Indonesian heritage and other single names
reflecting an Islamic faith.
To use the single names’ labels to classify each full name in the voter registry, we used
a majority rule. For example, if a full name with three single names had two single names
of Arabic origin, the full name was classified as Arabic. In the case of a tie, we summed
the perplexity scores across the Arabic single names and the perplexity scores across the
Other single names, and then assigned the class with the lower total score. For instance,
the name “Eni Sukarni bin Muhamad”, which has two non-Arabic names, (i.e., “Eni” and
“Sukarni”) and two Arabic-origin names (i.e., “bin” and “Muhamad”) would be classified
as Other because the model has learned to judge the two non-Arabic names as more
strongly not Arabic than the Arabic names as being Arabic. Therefore, this technique
selected the classification that had the better overall predictions. We labeled a total
of 47,988 unique full names as Arabic (8.4% of the registry’s unique full names) and
465,539 unique full names as Other. Future research building on our approach could
use each full name’s mix of single name types to assign a continuous value, rather than
a categorical one.
3.4. Part 3: Quranic name similarity
The final part of our approach measures how evocative full names are of proper names
in the Quran. We interpret this “Quranic-ness”, or the extent to which individual full
19

names contain Arabic and Quranic single names, as a signal of religious intensity. After
all, the full names with Quranic-like names comprise terms not only derived from Arabic,
the language tightly coupled with Islam, but also taken from Islam’s core spiritual text.
To calculate full names’ Quranic-ness, we first computed the similarity between each
Arabic single name in each full name and each of the 98 person names mentioned in
the Quran23 using the Freeman distance (Freeman, Condon and Ackerman 2006). Com-
paring names written in the Roman alphabet to names originally written in Arabic is
difficult because of varying transliteration conventions, resulting in a range of character
representations for each phoneme. This problem is compounded by the fact that Arabic
script typically does not represent short vowels. The Freeman distance offers a solution
to the challenge of matching Romanized and Arabic names primarily by allowing an ex-
panded number of cross-language matches for many characters (Freeman, Condon and
Ackerman 2006). Doing so has been found to result in better matching performance
across several commonly used string-matching techniques (Freeman, Condon and Ack-
erman 2006; Habash 2008). Freeman scores range from zero to one, with one being a
perfect match.
After calculating the distance between each Arabic single name and the Quran’s
names, we averaged the highest distance values for each full name’s terms over the total
number of single names in the full name. For example, if a full name had three Arabic
terms with highest distance values of 0.6, 0.7, and 0.8, the full name’s overall similarity to
Quranic names would be 0.7. Non-Arabic single names in a full name with Arabic single
names contributed values of zero to the average; full names with no Arabic single names
were scored as having zero similarity to Quranic names. The end result is a continuous
value of full names’ Quranic-ness, which we understand as a signal of religious intensity—
and which can be measured across Indramayu at different levels of geographic resolution.
23The Quran’s proper names can be identified using the proper name part of speech tag on the Qurancorpus (Dukes, Atwell and Habash 2013), accessible at http://corpus.quran.com/
20

3.5. Spatial variation in religiosity in Indramayu
We now present two name-derived religiosity variables: for a given area, (1) the proportion
of registered voters with a full name labeled as Arabic and (2) the mean Quranic score
of all full names. We show these measures’ spatial distribution across Indramayu at each
of the regency’s four sub-regency administrative levels. At the RT level, the smallest
administrative unit, our two name-derived variables correlate at r = 0.85. The correlation
rises above 0.90 at the village and district levels.
Beginning with two highest sub-regency administrative levels, Figure 1 shows the
variation across districts (left, n = 30) and villages (right, n = 298) in the proportion of
all resident voters with an Arabic full name. The values of this variable ranges from zero
to 25%. Figure 2 shows the values of the mean Quranic similarity variable, which range
from zero to 20%, for the same areas.
While we also create values for these measures at the RW level (the administrative
level immediately below the village, n = 2,380) and the RT level (the administrative
level below the RW, n = 10,192), we cannot present them as maps because shapefiles of
these administrative units are not available. Instead, Figure 3 presents frequency plots
showing the proportion of individuals with Arabic full names in the villages (top left),
RWs (top right), and RTs (bottom left) of Indramayu regency. Figure 4 shows the same
frequency plots for areas’ mean Quranic similarity scores. As is evident, the incidence of
individuals with an Arabic name is highly concentrated within each administrative unit,
suggesting that religious Muslims, and the more pious among them, are highly spatially
concentrated in this regency. In addition, both sets of plots show that the frequency of
Arabic and Quranic naming practices exhibit substantial skew at the individual level,
and that this skew attenuates at higher levels of aggregation.
21

Districts Villages
0.00
0.05
0.10
0.15
0.20
0.25Share of Arabic names
Figure 1: Spatial variation in Arabic full names at the levels of villages and districts
Districts Villages
0.00
0.05
0.10
0.15
0.20Mean Quranic score
Figure 2: Spatial variation in full names’ Quranic similarity across villages and districts
22

0
5
10
0.1 0.2Proportion in village with an Arabic name
Fre
quen
cy
0.0
2.5
5.0
7.5
0.00 0.25 0.50 0.75 1.00Proportion in RW with an Arabic name
Fre
quen
cy0
5
10
0.00 0.25 0.50 0.75 1.00Proportion in RT with an Arabic name
Fre
quen
cy
0
250000
500000
750000
1000000
1250000
No Yes UnclassifiedIndividual has an Arabic name
Fre
quen
cy
Figure 3: Low-level variation in Arabic naming
0
5
10
15
0.05 0.10 0.15 0.20Mean Quranic similarity in the village
Fre
quen
cy
0.0
2.5
5.0
7.5
10.0
0.00 0.25 0.50 0.75 1.00Mean Quranic similarity in the RW
Fre
quen
cy
0
3
6
9
0.00 0.25 0.50 0.75 1.00Mean Quranic similarity in the RT
Fre
quen
cy
0
10
20
30
0.00 0.25 0.50 0.75 1.00Indidividual−level Quranic similarity
Fre
quen
cy
Figure 4: Low-level variation in Quranic naming
23

4. Validation of name-derived religiosity variables
In this final section, we present tests of our two names-based religiosity variables against
two criterion variables of spatial variation in religiosity. A criterion validity test evaluates
the extent to which our names-based operationalization of religiosity is related to an
outcome to which it should be theoretically correlated (Pedhazur and Schmelkin 2013).24
In brief, we tested the validity of each names-derived variables by running simple linear
regressions on two benchmark measures of religiosity. We also checked the robustness of
these results using a number of additional analyses.
Our first criterion variable is the proportion of registered voters who were registered to
perform the Hajj between the years 2011 and 2017,25 measured at each of the regency’s
four administrative levels (i.e., RT, RW, village, and district). Due to the demand of
Muslims around the world to perform the Hajj, each country receives an annual quota of
visas. The limited number of annual visas for a country the size of Indonesia means that
people are required to register far in advance.26 The Indonesian government allocates a
portion of the total quota to each regency; as a result, the waiting lists are administered
at this level. We made a request to the Indramayu office of the Ministry of Religious
Affairs for the administrative data on the regency’s registrants to perform the Hajj. This
data set included their name and approximate address. We placed each registrant in all
four administrative levels. We divided the total number of Hajj registrants at each level
by the corresponding number of registered voters.
Our second criterion variable is the proportion of total students enrolled in an Is-
lamic school. For the denominator, we acquired from the regency the total public and
private enrollment for all primary and secondary schools in each village.27 This data set
24Specifically, our tests are assessments of concurrent validity because the criterion variables aremeasured at the time of our names-based variables’ measurement.
25Since we were able to obtain multiple years of Hajj registration data, we collapsed this variable intoa seven-year average for each administrative level.
26Saudi Arabia typically grants Indonesia approximately 220,000 annual visas. According to theIndonesian government, the average period between registering and being granted a visa is now 20years. See, for instance: https://setkab.go.id/en/indonesian-hajj-waiting-time-not-the-longest-in-asean-indonesian-hajj-authorities/
27We located these data at the BPS. Unfortunately, the data did not include the address of the schools,and, therefore, we are unable to measure this variable at the RT or RW levels.
24

also provided the number of students attending Islamic schools, which we used as the
numerator.
Each criterion variable has strengths and limitations, which, in general, reflects the
difficulties in measuring religiosity both across individuals and space. On the one hand,
the Hajj registration variable is a direct measure of a decision by individuals to pursue a
significant and religious act, the Hajj. Yet, on the other hand, we lack the individual-level
data to control for the available means of each individual to perform this pilgrimage (e.g.,
disposable income, time). We would expect that in a developing country, especially in a
relatively impoverished regency like Indramayu, the costs associated with the Hajj would
be prohibitive. Indeed, at the RT level, the average proportion of registered voters on
the Hajj registration list between 2011 and 2017 was only 2%; furthermore, 57% of the
RTs and nearly 40% of the RWs have zero Hajj registrants. This registry also omits all
people who either have already performed the Hajj or those who intend to but have not
yet registered.
Our second criterion variable has similar trade-offs. The choice of parents to send
their children to an Islamic school is a strong signal of piety. This is especially true in
an educational environment in which there are many private, non-Islamic alternatives to
public schools. Yet, we are also assuming the composition of schools in a village reflects
the decision of parents in the village and are largely serving the children in those villages.
We cannot test for this assumption. More importantly, most villages do not contain even
one Islamic school. Hence, this criterion variable, like the Hajj registrant measure, is
over-dispersed.
Despite their limitations, these criterion variables in combination form suitable bench-
marks to test the validity of our name-based variables. In particular, they capture distinct
aspects of individuals’ religious behavior independently of our research activities. In ad-
dition, they cover the same geographic and temporal range as our name-based variables,
and can be aggregated across administrative levels. Indeed, the geographic scope of these
direct behavioral measures would have been prohibitively expensive to collect with rep-
resentative surveys of religious attitudes at each of the administrative levels. As for the
25

Administrative unit
Statistic RT RW Village DistrictName-derived variables
Arabic name shareMean 0.09 0.09 0.09 0.08
Std. Dev. 0.15 0.13 0.04 0.02
Average Quranic similarityMean 0.08 0.08 0.07 0.07
Std. Dev. 0.10 0.08 0.03 0.02
Count of registered votersMean 128.92 515.64 4, 416.41 40, 437.72
Std. Dev. 264.23 637.06 1, 972.28 19, 746.66
Criterion variables
Hajj registration shareMean 0.02 0.01 0.02 0.001
Std. Dev. 0.09 0.04 0.01 0.001
Islamic school shareMean 0.03 0.04
Std. Dev. 0.10 0.05
Table 4: Descriptive statistics of the name-derived and criterion variables of religiosityby administrative unit.
problem of over-dispersion present in both proxies, we include a number of tests that
model the structure of these variables. Table 4 provides basic descriptive statistics for
both names-based variables and each criterion variables at all administrative levels for
which the data are available.
4.1. Validation results
We begin by reporting the estimates from simple linear regressions of our names-based
measures and the two criterion variables at the three lowest administrative levels (i.e.,
village, RW, and RT).28 The estimates for each variable at the RT and RW administrative
level, respectively, are reported in Table 5, which presents the unstandardized coefficient,
standard error in parenthesis, and the standardized coefficient in brackets. Column 1 of
Panel A shows the OLS estimate for Arabic name share followed directly below it by the
28Given the paucity of districts in Indramayu (n = 30), we did not conduct validity tests at thisadministrative level. However, we do use district-level fixed effects in a robustness check, as explainedbelow.
26

estimate for Quranic similarity score. While both are positive and statistically significant
at the 95% level, the standardized coefficient indicates that the effect size is small. This
is in part explained by the fact more than half of RTs have zero Hajj registrants. We
show the importance of this over-dispersion in column 2 of Panel A (RT subset), where
we run the same model on the sub-sample of RTs in which there was at least one Hajj
registrant. The increase in the unstandardized and standardized estimates demonstrate
that the fit improves when the zeroes are removed. In the robustness analysis, discussed
below, we directly model this over-dispersion in the data-generation process.
Panel B shows the estimates of the same models at the RW level. While the co-
efficients are nearly identical to those at the RT level, these models are less precisely
estimated and the standardized coefficients are slightly smaller. As with the RT-level
data, the slightly aggregated data suffer from a high proportion of zero values for Hajj
registrants. Therefore, in the second column we again show the estimates of this model
on the subset of RWs that have at least one Hajj registrant. As with the RT-level models,
both the unstandardized and standardized coefficients increase substantially when run on
this subset of data.
We report the village level validity tests in Table 6. Column 1 shows the same tests
with Hajj registrants.29 Both Arabic name share and Quranic similarity are positive and
significant at the 99% level. The standardized coefficients also show that the effect size are
larger. Column 2 reports the estimates with the second criterion variable, the proportion
of students enrolled in Islamic schools, which is only available at the village level. The
coefficients are also positive and significant at the 0.99% level for Arabic name share and
at the 95% level for Quranic similarity, respectively. The standardized coefficients for
each also indicate a moderate effect size.
Complete results for each model from Table 5 and Table 6 are shown in Appendix A
(unstandardized) and Appendix B (standardized), respectively.
29Since no villages have zero Hajj registrants, we do not perform the same separate analysis on thenon-zero subset of the data (as seen in Table 5).
27

Panel A: RT-level validity test
Hajj registration Hajj registration – subset(1) (2)
Arabic name share 0.024∗∗ (0.012) [0.043] 0.046∗∗ (0.020) [0.080]Quranic similarity 0.037∗∗ (0.017) [0.042] 0.040∗ (0.023) [0.045]
Mean Hajj registration 0.023 0.023N 10,681 4,274
Panel B: RW-level validity test
Hajj registration Hajj registration – subset(1) (2)
Arabic name share 0.026 (0.028) [0.039] 0.089∗ (0.046) [0.133]Quranic similarity 0.030 (0.045) [0.028] 0.105∗ (0.056) [0.097]Mean Hajj registration 0.014 0.022N 2,456 1,485
Table 5: Validation analysis results at the RT and RW levels. Simple linearregression estimates presented as unstandardized coefficients, (robust standarderrors), and standardized coefficients. Significance levels are constant acrossall unstandardized and standardized coefficients. RT and RW subsets have allareas with zero Hajj registrants removed from the sample. ∗p < .1; ∗∗p < .05;∗∗∗p < .01.
Village-level Validity Tests
Hajj registration sh. Islamic school enrollment Sh.(1) (2)
Arabic name share 0.062∗∗∗ (0.013) [0.298] 0.600∗∗∗ (0.224) [0.207]Quranic similarity 0.064∗∗∗ (0.016) [0.243] 0.556∗∗ (0.264) [0.149]
Mean dependent variable 0.017 0.026N 292 275
Table 6: Validation analysis results at the village level. Simple linear regression es-timates presented as unstandardized coefficients, (robust standard errors), and stan-dardized coefficients. Significance levels are constant across all unstandardized andstandardized coefficients. ∗p < .1; ∗∗p < .05; ∗∗∗p < .01.
28

4.1.1. Robustness
The two criterion variable tests provide support for the validity of our names-based reli-
giosity measures. To increase our confidence further, we conducted a number of additional
tests of the robustness of these relationships. First, we addressed the concern with excess
zeroes in both criterion variables by fitting Tobit regressions for each model presented in
the main results.30 The estimates for the Tobit models for each names-based variable at
the RT, RW and village levels are reported in Appendix C. In each model, the coefficient
increased and the standard error declined compared to the corresponding OLS models.
(The latter’s results are presented in Table 5, Table 6, and Appendix A and B.)
Second, we addressed concerns due to the lack of important covariates, such as income
per capita, by estimating fixed-effects models at each of the three lowest administrative
that include a dummy variable for the next highest administrative level (e.g., RW dum-
mies for the RT models, district dummies for the village models). If unobserved factors,
such as income per capita, are heterogeneously distributed across space, then fixed ef-
fects should help control for this unmeasured heterogeneity. The estimates for these
fixed-effects regressions are reported in Appendix D. The inclusion of fixed effects, with
a few exceptions, are largely consistent with our OLS estimates. We find that including
a full set of RW fixed effects has little consequence on magnitude or significance of the
RT-level estimate for Arabic name share. However, the Quranic similarity variable is no
longer a significant predictor. On the other hand, each of the RW-level models of Hajj
registration share become significant when village fixed effects are included. The village-
level validation tests with district fixed effects produce broadly similar results to both
the OLS and Tobit models for both Hajj registration share and Islamic school enrollment
share, respectively.
30As explained above, each criterion variable is continuous and highly rightward skewed due to cen-soring at zero. This can make the truncated portion of OLS estimates biased. The Tobit (or censoredregression) model is appropriate when a continuous dependent variable is bounded at one of the extremes(in this case zero), significant clustering around that extreme value, and is highly rightward skewed orunbounded at the other extreme (Wooldridge 2010).
29
5. Conclusion
In this paper, we develop a methodology for measuring the incidence of religiosity across
space. It specifically helps address three challenges to measuring religiosity: how to
operationalize a complex and subjective attitude, belief, and outlook such as religion;
how to capture this operationalization of a “sensitive and intricate domain” (Finke and
Bader 2017: 3) discreetly; and how to measure it across a large population and area.
While directly surveying subjects on their religious attitudes and beliefs has many well-
known strengths and limitations (Finke and Bader 2017), surveys can be both obtrusive
and expensive to scale across space. Thus, we see approaches like ours as an important
complement to survey-based measures and methods. For one, it exploits the increasing
availability of administrative data—usually compiled in a relatively unobtrusive way on a
massive scale by comparatively well-resourced government entities—to provide a consis-
tent measure of religiosity across space at highly disaggregated levels. Second, our method
also offers an approach that leverages a simple yet powerful insight: administrative data
can be a source of individuals’ revealed preferences.
In our case, the linguistic origin of individuals’ given names can reveal their religios-
ity. Given names of Arabic origin in Indonesia, a majority Muslim, non-Arabic speaking
country, are likely understood locally to signal sincere religious attitudes and beliefs.
Moreover, an Arabic-derived name that also evokes the Quran is likely to be seen as
conveying stronger piety.31 Our criterion validity tests, in which we show that each of
the name-derived measures of religiosity is correlated with two concurrent measures of
geographic variation in religiosity across Indramayu, provides confidence in our method-
ology.
In addition to demonstrating the usefulness of administrative data for measuring
religiosity, our method helps introduce probabilistic language models to social scientists.
Language models, common in computational linguistics, are relatively underutilized by
31The use of the Quran as a “dictionary” of particularly significant names underscores how culturalartifacts like scriptures and canonical myths and sagas can be important tools to uncover identity-relatedsignals in administrative data.
30

social scientists, yet offer specific advantages for the automated classification of text.
For example, they can make great use of information at the level of text below the
primary level of interest, such as characters when words are of interest or words when
sentences are of interest. This feature can be crucial when classifying text that contains
significant variation around the base structures, as is often the case with localized naming
conventions and dialects (Salameh, Bouamor and Habash 2018). Thus, we see language
models as an important addition to the computational approaches available for estimating
variation in difficult-to-measure quantities (e.g., Mitts 2019).
Language models, in our view, also have the potential to contribute to social scientific
research beyond classification. We are especially optimistic that their generative nature
can be of great use. Language models predict a piece of language, such as a word or
sentence, based on the preceding linguistic sequence. This generated language could be
used, for example, in the production of a kind of counterfactual example or for insights
into texts’ meaning and polysemy, such as examining which set of words have a similar
(or dissimilar) probability in appearing at the end of a sentence about a particular topic.
Similar to these examples, language models could also be used in computational abductive
analysis by “defamiliarizing” text data, or rendering the text in a new, perhaps surprising,
light (Karell and Freedman 2019). For instance, a language model can be used to estimate
what a piece of text could have contained, prompting the researcher to then consider why
the alternative did not appear as part of a theory-building process.
In sum, our approach—understanding and tabulating names in administrative databases
with probabilistic language models—provides us with an inexpensive and unobtrusive way
to measure religiosity in a large population across a large geographic area, and at differ-
ent levels of spatial aggregation. While administrative data can be costly to annotate, it
scales extremely inexpensively; only a few thousand annotations can be used to classify
datasets of 100,000, 1,000,000, or 10,000,000 observations. Our method thus not only ap-
plies to the empirical study of religiosity, but also to any setting in which researchers need
to measure attitudes and beliefs but surveys are prohibitively expensive and high-quality
government provisioned data are scarce.
31

References
Abramitzky, Ran, Leah Boustan and Katherine Eriksson. 2020. “Do Immigrants As-
similate More Slowly today than in the past?” American Economic Review: Insights
2(1):125–141.
Banerjee, Abhijit, Rema Hanna, Jordan Kyle, Benjamin A Olken and Sudarno Sumarto.
2018. “Tangible information and citizen empowerment: Identification cards and food
subsidy programs in Indonesia.” Journal of Political Economy 126(2):451–491.
Bazzi, Samuel, Gabriel Koehler-Derrik and Benjamin Marx. 2020. “The Institutional
Foundations of Religious Politics: Evidence from Indonesia.” The Quarterly Journal
of Economics 135(2):845–911.
Bengtson, Vern L, Susan Harris and Norella M Putney. 2017. Families and faith: How
religion is passed down across generations. Oxford University Press.
Bertrand, Marianne and Sendhil Mullainathan. 2004. “Are Emily and Greg more em-
ployable than Lakisha and Jamal? A field experiment on labor market discrimination.”
American economic review 94(4):991–1013.
Bisin, Alberto, Giorgio Topa and Thierry Verdier. 2004. “Religious intermarriage and
socialization in the United States.” Journal of political Economy 112(3):615–664.
Brants, Thorsten, Ashok C Popat, Peng Xu, Franz J Och and Jeffrey Dean. 2007. “Large
Language Models in Machine Translation.” Proceedings of the 2007 Joint Conference
on Empirical Methods in Natural Language Processing and Computational Natural Lan-
guage Learning pp. 858–867.
Brenner, Philip S. 2014. “Testing the veracity of self-reported religious practice in the
Muslim world.” Social Forces 92(3):1009–1037.
Chen, Yining, Jiali You, Min Chu, Yong Zhao and Jinlin Wang. 2006. Identifying Lan-
guage Origin of Person Names With N-Grams of Different Units. In 2006 IEEE In-
32

ternational Conference on Acoustics Speech and Signal Processing Proceedings. Vol. 1
pp. I–I.
De Juan, Alexander, Jan H Pierskalla and Johannes Vullers. 2015. “The pacifying effects
of local religious institutions: An analysis of communal violence in Indonesia.” Political
Research Quarterly 68(2):211–224.
Dukes, Kais, Eric Atwell and Nizar Habash. 2013. “Supervised collaboration for syntactic
annotation of Quranic Arabic.” Language resources and evaluation 47(1):33–62.
Enos, Ryan D. 2016. “What the demolition of public housing teaches us about the
impact of racial threat on political behavior.” American Journal of Political Science
60(1):123–142.
Finke, Roger and Christopher D Bader. 2017. Faithful measures: New methods in the
measurement of religion. NYU Press.
Fowler, James H and Christopher T Dawes. 2013. “In defense of genopolitics.” American
Political Science Review 107(2):362–374.
Freeman, Andrew T, Sherri L Condon and Christoper M Ackerman. 2006. “Cross Lin-
guistic Name Matching in English and Arabic: A “One to Many Mapping” Extension
of the Levenshtein Edit Distance Algorithm.” Proceedings of the Human Language
Technology Conference of the North American Chapter of the ACL pp. 471–478.
Fryer, Roland G and Steven D Levitt. 2004. “The causes and consequences of distinctively
black names.” The Quarterly Journal of Economics 119(3):767–805.
Fu, Yu, Feiyu Xu and Hans Uszkoreit. 2010. Determining the Origin and Structure of
Person Names. In Proceedings of the Seventh International Conference on Language
Resources and Evaluation (LREC’10). Valletta, Malta: European Language Resources
Association (ELRA).
URL: http://www.lrec-conf.org/proceedings/lrec2010/pdf/763Paper.pdf
33

Gamallo, Pablo, Jose Ramom Pichel and Inaki Alegria. 2017. A Perplexity-Based Method
for Similar Languages Discrimination. In Proceedings of the Fourth Workshop on NLP
for Similar Languages, Varieties and Dialects (VarDial). Valencia, Spain: Association
for Computational Linguistics pp. 109–114.
URL: https://www.aclweb.org/anthology/W17-1213
Gerhards, Jurgen and Silke Hans. 2009. “From Hasan to Herbert: Name-giving patterns of
immigrant parents between acculturation and ethnic maintenance.” American Journal
of Sociology 114(4):1102–1128.
Goldberg, Amir, Sameer Srivastava, V. Govind Manian, William Monroe and Christopher
Potts. 2016. “Fitting In or Standing Out? The Tradeoffs of Structural and Cultural
Embeddedness.” American Sociological Review 81(6):1190–1222.
Grofman, Bernard and Jennifer R Garcia. 2014. “Using Spanish Surname to Estimate
Hispanic Voting Population in Voting Rights Litigation: A Model of Context Effects
Using Bayes’ Theorem.” Election Law Journal 13(3):375–393.
Habash, Nizar. 2008. “Four Techniques for Online Handling of Out-of-Vocabulary Words
in Arabic-English Statistical Machine Translation.” Proceedings of ACL-08: HLT,
Short Papers (Companion Volume) pp. 57–60.
Habash, Nizar, Mona Diab and Owen Rambow. 2012. “Conventional Orthography for
Dialectal Arabic.” Proceedings of the Eighth International Conference on Language
Resources and Evaluation (LREC-2012) Istanbul:711–718.
Harris, J Andrew. 2015. “What’s in a name? A method for extracting information about
ethnicity from names.” Political Analysis 23(2):212–224.
Hibbing, John R, Kevin B Smith and John R Alford. 2013. Predisposed: Liberals, con-
servatives, and the biology of political differences. Routledge.
Hofstra, Bas and Niek C de Schipper. 2018. “Predicting Ethnicity With Frist Names in
Online Social Media Networks.” Big Data & Society X(X):1–14.
34

Imai, Kosuke and Kabir Khanna. 2016. “Improving ecological inference by predicting
individual ethnicity from voter registration records.” Political Analysis 24(2):263–272.
Jauhiainen, Tommi, Krister Linden and Heidi Jauhiainen. 2017. Evaluation of language
identification methods using 285 languages. In Proceedings of the 21st Nordic Confer-
ence on Computational Linguistics. Gothenburg, Sweden: Association for Computa-
tional Linguistics pp. 183–191.
URL: https://www.aclweb.org/anthology/W17-0221
Jauhiainen, Tommi, Marco Lui, Marcos Zampieri, Timothy Baldwin and Krister Linden.
2019. “Automatic Language Identification in Texts: A Survey.” J. Artif. Int. Res.
65(1):675–682.
Jurafsky, Daniel and James Martin. 2019. Speech and Language Processing. Draft
Manuscript.
Karell, Daniel and Michael Freedman. 2019. American Sociological Review 84(4):726–753.
Kuipers, Joel C and Askuri. 2017. “Islamization and Identity in Indonesia: The Case of
Arabic Names in Java.” Indonesia (103):25–49.
Lieberson, Stanley. 2000. A matter of taste: How names, fashions, and culture change.
Yale University Press.
Lieberson, Stanley and Eleanor O Bell. 1992. “Children’s first names: An empirical study
of social taste.” American Journal of Sociology 98(3):511–554.
Lieberson, Stanley and Kelly S Mikelson. 1995. “Distinctive African American names: An
experimental, historical, and linguistic analysis of innovation.” American Sociological
Review pp. 928–946.
Llewellyn, Aisyah. 2018. “What’s in a Name in Indonesia?” Asia Times .
URL: https://asiatimes.com/2018/02/whats-name-indonesia/
35

Martinez-Bravo, Monica, Priya Mukherjee and Andreas Stegmann. 2017. “The non-
democratic roots of elite capture: Evidence from Soeharto mayors in Indonesia.” Econo-
metrica 85(6):1991–2010.
Menchik, Jeremy. 2016. Islam and democracy in Indonesia: Tolerance without liberalism.
Cambridge University Press.
Mikolov, Tomas, Martin Karafiat, Lukas Burget, Jan Cernocky and Sanjeev Khudanpur.
2010. “Recurrent Neural Network Based Language Model.” INTERSPEECH 2010 .
Mitts, Tamar. 2019. “From Isolation to Radicalization: Anti-Muslim Hostility and Sup-
port for ISIS in the West.” American Political Science Review 113(1):173–194.
Niemi, Richard G and M Kent Jennings. 1991. “Issues and inheritance in the formation
of party identification.” American Journal of Political Science pp. 970–988.
OECD. 2019. Social Protection System Review of Indonesia.
URL: https://www.oecd-ilibrary.org/content/publication/788e9d71-en
Olivetti, Claudia and M Daniele Paserman. 2015. “In the name of the son (and the daugh-
ter): Intergenerational mobility in the united states, 1850-1940.” American Economic
Review 105(8):2695–2724.
Olken, Benjamin A. 2010. “Direct democracy and local public goods: Evidence from a
field experiment in Indonesia.” American political science review 104(2):243–267.
Pedhazur, Elazar J and Liora Pedhazur Schmelkin. 2013. Measurement, design, and
analysis: An integrated approach. psychology press.
Pepinsky, Thomas B, R William Liddle and Saiful Mujani. 2018. Piety and Public Opin-
ion: Understanding Indonesian Islam. Oxford University Press.
Power, David M W. 2011. “Evaluation: From Precision, Recall, and F-Measure to ROC,
Informedness, Markedness & Correlation.” Journal of Machine Learning Technologies
2(1):37–63.
36

Ramisch, Carlos. 2008. N-gram models for language detection. Technical report.
Rubinstein, Yona and Dror Brenner. 2014. “Pride and prejudice: Using ethnic-sounding
names and inter-ethnic marriages to identify labour market discrimination.” Review of
Economic Studies 81(1):389–425.
Salameh, Mohammad, Houda Bouamor and Nizar Habash. 2018. “Fine-Grained Arabic
Dialect Identification.” Proceedings of the 27th International Conference on Computa-
tional Linguistics Sante Fe:1332–1344.
Salganik, Matthew. 2018. Bit by Bit: Social Research in the Digital Age. Princeton
University Press.
Stolcke, Andreas. 2002. “SRILM – An Extensible Language Modeling Toolkit.” Proceed-
ings of the International Conference on Spoken Language Processing pp. 901–904.
Sue, Christina A and Edward E Telles. 2007. “Assimilation and gender in naming.”
American Journal of Sociology 112(5):1383–1415.
Tipple, Graham and Suzanne Speak. 2009. The hidden millions: Homelessness in devel-
oping countries. Routledge.
Uhlenbeck, Eugenius Marius. 1969. “Systematic features of Javanese personal names.”
Word 25(1-3):321–335.
Vatanen, Tommi, Jaakko J. Vayrynen and Sami Virpioja. 2010. Language Identification
of Short Text Segments with N-gram Models. In Proceedings of the Seventh Interna-
tional Conference on Language Resources and Evaluation (LREC’10). Valletta, Malta:
European Language Resources Association (ELRA).
URL: http://www.lrec-conf.org/proceedings/lrec2010/pdf/279Paper.pdf
Webb, Eugene J, Donald T Campbell, Richard D Schwartz and Lee Sechrest. 2000.
“Unobtrusive measures (Rev. ed.).”.
Wooldridge, Jeffrey M. 2010. Econometric analysis of cross section and panel data. MIT
press.
37

Zaidan, Omar F. and Chris Callison-Burch. 2014. “Arabic Dialect Identification.” Com-
putational Linguistics 40(1):171–202.
Zaller, John. 1992. The nature and origins of mass opinion. Cambridge university press.
Zelinsky, Wilbur. 1970. “Cultural variation in personal name patterns in the Eastern
United States.” Annals of the Association of American Geographers 60(4):743–769.
38

Online Appendices
Measuring Local-Level Religiosity Using
Administrative Data and Language Model
Classification
• Appendix A: Validity Tests: OLS Unstandardized Estimates
• Appendix B: Validity Tests: OLS Standardized Estimates
• Appendix C: Robustness Validity Tests: Tobit Estimates
• Appendix D: Robustness Validity Tests: Fixed-Effects Estimates

A. OLS Validity Tests, unstandardized estimates
Table A.1: RT-level validation
Hajj registration shareRT RT RT subset RT subset
(1) (2) (3) (4)
Arabic name share 0.024∗∗ 0.046∗∗
(0.012) (0.020)Quranic similarity 0.037∗∗ 0.040∗
(0.017) (0.023)Constant 0.016∗∗∗ 0.015∗∗∗ 0.019∗∗∗ 0.020∗∗∗
(0.001) (0.001) (0.002) (0.002)
Mean Hajj registration 0.023 0.023 0.023 0.023N 10,681 10,681 4,274 4,274Adjusted R2 0.002 0.002 0.004 0.001
∗p < .1; ∗∗p < .05; ∗∗∗p < .01Robust standard errors in parentheses.
Table A.2: RW-level validation
Hajj registration shareRW RW RW subset RW subset
(1) (2) (3) (4)
Arabic name share 0.026 0.089∗
(0.028) (0.046)Quranic similarity 0.030 0.105∗
(0.045) (0.056)Constant 0.011∗∗∗ 0.012∗∗∗ 0.002 0.002
(0.003) (0.004) (0.004) (0.004)
Mean Hajj registration 0.014 0.014 0.022 0.022N 2,456 2,456 1,485 1,485Adjusted R2 0.001 0.0004 0.020 0.014
∗p < .1; ∗∗p < .05; ∗∗∗p < .01Robust standard errors in parentheses.
40

Table A.3: Village-level validation
Hajj registration share Islamic school enrollment share
(1) (2) (3) (4)
Arabic name share 0.062∗∗∗ 0.600∗∗∗
(0.013) (0.224)Quranic similarity 0.064∗∗∗ 0.556∗∗
(0.016) (0.264)Constant 0.012∗∗∗ 0.012∗∗∗ −0.027 −0.016
(0.001) (0.001) (0.017) (0.019)
Mean of outcome 0.017 0.017 0.026 0.026N 292 292 275 275Adjusted R2 0.085 0.055 0.044 0.021
∗p < .1; ∗∗p < .05; ∗∗∗p < .01Robust standard errors in parentheses.
41

B. OLS Validity Tests, standardized estimates
Table B.1: RT-level validation
Hajj registration shareRT RT RT subset RT subset
(1) (2) (3) (4)
Arabic name share 0.043∗∗ 0.080∗∗
(0.020) (0.035)Quranic similarity 0.042∗∗ 0.045∗
(0.019) (0.027)Constant 0.0005 0.0005 0.051∗∗∗ 0.051∗∗∗
(0.010) (0.010) (0.007) (0.007)
Mean Hajj registration 0 0 0.053 0.053N 10,681 10,681 4,274 4,274Adjusted R2 0.002 0.002 0.004 0.001
∗p < .1; ∗∗p < .05; ∗∗∗p < .01Robust standard errors in parentheses.
Table B.2: RW-level validation
Hajj registration shareRW RW RW subset RW subset
(1) (2) (3) (4)
Arabic name share 0.039 0.133∗
(0.042) (0.069)Quranic similarity 0.028 0.097∗
(0.041) (0.052)Constant 0.0004 0.0004 −0.045∗∗∗ −0.046∗∗∗
(0.020) (0.020) (0.010) (0.009)
Mean Hajj registration 0 0 0.102 0.102N 2,456 2,456 1,485 1,485Adjusted R2 0.001 0.0004 0.020 0.014
∗p < .1; ∗∗p < .05; ∗∗∗p < .01Robust standard errors in parentheses.
42

Table B.3: Village-level validation
Hajj registration share Islamic school enrollment share
(1) (2) (3) (4)
Arabic name share 0.298∗∗∗ 0.207∗∗∗
(0.061) (0.077)Quranic similarity 0.243∗∗∗ 0.149∗∗
(0.061) (0.071)Constant −0.001 −0.001 −0.018 −0.018
(0.056) (0.057) (0.056) (0.057)
Mean of outcome 0 0 0 0N 292 292 275 275Adjusted R2 0.085 0.055 0.044 0.021
∗p < .1; ∗∗p < .05; ∗∗∗p < .01
43

C. Tobit model estimates due to excess zeroes
Table C.1: RT-level validation with tobit models
Hajj registration share
(1) (2) (3) (4)
Arabic name share 0.199∗∗∗ 0.165∗∗∗
(0.049) (0.046)Quranic similarity 0.213∗∗∗ 0.176∗∗∗
(0.050) (0.046)Num. registered voters −0.008∗∗∗ −0.008∗∗∗
(0.001) (0.001)Constant −3.914∗∗∗ −3.915∗∗∗ −3.107∗∗∗ −3.109∗∗∗
(0.102) (0.102) (0.099) (0.099)
Mean Hajj registration 0 0 0 0N 10,681 10,681 10,681 10,681
∗p < .1; ∗∗p < .05; ∗∗∗p < .01
Table C.2: RW-level validation with tobit models
Hajj registration share
(1) (2) (3) (4)
Arabic name share 0.267∗ 0.134(0.154) (0.129)
Quranic similarity 0.230 0.122(0.157) (0.131)
Num. registered voters −0.007∗∗∗ −0.007∗∗∗
(0.001) (0.001)Constant −6.568∗∗∗ −6.575∗∗∗ −4.008∗∗∗ −4.008∗∗∗
(0.427) (0.428) (0.330) (0.330)
Mean Hajj registration 0 0 0 0N 2,456 2,456 2,456 2,456
∗p < .1; ∗∗p < .05; ∗∗∗p < .01
44

Table C.3: Village-level validation with tobit models
Hajj registration share Islamic school enrollment share
(1) (2) (3) (4)
Arabic name share 0.329∗∗∗
(0.081)Quranic similarity 0.272∗∗∗ 1.845∗∗∗ 1.845∗∗∗
(0.083) (0.614) (0.614)Constant −0.261∗∗∗ −0.261∗∗∗ −7.858∗∗∗ −7.858∗∗∗
(0.099) (0.099) (1.691) (1.691)
Mean of outcome 0 0 0 0N 292 292 275 275Log Likelihood −304.535 −307.526 −112.069 −112.069Wald Test (df = 1) 16.616∗∗∗ 10.831∗∗∗ 9.014∗∗∗ 9.014∗∗∗
∗p < .1; ∗∗p < .05; ∗∗∗p < .01
45

D. Fixed effects estimates
Table D.1: RT-level validation with RW-fixed effects
Hajj registration share
(1) (2) (3) (4)
Arabic name share 0.039∗ 0.039∗
(0.023) (0.022)Quranic similarity 0.036 0.036
(0.022) (0.022)
Mean Hajj registration 0 0 0 0Clustered SE (village) No Yes No YesN 10,681 10,681 10,681 10,681Adjusted R2 0.006 0.006 0.006 0.006
∗p < .1; ∗∗p < .05; ∗∗∗p < .01
Table D.2: RW-level validation with village-fixed effects
Hajj registration share
(1) (2) (3) (4)
Arabic name share 0.044∗∗ 0.044∗
(0.021) (0.025)Quranic similarity 0.039∗∗ 0.039
(0.020) (0.023)
Mean Hajj registration 0 0 0 0Clustered SE (district) No Yes No YesN 10,681 10,681 10,681 10,681Adjusted R2 0.027 0.027 0.027 0.027
∗p < .1; ∗∗p < .05; ∗∗∗p < .01
46

Table D.3: Village-level validation with district-fixed effects
Hajj registration share Islamic school enrollment share
(1) (2) (3) (4)
Arabic name share 0.239∗∗∗ 0.268∗∗∗
(0.069) (0.079)Quranic similarity 0.224∗∗ 0.231∗∗∗
(0.082) (0.081)
Mean of outcome 0 0 0 0N 292 292 275 275Adjusted R2 0.315 0.307 0.025 0.007
∗p < .1; ∗∗p < .05; ∗∗∗p < .01
47